Market Outlook
July 23, 2015
Dealer’s Diary
Domestic Indices
Chg (%)
(Pts)
(Close)
Indian markets are expected to open flat tracking SGX Nifty.
BSE Sensex
1.1
323
28,505
US markets fell on the trifecta of disappointing technology sector earnings, led by
Nifty
1.2
104
8,634
Apple. Tech heavy Nasdaq was hit the most, down 0.7%. Apple, Microsoft and
MID CAP
1.3
144
11,235
Yahoo all reported their quarterly earnings, which were disappointing.
SMALL CAP
0.9
99
11,676
BSE HC
0.9
158
17,002
European markets also fell, pulling back their recent gains. U.K. stocks dropped on
BSE PSU
1.3
98
7,806
Wednesday, tracking European and Asian equity markets, as investors fret over
BANKEX
1.4
311
21,789
corporate earnings and the continued weakness in commodity prices.
AUTO
1.1
208
19,076
Recouping previous 2 trading session losses, broader Indian indices witnessed
METAL
1.0
84
8,932
strong performance on Wednesday. Pull back across Banking and Oil & Gas stocks
OIL & GAS
2.4
235
10,194
led to such strong performance.
BSE IT
(0.4)
(45)
11,142
Global Indices
Chg (%)
(Pts)
(Close)
News & Result Analysis
Dow Jones
(0.4)
(68)
17,851
Result Review: Ceat
NASDAQ
(0.7)
(36)
5,172
Result Preview: Wipro, Lupin
Refer detailed news & result analysis on the following page
FTSE
(1.5)
(102)
6,667
Nikkei
(1.2)
(248)
20,594
Markets Today
Hang Sang
(1.0)
(254)
25,283
The trend deciding level for the day is 28,374 / 8,592 levels. If NIFTY trades above
Straits Times
(0.4)
(12)
3,359
this level during the first half-an-hour of trade then we may witness a further rally up
Shanghai Com
0.2
8
4,026
to 28,677 - 28,850 / 8,685 - 8,737 levels. However, if NIFTY trades below
28,374 / 8,592 levels for the first half-an-hour of trade then it may correct towards
28,202 - 27,899 / 8,540 - 8,447 levels.
Indian ADR
Chg (%)
(Pts)
(Close)
Indices
S2
S1
PIVOT
R1
R2
INFY
1.2
0.2
$17.3
SENSEX
27,899
28,202
28,374
28,677
28,850
WIT
2.4
0.3
$12.8
NIFTY
8,447
8,540
8,592
8,685
8,737
IBN
1.1
0.1
$10.2
HDB
1.0
0.6
$62.4
Net Inflows (July 21, 2015)
Advances / Declines
BSE
NSE
` cr
Purch
Sales
Net
MTD
YTD
Advances
1,774
1,027
FII
4,408
4,567
(159)
6,983
142,363
MFs
600
809
(209)
1,510
55,119
Declines
1,063
485
Unchanged
119
64
FII Derivatives (July 22, 2015)
` cr
Purch
Sales
Net
Open Interest
Volumes (` cr)
Index Futures
1,809
2,104
(295)
21,331
BSE
2,926
Stock Futures
2,870
3,133
(263)
51,200
NSE
15,945
Gainers / Losers
Gainer
Loser
Company
Price (`)
chg (%)
Company
Price (`)
chg (%)
SREINFRA
41
15.3
KAILASH
8
(20.0)
IBREALEST
56
8.2
TV18BRDCST
37
(12.3)
JUBILANT
213
7.9
TTKPRESTIG
4,070
(5.0)
IBULHSGFIN
716
7.8
RTNPOWER
7
(4.8)
ARVIND
308
6.2
SKFINDIA
1,386
(4.6)
Market Outlook
July 23, 2015
Result Review
Ceat (CMP: `779/ TP: -/Upside:)
Ceat Ltd 1QFY2016 results were way ahead of our as well as consensus estimates.
Revenues were flat at `1,466cr. Subdued OEM and export sales led to sluggish
topline during the quarter. (Revenues were in line with our estimates of `1,490 cr).
However, Ceat surprised positively on the operating front reporting a record
margin of
15.3%. The margins improved sharply
600 bp yoy and were
significantly ahead of our estimates of 11.1%. Softness in raw material prices (both
rubber and crude based) coupled with decrease in other expenditure (possibly
lower advertising and brand promotion expenses) boosted profitability. EBIDTA at
`224cr beat our estimates of `166cr. Given the strong operating performance,
Net Profit at `121cr more than doubled yoy and was way beyond our estimates of
`78cr. Currently, we have Neutral view on the stock but would review our
estimates post interaction with the management.
Y/E
Sales OPM
PAT
EPS ROE P/E P/BV EV/EBITDA EV/Sales
Mar
(` cr)
(%)
(` cr)
(`)
(%)
(x)
(x)
(x)
(x)
FY2016E
6,041
12.4
332
82.0
16.5
9.5
1.6
5.3
0.7
FY2017E
6,770
12.0
366
90.4
15.7
8.6
1.3
4.9
0.6
Result Preview
Wipro (CMP: `577/ TP: `753/Upside: 30.5%)
Wipro is expected to announce its 1QFY2016 results today. The company is
expected to post a 0.3% qoq dip in USD IT Services revenues to US$1,770mn V/s
US$1,775mn in 4QFY2015. The guidance for the 1QFY2016 was US$1,765-
1,793mn, a (0.5)-1% qoq growth. In rupee terms, the revenues are expected to
come in at `12,207cr V/s `12,142cr in 4QFY2015.
The EBDITA is expected to come in at 23.0% and EBIT is expected to be around
20.0%, both almost flat. Consequently the PAT is expected to come in at `2,261cr
V/s `2,272cr in 4QFY2015 a dip of 0.5% qoq.
The key factors to watch out 1) Outlook on Energy vertical, 2) Commentary on
large deal wins and 3) Outlook for 2QFY2016.We maintain our buy rating on the
stock with a target price of `753.
Y/E
Sales OPM
PAT
EPS ROE P/E P/BV EV/EBITDA EV/Sales
March
(` cr)
(%)
(` cr)
(`)
(%)
(x)
(x)
(x)
(x)
FY2016E
54,050
23.7
9,737
39.4
19.9
14.9
3.0
9.6
2.2
FY2017E
61,617
23.8
10,901
44.1
18.8
13.3
2.7
7.8
1.8
Market Outlook
July 23, 2015
Lupin (CMP: `1,824/ TP: /Upside: )
For 1QFY2016, we expect the company to post a 9.6% yoy growth on sales front
to end the period at `3,600cr. On the operating front, the gross margins are
expected to come in at 65.5% V/s 67.9% in corresponding period. EBITDA
margins are expected to come in at 27.0% V/s 32.2% in 1QFY2015. Consequently
the PAT is expected to come in at `749cr V/s `624cr expected a yoy growth of
20.0%. We maintain our neutral rating on the stock.
Y/E
Sales OPM
PAT
EPS ROE P/E P/BV EV/EBITDA EV/Sales
March
(` cr)
(%)
(` cr)
(`)
(%)
(x)
(x)
(x)
(x)
FY2016E
15,175
26.9
2,852
63.4
27.9
28.8
7.1
19.4
5.2
FY2017E
17,614
26.9
3,267
72.7
24.9
25.1
5.6
16.2
4.4
Quarterly Bloomberg Brokers Consensus Estimate
Bajaj Auto Ltd- July 23, 2015
Particulars (` cr)
1QFY16E
1QFY15
y-o-y (%)
4QFY15
q-o-q (%)
Net sales
6,078
5,133
18.4
4,624
31.5
EBITDA
1,223
925
32.1
838
45.9
EBITDA margin (%)
20.1
18.0
18.1
Net profit
948
740
28.1
622
52.5
Wipro Ltd (Consol)- July 23, 2015
Particulars (` cr)
1QFY16E
1QFY15
y-o-y (%)
4QFY15
q-o-q (%)
Net sales
12,152
11,136
9.1
12,142
0.1
EBITDA
2,701
2,551
5.9
2,753
(1.9)
EBITDA margin (%)
22.2
22.9
22.7
Net profit
2,203
2,103
4.7
2,272
(3.1)
GAIL India Ltd- July 23, 2015
Particulars (` cr)
1QFY16E
1QFY15
y-o-y (%)
4QFY15
q-o-q (%)
Net sales
14,690
13,337
10.1
14,235
3.2
EBITDA
1,194
1,045
14.2
643
85.5
EBITDA margin (%)
8.1
7.8
4.5
Net profit
659
621
6.1
511
29.1
Lupin Ltd (Consol)- July 23, 2015
Particulars (` cr)
1QFY16E
1QFY15
y-o-y (%)
4QFY15
q-o-q (%)
Net sales
3,328
3,284
1.3
3,054
9.0
EBITDA
896
1,115
(19.6)
789
13.5
EBITDA margin (%)
26.9
33.9
25.8
Net profit
574
625
(8.1)
547
5.0
United Spirits Ltd- July 23, 2015
Particulars (` cr)
1QFY16E
1QFY15
y-o-y (%)
4QFY15
q-o-q (%)
Net sales
2,029
1,909
6.3
2,020
0.4
EBITDA
191
145
31.7
25
661.6
EBITDA margin (%)
9.4
7.6
1.2
Net profit
50
(56)
0.0
(1,799)
0.0
Market Outlook
July 23, 2015
ABB India Ltd- July 24, 2015
Particulars (` cr)
2QFY16E
2QFY15
y-o-y (%)
1QFY15
q-o-q (%)
Net sales
1,940
1,794
8.1
1,785
8.7
EBITDA
147
126
16.7
144
2.2
EBITDA margin (%)
7.6
7.0
8.0
Net profit
63
48
32.2
54
16.1
Crompton Greaves Ltd (Consol)- July 24, 2015
Particulars (` cr)
1QFY16E
1QFY15
y-o-y (%)
4QFY15
q-o-q (%)
Net sales
3,476
3,442
1.0
3,808
(8.7)
EBITDA
176
173
2.1
147
20.0
EBITDA margin (%)
5.1
5.0
3.9
Net profit
72
64
12.4
(199)
0.0
Axis Bank Ltd- July 24, 2015
Particulars (` cr)
1QFY16E
1QFY15
y-o-y (%)
4QFY15
q-o-q (%)
PAT
1,963
1,667
17.8
2,181
(10.0)
Reliance Industries Ltd- July 24, 2015
Particulars (` cr)
1QFY16E
1QFY15
y-o-y (%)
4QFY15
q-o-q (%)
Net sales
67,939
96,351
(29.5)
56,043
21.2
EBITDA
8,963
7,530
19.0
8,629
3.9
EBITDA margin (%)
13.2
7.8
15.4
Net profit
6,250
5,649
10.6
6,243
0.1
Economic and Political News
Rajya Sabha panel for standard GST rate up to 20%
Odisha notifies mineral exploration policy
Realty players fear grant of TDR based on road width will halt redevelopment
in Mumbai
Govt gets `1-lakh-cr spend cushion for FY16
Corporate News
TV Today files `100cr defamation suit against Radio City
Adani port raises $650mn via dollar bond
Market Outlook
July 23, 2015
Top Picks
Large Cap
Market Cap
CMP
Target
Upside
Company
Sector
Rating
(` Mn)
(`)
(`)
(%)
Axis Bank
Financials
1,40,101
Buy
590
716
21.4
ICICI Bank
Financials
1,83,998
Buy
317
392
23.7
Infosys
IT
2,53,261
Buy
1,103
1,306
18.4
LIC Housing Fin.
Financials
24,552
Buy
487
553
13.7
MRF
Others
15,438
Buy
36,400
43,439
19.3
Power Grid
Power
74,498
Buy
142
170
19.4
TCS
IT
4,95,186
Buy
2,528
3,168
25.3
Tech Mahindra
IT
49,102
Buy
511
646
26.5
Yes Bank
Financials
34,425
Buy
823
1,006
22.2
Ashok Leyland
Auto
23,165 Accumulate
81
88
8.1
Source: Angel Research, Bloomberg
Mid Cap
Market
CMP
Target
Upside
Company
Sector
Rating
Cap (` Mn)
(`)
(`)
(%)
Action Const. Equip. Capital Goods
424
Buy
43
54
26.0
Bajaj Electricals
Others
2,744
Buy
272
341
25.3
Hindustan Media Ven. Media
1,819
Buy
248
292
17.8
JK Tyre
Auto Ancillary
2,192
Buy
97
127
31.4
MBL Infrastructures
Construction
1,160
Buy
560
789
41.0
Mangalam Cements Cement
721
Buy
270
349
29.2
MT Educare
Others
464
Buy
117
141
21.0
Radico Khaitan
Others
1,147
Buy
86
112
29.9
Setco Automotive
Auto Ancillary
613
Buy
229
286
24.7
Source: Angel Research, Bloomberg
Market Outlook
July 23, 2015
Result Calendar
Date
Company
July 23, 2015
Rallis, Bajaj Auto, Areva, Indian Bank, Wipro, GAIL, Lupin
July 24, 2015
TVS Motor, ABB, Crompton Greaves, Axis Bank, Reliance Industries, Hitachi
July 25, 2015
Andhra Bank, IOB, Persistent, Sarda Energy, Relaxo
July 26, 2015
July 27, 2015
Subros, KEC International, Ambuja Cements, Tech Mahindra, Jagran Prakashan, MRF
Maruti, Thermax, Blue Star, HDFC, Punjab Natl.Bank, Bank of India, Union Bank, IDBI Bank, Syndicate Bank, Tide
July 28, 2015
Water Oil India
United Phosphorus, Yes Bank, Allahabad Bank, Nestle, Dabur India, Godrej Consumer, Mphasis, Sesa Goa, JSW Steel
July 29, 2015
, NHPC
Exide Industries, Kotak Mah. Bank, Bank of Baroda, IDFC, Oriental Bank, ITC, Colgate, Electrosteel Castings, Petronet
July 30, 2015
LNG, Jyothy Laboratories, L G Balakrishnan & Bros, Dr Reddy's, Glenmark Pharma., Ipca labs, Indoco Remedies,
NTPC
July 31, 2015
ICICI Bank, GSK Pharma, Alembic Pharma, CESC
August 1, 2015
Transport Corporation of India
Source: Bloomberg, Angel Research
Global economic events release calendar
Date
Time
Country Event Description
Unit
Period
Bloomberg Data
Last Reported Estimated
July 23, 2015
7:30PM Euro Zone Euro-Zone Consumer Confidence
Value
Jul A
(5.60)
(5.80)
July 24, 2015
1:00PM Germany PMI Services
Value
Jul P
53.80
54.00
1:00PM Germany PMI Manufacturing
Value
Jul P
51.90
51.90
7:30PM US
New home sales
Thousands
Jun
546.00
548.00
July 28, 2015
2:00PM UK
GDP (YoY)
% Change
2Q A
2.90
--
7:30PM US
Consumer Confidence
S.A./ 1985=100
Jul
101.40
99.50
July 29, 2015
11:30PM US
FOMC rate decision
%
Jul 29
0.25
0.25
July 30, 2015
1:25PM Germany Unemployment change (000's)
Thousands
Jul
(1.00)
--
6:00PM US
GDP Qoq (Annualised)
% Change
2Q A
(0.20)
2.50
August 1, 2015
6:30AM China PMI Manufacturing
Value
Jul
50.20
--
August 3, 2015
2:00PM UK
PMI Manufacturing
Value
Jul
51.40
--
August 4, 2015
11:00AM India
RBI Reverse Repo rate
%
Aug 4
6.25
--
11:00AM India
RBI Repo rate
%
Aug 4
7.25
--
11:00AM India
RBI Cash Reserve ratio
%
Aug 4
4.00
--
August 6, 2015
4:30PM UK
BOE Announces rates
% Ratio
Aug 6
0.50
0.50
2:00PM UK
Industrial Production (YoY)
% Change
Jun
2.10
--
August 7, 2015
6:00PM US
Change in Nonfarm payrolls
Thousands
Jul
223.00
--
6:00PM US
Unnemployment rate
%
Jul
5.30
--
August 8, 2015
China
Exports YoY%
% Change
Jul
2.80
--
August 9, 2015
7:00AM China Consumer Price Index (YoY)
% Change
Jul
1.40
--
August 10, 2015
India
Imports YoY%
% Change
Jul
(13.40)
--
India
Exports YoY%
% Change
Jul
(15.80)
--
August 12, 2015
2:00PM UK
Jobless claims change
% Change
Jul
7.00
--
11:00AM China Industrial Production (YoY)
% Change
Jul
6.80
--
5:30PM India
Industrial Production YoY
% Change
Jun
2.70
--
Source: Bloomberg, Angel Research
Market Outlook
July 23, 2015
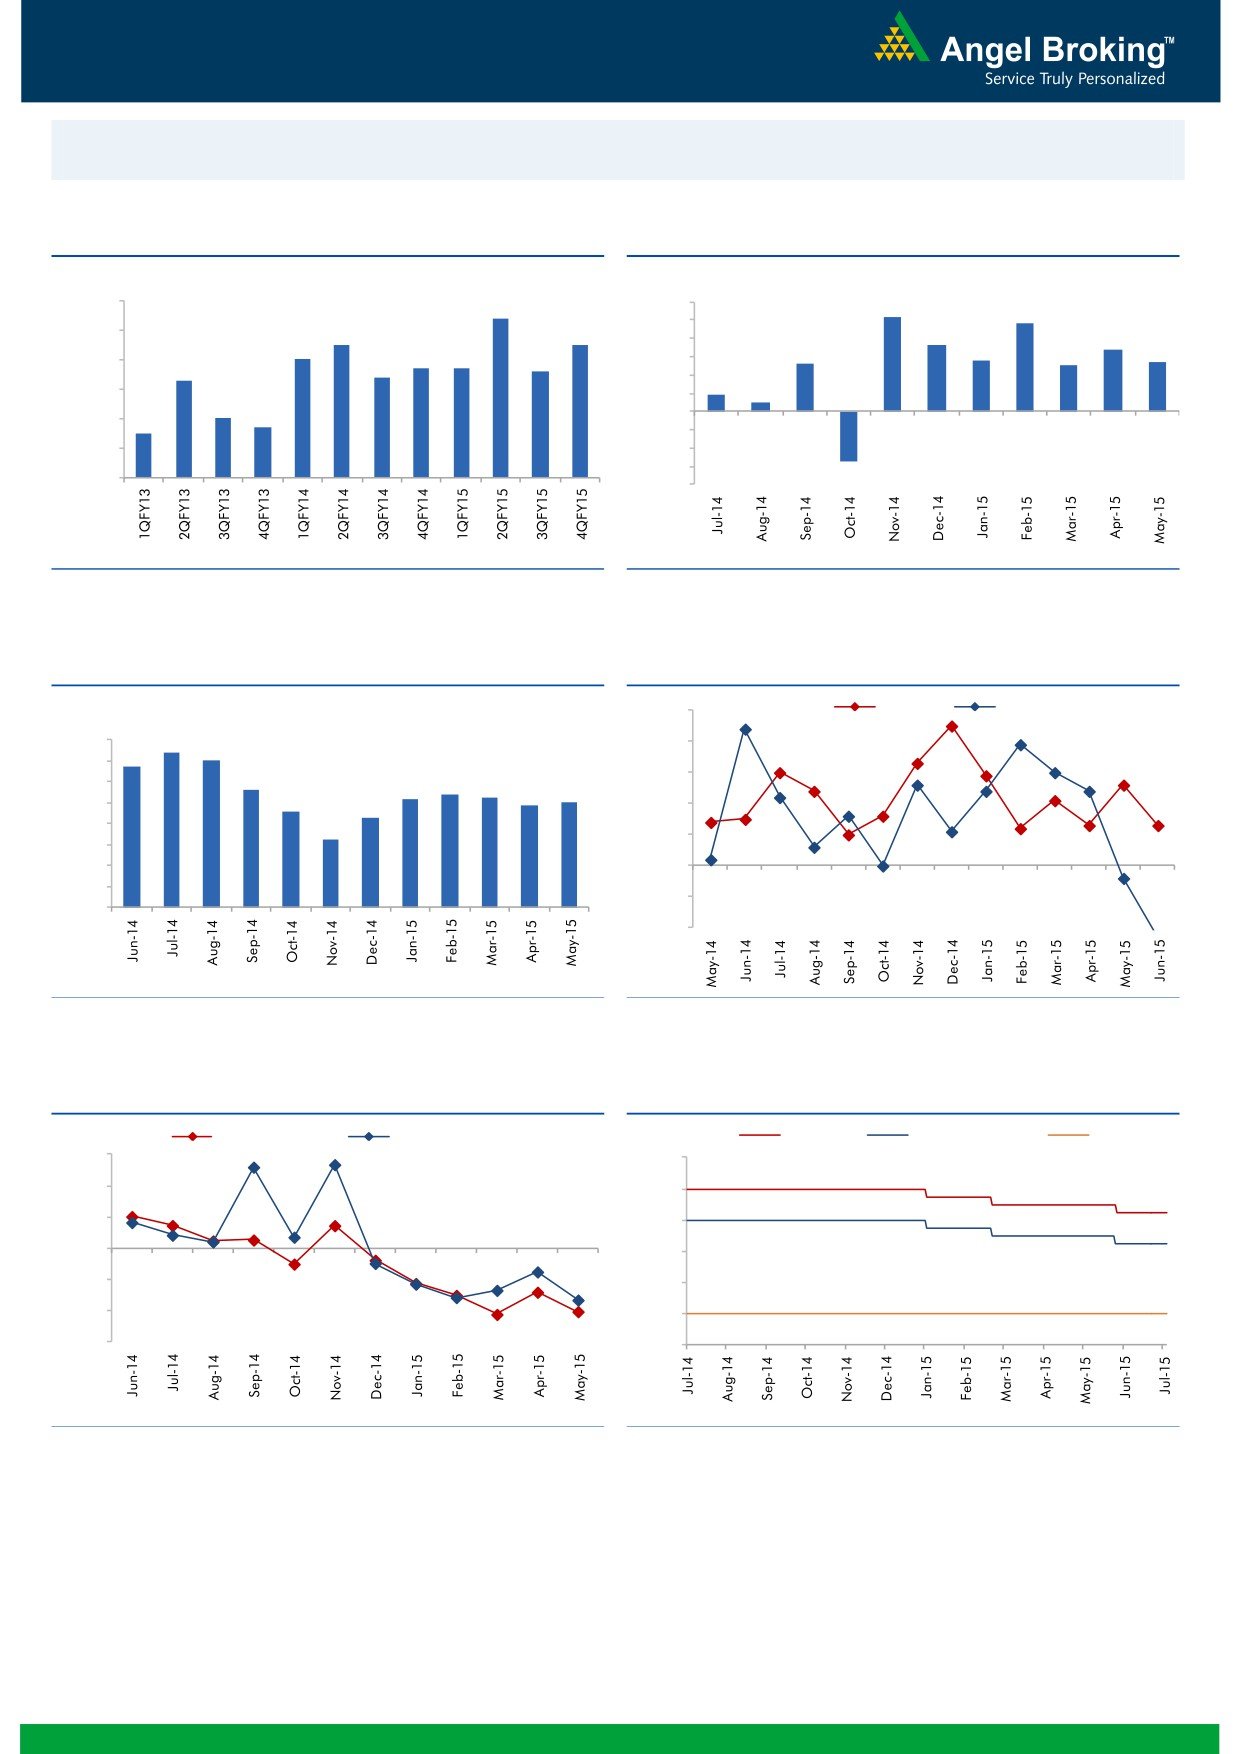
Macro watch
Exhibit 1: Quarterly GDP trends
Exhibit 2: IIP trends
(%)
(%)
9.0
8.4
6.0
5.2
4.8
5.0
8.0
7.5
7.5
3.6
3.4
7.0
4.0
2.8
2.7
6.7
6.7
2.6
2.5
6.6
3.0
7.0
6.3
6.4
2.0
0.9
6.0
0.5
1.0
5.0
4.7
-
5.0
4.5
(1.0)
4.0
(2.0)
(3.0)
3.0
(2.7)
(4.0)
Source: CSO, Angel Research
Source: MOSPI, Angel Research
Exhibit 3: Monthly CPI inflation trends
Exhibit 4: Manufacturing and services PMI
(%)
55.0
Mfg. PMI
Services PMI
8.0
7.4
54.0
6.8
7.0
7.0
5.6
5.4
53.0
6.0
5.2
5.3
4.9
5.0
4.6
5.0
4.3
52.0
4.0
3.3
51.0
3.0
2.0
50.0
1.0
49.0
-
48.0
Source: MOSPI, Angel Research
Source: Market, Angel Research; Note: Level above 50 indicates expansion
Exhibit 5: Exports and imports growth trends
Exhibit 6: Key policy rates
(%)
Exports yoy growth
Imports yoy growth
(%)
Repo rate
Reverse Repo rate
CRR
30.0
9.00
20.0
8.00
10.0
7.00
0.0
6.00
(10.0)
5.00
(20.0)
4.00
(30.0)
3.00
Source: Bloomberg, Angel Research
Source: RBI, Angel Research
Market Outlook
July 23, 2015
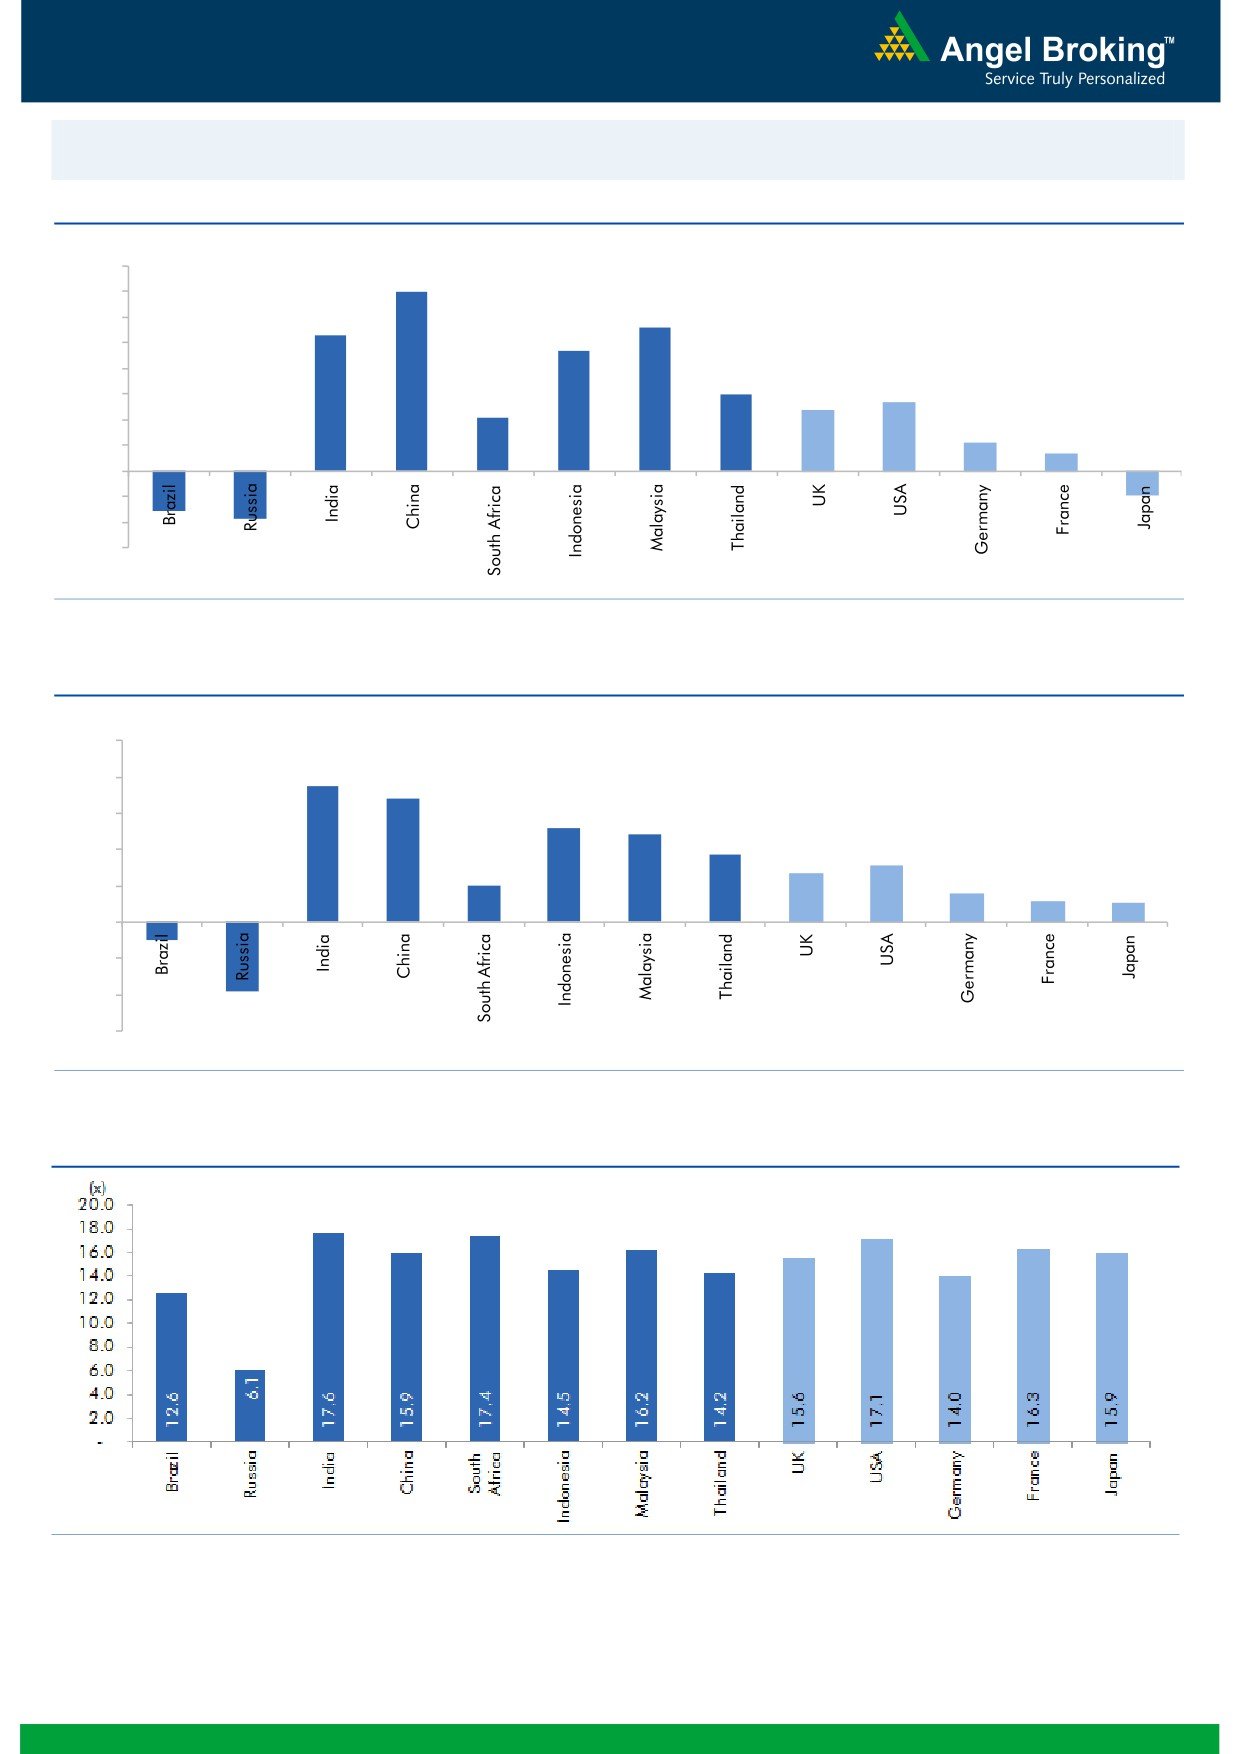
Global watch
Exhibit 1: Latest quarterly GDP Growth (%, yoy) across select developing and developed countries
(%)
8.0
7.0
7.0
5.6
6.0
5.3
4.7
5.0
4.0
3.0
2.7
3.0
2.4
2.1
2.0
1.1
0.7
1.0
(1.6)
(1.9)
(0.9)
-
(1.0)
(2.0)
(3.0)
Source: Bloomberg, Angel Research
Exhibit 2: 2015 GDP Growth projection by IMF (%, yoy) across select developing and developed countries
(%)
10.0
7.5
8.0
6.8
6.0
5.2
4.8
3.7
4.0
3.1
2.7
2.0
1.6
2.0
1.2
1.0
(1.0)
(3.8)
-
(2.0)
(4.0)
(6.0)
Source: IMF, Angel Research
Exhibit 3: One year forward P-E ratio across select developing and developed countries
Source: Bloomberg, Angel Research
Market Outlook
July 23, 2015
Exhibit 4: Relative performance of indices across globe
Returns (%)
Country
Name of index
Closing price
1M
3M
1YR
Brazil
Bovespa
50,916
(5.3)
(5.6)
(10.7)
Russia
Micex
1,636
(2.2)
(1.3)
18.1
India
Nifty
8,634
3.4
2.4
15.7
China
Shanghai Composite
4,026
(12.1)
(8.6)
94.2
South Africa
Top 40
46,371
(0.5)
(2.5)
(0.9)
Mexico
Mexbol
44,670
(1.2)
(1.2)
0.9
Indonesia
LQ45
843
1.0
(10.4)
(3.8)
Malaysia
KLCI
1,730
(0.4)
(7.3)
(8.5)
Thailand
SET 50
953
(2.6)
(8.7)
(5.9)
USA
Dow Jones
17,851
(0.9)
(0.5)
4.5
UK
FTSE
6,667
(2.3)
(5.6)
(2.3)
Japan
Nikkei
20,594
1.1
5.1
35.1
Germany
DAX
11,521
0.5
(3.5)
18.4
France
CAC
5,083
1.7
(2.5)
17.0
Source: Bloomberg, Angel Research
Market Outlook
July 23, 2015
Stock Watch
Company Name
Reco
CMP
Target
Mkt Cap
Sales ( Čcr )
OPM(%)
EPS (Č)
PER(x)
P/BV(x)
RoE(%)
EV/Sales(x)
(Č)
Price ( Č)
( Č cr )
FY16E FY17E
FY16E
FY17E
FY16E
FY17E
FY16E
FY17E
FY16E
FY17E
FY16E
FY17E
FY16E
FY17E
Agri / Agri Chemical
Rallis
Neutral
255
-
4,967
2,075
2,394
14.4
14.4
9.5
11.0
26.9
23.2
5.3
4.6
21.1
21.3
2.4
2.1
United Phosphorus
Neutral
546
-
23,410
13,698
15,752
17.6
17.6
32.1
38.5
17.0
14.2
3.3
2.8
21.4
21.3
1.8
1.5
Auto & Auto Ancillary
Ashok Leyland
Accumulate
81
88
23,165
17,094
19,726
9.5
10.7
2.7
4.2
30.2
19.4
4.1
3.8
13.9
19.8
1.3
1.1
Bajaj Auto
Neutral
2,619
-
75,788
25,664
29,609
18.8
18.6
134.2
150.3
19.5
17.4
6.0
5.2
30.7
29.6
2.5
2.2
Eicher Motors
Neutral
21,110
-
57,297
11,872
15,783
15.5
17.8
399.4
642.0
52.9
32.9
17.2
12.5
32.3
37.7
4.7
3.5
Hero Motocorp
Neutral
2,708
-
54,069
29,771
34,219
13.0
13.5
142.3
165.2
19.0
16.4
6.9
5.9
36.3
35.8
1.7
1.4
L G Balakrishnan & Bros Accumulate
506
541
794
1,254
1,394
11.6
11.8
35.9
41.7
14.1
12.2
1.9
1.7
13.5
13.8
0.7
0.7
Mahindra and Mahindra Neutral
1,342
-
83,323
41,078
46,473
11.5
12.0
51.4
62.7
26.1
21.4
3.8
3.4
14.7
15.9
1.8
1.5
Maruti
Accumulate
4,189
4,399
126,546
57,615
68,166
15.6
15.5
180.2
220.0
23.3
19.0
4.6
3.9
19.7
20.6
2.0
1.6
Minda Industries
Buy
545
652
865
2,500
2,889
7.6
8.3
39.4
54.3
13.8
10.0
2.0
1.6
14.1
16.3
0.5
0.4
Rane Brake Lining
Accumulate
346
366
274
454
511
11.1
11.4
23.8
28.1
14.6
12.3
2.1
1.9
14.2
15.3
0.7
0.7
Setco Automotive
Buy
229
286
613
718
862
13.3
14.3
13.4
19.0
17.1
12.1
2.7
2.2
15.4
18.5
1.1
1.0
Tata Motors
Buy
389
489
112,384
260,543
278,575
13.3
13.7
31.7
38.0
12.3
10.2
1.4
1.3
12.2
13.0
0.6
0.6
TVS Motor
Neutral
264
-
12,542
11,813
14,001
7.0
8.1
11.0
16.4
24.0
16.1
6.2
4.9
25.9
30.2
1.0
0.8
Amara Raja Batteries
Neutral
869
-
14,844
5,355
6,641
17.4
17.8
31.8
40.9
27.3
21.3
6.9
5.4
25.2
25.5
2.7
2.2
Exide Industries
Accumulate
153
164
12,997
7,919
9,028
13.9
14.4
7.3
8.6
21.0
17.8
2.9
2.6
13.8
14.4
1.4
1.2
Apollo Tyres
Neutral
193
-
9,837
12,866
13,892
15.7
15.4
20.1
19.9
9.6
9.7
1.5
1.3
15.8
13.6
0.8
0.8
Ceat
Neutral
779
-
3,150
6,047
6,776
12.4
12.0
82.0
90.4
9.5
8.6
1.6
1.4
16.5
15.7
0.7
0.6
JK Tyres
Buy
97
127
2,192
7,774
8,456
13.3
12.9
17.3
18.1
5.6
5.3
1.3
1.1
22.8
19.7
0.6
0.6
Swaraj Engines
Neutral
868
-
1,079
604
689
14.3
14.5
51.4
60.7
16.9
14.3
4.0
3.5
23.4
24.7
1.6
1.4
Subros
Accumulate
76
80
454
1,295
1,533
11.7
12.0
4.2
7.3
18.0
10.4
1.4
1.2
7.7
12.4
0.7
0.5
Indag Rubber
Buy
182
247
478
283
329
17.0
17.2
13.0
15.4
14.1
11.8
3.1
2.6
21.8
21.6
1.4
1.2
Capital Goods
ACE
Buy
43
54
424
660
839
4.7
8.2
1.0
3.9
42.9
11.0
1.3
1.2
3.2
11.3
0.8
0.6
BEML
Accumulate
1,502
1,607
6,255
3,277
4,006
6.0
8.9
29.2
64.3
51.4
23.4
5.7
11.7
2.0
1.6
BGR Energy
Neutral
123
-
890
3,615
3,181
9.5
9.4
16.7
12.4
7.4
10.0
0.7
0.7
10.0
7.0
0.7
0.8
BHEL
Neutral
285
-
69,781
33,722
35,272
10.8
11.7
10.5
14.2
27.2
20.1
2.0
1.9
7.0
9.0
2.1
2.1
Blue Star
Buy
334
391
3,003
3,649
4,209
4.8
5.7
8.5
14.0
39.5
23.9
6.3
5.4
16.3
24.4
0.9
0.8
Crompton Greaves
Accumulate
196
220
12,275
15,252
16,870
5.4
5.6
7.9
10.7
24.8
18.3
3.0
2.7
12.0
15.0
0.9
0.8
Inox Wind
Buy
436
505
9,683
4,980
5,943
17.0
17.5
26.6
31.6
16.4
13.8
35.0
30.0
2.1
1.7
Market Outlook
July 23, 2015
Stock Watch
Company Name
Reco
CMP
Target
Mkt Cap
Sales ( Čcr )
OPM(%)
EPS (Č)
PER(x)
P/BV(x)
RoE(%)
EV/Sales(x)
(Č)
Price ( Č)
( Č cr )
FY16E
FY17E
FY16E
FY17E
FY16E
FY17E
FY16E
FY17E
FY16E
FY17E
FY16E
FY17E
FY16E
FY17E
Capital Goods
KEC International
Neutral
151
-
3,888
8,791
9,716
6.1
6.8
5.4
8.2
28.0
18.5
2.8
2.6
10.0
14.0
0.7
0.6
Thermax
Neutral
1,061
-
12,637
6,413
7,525
7.4
8.5
30.5
39.3
34.8
27.0
5.4
4.7
15.0
17.0
1.9
1.6
Cement
ACC
Accumulate
1,435
1,548
26,945
11,856
14,092
14.5
17.8
47.6
76.2
30.2
18.8
3.1
2.9
10.6
15.7
2.1
1.7
Ambuja Cements
Neutral
247
-
38,262
10,930
12,022
22.2
23.2
9.7
11.2
25.4
22.0
3.5
3.2
14.3
15.2
3.1
2.8
India Cements
Buy
85
132
2,613
4,716
5,133
14.9
15.8
1.0
4.5
85.1
18.9
0.9
0.8
1.0
4.5
0.9
0.8
JK Cement
Buy
603
778
4,216
4,061
4,748
16.2
17.7
24.5
42.9
24.6
14.1
2.4
2.1
10.0
15.9
1.5
1.2
J K Lakshmi Cement
Buy
331
443
3,895
3,004
3,618
17.6
19.9
13.9
27.2
23.8
12.2
2.7
2.3
11.8
20.5
1.7
1.4
Mangalam Cements
Buy
270
349
721
1,111
1,336
12.2
15.1
16.3
34.6
16.6
7.8
1.3
1.2
8.2
16.0
0.9
0.7
Orient Cement
Neutral
184
-
3,777
2,039
2,573
22.7
24.5
9.3
13.3
19.8
13.9
3.4
2.9
18.3
22.6
2.5
1.9
Ramco Cements
Neutral
354
-
8,427
4,036
4,545
20.8
21.3
15.1
18.8
23.4
18.8
2.9
2.6
12.9
14.3
2.6
2.2
Shree Cement^
Neutral
10,764
-
37,499
7,150
8,742
26.7
28.6
228.0
345.5
47.2
31.2
7.0
5.8
15.7
20.3
5.0
4.0
UltraTech Cement
Neutral
3,256
-
89,340
27,562
31,548
20.3
22.0
111.0
145.0
29.3
22.5
4.1
3.6
15.1
17.0
3.3
2.8
Construction
ITNL
Buy
148
211
3,660
7,589
8,021
34.0
35.9
16.0
19.0
9.3
7.8
0.6
0.5
6.5
6.7
3.6
3.8
KNR Constructions
Neutral
575
-
1,616
915
1,479
14.3
13.9
20.3
37.2
28.3
15.5
2.6
2.3
9.6
15.6
1.9
1.2
Larsen & Toubro
Accumulate
1,855
2,013
172,566
68,920
82,446
10.9
11.5
57.0
73.0
32.5
25.4
3.0
2.8
13.6
15.5
2.7
2.3
Gujarat Pipavav Port
Neutral
228
-
11,037
793
694
53.0
50.9
9.0
8.0
25.4
28.5
5.5
4.5
25.9
18.4
13.5
15.4
MBL Infrastructures
Buy
560
789
1,160
2,507
2,986
12.4
14.4
43.0
41.0
13.0
13.7
1.6
1.4
12.6
12.7
1.2
1.1
PNC Infratech
Accumulate
414
445
2,124
1,719
2,003
13.0
13.5
21.0
28.0
19.7
14.8
1.7
1.5
11.0
10.9
1.3
1.1
Financials
Allahabad Bank
Neutral
89
-
5,060
8,859
9,817
3.0
3.0
23.7
30.1
3.7
2.9
0.5
0.4
10.6
12.3
-
-
Axis Bank
Buy
590
716
140,101
26,522
31,625
3.6
3.6
36.2
45.4
16.3
13.0
3.2
2.8
18.2
19.6
-
-
Bank of Baroda
Neutral
153
-
33,770
18,934
21,374
2.0
2.0
13.2
15.1
11.6
10.1
0.9
0.8
7.1
7.7
-
-
Bank of India
Neutral
172
-
11,440
17,402
20,003
2.0
2.1
40.3
50.7
4.3
3.4
0.4
0.4
9.0
10.4
-
-
Canara Bank
Neutral
285
-
14,668
15,805
17,745
2.0
2.2
64.3
73.5
4.4
3.9
0.5
0.4
10.8
11.3
-
-
Dena Bank
Neutral
44
-
2,480
3,580
4,040
2.1
2.2
8.4
10.9
5.3
4.1
0.5
0.4
6.8
8.4
-
-
Federal Bank
Neutral
71
-
12,090
3,522
4,045
3.2
3.2
12.2
14.1
5.8
5.0
0.7
0.6
12.9
13.4
-
-
HDFC
Neutral
1,346
-
212,110
11,198
13,321
3.5
3.5
45.1
53.7
29.9
25.1
6.2
5.5
27.2
28.2
-
-
HDFC Bank
Accumulate
1,114
1,255
279,864
38,629
47,500
4.5
4.7
52.6
66.4
21.2
16.8
3.9
3.3
19.6
21.2
-
-
ICICI Bank
Buy
317
392
183,998
36,037
41,647
3.5
3.6
22.9
26.7
13.8
11.9
2.3
2.0
15.7
15.9
-
-
IDBI Bank
Neutral
64
-
10,313
9,806
11,371
1.7
1.9
10.0
16.3
6.5
4.0
0.5
0.4
6.8
10.4
-
-
Market Outlook
July 23, 2015
Stock Watch
Company Name
Reco
CMP
Target
Mkt Cap
Sales ( Čcr )
OPM(%)
EPS (Č)
PER(x)
P/BV(x)
RoE(%)
EV/Sales(x)
(Č)
Price ( Č)
( Č cr )
FY16E FY17E
FY16E
FY17E
FY16E
FY17E
FY16E
FY17E
FY16E
FY17E
FY16E
FY17E
FY16E
FY17E
Financials
Indian Bank
Neutral
133
-
6,402
6,454
7,321
2.5
2.6
26.4
33.3
5.1
4.0
0.4
0.4
8.1
9.6
-
-
LIC Housing Finance
Accumulate
487
553
24,552
2,934
3,511
2.3
2.3
30.9
36.8
15.7
13.2
2.5
2.2
16.8
17.5
-
-
Oriental Bank
Neutral
175
-
5,250
7,930
8,852
2.5
2.5
51.8
57.1
3.4
3.1
0.4
0.3
9.3
9.5
-
-
Punjab Natl.Bank
Neutral
139
-
25,806
24,160
27,777
2.9
3.0
18.5
24.6
7.5
5.7
0.7
0.6
8.8
10.8
-
-
South Ind.Bank
Neutral
24
-
3,207
1,999
2,249
2.4
2.4
3.5
4.0
6.8
5.9
0.9
0.8
12.6
13.1
-
-
St Bk of India
Accumulate
269
297
203,266
86,900
100,550
3.1
3.1
22.1
27.7
12.2
9.7
1.5
1.3
12.7
14.3
-
-
Union Bank
Neutral
165
-
10,513
12,995
14,782
2.4
2.4
32.3
40.9
5.1
4.1
0.6
0.5
10.7
12.3
-
-
Vijaya Bank
Neutral
41
-
3,479
3,474
3,932
1.8
1.9
5.9
7.2
6.9
5.6
0.6
0.5
8.1
9.3
-
-
Yes Bank
Buy
823
1,006
34,425
7,006
8,825
3.1
3.3
61.4
77.1
13.4
10.7
2.5
2.1
20.1
21.3
-
-
FMCG
Asian Paints
Neutral
843
-
80,875
16,553
19,160
16.0
16.2
17.7
21.5
47.7
39.2
12.7
11.4
29.4
31.2
4.7
4.1
Britannia
Neutral
2,856
-
34,269
8,065
9,395
9.6
10.2
47.2
65.5
60.5
43.6
20.1
19.0
38.3
41.2
4.1
3.5
Colgate
Neutral
2,074
-
28,200
4,836
5,490
19.5
19.7
48.5
53.2
42.8
39.0
31.3
27.3
99.8
97.5
5.7
5.0
Dabur India
Neutral
299
-
52,555
9,370
10,265
17.1
17.2
7.3
8.1
40.8
36.9
12.3
10.0
33.7
30.6
5.5
5.0
GlaxoSmith Con*
Neutral
6,380
-
26,831
4,919
5,742
17.2
17.4
168.3
191.2
37.9
33.4
10.8
9.2
28.8
28.9
5.0
4.3
Godrej Consumer
Neutral
1,218
-
41,474
10,168
12,886
16.1
16.1
32.1
38.4
38.0
31.7
7.7
7.1
19.7
21.0
4.2
3.3
HUL
Neutral
918
-
198,714
34,940
38,957
17.5
17.7
20.8
24.7
44.2
37.2
49.1
39.3
110.5
114.2
5.5
4.9
ITC
Buy
315
409
252,409
41,068
45,068
37.8
37.4
13.9
15.9
22.6
19.8
7.6
6.7
34.1
33.8
5.8
5.2
Marico
Neutral
432
-
27,842
6,551
7,766
15.7
16.0
10.4
12.5
41.6
34.5
12.1
10.0
33.2
32.4
4.2
3.5
Nestle*
Accumulate
5,987
6,646
57,724
11,291
12,847
22.2
22.3
158.9
184.6
37.7
32.4
19.7
17.7
55.0
57.3
5.0
4.3
Tata Global
Buy
140
186
8,797
8,735
9,182
9.8
9.9
8.5
9.3
16.4
15.0
2.1
2.1
7.9
8.1
0.9
0.9
IT
HCL Tech^
Accumulate
982
1,100
138,039
41,535
46,519
24.0
23.4
56.6
61.1
17.4
16.1
3.6
2.9
20.8
17.7
3.2
2.8
Infosys
Buy
1,103
1,306
253,261
60,250
66,999
28.0
28.0
58.3
63.7
18.9
17.3
4.0
3.4
20.9
19.7
3.5
3.0
TCS
Buy
2,528
3,168
495,186
108,420
123,559
28.8
28.7
127.2
143.9
19.9
17.6
7.9
7.4
39.9
41.8
4.2
3.6
Tech Mahindra
Buy
511
646
49,102
27,281
31,373
17.3
18.4
30.8
38.0
16.6
13.4
3.4
2.8
20.3
20.9
1.6
1.3
Wipro
Buy
585
753
144,551
54,050
61,617
23.7
23.8
39.4
44.1
14.9
13.3
3.0
2.7
19.9
18.8
2.3
1.8
Media
D B Corp
Accumulate
320
356
5,876
2,241
2,495
27.8
27.9
21.8
25.6
14.7
12.5
3.8
3.4
26.7
28.5
2.6
2.3
HT Media
Buy
92
129
2,142
2,495
2,703
13.5
13.6
9.4
10.7
9.8
8.6
1.0
0.9
10.4
10.6
0.4
0.3
Jagran Prakashan
Buy
132
156
4,327
1,939
2,122
26.0
26.0
8.3
9.2
16.0
14.4
2.7
2.5
17.5
17.1
2.2
2.0
Sun TV Network
Accumulate
258
275
10,181
2,779
3,196
70.2
70.5
22.8
27.3
11.3
9.5
2.8
2.5
26.7
28.3
3.4
2.9
Market Outlook
July 23, 2015
Stock Watch
Company Name
Reco
CMP
Target
Mkt Cap
Sales ( Čcr )
OPM(%)
EPS (Č)
PER(x)
P/BV(x)
RoE(%)
EV/Sales(x)
(Č)
Price ( Č)
( Č cr )
FY16E FY17E
FY16E
FY17E
FY16E
FY17E
FY16E
FY17E
FY16E
FY17E
FY16E
FY17E
FY16E
FY17E
Media
Hindustan Media
Buy
248
292
1,819
920
1,031
20.0
20.0
19.2
20.9
12.9
11.9
2.1
1.8
16.4
15.3
1.5
1.3
Ventures
Metals & Mining
Coal India
Neutral
433
-
273,214
77,595
89,628
22.9
24.4
27.6
30.0
15.7
14.4
6.8
6.8
33.9
33.2
2.8
2.5
Hind. Zinc
Neutral
164
-
69,422
15,546
16,821
47.5
49.0
19.7
20.3
8.3
8.1
1.4
1.2
17.2
16.6
2.2
1.7
Hindalco
Neutral
108
-
22,271
112,328
119,817
7.7
7.9
16.3
20.1
6.6
5.4
0.5
0.5
8.0
8.5
0.7
0.6
JSW Steel
Neutral
860
-
20,794
48,125
53,595
18.8
21.0
46.9
97.5
18.3
8.8
0.9
0.8
4.4
9.5
1.2
1.1
NMDC
Neutral
114
-
45,337
12,544
13,330
59.5
59.7
16.3
16.5
7.0
6.9
1.3
1.2
5.1
9.9
2.3
2.3
SAIL
Neutral
58
-
23,955
56,365
63,383
6.9
8.0
7.1
8.2
8.1
7.1
0.5
0.5
7.0
7.1
1.0
0.9
Vedanta
Neutral
136
-
40,349
81,842
88,430
30.6
32.8
20.2
25.7
6.8
5.3
0.5
0.5
7.5
8.5
0.9
0.7
Tata Steel
Neutral
280
-
27,228
136,805
149,228
11.3
11.9
26.4
36.8
10.6
7.6
0.8
0.8
6.0
8.0
0.7
0.7
Oil & Gas
Cairn India
Neutral
167
-
31,301
12,617
14,513
33.7
40.0
25.5
27.7
6.6
6.0
0.5
0.5
7.4
7.7
1.1
0.9
GAIL
Neutral
369
-
46,813
75,595
85,554
8.6
8.0
31.8
36.1
11.6
10.2
1.3
1.2
10.7
11.4
0.8
0.6
ONGC
Neutral
285
-
243,789
174,773
192,517
22.7
24.8
34.6
38.2
8.2
7.5
1.2
1.1
14.2
14.9
1.5
1.3
Petronet LNG
Neutral
195
-
14,621
45,759
49,386
3.7
4.0
12.6
14.9
15.5
13.1
2.4
2.1
16.1
16.7
0.4
0.3
Reliance Industries
Neutral
1,050
-
340,103
339,083
384,014
7.8
9.5
75.7
94.5
13.9
11.1
1.4
1.3
10.7
12.2
1.3
1.2
Pharmaceuticals
Alembic Pharma
Neutral
768
-
14,482
2,405
2,859
19.9
20.4
17.7
22.0
43.4
34.9
12.4
9.5
32.6
30.9
6.1
5.0
Aurobindo Pharma
Accumulate
752
824
43,917
14,435
16,600
22.6
22.6
36.1
41.2
20.8
18.3
6.2
4.7
34.5
29.3
3.4
2.9
Aventis*
Neutral
3,629
-
8,357
2,156
2,455
15.1
16.8
109.7
133.9
33.1
27.1
4.5
3.7
18.4
22.5
3.6
3.0
Cadila Healthcare
Neutral
1,984
-
40,630
10,224
11,840
19.7
20.0
69.8
81.0
28.4
24.5
7.5
6.0
26.8
25.3
4.0
3.4
Cipla
Neutral
675
-
54,185
14,051
16,515
18.9
18.7
25.1
28.9
26.9
23.4
4.3
3.7
17.2
16.9
3.9
3.2
Dr Reddy's
Neutral
3,848
-
65,603
17,443
20,296
22.3
22.4
156.7
180.1
24.6
21.4
4.9
4.1
21.8
20.8
3.7
3.1
Dishman Pharma
Buy
170
238
1,374
1,716
1,888
20.2
20.2
16.3
21.6
10.5
7.9
1.0
0.9
9.7
11.7
1.0
0.8
GSK Pharma*
Neutral
3,431
-
29,065
2,818
3,044
18.9
18.9
56.2
58.6
61.1
58.6
17.3
18.7
27.1
30.7
9.8
9.2
Indoco Remedies
Neutral
367
-
3,378
1,088
1,262
18.2
18.2
13.1
15.5
28.0
23.7
5.5
4.6
21.2
21.1
3.2
2.7
Ipca labs
Accumulate
689
736
8,689
3,533
4,109
18.6
19.6
28.2
34.8
24.4
19.8
3.4
2.9
15.0
15.9
2.7
2.3
Lupin
Neutral
1,824
-
82,061
14,864
17,244
26.9
26.9
62.1
71.1
29.4
25.7
7.1
5.7
27.4
24.6
5.3
4.4
Sun Pharma
Accumulate
832
950
200,270
27,839
33,542
27.7
29.7
18.9
26.9
44.0
30.9
4.0
3.5
13.0
14.6
6.6
5.2
Power
Tata Power
Neutral
73
-
19,744
38,302
38,404
14.1
13.1
5.1
6.0
14.2
12.2
1.4
1.3
9.2
10.3
1.4
1.4
NTPC
Neutral
137
-
113,128
89,067
98,329
15.9
16.5
12.1
13.1
11.4
10.5
1.3
1.2
11.0
11.6
2.3
2.3
Power Grid
Buy
142
170
74,498
19,986
22,702
86.2
86.3
11.1
12.7
12.8
11.2
1.8
1.6
14.4
14.7
8.9
8.2
Market Outlook
July 23, 2015
Stock Watch
Company Name
Reco
CMP
Target
Mkt Cap
Sales ( Čcr )
OPM(%)
EPS (Č)
PER(x)
P/BV(x)
RoE(%)
EV/Sales(x)
(Č)
Price ( Č)
( Č cr )
FY16E FY17E
FY16E
FY17E
FY16E
FY17E
FY16E
FY17E
FY16E
FY17E
FY16E
FY17E
FY16E
FY17E
Telecom
Bharti Airtel
Neutral
439
-
175,626
101,748
109,191
32.1
31.7
12.0
12.5
36.6
35.2
2.5
2.4
6.9
6.7
2.4
2.1
Idea Cellular
Neutral
179
-
64,399
34,282
36,941
32.0
31.5
5.9
6.2
30.3
28.9
2.8
2.5
9.9
9.3
2.5
2.3
zOthers
Abbott India
Neutral
4,342
-
9,227
2,713
3,141
13.7
13.5
127.8
145.7
34.0
29.8
7.9
6.5
25.9
23.9
3.1
2.6
Bajaj Electricals
Buy
272
341
2,744
4,719
5,287
5.2
5.8
8.6
12.7
31.8
21.5
3.6
3.2
11.4
14.8
0.6
0.5
Finolex Cables
Neutral
260
-
3,970
2,728
3,036
10.8
11.0
14.4
16.8
18.0
15.5
2.7
2.4
15.2
15.3
1.2
1.0
Goodyear India*
Neutral
565
-
1,303
1,536
1,683
9.6
10.0
41.8
48.0
13.5
11.8
2.3
2.0
18.2
18.3
0.6
0.5
Hitachi
Neutral
1,593
-
4,331
1,801
2,051
8.9
9.3
31.0
38.8
51.3
41.1
11.0
8.8
23.9
23.8
2.4
2.1
Jyothy Laboratories
Neutral
314
-
5,676
1,620
1,847
11.5
11.5
7.3
8.5
43.0
37.0
5.6
5.2
13.3
14.4
3.4
2.9
MRF
Buy
36,400
43,439
15,438
13,524
14,440
18.6
18.2
2,999.2
3,102.8
12.1
11.7
2.7
2.2
24.7
20.5
1.1
1.0
Page Industries
Neutral
14,735
-
16,435
1,929
2,450
19.8
20.1
229.9
299.0
64.1
49.3
28.3
19.7
52.1
47.1
8.6
6.7
Relaxo Footwears
Neutral
550
-
6,596
1,767
2,152
12.3
12.5
19.3
25.1
28.6
21.9
7.0
5.4
27.7
27.8
3.8
3.1
Siyaram Silk Mills
Neutral
1,200
-
1,125
1,653
1,873
11.7
12.2
99.3
122.1
12.1
9.8
2.2
1.8
19.5
20.2
0.8
0.7
Styrolution ABS India*
Neutral
729
-
1,282
1,271
1,440
8.6
9.2
32.0
41.1
22.8
17.8
2.3
2.1
10.7
12.4
1.0
0.8
Tree House
Neutral
440
-
1,861
259
324
56.8
56.8
17.0
21.7
25.9
20.3
2.6
2.3
10.1
11.5
7.1
5.8
TVS Srichakra
Neutral
2,238
-
1,714
2,112
2,389
11.9
12.1
168.5
202.5
13.3
11.1
4.6
3.4
39.6
35.5
0.9
0.8
HSIL
Buy
345
434
2,495
2,085
2,436
18.5
18.6
21.7
28.9
15.9
11.9
1.6
1.4
10.0
12.1
1.3
1.1
Kirloskar Engines India
Neutral
285
-
4,122
2,779
3,314
10.3
11.9
12.0
17.5
23.8
16.3
2.9
2.6
12.5
16.7
1.1
0.9
Ltd
M M Forgings
Buy
676
783
816
586
671
22.3
22.9
53.4
65.2
12.7
10.4
2.7
2.2
24.1
23.5
1.5
1.3
Banco Products (India)
Neutral
105
-
750
1,196
1,370
9.7
11.8
9.4
14.3
11.2
7.4
1.1
1.0
10.4
14.5
0.6
0.5
Competent Automobiles Neutral
155
-
95
1,007
1,114
3.1
3.1
23.7
28.2
6.6
5.5
0.9
0.8
13.9
14.6
0.1
0.1
Nilkamal
Neutral
743
-
1,108
1,947
2,131
8.1
8.3
35.7
45.9
20.8
16.2
2.1
1.9
10.3
12.1
0.6
0.6
Visaka Industries
Accumulate
145
166
230
1,158
1,272
8.6
9.5
23.7
32.7
6.1
4.4
0.6
0.6
10.1
12.5
0.4
0.3
Transport Corporation of
Accumulate
269
293
2,033
2,830
3,350
8.8
9.0
14.4
18.3
18.7
14.7
2.9
2.5
15.4
17.1
0.8
0.7
India
Elecon Engineering
Neutral
92
-
999
1,452
1,596
13.7
14.7
4.2
6.2
22.1
14.7
1.7
1.6
8.1
11.2
1.0
0.8
Surya Roshni
Accumulate
135
152
591
2,992
3,223
8.4
8.7
15.2
19.3
8.9
7.0
0.9
0.8
10.1
11.5
0.5
0.5
MT Educare
Buy
117
141
464
275
355
18.3
17.3
7.4
8.8
15.8
13.2
3.2
2.8
20.2
21.1
1.6
1.2
Radico Khaitan
Buy
86
112
1,147
1,565
1,687
11.9
12.4
5.4
6.6
15.9
13.1
1.3
1.2
8.0
9.0
1.2
1.2
Garware Wall Ropes
Accumulate
266
303
582
875
983
10.4
10.5
23.1
27.5
11.5
9.7
1.6
1.4
14.1
14.6
0.7
0.6
Source: Company, Angel Research; Note: *December year end; #September year end; &October year end; Price as on July 22, 2015
Market Outlook
July 23, 2015
Research Team Tel: 022 - 39357800
DISCLAIMER
Angel Broking Private Limited (hereinafter referred to as “Angel”) is a registered Member of National Stock Exchange of India Limited,
Bombay Stock Exchange Limited and MCX Stock Exchange Limited. It is also registered as a Depository Participant with CDSL and
Portfolio Manager with SEBI. It also has registration with AMFI as a Mutual Fund Distributor. Angel Broking Private Limited is a registered
entity with SEBI for Research Analyst in terms of SEBI (Research Analyst) Regulations, 2014 vide registration number INH000000164.
Angel or its associates has not been debarred/ suspended by SEBI or any other regulatory authority for accessing /dealing in securities
Market. Angel or its associates including its relatives/analyst do not hold any financial interest/beneficial ownership of more than 1% in
the company covered by Analyst. Angel or its associates/analyst has not received any compensation / managed or co-managed public
offering of securities of the company covered by Analyst during the past twelve months. Angel/analyst has not served as an officer,
director or employee of company covered by Analyst and has not been engaged in market making activity of the company covered by
Analyst.
This document is solely for the personal information of the recipient, and must not be singularly used as the basis of any investment
decision. Nothing in this document should be construed as investment or financial advice. Each recipient of this document should make
such investigations as they deem necessary to arrive at an independent evaluation of an investment in the securities of the companies
referred to in this document (including the merits and risks involved), and should consult their own advisors to determine the merits and
risks of such an investment.
Reports based on technical and derivative analysis center on studying charts of a stock's price movement, outstanding positions and
trading volume, as opposed to focusing on a company's fundamentals and, as such, may not match with a report on a company's
fundamentals.
The information in this document has been printed on the basis of publicly available information, internal data and other reliable sources
believed to be true, but we do not represent that it is accurate or complete and it should not be relied on as such, as this document is for
general guidance only. Angel Broking Pvt. Limited or any of its affiliates/ group companies shall not be in any way responsible for any
loss or damage that may arise to any person from any inadvertent error in the information contained in this report. Angel Broking Pvt.
Limited has not independently verified all the information contained within this document. Accordingly, we cannot testify, nor make any
representation or warranty, express or implied, to the accuracy, contents or data contained within this document. While Angel Broking
Pvt. Limited endeavors to update on a reasonable basis the information discussed in this material, there may be regulatory, compliance,
or other reasons that prevent us from doing so.
This document is being supplied to you solely for your information, and its contents, information or data may not be reproduced,
redistributed or passed on, directly or indirectly.
Neither Angel Broking Pvt. Limited, nor its directors, employees or affiliates shall be liable for any loss or damage that may arise from or
in connection with the use of this information.
Note: Please refer to the important ‘Stock Holding Disclosure' report on the Angel website (Research Section). Also, please refer to the
latest update on respective stocks for the disclosure status in respect of those stocks. Angel Broking Pvt. Limited and its affiliates may have
investment positions in the stocks recommended in this report.