Market Outlook
March 23, 2016
Market Cues
Domestic Indices
Chg (%)
(Pts)
(Close)
Indian market is expected to open on a flat note tracking the SGX Nifty.
BSE Sensex
0.2
45
25,330
Nifty
0.1
11
7,715
US indices ended mixed as Nasdaq inched up marginally while Dow Jones and
S&P500 ended marginally in red. A lack of major U.S. economic data also kept
Mid Cap
0.5
55
10,499
some traders on the sidelines ahead of reports on new home sales and durable
Small Cap
0.3
29
10,477
goods orders in the coming days. The choppy trading seen throughout the session
Bankex
(0.0)
(2)
18,153
afterward came as some traders are already away from their desks ahead of the
Easter holiday.
Global Indices
Chg (%)
(Pts)
(Close)
The majority of the European markets managed to end in positive. The European
Dow Jones
(0.2)
(41)
17,583
markets were under pressure for most of the session after multiple apparent terrorist
Nasdaq
0.3
13
4,822
attacks were carried out in Belgium.
FTSE
0.1
8
6,193
Indian shares ended a choppy session marginally higher, even as global cues
Nikkei
1.9
324
17,049
remained sluggish in the wake of multiple explosions in Brussels and hawkish
Hang Seng
(0.1)
(17)
20,667
commentary from Federal Reserve officials supporting the case for a hike in U.S.
interest rates as early as April. Narrowing current account deficit figures and rating
Shanghai Com
(0.6)
(19)
2,999
agency ICRA's report projecting improved economic growth in next fiscal helped
underpin investor sentiment to some extent.
Advances / Declines
BSE
NSE
Advances
1,365
843
News & Result Analysis
Declines
1,252
717
Wonderla Holidays to start its Hyderabad Park from April, 2016.
Unchanged
170
75
Ashok Leyland joins hands with Lockheed Martin to cater defence logistics
requirements
Detailed analysis on Pg2
Volumes (` Cr)
Investor’s Ready Reckoner
BSE
3,118
NSE
17,496
Key Domestic & Global Indicators
Stock Watch: Latest investment recommendations on 150+ stocks
Net Inflows (` Cr)
Net
Mtd
Ytd
Refer Pg5 onwards
FII
1,480
16,241
(22,941)
Top Picks
MFs
(335)
(4,125)
70,694
CMP
Target
Upside
Company
Sector
Rating
(`)
(`)
(%)
Amara Raja Batteries Auto & Auto Ancillary
Buy
903
1,040
15.2
Top Gainers
Price (`)
Chg (%)
HCL Tech
IT
Buy
829
1,038
25.3
Justdial
702
9.0
LIC Housing Finance Financials
Buy
478
592
23.8
Torntpharm
1,418
5.3
Bharat Electronics
Capital Goods
Buy
1,191
1,414
18.7
Dlf
115
5.1
Navkar Corporation Others
Buy
163
265
62.9
Relinfra
536
4.8
More Top Picks on Pg4
Sintex
74
4.7
Key Upcoming Events
Previous
Consensus
Date
Region
Event Description
Top Losers
Price (`)
Chg (%)
Reading
Expectations
Mar 25 US
GDP Qoq (Annualized) - % Change
1.00
1.00
Torntpower
229
(7.2)
Apr 1 China
PMI Manufacturing
49.00
---
Vakrangee
193
(6.2)
Apr 5 India
RBI Repo Rate
6.75%
---
Cadilahc
323
(5.3)
Apr 8 India
Imports YoY%
(5.00)
---
Fsl
33
(4.4)
More Events on Pg5
Cox&Kings
185
(4.0)
As on March 22, 2016
Market Outlook
March 23, 2016
Wonderla Holidays to start its Hyderabad Park from April, 2016.
Wonderla Holiday’s Ltd, India’s leading amusement park operator has announced
that the company’s third entertainment park will be officially inaugurated in 3rd
week of April, 2016. The Company already operates two theme parks one each in
Kochi and Bangalore respectively. Spread over 50 acres of land the company has
incurred a capex of `250cr for the Hyderabad Park.
The management expects the park to have the ability to entertain ~10,000 people
per day and will have 43 exciting land and water based rides to satisfy thrill
appetite of all age groups. The company has further said it will add 3 more new
attractions, including India’s first spaced theme Flying Theatre Experience.
The management plans to take up aggressive marketing campaign for the new
park over the next three months. The company had come out with an IPO to fund
the expansion the Hyderabad theme park. In the first year of its operations the
company expects to attract nearly 7 lakh visitors and which it expects can be scaled
up to 12 lakh visitors over the next 4-5 years. The theme park business in India is
growing by 15-20% per annum in India and hence the management expects the
growth target it has set is achievable.
The company also plans to spend ~ `150cr on the Bangalore facility and ~`50cr
on the Kochi facility to upgrade them with additional features similar like the
Hyderabad Park. Looking at the interest for entertainment parks the company
might plan to enter into other state in the coming future after carefully studying the
demand supply scenario. We expect the company deliver 49.5% growth in revenue
in FY17 to `308cr from `206cr, while the EPS is expected to grow to `12.9 by
FY17 from `9 in FY16, with similar margins going ahead. At the CMP of `375 the
stock is trading at 41.6x and 29x its FY16E and FY17E EPS of `9 and `12.9
respectively. We have a NEUTRAL rating on the stock.
Ashok Leyland joins hands with Lockheed Martin to cater
defence logistics requirements
Ashok Leyland Defence Systems (ALDS), has selected US global security and
aerospace company Lockheed Martin, for pursuit of its Indian Armed Forces Light
Specialist Vehicle (LSV) and Light Armored Multipurpose (LAM) vehicle
programmes.
Ashok Leyland, flagship of the Hinduja Group, will serve as the prime contractor,
and provide a will cater to global requirements of these vehicles and variants.
As the largest provider of logistics vehicles to the Indian Army, Ashok Leyland has
a strong portfolio in the defence sector. This partnership will not just further India’s
ambitions under the ‘Make in India’ program, but help the company to provide
robust and meaningful solutions to armed forces across new domains and
geographies. The company is buoyant about the defense segment, and expect its
play to increase manifold. We maintain our ACCUMULATE rating on the stock.
Market Outlook
March 23, 2016
Economic and Political News
Woes for Indians banks to continue in FY17: S&P
Current account deficit to be closer to 1.3% of GDP: India Ratings
India's exports to touch $270 bn by March: Commerce secretary
Corporate News
Bharti's deals with Videocon & ATC are credit positive: Moody's
Maruti Suzuki's SUV Vitara clocks 20,000 bookings within 2 weeks of launch
IDBI Bank to raise Rs 20,000 crore from bonds in FY17
Market Outlook
March 23, 2016
Top Picks
Large Cap
M
arket Cap
CM
P
T
arget
Upsid
e
Company
Rationale
(` Cr)
(`)
(`)
(%)
To outpace battery industry growth due to better technological
Amara Raja Batteries
15,424
903
1,040
15.2
products leading to market share gains in both the automotive
OEM and replacement segments.
Earnings to grow strongly given the MHCV cyclical upturn.
Ashok Leyland
29,441
103
111
7.3
Focus on exports and LCV's provides additional growth
avenue.
Uptick in defense capex by government when coupled with
Bharat Electronics
28,594
1,191
1,414
18.7
BELs strong market positioning, indicate that good times are
ahead for BEL.
The stock is trading at attractive valuations and is factoring all
HCL Tech
1,16,829
829
1,038
25.3
the bad news.
Strong visibility for a robust 20% earnings trajectory, coupled
HDFC Bank
2,66,334
1,054
1,262
19.8
with high quality of earnings on account of high quality retail
business and strategic focus on highly rated corporates.
Back on the growth trend, expect a long term growth of 14%
Infosys
2,74,206
1,190
1,347
13.2
to be a US$20bn in FY2020.
LICHF continues to grow its retail loan book at a healthy pace
with improvement in asset quality. We expect the company to
LIC Housing Finance
24,123
478
592
23.8
post a healthy loan book which is likely to reflect in a strong
earnings growth.
Huge bid pipeline of re-development works at Delhi and other
NBCC
11,326
944
1,089
15.4
State Governments and opportunity from Smart City, positions
NBCC to report strong growth, going forward.
Source: Company, Angel Research
Mid Cap
M
arket Cap
CM
P
T
arget
Upsid
e
Company
Rationale
(` Cr)
(`)
(`)
(%)
Favorable outlook for the AC industry to augur well for
Cooling products business which is out pacing the market
Blue Star
3,340
371
439
18.2
growth. EMPPAC division's profitability to improve once
operating environment turns around.
Commencement of new projects, downtrend in the interest rate
IL&FS Transport
2,405
73
93
27.2
cycle, to lead to stock re-rating
Economic recovery to have favourable impact on advertising &
circulation revenue growth. Further, the acquisition of a radio
Jagran Prakashan
4,990
153
189
23.8
business (Radio City) would also boost the company's revenue
growth.
Speedier execution and speedier sales, strong revenue visibilty
Mahindra Lifespace
1,738
424
554
30.8
in short-to-long run, attractive valuations
Massive capacity expansion along with rail advantage at ICD
Navkar Corporation
2,320
163
265
62.9
as well CFS augurs well for the company
Earnings boost on back of stable material prices and
Radico Khaitan
1,273
96
156
63.1
favourable pricing environment. Valuation discount to peers
provides additional comfort
Strong brands and distribution network would boost growth
Siyaram Silk Mills
914
975
1,354
38.8
going ahead. Stock currently trades at an inexpensive
valuation.
Source: Company, Angel Research
Market Outlook
March 23, 2016
Key Upcoming Events
Global economic events release calendar
Bloomberg Data
Date
Time
Country Event Description
Unit
Period
Last Reported
Estimated
Mar 23, 2016
7:30 PM US New home sales
Thousands Feb
494.00
510.00
Mar 24, 2016
6:00 PM US Initial Jobless claims
ThousandsMar 19
265.00
268.00
Mar 25, 2016
6:00 PM US GDP Qoq (Annualised)
% Change 4Q T
1.00
1.00
Mar 29, 2016
7:30 PM US Consumer Confidence
S.A./ 1985=100 Mar
92.20
94.00
Mar 30, 2016
2:30 PM Euro Zone Euro-Zone Consumer Confidence
Value Mar F
(9.70)
Mar 31, 2016
1:25 PM Germany Unemployment change (000's)
Thousands Mar
(10.00)
2:00 PM UK GDP (YoY)
% Change 4Q F
1.90
Apr 01, 2016
2:00 PM UK PMI Manufacturing
Value Mar
50.80
6:30 AM China PMI Manufacturing
Value Mar
49.00
49.50
6:00 PM US Change in Nonfarm payrolls
Thousands Mar
242.00
200.00
6:00 PM US Unnemployment rate
% Mar
4.90
4.90
Apr 05, 2016
11:00 AM India RBI Reverse Repo rate
% Apr 5
5.75
11:00 AM India RBI Repo rate
% Apr 5
6.75
11:00 AM India RBI Cash Reserve ratio
% Apr 5
4.00
Apr 08, 2016
India Imports YoY%
% Change Mar
(5.00)
India Exports YoY%
% Change Mar
(5.66)
2:00 PM UK Industrial Production (YoY)
% Change Feb
0.20
Apr 11, 2016
7:00 AM China Consumer Price Index (YoY)
% Change Mar
2.30
Apr 12, 2016
5:30 PM India Industrial Production YoY
% Change Feb
(1.50)
Apr 13, 2016
US Producer Price Index (mom)
% Change Mar
(0.60)
China Exports YoY%
% Change Mar
(25.40)
Apr 14, 2016
12:00 PM India Monthly Wholesale Prices YoY%
% Change Mar
(0.91)
6:00 PM US Consumer price index (mom)
% Change Mar
(0.20)
2:30 PM Euro Zone Euro-Zone CPI (YoY)
% Mar F
(0.20)
4:30 PM UK BOE Announces rates
% Ratio Apr 14
0.50
0.50
Apr 15, 2016
6:45 PM US Industrial Production
% Mar
(0.49)
7:30 AM China Industrial Production (YoY)
% Change Mar
5.90
7:30 AM China Real GDP (YoY)
% Change 1Q
6.80
Apr 19, 2016
6:00 PM US Housing Starts
Thousands Mar
1,178.00
Source: Bloomberg, Angel Research
Market Outlook
March 23, 2016
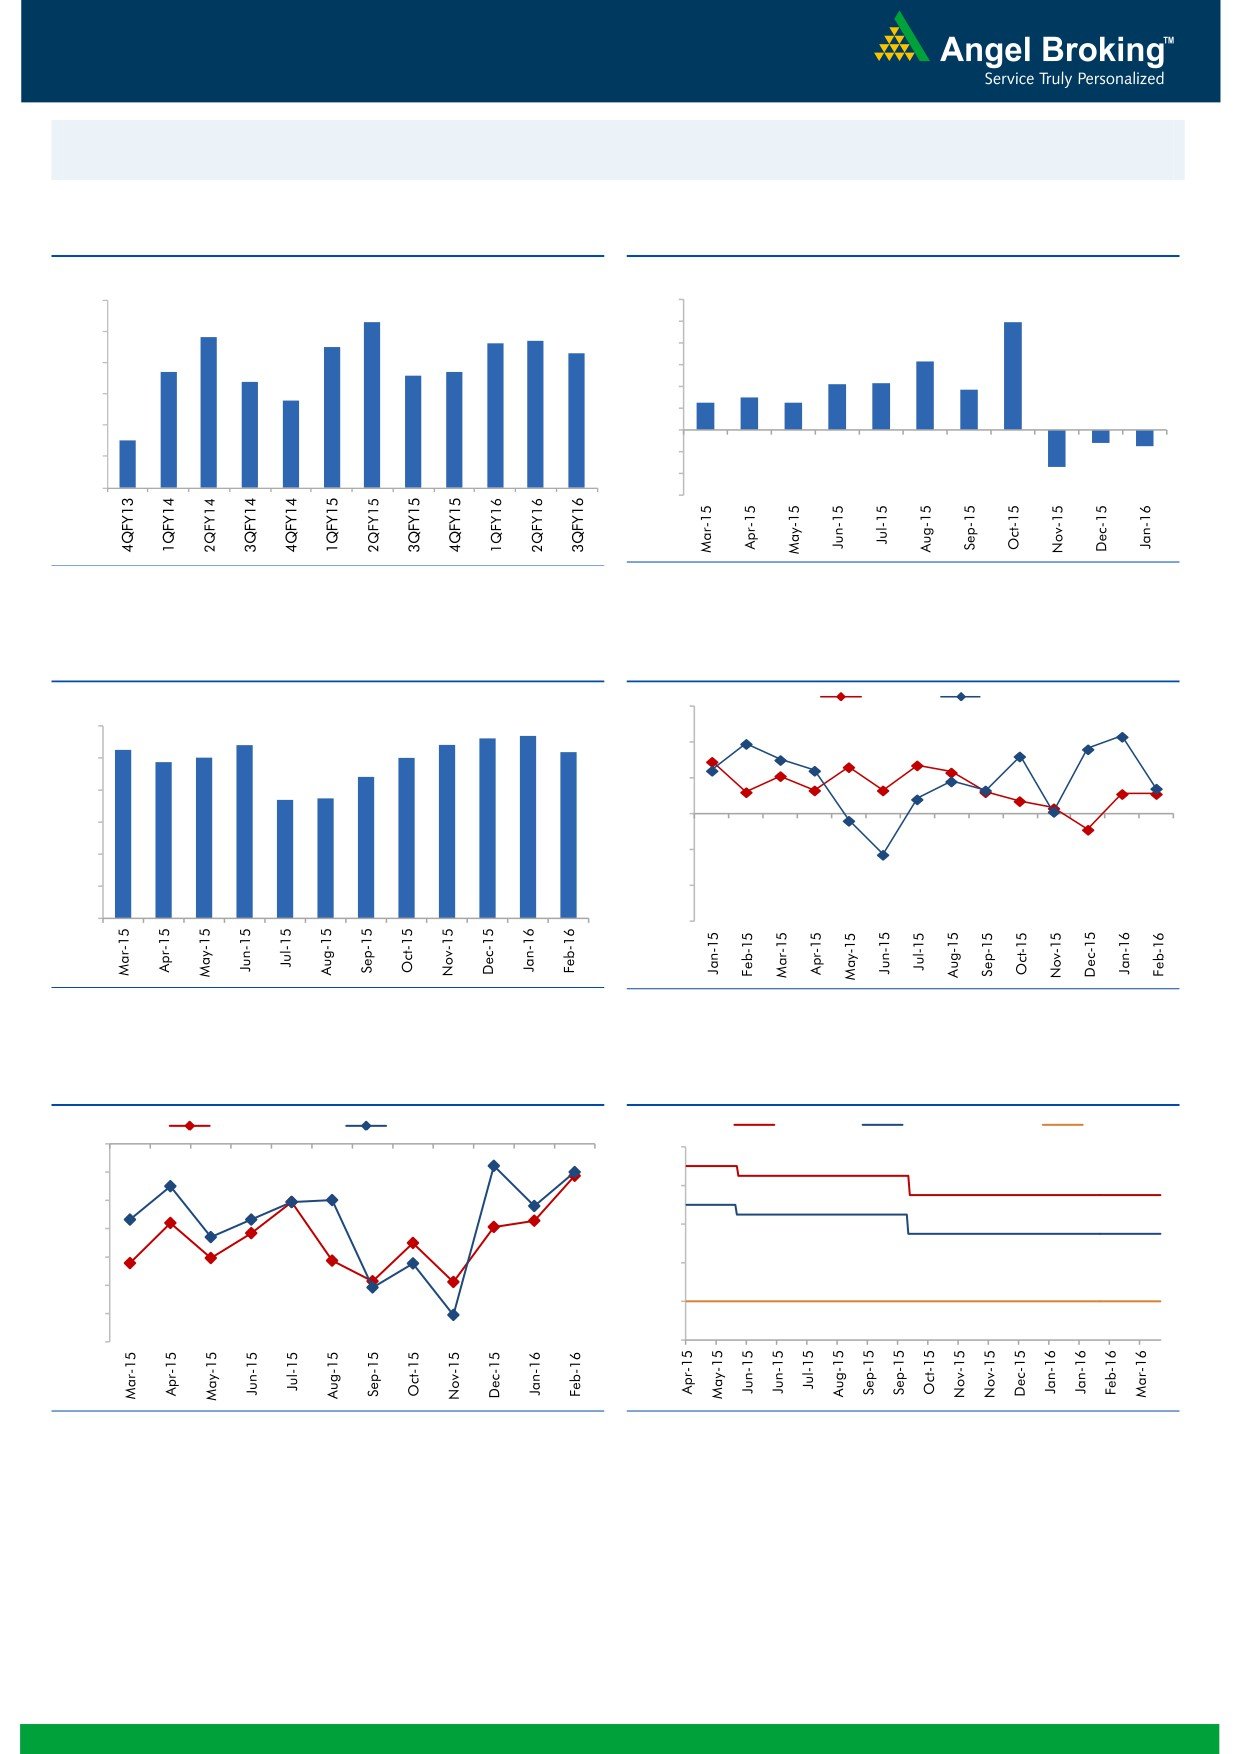
Macro watch
Exhibit 1: Quarterly GDP trends
Exhibit 2: IIP trends
(%)
(%)
9.0
12.0
8.3
9.9
7.8
7.7
10.0
8.0
7.5
7.6
7.3
8.0
6.3
6.7
6.6
6.7
7.0
6.4
6.0
4.2
4.3
3.7
5.8
4.0
2.5
3.0
2.5
6.0
2.0
5.0
4.5
-
4.0
(2.0)
(1.2)
(1.5)
(4.0)
3.0
(3.4)
(6.0)
Source: CSO, Angel Research
Source: MOSPI, Angel Research
Exhibit 3: Monthly CPI inflation trends
Exhibit 4: Manufacturing and services PMI
Mfg. PMI
Services PMI
(%)
56.0
5.6
5.7
6.0
5.4
5.4
5.3
5.2
4.9
5.0
5.0
54.0
5.0
4.4
3.7
3.7
52.0
4.0
50.0
3.0
2.0
48.0
1.0
46.0
-
44.0
Source: MOSPI, Angel Research
Source: Market, Angel Research; Note: Level above 50 indicates expansion
Exhibit 5: Exports and imports growth trends
Exhibit 6: Key policy rates
(%)
Exports yoy growth
Imports yoy growth
(%)
Repo rate
Reverse Repo rate
CRR
0.0
8.00
(5.0)
7.00
(10.0)
6.00
(15.0)
(20.0)
5.00
(25.0)
4.00
(30.0)
(35.0)
3.00
Source: Bloomberg, Angel Research
Source: RBI, Angel Research
Market Outlook
March 23, 2016
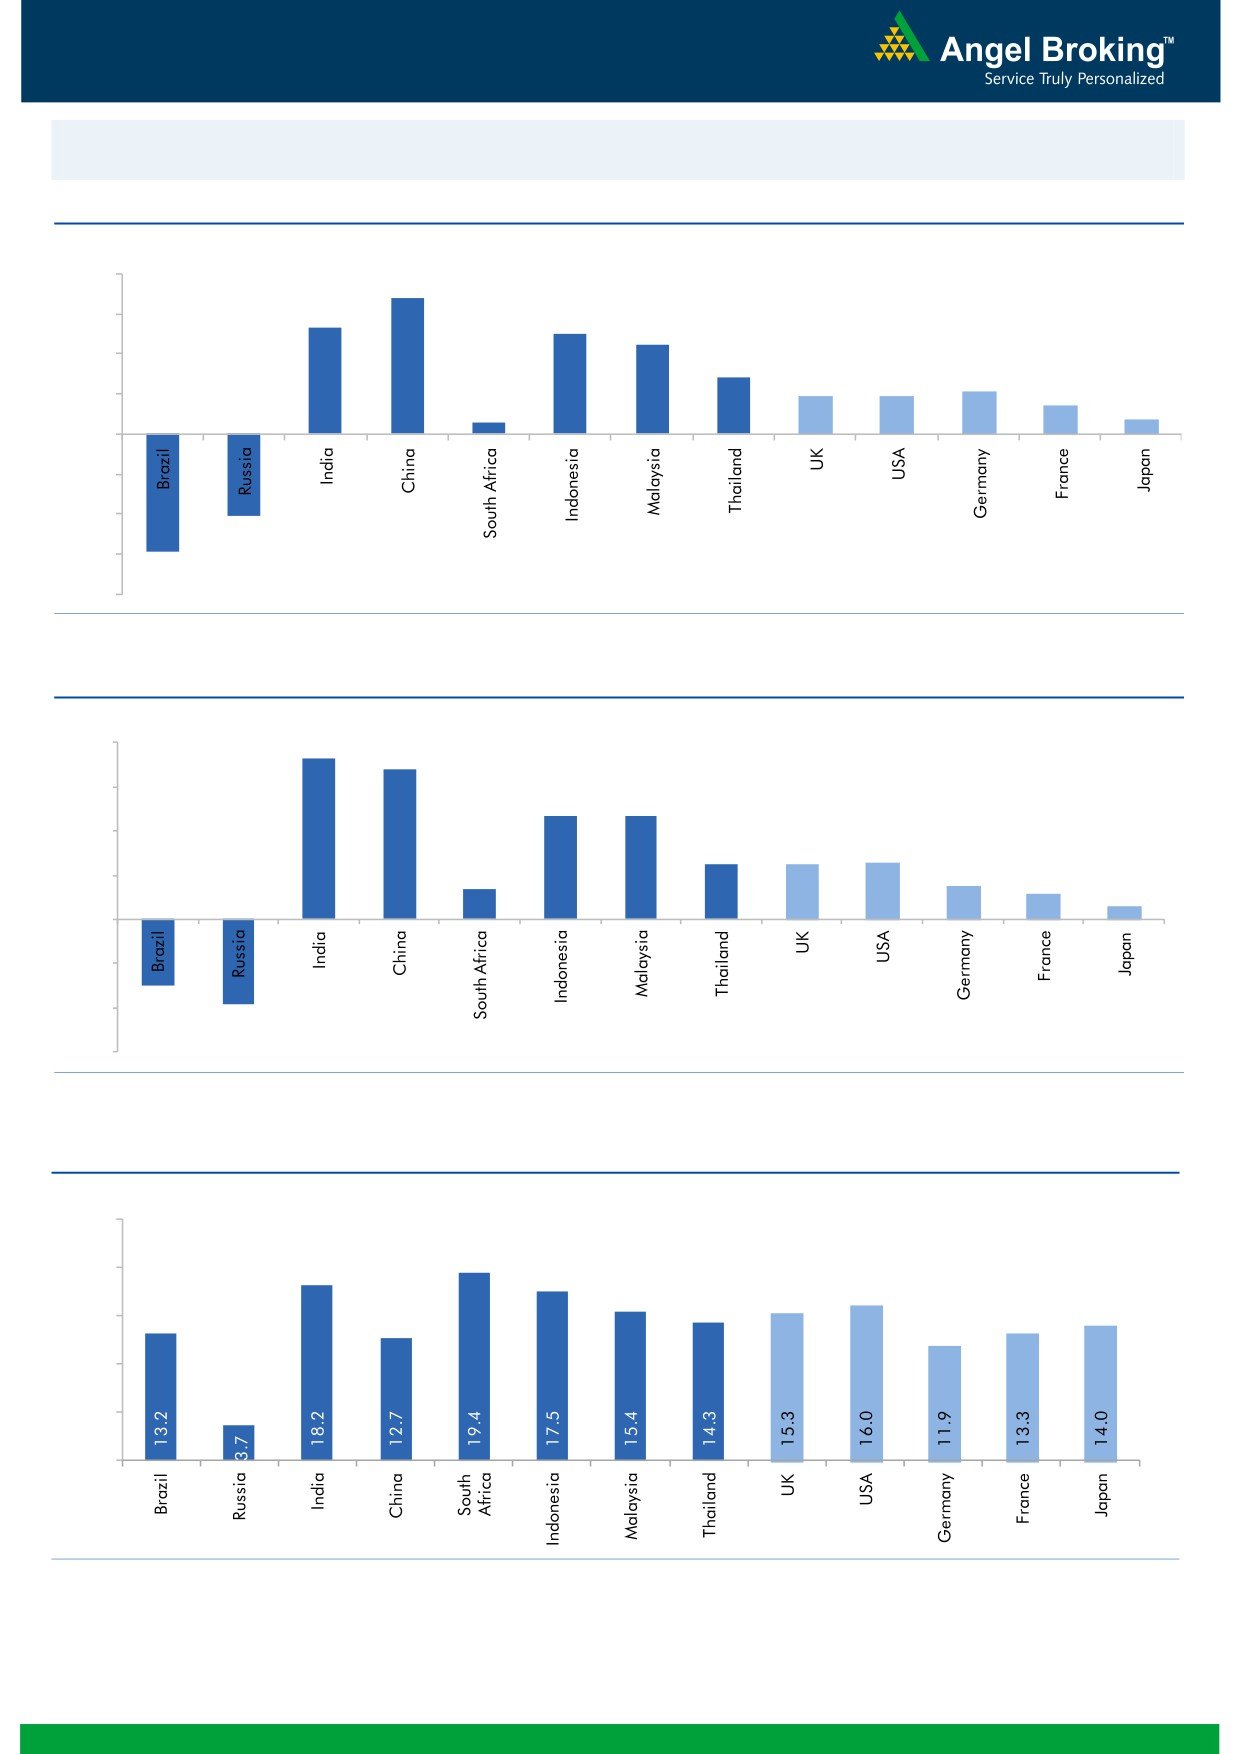
Global watch
Exhibit 1: Latest quarterly GDP Growth (%, yoy) across select developing and developed countries
(%)
8.0
6.8
6.0
5.3
5.0
4.5
4.0
2.8
1.9
1.9
2.1
1.4
2.0
0.6
0.7
-
(2.0)
(4.0)
(4.1)
(6.0)
(5.9)
(8.0)
Source: Bloomberg, Angel Research
Exhibit 2: 2015 GDP Growth projection by IMF (%, yoy) across select developing and developed countries
(%)
8.0
7.3
6.8
6.0
4.7
4.7
4.0
2.5
2.5
2.6
1.4
1.5
2.0
1.2
0.6
-
(2.0)
(3.0)
(4.0)
(3.8)
(6.0)
Source: IMF, Angel Research
Exhibit 3: One year forward P-E ratio across select developing and developed countries
(x)
25.0
20.0
15.0
10.0
5.0
-
Source: IMF, Angel Research
Market Outlook
March 23, 2016
Exhibit 4: Relative performance of indices across globe
Returns (%)
Country
Name of index
Closing price
1M
3M
1YR
Brazil
Bovespa
51,010
22.8
14.0
5.0
Russia
Micex
1,903
7.5
9.2
16.9
India
Nifty
7,715
7.3
(0.6)
(11.2)
China
Shanghai Composite
2,999
2.7
(14.5)
(12.9)
South Africa
Top 40
47,319
6.4
7.6
1.6
Mexico
Mexbol
45,632
4.7
4.7
3.7
Indonesia
LQ45
846
0.8
11.8
(10.2)
Malaysia
KLCI
1,725
3.0
5.8
(3.1)
Thailand
SET 50
902
9.7
10.5
(11.0)
USA
Dow Jones
17,583
7.4
0.6
(2.3)
UK
FTSE
6,193
4.1
2.3
(11.4)
Japan
Nikkei
17,049
5.3
(8.2)
(10.2)
Germany
DAX
9,990
5.9
(7.4)
(16.2)
France
CAC
4,432
4.2
(3.6)
(13.4)
Source: Bloomberg, Angel Research
Stock Watch
March 23, 2016
Company Name
Reco
CMP
Target
Mkt Cap
Sales ( Čcr )
OPM(%)
EPS (Č)
PER(x)
P/BV(x)
RoE(%)
EV/Sales(x)
(Č)
Price ( Č)
( Č cr )
FY16E FY17E
FY16E
FY17E
FY16E
FY17E
FY16E
FY17E
FY16E
FY17E
FY16E
FY17E
FY16E
FY17E
Agri / Agri Chemical
Rallis
Neutral
171
-
3,331
2,097
2,415
14.4
14.4
9.5
11.0
18.0
15.6
3.6
3.1
21.1
21.3
1.6
1.4
United Phosphorus
Accumulate
445
480
19,056
12,500
14,375
18.3
18.3
29.8
35.9
14.9
12.4
2.8
2.3
20.0
20.3
1.6
1.3
Auto & Auto Ancillary
Ashok Leyland
Accumulate
103
111
29,441
17,995
21,544
11.4
11.6
3.4
4.7
30.4
22.0
5.3
4.9
17.7
22.2
1.6
1.3
Bajaj Auto
Accumulate
2,310
2,585
66,834
22,709
25,860
20.9
20.1
129.0
143.6
17.9
16.1
5.5
4.7
30.7
29.4
2.5
2.2
Bharat Forge
Neutral
878
-
20,439
7,351
8,318
19.9
19.7
31.2
36.5
28.1
24.1
5.0
4.3
19.3
19.2
2.9
2.5
Eicher Motors
Accumulate
18,237
20,044
49,533
15,556
16,747
15.5
17.3
464.8
597.5
39.2
30.5
14.3
10.5
36.2
34.3
3.1
2.8
Gabriel India
Buy
86
101
1,232
1,415
1,544
8.7
9.0
4.6
5.4
18.7
15.9
3.4
3.0
18.1
18.9
0.8
0.8
Hero Motocorp
Neutral
2,867
-
57,245
28,244
30,532
15.5
15.9
156.7
168.5
18.3
17.0
7.3
6.2
39.9
36.4
1.9
1.7
Jamna Auto Industries Buy
139
160
1,110
1,281
1,473
11.2
11.5
7.6
9.2
18.3
15.1
4.6
3.8
25.4
25.2
0.9
0.8
L G Balakrishnan & Bros Neutral
436
-
684
1,254
1,394
11.6
11.8
35.9
41.7
12.1
10.5
1.6
1.5
13.5
13.8
0.6
0.6
Mahindra and Mahindra Accumulate
1,253
1,364
77,832
38,416
42,904
13.7
13.9
54.8
63.4
22.9
19.8
3.5
3.1
15.4
15.8
1.7
1.4
Maruti
Neutral
3,699
-
111,752
57,865
68,104
16.4
16.7
176.3
225.5
21.0
16.4
4.1
3.5
19.4
21.2
1.7
1.4
Minda Industries
Neutral
1,018
-
1,615
2,523
2,890
8.7
9.0
55.0
65.4
18.5
15.6
3.6
2.9
19.3
18.7
0.7
0.6
Motherson Sumi
Buy
251
313
33,181
39,343
45,100
8.8
9.1
10.1
12.5
24.8
20.1
7.9
6.2
35.3
34.4
0.9
0.8
Rane Brake Lining
Buy
366
465
290
454
511
11.5
12.0
25.2
31.0
14.5
11.8
2.2
2.0
14.9
16.6
0.8
0.7
Setco Automotive
Neutral
32
-
422
594
741
12.7
13.7
1.7
3.2
18.6
9.9
2.0
1.7
10.4
16.9
1.2
1.0
Tata Motors
Neutral
377
-
108,819
259,686
273,957
13.0
13.4
25.9
29.5
14.6
12.8
1.9
1.7
8.0
9.0
0.6
0.6
TVS Motor
Neutral
317
-
15,067
11,263
13,122
6.9
8.5
9.2
15.0
34.5
21.1
7.9
6.3
22.7
29.6
1.3
1.1
Amara Raja Batteries
Buy
903
1,040
15,424
4,892
5,871
17.4
17.6
28.8
37.1
31.4
24.3
7.3
5.9
23.4
24.1
3.1
2.5
Exide Industries
Buy
136
162
11,560
6,950
7,784
14.4
14.8
6.6
7.3
20.6
18.6
2.6
2.4
12.6
12.8
1.4
1.2
Apollo Tyres
Neutral
179
-
9,091
12,056
12,714
17.2
16.4
23.0
20.3
7.8
8.8
1.4
1.2
17.7
13.6
0.8
0.8
Ceat
Neutral
1,100
-
4,451
6,041
6,597
14.1
13.7
99.5
111.9
11.1
9.8
2.2
1.8
19.6
18.5
0.9
0.8
JK Tyres
Neutral
84
-
1,895
7,446
7,669
15.2
14.0
19.6
18.4
4.3
4.5
1.1
0.9
25.2
19.5
0.7
0.6
Swaraj Engines
Accumulate
861
919
1,069
552
630
14.2
14.7
44.6
54.1
19.3
15.9
4.5
4.1
23.2
25.6
1.8
1.5
Subros
Neutral
87
-
520
1,293
1,527
11.8
11.9
4.2
6.7
20.6
12.9
1.6
1.4
7.7
11.5
0.7
0.6
Indag Rubber
Neutral
164
-
431
283
329
17.0
17.2
13.0
15.4
12.7
10.7
2.8
2.3
21.8
21.6
1.2
1.0
Capital Goods
ACE
Neutral
37
-
369
660
839
4.7
8.2
1.0
3.9
37.3
9.6
1.2
1.0
3.2
11.3
0.7
0.6
BEML
Accumulate
1,091
1,157
4,542
3,277
4,006
6.0
8.9
36.2
64.3
30.1
17.0
2.1
1.9
5.7
11.7
1.5
1.2
Bharat Electronics
Buy
1,191
1,414
28,594
7,737
8,634
16.8
17.2
54.0
61.5
22.1
19.4
3.1
2.8
39.3
45.6
2.8
2.4
Stock Watch
March 23, 2016
Company Name
Reco
CMP
Target
Mkt Cap
Sales ( Čcr )
OPM(%)
EPS (Č)
PER(x)
P/BV(x)
RoE(%)
EV/Sales(x)
(Č)
Price ( Č)
( Č cr )
FY16E
FY17E
FY16E
FY17E
FY16E
FY17E
FY16E
FY17E
FY16E
FY17E
FY16E
FY17E
FY16E
FY17E
Capital Goods
Voltas
Buy
273
353
9,017
5,363
5,963
8.0
9.1
11.0
13.8
24.8
19.8
3.8
3.3
16.2
17.9
1.6
1.5
BGR Energy
Neutral
103
-
743
3,615
3,181
9.5
9.4
16.7
12.4
6.2
8.3
0.6
0.6
10.0
7.0
0.6
0.8
BHEL
Neutral
117
-
28,576
33,722
35,272
10.8
11.7
10.5
14.2
11.1
8.2
0.8
0.8
7.0
9.0
0.9
0.9
Blue Star
Buy
371
439
3,340
3,548
3,977
6.3
6.9
13.7
17.2
27.1
21.6
6.8
4.4
26.1
25.4
1.0
0.9
Crompton Greaves
Neutral
47
-
2,946
13,484
14,687
4.9
6.2
4.5
7.1
10.4
6.6
0.7
0.7
7.2
10.8
0.3
0.3
Greaves Cotton
Neutral
125
-
3,045
1,655
1,755
16.6
16.8
7.4
7.8
16.9
16.0
3.4
3.2
21.1
20.6
1.8
1.7
Inox Wind
Buy
272
458
6,033
4,980
5,943
17.0
17.5
26.6
31.6
10.2
8.6
3.1
2.3
35.0
30.0
1.4
1.1
KEC International
Neutral
120
-
3,072
8,791
9,716
6.1
6.8
5.4
8.2
22.1
14.6
2.2
2.0
10.0
14.0
0.6
0.5
Thermax
Neutral
780
-
9,292
6,413
7,525
7.4
8.5
30.5
39.3
25.6
19.8
3.9
3.4
15.0
17.0
1.4
1.2
VATech Wabag
Neutral
545
-
2,969
2,722
3,336
7.9
8.1
19.5
24.6
27.9
22.2
2.9
2.6
11.1
12.4
1.2
1.0
Cement
ACC
Neutral
1,365
-
25,633
13,151
14,757
16.4
18.3
63.9
83.4
21.4
16.4
2.8
2.5
13.3
16.1
1.8
1.5
Ambuja Cements
Neutral
230
-
35,663
11,564
12,556
19.4
20.7
8.9
10.1
25.8
22.8
3.2
3.1
12.8
13.8
2.7
2.5
HeidelbergCement
Neutral
79
-
1,795
1,772
1,926
13.3
15.4
1.0
3.0
79.2
26.4
2.0
1.9
2.6
7.9
1.6
1.4
India Cements
Neutral
86
-
2,648
4,216
4,840
18.0
19.5
4.0
9.9
21.6
8.7
0.9
0.8
4.0
9.5
1.0
0.8
JK Cement
Neutral
640
-
4,475
3,661
4,742
10.1
15.8
7.5
28.5
85.3
22.5
2.6
2.3
7.5
22.9
1.7
1.3
J K Lakshmi Cement
Neutral
335
-
3,947
2,947
3,616
16.7
19.9
11.5
27.2
29.2
12.3
2.8
2.4
9.8
20.8
1.8
1.4
Mangalam Cements
Neutral
239
-
639
1,053
1,347
10.5
13.3
8.4
26.0
28.5
9.2
1.2
1.1
4.3
12.5
1.0
0.7
Orient Cement
Neutral
150
-
3,069
1,854
2,524
21.2
22.2
7.7
11.1
19.5
13.5
2.8
2.4
13.3
15.7
2.4
1.7
Ramco Cements
Neutral
405
-
9,640
4,036
4,545
20.8
21.3
15.1
18.8
26.8
21.5
3.3
2.9
12.9
14.3
2.9
2.5
Shree Cement^
Neutral
12,598
-
43,887
7,150
8,742
26.7
28.6
228.0
345.5
55.2
36.5
8.1
6.8
15.7
20.3
5.9
4.7
UltraTech Cement
Neutral
3,202
-
87,862
24,669
29,265
18.2
20.6
82.0
120.0
39.0
26.7
4.2
3.7
11.3
14.7
3.6
3.1
Construction
ITNL
Buy
73
93
2,405
7,360
8,825
34.0
35.9
7.0
9.0
10.4
8.1
0.4
0.3
3.2
3.7
3.7
3.6
KNR Constructions
Buy
516
603
1,451
937
1,470
14.3
14.0
44.2
38.6
11.7
13.4
2.3
2.0
15.4
15.4
1.6
1.1
Larsen & Toubro
Accumulate
1,237
1,310
115,233
58,870
65,708
8.3
10.3
42.0
53.0
29.5
23.3
2.0
1.9
8.8
11.2
2.2
2.0
Gujarat Pipavav Port
Neutral
175
-
8,458
629
684
51.0
52.2
6.4
5.9
27.3
29.7
3.6
3.3
15.9
12.7
13.1
11.8
MBL Infrastructures
Buy
154
285
637
2,313
2,797
12.2
14.6
19.0
20.0
8.1
7.7
0.8
0.8
11.3
10.6
1.0
0.9
Nagarjuna Const.
Neutral
75
-
4,147
7,892
8,842
8.8
9.1
3.0
5.3
24.9
14.1
1.2
1.2
5.0
8.5
0.8
0.6
PNC Infratech
Accumulate
485
558
2,490
1,873
2,288
13.2
13.5
24.0
32.0
20.2
15.2
2.0
1.8
12.1
12.3
1.4
1.2
Simplex Infra
Neutral
247
-
1,222
5,955
6,829
10.3
10.5
16.0
31.0
15.4
8.0
0.8
0.8
5.3
9.9
0.7
0.6
Stock Watch
March 23, 2016
Company Name
Reco
CMP
Target
Mkt Cap
Sales ( Čcr )
OPM(%)
EPS (Č)
PER(x)
P/BV(x)
RoE(%)
EV/Sales(x)
(Č)
Price ( Č)
( Č cr )
FY16E
FY17E
FY16E
FY17E
FY16E
FY17E
FY16E
FY17E
FY16E
FY17E
FY16E
FY17E
FY16E
FY17E
Construction
Power Mech Projects
Neutral
567
-
834
1,539
1,801
12.8
12.7
59.0
72.1
9.6
7.9
1.4
1.2
18.6
16.8
0.6
0.5
Sadbhav Engineering
Accumulate
269
289
4,607
3,481
4,219
10.7
10.8
8.2
11.7
32.8
23.0
3.1
2.7
10.3
13.5
1.6
1.3
NBCC
Buy
944
1,089
11,326
5,816
7,382
6.9
7.7
29.6
39.8
31.9
23.7
5.7
4.5
24.1
26.7
1.7
1.3
MEP Infra
Neutral
39
-
638
1,956
1,876
28.1
30.5
1.3
3.0
30.2
13.1
6.3
4.3
21.2
32.8
1.7
1.7
SIPL
Neutral
87
-
3,049
675
1,042
62.4
64.7
-
-
3.2
3.7
-
-
16.2
10.9
Engineers India
Neutral
168
-
5,666
1,667
1,725
13.5
16.0
9.7
11.4
17.3
14.8
2.0
2.0
11.7
13.4
2.2
2.2
Financials
Allahabad Bank
Neutral
53
-
3,192
8,569
9,392
2.8
2.9
16.3
27.5
3.3
1.9
0.3
0.2
7.6
11.9
-
-
Axis Bank
Accumulate
441
494
104,966
26,473
31,527
3.5
3.6
35.7
43.5
12.3
10.1
2.1
1.8
17.9
18.9
-
-
Bank of Baroda
Neutral
146
-
33,744
18,485
21,025
1.9
2.0
13.5
21.1
10.9
6.9
0.9
0.8
7.3
10.6
-
-
Bank of India
Neutral
98
-
7,953
15,972
17,271
1.9
2.0
15.3
33.4
6.4
2.9
0.3
0.3
3.6
7.6
-
-
Canara Bank
Neutral
193
-
10,488
15,441
16,945
2.0
2.1
46.6
70.4
4.2
2.7
0.4
0.3
8.0
11.2
-
-
Dena Bank
Neutral
29
-
1,862
3,440
3,840
2.1
2.3
7.3
10.0
4.0
2.9
0.3
0.3
6.1
7.9
-
-
Federal Bank
Neutral
50
-
8,555
3,477
3,999
3.0
3.0
5.0
6.2
9.9
8.0
1.0
0.9
10.6
11.9
-
-
HDFC
Neutral
1,167
-
184,296
10,358
11,852
3.3
3.3
41.1
47.0
28.4
24.8
5.4
4.9
24.7
24.9
-
-
HDFC Bank
Buy
1,054
1,262
266,334
38,309
47,302
4.3
4.3
49.3
61.1
21.4
17.3
3.7
3.2
18.5
19.7
-
-
ICICI Bank
Accumulate
234
254
135,876
34,279
39,262
3.3
3.3
21.0
24.4
11.1
9.6
1.9
1.6
14.4
14.7
-
-
IDBI Bank
Neutral
69
-
13,129
9,625
10,455
1.8
1.8
8.5
14.2
8.1
4.9
0.5
0.5
5.9
9.3
-
-
Indian Bank
Neutral
107
-
5,146
6,160
6,858
2.5
2.5
24.5
29.8
4.4
3.6
0.4
0.3
7.7
8.6
-
-
LIC Housing Finance
Buy
478
592
24,123
3,101
3,745
2.5
2.5
33.0
40.2
14.5
11.9
2.7
2.3
19.7
20.5
-
-
Oriental Bank
Neutral
92
-
2,754
7,643
8,373
2.4
2.4
37.2
45.4
2.5
2.0
0.2
0.2
8.2
9.4
-
-
Punjab Natl.Bank
Neutral
86
-
16,867
23,638
26,557
2.8
2.8
17.9
27.2
4.8
3.2
0.5
0.4
8.5
12.0
-
-
South Ind.Bank
Neutral
18
-
2,390
1,965
2,185
2.5
2.5
2.5
3.3
7.1
5.4
0.7
0.6
9.5
11.7
-
-
St Bk of India
Neutral
197
-
153,237
79,958
86,061
2.6
2.6
13.4
20.7
14.7
9.6
1.2
1.1
11.5
12.8
-
-
Union Bank
Neutral
130
-
8,961
12,646
14,129
2.3
2.4
31.0
39.1
4.2
3.3
0.5
0.4
9.8
11.4
-
-
Vijaya Bank
Neutral
31
-
2,676
3,536
3,827
1.9
1.9
5.5
6.7
5.6
4.7
0.5
0.4
7.8
8.8
-
-
Yes Bank
Neutral
834
-
35,071
7,190
9,011
3.2
3.3
58.2
69.7
14.3
12.0
2.6
2.2
19.2
19.6
-
-
FMCG
Asian Paints
Neutral
854
-
81,915
16,553
19,160
16.0
16.2
17.7
21.5
48.3
39.7
12.8
11.5
29.4
31.2
4.8
4.1
Britannia
Neutral
2,744
-
32,926
8,481
9,795
14.0
14.1
65.5
78.3
41.9
35.1
19.8
16.3
38.3
41.2
3.8
3.2
Colgate
Neutral
851
-
23,153
4,836
5,490
19.5
19.7
48.5
53.2
17.6
16.0
12.9
11.2
99.8
97.5
4.7
4.1
Stock Watch
March 23, 2016
Company Name
Reco
CMP
Target
Mkt Cap
Sales ( Čcr )
OPM(%)
EPS (Č)
PER(x)
P/BV(x)
RoE(%)
EV/Sales(x)
(Č)
Price ( Č)
( Č cr )
FY16E FY17E
FY16E
FY17E
FY16E
FY17E
FY16E
FY17E
FY16E
FY17E
FY16E
FY17E
FY16E
FY17E
FMCG
Dabur India
Accumulate
250
267
43,891
9,370
10,265
17.1
17.2
7.3
8.1
34.0
30.8
10.3
8.3
33.7
30.6
4.6
4.2
GlaxoSmith Con*
Neutral
5,988
-
25,182
4,919
5,742
17.2
17.4
168.3
191.2
35.6
31.3
10.1
8.6
28.8
28.9
4.7
4.0
Godrej Consumer
Neutral
1,296
-
44,128
10,168
12,886
16.1
16.1
32.1
38.4
40.4
33.8
8.2
7.6
19.7
21.0
4.4
3.5
HUL
Neutral
871
-
188,549
34,940
38,957
17.5
17.7
20.8
24.7
41.9
35.3
46.6
37.2
110.5
114.2
5.2
4.6
ITC
Accumulate
324
359
260,198
36,804
38,776
37.9
37.9
12.2
12.9
26.5
25.1
7.4
6.5
27.7
25.8
6.6
6.3
Marico
Neutral
245
-
31,603
6,551
7,766
15.7
16.0
10.4
12.5
23.6
19.6
6.9
5.7
33.2
32.4
4.8
4.0
Nestle*
Buy
5,274
6,646
50,853
11,291
12,847
22.2
22.3
158.9
184.6
33.2
28.6
17.4
15.6
55.0
57.3
4.3
3.8
Tata Global
Buy
121
144
7,662
8,635
9,072
9.8
9.9
6.5
7.6
18.7
16.0
1.9
1.8
6.8
7.4
0.8
0.8
IT
HCL Tech^
Buy
829
1,038
116,829
42,038
47,503
21.2
21.5
51.5
57.7
16.1
14.4
3.5
2.7
21.5
18.8
2.4
1.9
Infosys
Accumulate
1,190
1,347
274,206
61,850
69,981
27.5
27.5
59.4
65.7
20.0
18.1
4.3
3.6
21.2
20.1
3.7
3.1
TCS
Buy
2,474
2,854
487,494
108,487
122,590
28.3
28.5
122.8
138.4
20.2
17.9
7.7
7.0
38.0
38.9
4.1
3.6
Tech Mahindra
Accumulate
484
530
46,870
26,524
29,177
16.2
17.0
28.8
33.6
16.8
14.4
3.2
2.8
19.3
19.1
1.5
1.3
Wipro
Buy
553
680
136,640
50,808
56,189
23.7
23.8
37.3
40.7
14.8
13.6
2.8
2.6
19.2
17.7
2.2
1.8
Media
D B Corp
Accumulate
310
356
5,693
2,241
2,495
27.8
27.9
21.8
25.6
14.2
12.1
3.7
3.3
26.7
28.5
2.5
2.2
HT Media
Neutral
79
-
1,840
2,495
2,603
11.2
11.2
7.3
8.6
10.8
9.2
0.9
0.8
7.4
8.1
0.2
0.2
Jagran Prakashan
Buy
153
189
4,990
2,170
2,355
27.2
26.2
8.9
9.9
17.2
15.4
3.6
3.1
20.9
20.5
2.2
2.0
Sun TV Network
Neutral
365
-
14,370
2,779
3,196
70.2
70.5
22.8
27.3
16.0
13.4
3.9
3.6
26.7
28.3
4.9
4.3
Hindustan Media
Neutral
247
-
1,813
920
1,031
20.0
20.0
19.2
20.9
12.9
11.8
2.1
1.8
16.4
15.3
1.5
1.3
Ventures
Metals & Mining
Coal India
Buy
295
380
186,017
76,167
84,130
19.9
22.3
22.4
25.8
13.1
11.4
4.7
4.6
35.5
41.0
1.8
1.6
Hind. Zinc
Neutral
170
-
71,852
14,641
14,026
50.4
50.4
17.7
16.0
9.6
10.6
1.5
1.3
16.2
13.2
2.5
2.4
Hindalco
Neutral
87
-
17,965
104,356
111,186
8.7
9.5
6.7
11.1
12.9
7.9
0.5
0.5
3.5
5.9
0.7
0.6
JSW Steel
Neutral
1,229
-
29,715
42,308
45,147
16.4
20.7
(10.3)
49.5
24.8
1.4
1.3
(1.0)
5.6
1.8
1.6
NMDC
Neutral
101
-
39,925
8,237
10,893
46.6
44.5
10.0
11.7
10.1
8.6
1.1
1.0
12.5
13.0
4.6
3.5
SAIL
Neutral
43
-
17,863
45,915
53,954
7.2
10.5
1.5
4.4
28.7
9.9
0.4
0.4
2.3
4.1
1.0
0.9
Vedanta
Neutral
96
-
28,520
71,445
81,910
26.2
26.3
12.9
19.2
7.5
5.0
0.5
0.5
7.2
8.9
0.8
0.6
Tata Steel
Neutral
309
-
30,054
126,760
137,307
8.9
11.3
6.4
23.1
48.6
13.4
1.0
0.9
2.0
7.1
0.8
0.8
Oil & Gas
Cairn India
Neutral
158
-
29,642
11,323
12,490
49.4
51.0
20.7
20.7
7.6
7.7
0.5
0.5
6.4
6.1
1.7
1.0
GAIL
Neutral
362
-
45,887
64,856
70,933
9.1
9.6
24.0
28.9
15.1
12.5
1.3
1.2
8.8
9.6
0.9
0.8
ONGC
Neutral
216
-
185,055
154,564
167,321
36.8
37.4
28.6
32.5
7.6
6.7
1.0
0.9
12.7
13.5
1.4
1.3
Stock Watch
March 23, 2016
Company Name
Reco
CMP
Target
Mkt Cap
Sales ( Čcr )
OPM(%)
EPS (Č)
PER(x)
P/BV(x)
RoE(%)
EV/Sales(x)
(Č)
Price ( Č)
( Č cr )
FY16E FY17E
FY16E
FY17E
FY16E
FY17E
FY16E
FY17E
FY16E
FY17E
FY16E
FY17E
FY16E
FY17E
Oil & Gas
Petronet LNG
Neutral
256
-
19,208
29,691
31,188
5.8
6.2
12.8
13.4
20.0
19.1
3.0
2.7
15.8
14.8
0.7
0.7
Indian Oil Corp
Buy
394
455
95,601
359,607
402,760
5.9
6.1
42.5
48.7
9.3
8.1
1.2
1.1
14.1
14.4
0.4
0.3
Reliance Industries
Accumulate
1,049
1,150
339,726
304,775
344,392
12.6
13.4
91.3
102.6
11.5
10.2
1.3
1.2
11.8
12.0
1.0
0.9
Pharmaceuticals
Alembic Pharma
Neutral
613
-
11,551
3,274
3,802
26.9
19.4
35.0
28.7
17.5
21.4
7.8
5.9
55.6
31.2
3.5
2.9
Aurobindo Pharma
Accumulate
749
856
43,826
14,923
17,162
22.0
23.0
35.7
42.8
21.0
17.5
6.2
4.6
34.0
30.2
3.3
2.8
Aventis*
Neutral
4,141
-
9,537
2,082
2,371
17.4
20.8
118.2
151.5
35.0
27.3
5.1
4.1
19.9
25.5
4.3
3.5
Cadila Healthcare
Accumulate
323
352
33,087
10,224
11,840
21.0
22.0
14.6
17.6
22.1
18.4
6.1
4.8
30.8
29.0
3.3
2.8
Cipla
Accumulate
537
605
43,102
13,979
16,447
20.2
18.6
25.7
27.5
20.9
19.5
3.4
2.9
17.6
16.1
3.1
2.6
Dr Reddy's
Buy
3,063
3,933
52,228
16,838
19,575
25.0
23.1
167.5
178.8
18.3
17.1
3.8
3.2
23.1
20.4
3.0
2.6
Dishman Pharma
Neutral
341
-
2,751
1,733
1,906
21.5
21.5
17.0
19.9
20.1
17.1
2.0
1.8
10.5
11.2
2.1
1.8
GSK Pharma*
Neutral
3,514
-
29,768
2,870
3,158
20.0
22.1
59.5
68.3
59.1
51.5
17.4
17.9
28.5
34.3
9.9
9.0
Indoco Remedies
Neutral
297
-
2,735
1,033
1,199
15.9
18.2
9.4
13.6
31.6
21.8
4.7
4.0
15.7
19.7
2.7
2.4
Ipca labs
Buy
571
900
7,198
3,363
3,909
12.9
18.6
13.4
28.0
42.6
20.4
3.1
2.7
7.4
14.0
2.4
2.1
Lupin
Neutral
1,550
-
69,825
13,092
16,561
25.0
27.0
50.4
68.3
30.8
22.7
6.4
5.0
22.8
24.7
5.1
3.9
Sun Pharma
Accumulate
844
950
203,147
28,163
32,610
25.8
30.7
17.4
26.9
48.5
31.4
4.6
4.0
13.0
16.6
6.7
5.6
Power
Tata Power
Neutral
62
-
16,715
35,923
37,402
22.6
22.8
4.1
5.2
15.2
12.0
1.2
1.1
7.5
9.3
1.4
1.3
NTPC
Accumulate
128
146
105,872
87,271
99,297
23.5
23.5
11.8
13.3
10.9
9.7
1.2
1.1
11.5
12.2
2.2
2.0
Power Grid
Buy
139
170
72,484
20,702
23,361
86.7
86.4
12.1
13.2
11.5
10.5
1.7
1.5
15.6
15.1
8.4
7.8
Real Estate
MLIFE
Buy
424
554
1,738
697
1,011
14.9
19.3
13.8
20.1
30.7
21.1
1.1
1.1
3.8
5.3
3.8
2.6
Telecom
Bharti Airtel
Neutral
351
-
140,429
101,748
109,191
32.1
31.7
12.0
12.5
29.3
28.1
2.0
1.9
6.9
6.7
2.0
1.8
Idea Cellular
Neutral
102
-
36,761
34,282
36,941
32.0
31.5
5.9
6.2
17.3
16.5
1.6
1.4
9.9
9.3
1.7
1.6
zOthers
Abbott India
Neutral
4,716
-
10,020
2,715
3,153
14.5
14.1
134.3
152.2
35.1
31.0
8.8
7.2
27.4
25.6
3.4
2.9
Bajaj Electricals
Buy
197
237
1,991
4,719
5,287
5.2
5.8
8.6
12.7
23.0
15.6
2.6
2.3
11.4
14.8
0.4
0.4
Finolex Cables
Neutral
264
-
4,039
2,520
2,883
12.2
12.0
12.7
14.2
20.8
18.6
2.8
2.5
13.6
13.5
1.3
1.1
Goodyear India*
Buy
478
582
1,103
1,800
1,600
11.7
11.5
58.7
52.9
8.1
9.0
1.8
1.6
24.6
18.7
0.4
0.4
Hitachi
Neutral
1,145
-
3,112
1,779
2,081
7.8
8.8
21.8
33.4
52.5
34.2
8.5
6.9
17.4
22.1
1.8
1.5
Jyothy Laboratories
Neutral
288
-
5,209
1,620
1,847
11.5
11.5
7.3
8.5
39.5
34.0
5.1
4.7
13.3
14.4
3.1
2.6
MRF
Buy
34,818
45,575
14,767
20,316
14,488
21.4
21.1
5,488.0
3,798.0
6.3
9.2
2.2
1.8
41.1
21.2
0.7
0.9
Page Industries
Neutral
11,555
-
12,889
1,929
2,450
19.8
20.1
229.9
299.0
50.3
38.7
22.2
15.4
52.1
47.1
6.7
5.3
Stock Watch
March 23, 2016
Company Name
Reco
CMP
Target
Mkt Cap
Sales ( Čcr )
OPM(%)
EPS (Č)
PER(x)
P/BV(x)
RoE(%)
EV/Sales(x)
(Č)
Price ( Č)
( Č cr )
FY16E
FY17E
FY16E
FY17E
FY16E
FY17E
FY16E
FY17E
FY16E
FY17E
FY16E
FY17E
FY16E
FY17E
zOthers
Relaxo Footwears
Neutral
378
-
4,543
1,767
2,152
12.3
12.5
19.3
25.1
19.7
15.1
4.8
3.7
27.7
27.8
2.6
2.1
Siyaram Silk Mills
Buy
975
1,354
914
1,636
1,815
11.5
11.5
89.9
104.1
10.9
9.4
1.8
1.6
17.9
17.8
0.7
0.6
Styrolution ABS India* Neutral
576
-
1,013
1,271
1,440
8.6
9.2
32.0
41.1
18.0
14.0
1.8
1.6
10.7
12.4
0.8
0.7
TVS Srichakra
Buy
2,361
3,217
1,808
2,035
2,252
15.9
15.3
248.6
268.1
9.5
8.8
4.1
3.0
43.6
33.9
0.9
0.8
HSIL
Accumulate
282
302
2,038
2,123
2,384
16.1
16.5
15.0
18.9
18.7
14.9
1.5
1.4
8.0
9.4
1.3
1.1
Kirloskar Engines India
Neutral
210
-
3,038
2,403
2,554
8.6
9.9
9.2
10.5
22.9
20.0
2.2
2.1
9.7
10.7
0.9
0.8
Ltd
M M Forgings
Buy
452
614
546
511
615
21.7
21.6
43.1
55.8
10.5
8.1
1.9
1.6
19.9
21.2
1.3
1.0
Banco Products (India) Neutral
110
-
786
1,208
1,353
11.0
12.3
10.8
14.5
10.2
7.6
1.2
1.0
11.9
14.5
0.6
0.5
Competent Automobiles Neutral
137
-
84
1,040
1,137
3.2
3.1
25.7
28.0
5.3
4.9
0.8
0.7
15.0
14.3
0.1
0.1
Nilkamal
Neutral
1,121
-
1,672
1,871
2,031
10.7
10.5
63.2
69.8
17.7
16.1
2.9
2.5
17.6
16.6
0.9
0.8
Visaka Industries
Buy
104
144
165
1,086
1,197
9.9
10.3
21.5
28.8
4.8
3.6
0.5
0.4
9.6
11.6
0.4
0.3
Transport Corporation of
Neutral
283
-
2,152
2,830
3,350
8.8
9.0
14.4
18.3
19.7
15.5
3.0
2.6
15.4
17.1
0.9
0.8
India
Elecon Engineering
Neutral
58
-
636
1,359
1,482
10.3
13.7
0.8
3.9
72.7
15.0
1.2
1.1
1.6
7.8
0.8
0.7
Surya Roshni
Buy
138
201
604
2,992
3,223
8.1
8.4
14.7
18.3
9.4
7.5
0.9
0.8
9.7
11.0
0.5
0.4
MT Educare
Neutral
168
-
670
286
366
18.3
17.7
7.7
9.4
21.8
18.0
4.6
4.0
20.2
21.1
2.2
1.7
Radico Khaitan
Buy
96
156
1,273
1,517
1,635
12.7
13.4
5.8
7.1
16.4
13.5
1.4
1.3
8.6
9.6
1.3
1.2
Garware Wall Ropes
Buy
328
473
719
862
974
11.2
11.2
24.9
29.6
13.2
11.1
2.0
1.7
15.1
15.4
0.8
0.7
Wonderla Holidays
Neutral
376
-
2,124
206
308
44.0
43.6
9.0
12.9
41.8
29.1
5.7
5.2
13.7
17.8
10.2
6.8
Linc Pen & Plastics
Neutral
195
-
288
340
371
8.3
8.9
10.8
13.2
18.0
14.7
2.9
2.5
16.0
17.1
0.9
0.8
The Byke Hospitality
Neutral
154
-
617
222
287
20.5
20.5
5.6
7.6
27.3
20.4
5.1
4.2
18.9
20.8
2.8
2.2
Interglobe Aviation
Neutral
844
-
30,401
17,022
21,122
20.7
14.5
63.9
53.7
13.2
15.7
19.8
16.2
149.9
103.2
1.8
1.5
Coffee Day Enterprises
Neutral
228
-
4,706
2,692
2,964
17.0
18.6
-
4.7
-
48.2
2.8
2.6
0.2
5.5
2.1
2.0
Ltd
Navneet Education
Neutral
82
-
1,943
998
1,062
24.1
24.0
5.8
6.1
14.2
13.4
3.1
2.8
22.0
20.6
2.0
1.9
Navkar Corporation
Buy
163
265
2,320
365
436
38.3
37.5
5.6
5.9
28.9
27.7
1.8
1.7
6.3
6.1
7.2
6.2
Source: Company, Angel Research; Note: *December year end; #September year end; &October year end; Price as on March 22, 2016
Market Outlook
March 23, 2016
Research Team Tel: 022 - 39357800
DISCLAIMER
Angel Broking Private Limited (hereinafter referred to as “Angel”) is a registered Member of National Stock Exchange of India Limited,
Bombay Stock Exchange Limited and Metropolitian Stock Exchange of India Limited. It is also registered as a Depository Participant with
CDSL and Portfolio Manager with SEBI. It also has registration with AMFI as a Mutual Fund Distributor. Angel Broking Private Limited is a
registered entity with SEBI for Research Analyst in terms of SEBI (Research Analyst) Regulations, 2014 vide registration number
INH000000164. Angel or its associates has not been debarred/ suspended by SEBI or any other regulatory authority for accessing
/dealing in securities Market. Angel or its associates including its relatives/analyst do not hold any financial interest/beneficial ownership
of more than 1% in the company covered by Analyst. Angel or its associates/analyst has not received any compensation / managed or co
-managed public offering of securities of the company covered by Analyst during the past twelve months. Angel/analyst has not served as
an officer, director or employee of company covered by Analyst and has not been engaged in market making activity of the company
covered by Analyst.
This document is solely for the personal information of the recipient, and must not be singularly used as the basis of any investment
decision. Nothing in this document should be construed as investment or financial advice. Each recipient of this document should make
such investigations as they deem necessary to arrive at an independent evaluation of an investment in the securities of the companies
referred to in this document (including the merits and risks involved), and should consult their own advisors to determine the merits and
risks of such an investment.
Reports based on technical and derivative analysis center on studying charts of a stock's price movement, outstanding positions and
trading volume, as opposed to focusing on a company's fundamentals and, as such, may not match with a report on a company's
fundamentals.
The information in this document has been printed on the basis of publicly available information, internal data and other reliable sources
believed to be true, but we do not represent that it is accurate or complete and it should not be relied on as such, as this document is for
general guidance only. Angel Broking Pvt. Limited or any of its affiliates/ group companies shall not be in any way responsible for any
loss or damage that may arise to any person from any inadvertent error in the information contained in this report. Angel Broking Pvt.
Limited has not independently verified all the information contained within this document. Accordingly, we cannot testify, nor make any
representation or warranty, express or implied, to the accuracy, contents or data contained within this document. While Angel Broking
Pvt. Limited endeavors to update on a reasonable basis the information discussed in this material, there may be regulatory, compliance,
or other reasons that prevent us from doing so.
This document is being supplied to you solely for your information, and its contents, information or data may not be reproduced,
redistributed or passed on, directly or indirectly.
Neither Angel Broking Pvt. Limited, nor its directors, employees or affiliates shall be liable for any loss or damage that may arise from or
in connection with the use of this information.
Note: Please refer to the important ‘Stock Holding Disclosure' report on the Angel website (Research Section). Also, please refer to the
latest update on respective stocks for the disclosure status in respect of those stocks. Angel Broking Pvt. Limited and its affiliates may have
investment positions in the stocks recommended in this report.