Market Outlook
July 22, 2016
Market Cues
Domestic Indices
Chg (%)
(Pts)
(Close)
Indian markets are expected to open flat tracking SGX Nifty.
BSE Sensex
(0.7)
(205)
27,711
Nifty
(0.7)
(56)
8,510
After showing a lack of direction early in the session, stocks moved to the downside
over the course of the trading day on Thursday. With the pullback on the day, the
Mid Cap
(0.2)
(23)
12,158
Dow closed lower for the first time in ten sessions. The weakness that emerged on
Small Cap
(0.1)
(17)
12,010
Wall Street was due to profit taking following the upward trend seen over the past
Bankex
(1.7)
(370)
21,357
few weeks.
The European markets ended Thursday's session with mixed results, after fluctuating
Global Indices
Chg (%)
(Pts)
(Close)
between small gains and losses over the course of the day in choppy trade. Travel
Dow Jones
(0.4)
(78)
18,517
stocks were under pressure after some disappointing news from both easyJet and
Nasdaq
(0.3)
(16)
5,074
Deutsche Lufthansa.
FTSE
(0.4)
(29)
6,700
Indian markets fell notably on Thursday as investors awaited the European Central
Nikkei
0.8
128
16,810
Bank meeting later in the day and looked for progress on the GST Bill.
Hang Seng
0.5
118
22,000
News Analysis
Shanghai Com
0.4
11
3,039
Review: HDFC Bank
Detailed analysis on Pg2
Advances / Declines
BSE
NSE
Investor’s Ready Reckoner
Advances
1,046
585
Key Domestic & Global Indicators
Declines
1,655
1,018
Unchanged
183
68
Stock Watch: Latest investment recommendations on 150+ stocks
Refer Pg5 onwards
Volumes (` Cr)
Top Picks
BSE
3,388
CMP
Target
Upside
Company
Sector
Rating
(`)
(`)
(%)
NSE
21,468
Amara Raja
Auto/Auto Ancillary
Buy
877
1,076
22.8
HCL Tech
IT
Buy
725
1,000
37.9
Net Inflows (` Cr)
Net
Mtd
Ytd
LIC Housing
Financials
Buy
503
592
17.7
FII
711
5,680
25,223
Bharat Electronics
Capital Goods
Accumulate
1,238
1,414
14.3
MFs
35
(439)
8,906
Navkar Corporation Others
Buy
212
265
25.3
More Top Picks on Pg3
Top Gainers
Price (`)
Chg (%)
Key Upcoming Events
Enginersin
222
7.2
Previous
Consensus
Date
Region
Event Description
Reading
Expectations
Iifl
240
6.5
July 22 Germany
PMI Services
53.70
53.20
Neyvelilig
78
5.6
July 22 Germany
PMI Manufacturing
54.50
53.40
Welcorp
88
5.0
July 22 UK
PMI Manufacturing
52.10
47.50
Jpassociat
13
4.4
July 26 US
Consumer Confidence
98.00
95.25
6.(
More Events on Pg4
Top Losers
Price (`)
Chg (%)
Jswenergy
79
(4.9)
Wockpharma
991
(4.5)
Pnb
124
(4.4)
Unionbank
131
(4.2)
Kscl
399
(4.1)
As on July 21, 2016
Market Outlook
July 22, 2016
Result Review
HDFC Bank - BUY CMP -`1,228 TP-`1262
HDFC Bank’s business growth during the quarter remained strong with loan
growth of ~23%, this led to 22% growth in net interest income. Other income saw
some moderation growing by only 14%. While top line growth was more or less in
line with expectations, there was a 19% YoY jump in provisions which resulted in
PAT growth of 20%. NIM for the quarter improved by 10 bps QoQ to 4.4% backed
by lower cost of funds. The 23% growth in loan was backed by a strong 33% growth
in Home Loans, while personal loans another area of strength of the bank grew by a
staggering 41%. During the same period credit card business grew by 26%.
After maintaining very stable set of asset quality, for many quarters there was
some visible sign of pressure in asset quality during the quarter as GNPAs went up
to 1.04% from 0.95% yoy. Nearly 40% of the incremental slippages have come
from the SME segment there was no chunky accounts and hence overall the stress
on the loan book seems limited. While the NPA levels seems to have gone up a
bit, it remains much better than other large pvt players and doesn’t to be a cause
of concern. The rise in provisions during the quarter is partly due to the slippages
from the SME and also one time provisions of `120 cr towards the loan given to
Punjab Government for food procurement. HDFC bank had been out top pick in
the banking space, and we believe it will be able to deliver 20% CAGR earnings
growth going ahead. HDFC Bank has always traded at premium valuations and
likely to continue so, backed by high return ratios and capital adequacy. At the
current level the stock trades at
3.1x its FY18 Adj BV, We maintain our
ACCUMULATE rating on the stock.
Economic and Political News
OIPL's Rs 29k-cr power project gets stage-I green nod
Proposal to train 10 lakh youth in engineering skills by 2019
42 lakh more LED bulbs to be distributed in Andhra Pradesh
Corporate News
Cairn India's first quarter net profit drops 28%
ITC Q1 net profit up 10% to ` 2,385cr
PVR plans to raise up to `250cr via NCDs
Quarterly Bloomberg Brokers Consensus Estimate
Axis Bank Ltd - July 22, 2016
Particulars (` cr)
1QFY17E
1QFY16
y-o-y (%)
4QFY16 q-o-q (%)
Net profit
1,998
1,978
1.0
2,154
(7.2)
Federal Bank Ltd - July 22, 2016
Particulars (` cr)
1QFY17E
1QFY16
y-o-y (%)
4QFY16 q-o-q (%)
Net profit
159
141
12.3
10
1,448.2
Mahindra & Mahindra Financial Services Ltd - July 22, 2016
Particulars (` cr)
1QFY17E
1QFY16
y-o-y (%)
4QFY16 q-o-q (%)
Net profit
128
89
44.3
370
(65.3)
Market Outlook
July 22, 2016
Top Picks ★★★★★
Large Cap
Market Cap
CMP
Target
Upside
Company
Rationale
(` Cr)
(`)
(`)
(%)
To outpace battery industry growth due to better technological
Amara Raja Batteries
14,973
877
1,076
22.8
products leading to market share gains in both the automotive
OEM and replacement segments.
Uptick in defense capex by government, coupled with BELs
Bharat Electronics
29,701
1,238
1,414
14.3
strong market positioning, indicate good times ahead for BEL.
HCL Tech
1,02,273
725
1,000
37.9
Stock is trading at attractive valuations & factors all bad news.
Back on the growth trend, expect a long term growth of 14% to
Infosys
2,48,150
1,080
1,374
27.2
be a US$20bn in FY2020.
Continues to grow its retail loan book at healthy pace with
LIC Housing Fin.
25,364
503
592
17.7
improvement in asset quality. Expect LICHF to post a healthy
loan book which is likely to reflect in a strong earnings growth.
Strong market positioning within the domestic AC markets to
Voltas
11,073
335
407
21.6
continue, EMP business set to revive
Source: Company, Angel Research
Mid Cap
Market Cap
CMP
Target
Upside
Company
Rationale
(` Cr)
(`)
(`)
(%)
Among the top 4 players in the consumer durables segment.
Bajaj Electricals
2,449
242
268
10.6
Improved profitability backed by turn around in E&P segment.
Strong order book lends earnings visibility.
Favourable outlook for AC industry to augur well for Cooling
Blue Star
4,361
457
495
8.2
products business. EMPPAC division's profitability to improve
once operating environment turns around.
With a focus on the low and medium income (LMI) consumer
Dewan Housing
6,358
218
270
23.9
segment, the company has increased its presence in tier-II & III
cities where the growth opportunity is immense.
Strong loan growth backed by diversified loan portfolio and
Equitas Holdings
5,824
174
235
35.3
adequate CAR. ROE & ROA likely to remain decent as risk of
dilution remains low. Attractive valuations considering growth.
Expectations of above average monsoon augurs well for
Goodyear India
1,212
525
631
20.1
Goodyear India as it derives ~50% of its turnover from farm
tyre segment.
Commencement of new projects, downtrend in the interest rate
IL&FS Transport
2,602
79
93
17.6
cycle, to lead to stock re-rating
Economic recovery to have favourable impact on advertising &
Jagran Prakashan
5,865
179
205
14.3
circulation revenue growth. Further, the acquisition of a radio business
(Radio City) would also boost the company's revenue growth.
Speedier execution and speedier sales, strong revenue visibility
Mahindra Lifespace
1,877
457
554
21.1
in short-to-long run, attractive valuations
Massive capacity expansion along with rail advantage at ICD
Navkar Corporation
3,017
212
265
25.3
as well CFS augurs well for the company
Earnings boost on back of stable material prices and
Radico Khaitan
1,213
91
125
37.1
favourable pricing environment. Valuation discount to peers
provides additional comfort
Strong brands and distribution network would boost growth
Siyaram Silk Mills
972
1,037
1,347
29.9
going ahead. Stock currently trades at an inexpensive
valuation.
Source: Company, Angel Research
Market Outlook
July 22, 2016
Key Upcoming Events
Result Calendar
Date
Company
July 22, 2016
Axis Bank
July 23, 2016
Mphasis, Persistent
July 26, 2016
IDFC, L G Balakrishnan & Bros
July 27, 2016
Asian Paints
July 28, 2016
GSK Pharma
July 29, 2016
Sesa Goa
August 05, 2016
LMW
Colgate
August 08, 2016
Source: Bloomberg, Angel Research
Global economic events release calendar
Bloomberg Data
Date
Time
Country Event Description
Unit
Period
Last Reported Estimated
July 22, 2016
1:00 PM Germany
PMI Services
Value Jul P
53.70
53.20
1:00 PM Germany
PMI Manufacturing
Value Jul P
54.50
53.40
2:00 PM
UK
PMI Manufacturing
Value Jul P
52.10
47.50
Jul 26, 2016
7:30 PM
US
Consumer ConfidenceS.A./ 1985=100
Jul
98.00
95.25
7:30 PM
US
New home sales
Thousands Jun
551.00
560.00
Jul 27, 2016
2:00 PM
UK
GDP (YoY)
% Change 2Q A
2.00
11:30 PM
US
FOMC rate decision
% Jul 27
0.50
0.50
Jul 28, 2016
1:25 PM Germany Unemployment change (000's)
Thousands
Jul
(6.00)
Jul 29, 2016
6:00 PM
US
GDP Qoq (Annualised)
% Change 2Q A
1.10
2.50
6:30 AM
China
PMI Manufacturing
Value
Jul
50.00
Source: Bloomberg, Angel Research
Market Outlook
July 22, 2016
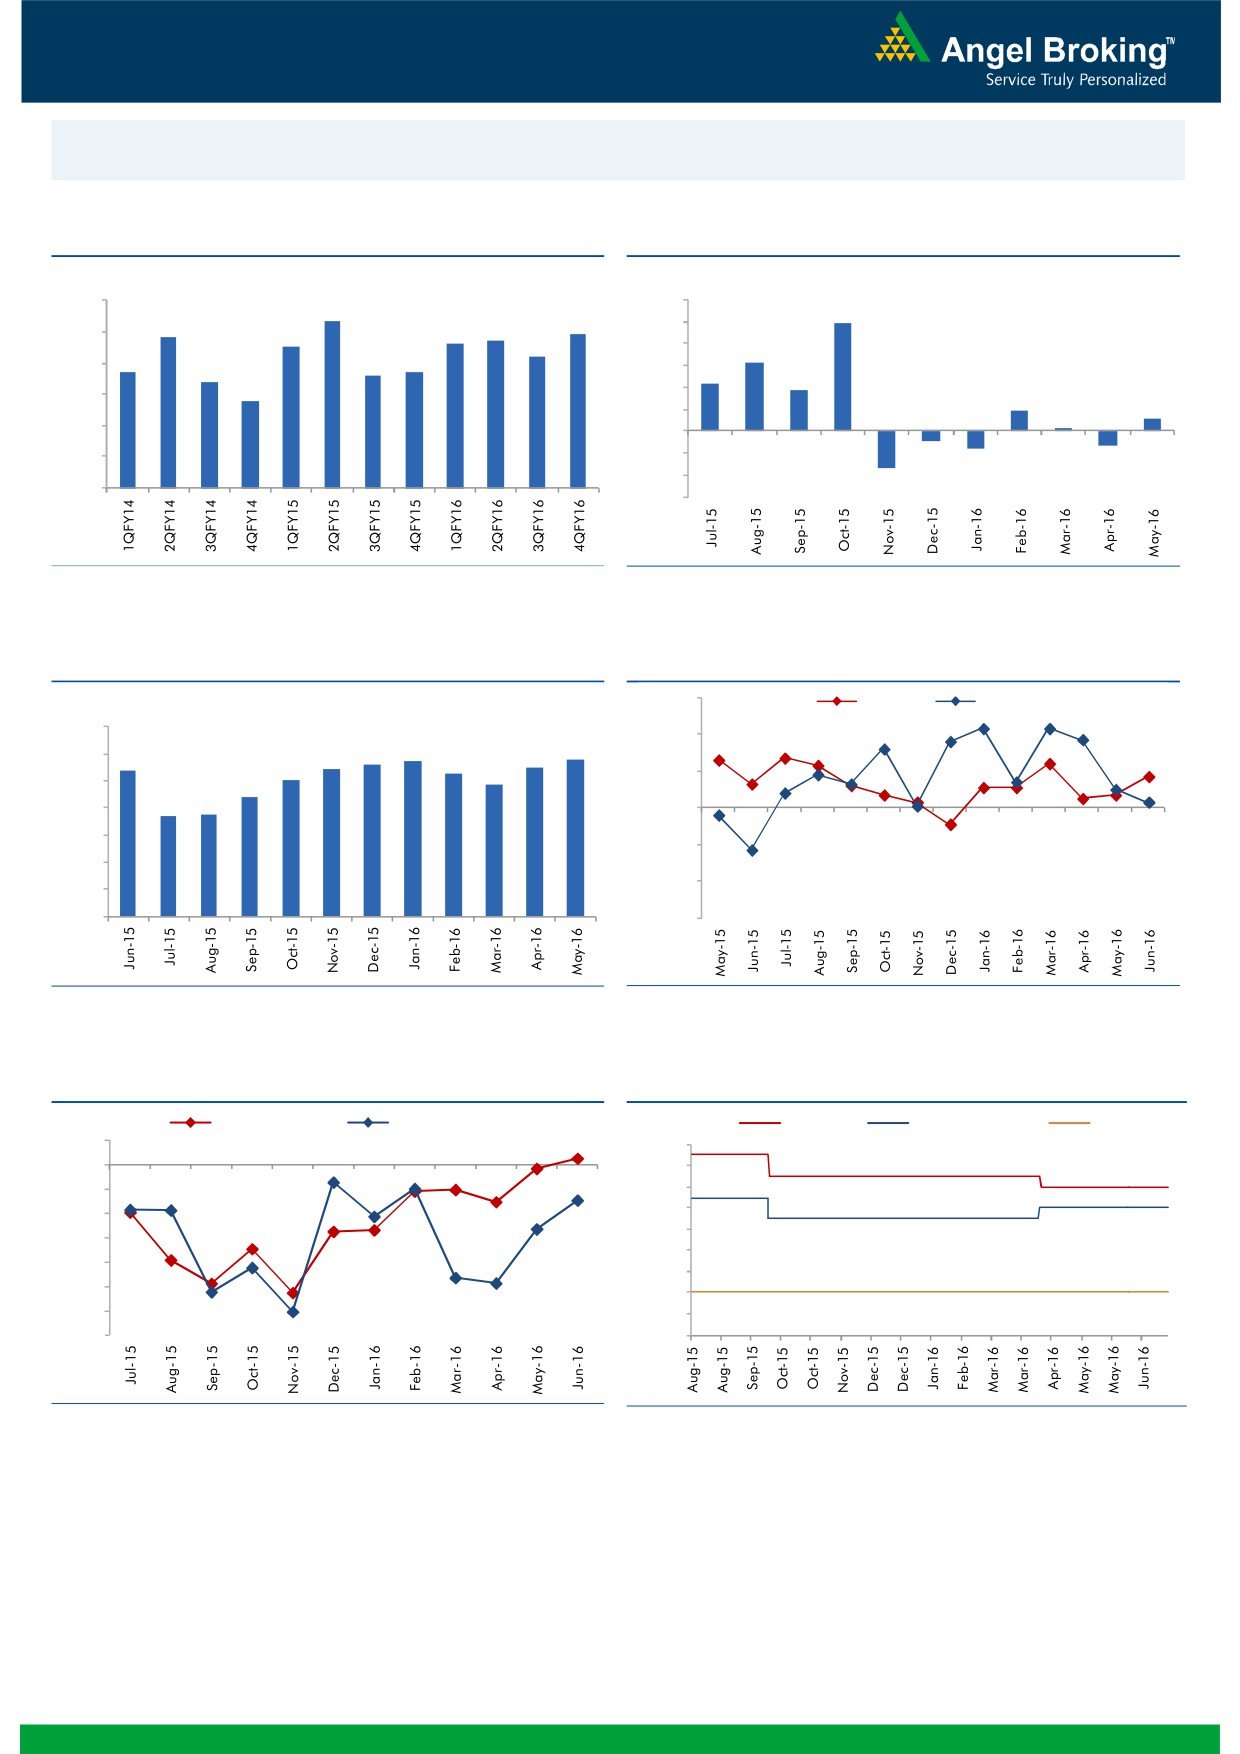
Macro watch
Exhibit 1: Quarterly GDP trends
Exhibit 2: IIP trends
(%)
(%)
9.0
12.0
8.3
9.9
7.8
7.7
7.9
10.0
8.0
7.5
7.6
7.2
8.0
6.3
6.7
6.6
6.7
7.0
6.4
6.0
4.3
3.7
5.8
4.0
6.0
1.9
1.2
2.0
0.3
5.0
-
4.0
(2.0)
(0.9)
(1.3)
(1.6)
(4.0)
3.0
(3.4)
(6.0)
Source: CSO, Angel Research
Source: MOSPI, Angel Research
Exhibit 3: Monthly CPI inflation trends
Exhibit 4: Manufacturing and services PMI
56.0
Mfg. PMI
Services PMI
(%)
7.0
54.0
5.7
5.8
5.4
5.4
5.6
5.5
6.0
5.3
5.0
4.8
52.0
5.0
4.4
3.7
3.7
4.0
50.0
3.0
48.0
2.0
46.0
1.0
-
44.0
Source: MOSPI, Angel Research
Source: Market, Angel Research; Note: Level above 50 indicates expansion
Exhibit 5: Exports and imports growth trends
Exhibit 6: Key policy rates
(%)
Exports yoy growth
Imports yoy growth
(%)
Repo rate
Reverse Repo rate
CRR
5.0
7.50
0.0
7.00
(5.0)
6.50
(10.0)
6.00
5.50
(15.0)
5.00
(20.0)
4.50
(25.0)
4.00
(30.0)
3.50
(35.0)
3.00
Source: Bloomberg, Angel Research
Source: RBI, Angel Research
Market Outlook
July 22, 2016
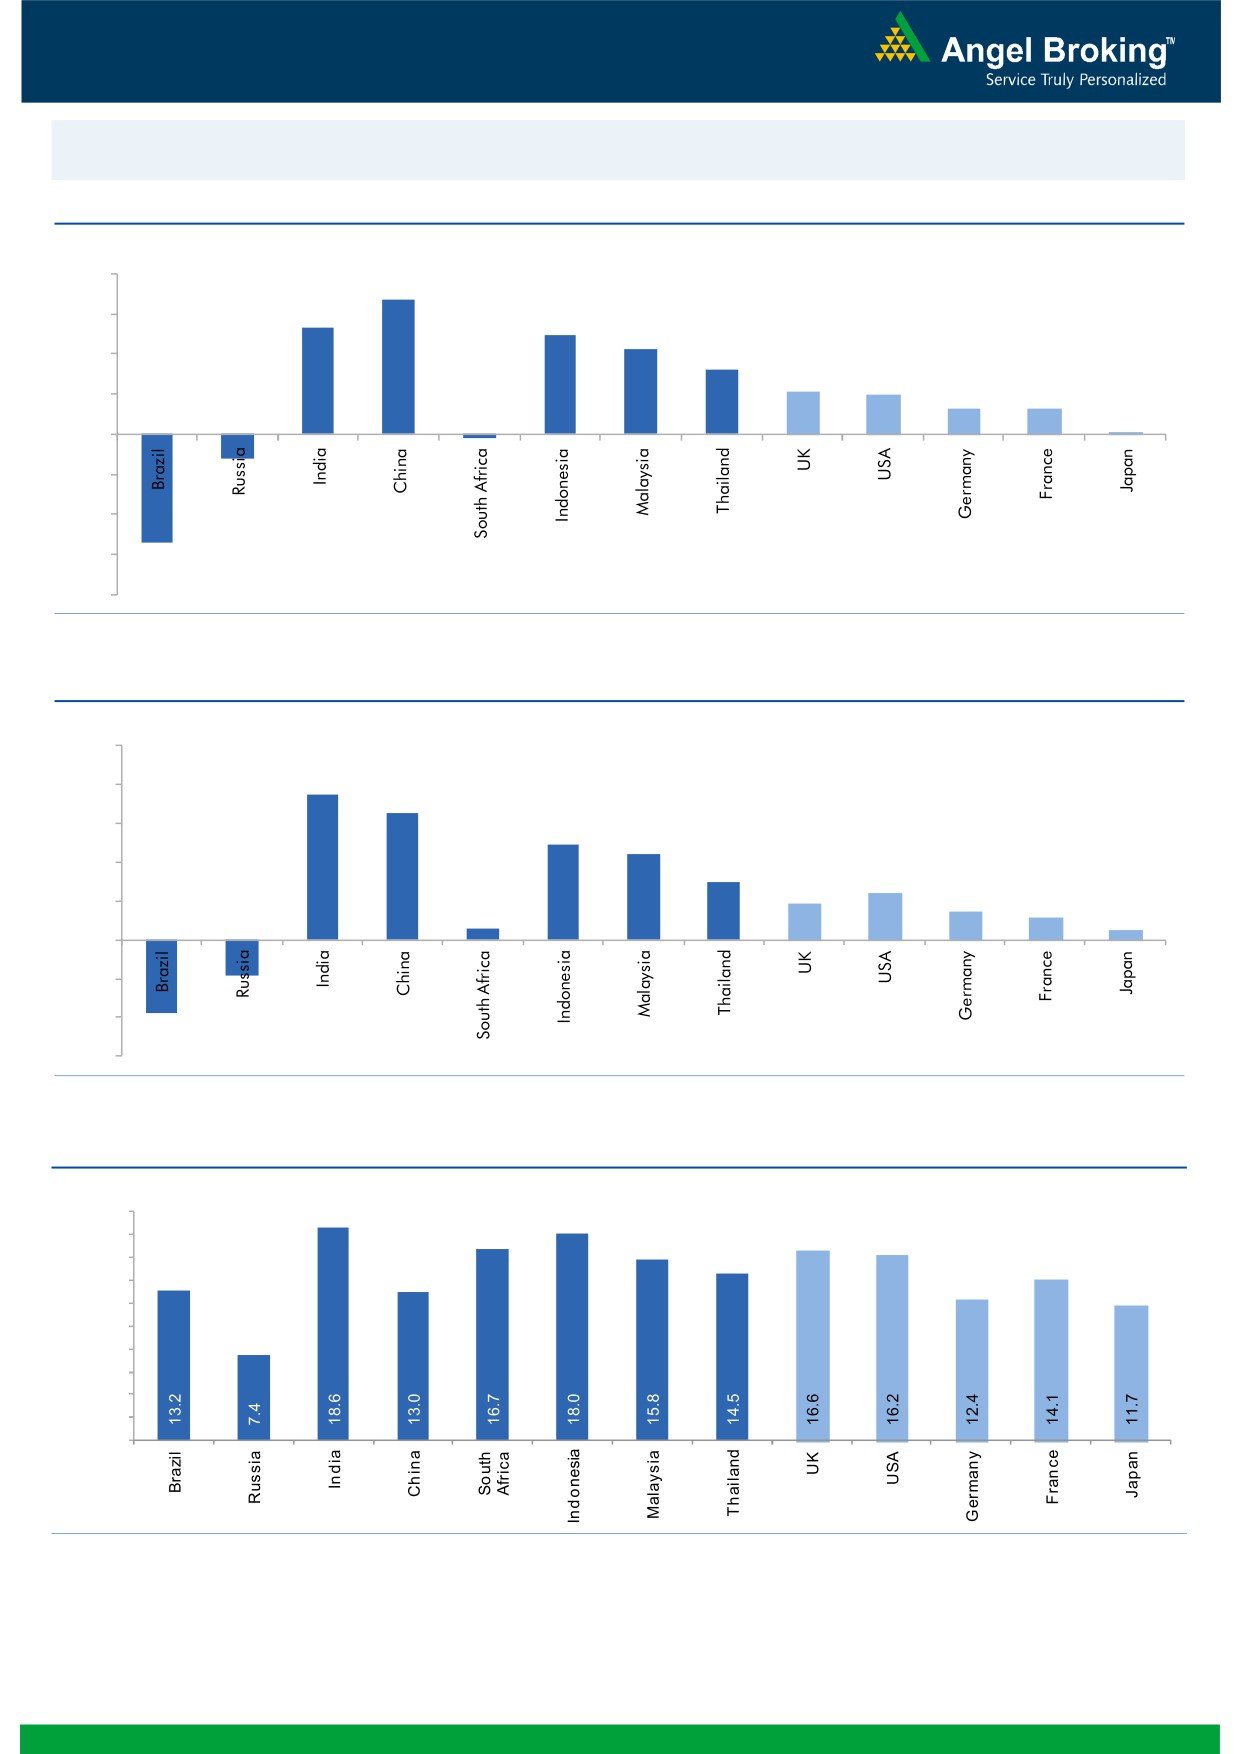
Global watch
Exhibit 1: Latest quarterly GDP Growth (%, yoy) across select developing and developed countries
(%)
8.0
6.7
6.0
5.3
4.9
4.2
4.0
3.2
2.1
2.0
2.0
1.3
1.3
0.1
-
(2.0)
(4.0)
(1.2)
(6.0)
(0.2)
(5.4)
(8.0)
Source: Bloomberg, Angel Research
Exhibit 2: 2016 GDP Growth projection by IMF (%, yoy) across select developing and developed countries
(%)
10.0
7.5
8.0
6.5
6.0
4.9
4.4
4.0
3.0
2.4
1.9
1.5
2.0
1.1
0.6
0.5
(3.8)
(1.8)
-
(2.0)
(4.0)
(6.0)
Source: IMF, Angel Research
Exhibit 3: One year forward P-E ratio across select developing and developed countries
(x)
20.0
18.0
16.0
14.0
12.0
10.0
8.0
6.0
4.0
2.0
-
Source: IMF, Angel Research
Market Outlook
July 22, 2016
Exhibit 4: Relative performance of indices across globe
Returns (%)
Country
Name of index
Closing price
1M
3M
1YR
Brazil
Bovespa
56,641
11.4
5.6
6.7
Russia
Micex
1,928
1.2
1.9
17.9
India
Nifty
8,510
3.3
7.6
(0.2)
China
Shanghai Composite
3,039
4.3
1.9
(22.8)
South Africa
Top 40
46,273
(1.4)
(1.6)
(2.1)
Mexico
Mexbol
47,365
3.6
3.8
5.6
Indonesia
LQ45
899
9.0
7.5
6.5
Malaysia
KLCI
1,658
2.6
(3.5)
(3.4)
Thailand
SET 50
954
6.8
9.6
(1.4)
USA
Dow Jones
18,517
4.0
2.3
4.4
UK
FTSE
6,700
7.6
4.5
1.8
Japan
Nikkei
16,810
5.3
(0.2)
(15.0)
Germany
DAX
10,156
1.4
(2.7)
(8.1)
France
CAC
4,376
0.2
(4.2)
(13.3)
Source: Bloomberg, Angel Research
Stock Watch
July 22, 2016
Company Name
Reco
CMP
Target
Mkt Cap
Sales ( Čcr )
OPM(%)
EPS (Č)
PER(x)
P/BV(x)
RoE(%)
EV/Sales(x)
(Č)
Price ( Č)
( Č cr )
FY16E FY17E
FY16E
FY17E
FY16E
FY17E
FY16E
FY17E
FY16E
FY17E
FY16E
FY17E
FY16E
FY17E
Agri / Agri Chemical
Rallis
Neutral
211
-
4,098
1,612
1,911
13.3
13.3
7.4
9.5
28.5
22.2
4.6
4.1
16.7
18.4
2.6
2.2
United Phosphorus
Buy
559
684
23,955
13,083
15,176
18.5
18.5
31.5
37.4
17.7
14.9
3.5
2.9
21.4
21.4
2.0
1.7
Auto & Auto Ancillary
Ashok Leyland
Buy
97
111
27,562
17,995
21,544
11.4
11.6
3.4
4.7
28.5
20.6
5.0
4.6
17.7
22.2
1.4
1.1
Bajaj Auto
Neutral
2,765
-
80,007
22,709
25,860
20.9
20.1
129.0
143.6
21.4
19.3
6.6
5.7
30.7
29.4
3.0
2.6
Bharat Forge
Buy
728
875
16,944
7,351
8,318
19.9
19.7
31.2
36.5
23.3
19.9
4.2
3.5
19.3
19.2
2.4
2.1
Eicher Motors
Neutral
19,700
-
53,508
15,556
16,747
15.5
17.3
464.8
597.5
42.4
33.0
15.5
11.4
36.2
34.3
3.4
3.1
Gabriel India
Neutral
101
-
1,455
1,415
1,544
8.7
9.0
4.6
5.4
22.0
18.8
4.0
3.5
18.1
18.9
1.0
0.9
Hero Motocorp
Neutral
3,266
-
65,211
28,244
30,532
15.5
15.9
156.7
168.5
20.8
19.4
8.3
7.1
39.9
36.4
2.1
1.9
Jamna Auto Industries Neutral
172
-
1,371
1,281
1,473
11.2
11.5
7.6
9.2
22.6
18.7
5.7
4.7
25.4
25.2
1.1
1.0
L G Balakrishnan & Bros Neutral
495
-
777
1,254
1,394
11.6
11.8
35.9
41.7
13.8
11.9
1.9
1.6
13.5
13.8
0.7
0.7
Mahindra and Mahindra Neutral
1,435
-
89,111
38,416
42,904
13.7
13.9
54.8
63.4
26.2
22.6
4.0
3.6
15.4
15.8
2.0
1.8
Maruti
Neutral
4,416
-
133,399
57,865
68,104
16.4
16.7
176.3
225.5
25.1
19.6
4.9
4.1
19.4
21.2
2.1
1.7
Minda Industries
Neutral
1,165
-
1,848
2,523
2,890
8.7
9.0
55.0
65.4
21.2
17.8
4.1
3.3
19.3
18.7
0.8
0.7
Motherson Sumi
Neutral
308
-
40,701
39,343
45,100
8.8
9.1
10.1
12.5
30.5
24.6
9.7
7.6
35.3
34.4
1.1
1.0
Rane Brake Lining
Neutral
571
-
452
454
511
11.5
12.0
25.2
31.0
22.7
18.4
3.4
3.1
14.9
16.6
0.9
0.8
Setco Automotive
Neutral
47
-
633
594
741
12.7
13.7
1.7
3.2
27.9
14.8
2.9
2.5
10.4
16.9
1.5
1.2
Tata Motors
Neutral
491
-
141,661
259,686
273,957
13.0
13.4
25.9
29.5
18.9
16.6
2.5
2.2
8.0
9.0
0.7
0.7
TVS Motor
Accumulate
300
330
14,264
11,263
13,122
6.9
8.5
9.2
15.0
32.6
20.0
7.5
5.9
22.7
29.6
1.3
1.1
Amara Raja Batteries
Buy
877
1,076
14,973
4,690
5,429
17.5
17.5
28.5
35.3
30.8
24.8
7.1
5.9
23.1
25.9
3.2
2.7
Exide Industries
Neutral
175
-
14,841
6,950
7,784
14.4
14.8
6.6
7.3
26.5
23.9
3.3
3.0
12.6
12.8
1.9
1.7
Apollo Tyres
Buy
157
183
8,007
12,056
12,714
17.2
16.4
23.0
20.3
6.8
7.8
1.2
1.1
17.7
13.6
0.7
0.7
Ceat
Buy
878
1,119
3,553
6,041
6,597
14.1
13.7
99.5
111.9
8.8
7.9
1.7
1.5
19.6
18.5
0.7
0.6
JK Tyres
Neutral
89
-
2,028
7,446
7,669
15.2
14.0
19.6
18.4
4.6
4.9
1.2
1.0
25.2
19.5
0.7
0.6
Swaraj Engines
Neutral
1,142
-
1,418
552
630
14.2
14.7
44.6
54.1
25.6
21.1
6.0
5.4
23.2
25.6
2.4
2.1
Subros
Neutral
93
-
557
1,293
1,527
11.8
11.9
4.2
6.7
22.1
13.9
1.7
1.5
7.7
11.5
0.7
0.6
Indag Rubber
Neutral
185
-
487
283
329
17.0
17.2
13.0
15.4
14.3
12.0
3.1
2.6
21.8
21.6
1.5
1.2
Capital Goods
ACE
Neutral
45
-
440
660
839
4.7
8.2
1.0
3.9
44.5
11.4
1.4
1.2
3.2
11.3
0.8
0.6
BEML
Buy
957
1,157
3,985
3,277
4,006
6.0
8.9
36.2
64.3
26.4
14.9
1.8
1.7
5.7
11.7
1.3
1.0
Bharat Electronics
Accumulate
1,238
1,414
29,701
7,295
8,137
20.0
16.8
56.5
58.7
21.9
21.1
3.3
2.9
42.1
44.6
3.3
2.8
Stock Watch
July 22, 2016
Company Name
Reco
CMP
Target
Mkt Cap
Sales ( Čcr )
OPM(%)
EPS (Č)
PER(x)
P/BV(x)
RoE(%)
EV/Sales(x)
(Č)
Price ( Č)
( Č cr )
FY16E
FY17E
FY16E
FY17E
FY16E
FY17E
FY16E
FY17E
FY16E
FY17E
FY16E
FY17E
FY16E
FY17E
Capital Goods
Voltas
Buy
335
407
11,073
5,857
6,511
7.5
7.9
11.7
12.9
28.6
25.9
4.7
4.1
17.1
16.7
1.9
1.7
BGR Energy
Neutral
119
-
857
3,615
3,181
9.5
9.4
16.7
12.4
7.1
9.6
0.7
0.7
10.0
7.0
0.7
0.8
BHEL
Neutral
140
-
34,230
33,722
35,272
10.8
11.7
10.5
14.2
13.3
9.9
1.0
0.9
7.0
9.0
1.1
1.1
Blue Star
Accumulate
457
495
4,361
3,770
4,351
5.7
6.4
11.4
17.2
40.0
26.6
6.2
5.8
18.4
23.1
1.1
1.0
Crompton Greaves
Neutral
72
-
4,525
13,484
14,687
4.9
6.2
4.5
7.1
16.0
10.2
1.1
1.1
7.2
10.8
0.5
0.4
Greaves Cotton
Neutral
144
-
3,517
1,655
1,755
16.6
16.8
7.4
7.8
19.5
18.5
3.9
3.7
21.1
20.6
2.0
1.9
Inox Wind
Buy
228
286
5,056
5,605
6,267
15.7
16.4
24.8
30.0
9.2
7.6
2.6
1.9
25.9
24.4
1.0
0.9
KEC International
Neutral
140
-
3,602
8,791
9,716
6.1
6.8
5.4
8.2
25.9
17.1
2.6
2.4
10.0
14.0
0.6
0.6
Thermax
Neutral
906
-
10,791
6,413
7,525
7.4
8.5
30.5
39.3
29.7
23.0
4.6
4.0
15.0
17.0
1.7
1.4
VATech Wabag
Accumulate
588
681
3,204
3,136
3,845
8.9
9.1
26.0
35.9
22.6
16.4
2.8
2.4
13.4
15.9
1.0
0.8
Cement
ACC
Neutral
1,701
-
31,941
13,151
14,757
16.4
18.3
63.9
83.4
26.6
20.4
3.4
3.1
13.3
16.1
2.1
1.8
Ambuja Cements
Neutral
266
-
41,288
11,564
12,556
19.4
20.7
8.9
10.1
29.9
26.3
3.7
3.6
12.8
13.8
3.1
2.9
HeidelbergCement
Neutral
128
-
2,889
1,772
1,926
13.3
15.4
1.0
3.0
127.5
42.5
3.2
3.0
2.6
7.9
2.1
1.8
India Cements
Neutral
115
-
3,522
4,216
4,840
18.0
19.5
4.0
9.9
28.7
11.6
1.1
1.1
4.0
9.5
1.2
0.9
JK Cement
Neutral
705
-
4,931
3,661
4,742
10.1
15.8
7.5
28.5
94.0
24.7
2.8
2.5
7.5
22.9
1.8
1.4
J K Lakshmi Cement
Neutral
419
-
4,935
2,947
3,616
16.7
19.9
11.5
27.2
36.5
15.4
3.5
3.0
9.8
20.8
2.0
1.6
Mangalam Cements
Neutral
303
-
808
1,053
1,347
10.5
13.3
8.4
26.0
36.0
11.6
1.5
1.4
4.3
12.5
1.2
0.9
Orient Cement
Neutral
171
-
3,495
1,854
2,524
21.2
22.2
7.7
11.1
22.2
15.4
3.2
2.7
13.3
15.7
2.7
1.9
Ramco Cements
Neutral
566
-
13,463
4,036
4,545
20.8
21.3
15.1
18.8
37.5
30.1
4.6
4.1
12.9
14.3
3.8
3.3
Shree Cement^
Neutral
16,342
-
56,931
7,150
8,742
26.7
28.6
228.0
345.5
71.7
47.3
10.6
8.9
15.7
20.3
7.4
6.0
UltraTech Cement
Neutral
3,637
-
99,820
24,669
29,265
18.2
20.6
82.0
120.0
44.4
30.3
4.8
4.2
11.3
14.7
4.0
3.4
Construction
ITNL
Accumulate
79
93
2,602
7,360
8,682
34.0
32.2
7.0
8.6
11.3
9.2
0.4
0.4
3.2
2.5
3.7
3.6
KNR Constructions
Accumulate
571
603
1,605
937
1,470
14.3
14.0
44.2
38.6
12.9
14.8
2.6
2.2
15.4
15.4
1.8
1.2
Larsen & Toubro
Accumulate
1,556
1,700
145,044
58,870
65,708
8.3
10.3
42.0
53.0
37.1
29.4
2.6
2.3
8.8
11.2
2.7
2.5
Gujarat Pipavav Port
Neutral
177
-
8,535
629
684
51.0
52.2
6.4
5.9
27.6
29.9
3.6
3.3
15.9
12.7
13.5
12.2
MBL Infrastructures
Buy
137
285
568
2,313
2,797
12.2
14.6
19.0
20.0
7.2
6.9
0.8
0.7
11.3
10.6
1.0
0.9
Nagarjuna Const.
Neutral
79
-
4,397
7,892
8,842
8.8
9.1
3.0
5.3
26.4
14.9
1.3
1.2
5.0
8.5
0.8
0.7
PNC Infratech
Accumulate
566
647
2,901
1,873
2,288
13.2
13.5
24.0
32.0
23.6
17.7
2.3
2.0
12.1
12.3
1.7
1.4
Simplex Infra
Neutral
301
-
1,489
5,955
6,829
10.3
10.5
16.0
31.0
18.8
9.7
1.0
0.9
5.3
9.9
0.8
0.6
Stock Watch
July 22, 2016
Company Name
Reco
CMP
Target
Mkt Cap
Sales ( Čcr )
OPM(%)
EPS (Č)
PER(x)
P/BV(x)
RoE(%)
EV/Sales(x)
(Č)
Price ( Č)
( Č cr )
FY16E
FY17E
FY16E
FY17E
FY16E
FY17E
FY16E
FY17E
FY16E
FY17E
FY16E
FY17E
FY16E
FY17E
Construction
Power Mech Projects
Neutral
546
-
803
1,539
1,801
12.8
12.7
59.0
72.1
9.3
7.6
1.4
1.2
18.6
16.8
0.5
0.5
Sadbhav Engineering
Neutral
293
-
5,023
3,186
3,598
10.2
10.3
8.0
9.0
36.6
32.5
3.4
3.0
9.4
9.9
1.9
1.7
NBCC
Neutral
249
-
14,946
5,838
7,428
6.0
7.9
5.2
8.2
47.9
30.4
1.5
1.2
21.9
28.2
2.3
1.7
MEP Infra
Neutral
44
-
720
1,956
1,876
28.1
30.5
1.3
3.0
34.1
14.8
7.2
4.8
21.2
32.8
1.8
1.8
SIPL
Neutral
100
-
3,505
675
1,042
62.4
64.7
-
-
3.7
4.3
-
-
16.9
11.4
Engineers India
Neutral
222
-
7,495
1,667
1,725
13.5
16.0
9.7
11.4
22.9
19.5
2.7
2.6
11.7
13.4
3.0
3.0
Financials
Allahabad Bank
Neutral
74
-
5,379
8,569
9,392
2.8
2.9
16.3
27.5
4.6
2.7
0.4
0.3
7.6
11.9
-
-
Axis Bank
Neutral
538
-
128,467
26,204
29,738
3.6
3.5
34.5
35.4
15.6
15.2
2.5
2.2
16.8
14.9
-
-
Bank of Baroda
Neutral
152
-
35,081
18,802
21,088
2.0
2.2
(7.4)
13.0
11.7
1.2
1.0
(4.2)
7.3
-
-
Bank of India
Neutral
107
-
10,022
15,972
17,271
1.9
2.0
15.3
33.4
7.0
3.2
0.3
0.3
3.6
7.6
-
-
Canara Bank
Neutral
252
-
13,656
15,441
16,945
2.0
2.1
46.6
70.4
5.4
3.6
0.5
0.4
8.0
11.2
-
-
Dena Bank
Neutral
39
-
2,624
3,440
3,840
2.1
2.3
7.3
10.0
5.4
3.9
0.4
0.3
6.1
7.9
-
-
Dewan Housing Finance Buy
218
270
6,358
1,828
2,225
2.9
3.0
24.9
29.7
8.8
7.4
1.4
1.2
15.1
16.1
-
-
Equitas Holdings
Buy
174
235
5,824
679
1,076
12.4
11.7
6.2
6.7
28.0
25.9
3.5
2.5
13.3
12.5
-
-
Federal Bank
Neutral
61
-
10,481
3,279
3,787
2.8
2.9
3.9
5.5
15.5
11.0
1.3
1.2
8.4
10.8
-
-
HDFC
Neutral
1,332
-
210,585
10,358
11,852
3.3
3.3
41.1
47.0
32.4
28.3
6.2
5.6
24.7
24.9
-
-
HDFC Bank
Neutral
1,228
-
311,012
38,606
47,696
4.4
4.5
48.8
61.4
25.2
20.0
4.3
3.7
18.7
20.0
-
-
ICICI Bank
Neutral
262
-
152,345
34,279
39,262
3.3
3.3
21.0
24.4
12.5
10.8
2.1
1.8
14.4
14.7
-
-
IDBI Bank
Neutral
72
-
14,782
9,625
10,455
1.8
1.8
8.5
14.2
8.4
5.1
0.5
0.5
5.9
9.3
-
-
Indian Bank
Neutral
148
-
7,116
6,160
6,858
2.5
2.5
24.5
29.8
6.1
5.0
0.5
0.4
7.7
8.6
-
-
LIC Housing Finance
Accumulate
503
592
25,364
3,179
3,758
2.6
2.6
32.9
40.6
15.3
12.4
2.8
2.4
19.6
20.7
-
-
Oriental Bank
Neutral
112
-
3,887
7,643
8,373
2.4
2.4
37.2
45.4
3.0
2.5
0.3
0.2
8.2
9.4
-
-
Punjab Natl.Bank
Neutral
124
-
24,290
23,122
26,022
2.8
2.8
7.0
21.6
17.7
5.7
0.9
0.8
3.4
10.0
-
-
South Ind.Bank
Neutral
21
-
2,890
1,965
2,185
2.5
2.5
2.5
3.3
8.6
6.5
0.9
0.8
9.5
11.7
-
-
St Bk of India
Neutral
226
-
175,128
79,958
86,061
2.6
2.6
13.4
20.7
16.9
10.9
1.4
1.3
11.5
12.8
-
-
Union Bank
Neutral
131
-
8,999
12,646
14,129
2.3
2.4
31.0
39.1
4.2
3.4
0.5
0.4
9.8
11.4
-
-
Vijaya Bank
Neutral
42
-
4,150
3,536
3,827
1.9
1.9
5.5
6.7
7.5
6.2
0.6
0.6
7.8
8.8
-
-
Yes Bank
Neutral
1,155
-
48,604
7,190
9,011
3.2
3.3
58.2
69.7
19.8
16.6
3.5
3.0
19.2
19.6
-
-
FMCG
Asian Paints
Neutral
1,040
-
99,781
15,534
17,445
17.7
16.8
18.4
19.6
56.6
53.1
20.0
18.9
34.6
35.6
6.2
5.5
Stock Watch
July 22, 2016
Company Name
Reco
CMP
Target
Mkt Cap
Sales ( Čcr )
OPM(%)
EPS (Č)
PER(x)
P/BV(x)
RoE(%)
EV/Sales(x)
(Č)
Price ( Č)
( Č cr )
FY16E FY17E
FY16E
FY17E
FY16E
FY17E
FY16E
FY17E
FY16E
FY17E
FY16E
FY17E
FY16E
FY17E
FMCG
Britannia
Neutral
2,817
-
33,796
8,481
9,795
14.0
14.1
65.5
78.3
43.0
36.0
20.4
16.7
38.3
41.2
3.9
3.4
Colgate
Neutral
960
-
26,117
4,136
4,632
22.5
23.3
22.2
25.3
43.3
38.0
26.3
23.4
68.6
67.5
6.0
5.3
Dabur India
Neutral
304
-
53,495
9,370
10,265
17.6
17.3
7.3
8.1
41.5
37.5
10.8
9.8
31.7
30.6
5.7
5.2
GlaxoSmith Con*
Neutral
6,428
-
27,035
4,519
5,142
19.6
19.8
164.3
191.2
39.1
33.6
10.8
9.2
30.8
29.9
5.3
4.6
Godrej Consumer
Neutral
1,612
-
54,896
9,003
10,335
18.1
18.7
34.1
41.8
47.3
38.6
10.2
8.8
23.9
24.8
6.2
5.4
HUL
Neutral
910
-
196,979
33,299
35,497
17.1
17.1
18.9
20.0
48.2
45.5
42.2
36.8
87.6
80.8
5.9
5.5
ITC
Neutral
251
-
302,555
36,837
39,726
38.8
38.7
8.2
9.0
30.8
27.9
8.6
7.5
27.8
26.9
7.6
7.1
Marico
Neutral
278
-
35,828
6,151
6,966
17.2
17.3
5.4
6.4
51.4
43.4
16.2
12.7
33.2
32.4
5.7
5.1
Nestle*
Neutral
6,834
-
65,887
9,393
10,507
22.2
22.3
106.8
121.8
64.0
56.1
22.5
20.2
34.8
36.7
6.6
5.9
Tata Global
Neutral
132
-
8,318
8,635
9,072
9.8
9.9
5.8
7.2
22.7
18.3
2.0
1.9
6.8
7.4
1.0
0.9
Procter & Gamble
Buy
6,365
7,369
20,661
2,588
2,939
23.3
23.2
130.2
146.2
48.9
43.6
97.5
93.5
27.6
25.3
7.5
6.5
Hygiene
IT
HCL Tech^
Buy
725
1,000
102,273
37,061
30,781
21.5
20.5
51.4
40.0
14.1
18.1
3.6
2.7
20.1
20.3
2.5
2.6
Infosys
Buy
1,080
1,374
248,150
62,441
70,558
27.5
27.5
59.0
65.3
18.3
16.5
3.7
3.3
22.2
22.4
3.4
2.9
TCS
Buy
2,501
3,004
492,853
108,646
122,770
28.3
28.3
123.7
141.0
20.2
17.7
6.7
6.1
33.1
34.6
4.0
3.4
Tech Mahindra
Buy
504
700
48,934
26,494
30,347
16.3
17.0
32.2
37.5
15.7
13.4
3.4
2.9
21.7
21.8
1.6
1.3
Wipro
Buy
542
680
133,839
50,808
56,189
23.7
23.8
37.3
40.7
14.5
13.3
2.8
2.5
19.2
17.7
2.2
1.8
Media
D B Corp
Neutral
406
-
7,460
2,025
2,187
27.4
27.4
17.4
18.9
23.3
21.5
5.3
4.8
22.9
23.7
3.5
3.2
HT Media
Neutral
79
-
1,833
2,495
2,673
12.9
13.2
6.8
7.2
11.6
10.9
0.9
0.9
7.5
7.8
0.3
0.3
Jagran Prakashan
Accumulate
179
205
5,865
2,107
2,355
33.5
28.0
10.1
10.8
17.9
16.6
4.2
3.6
23.3
21.7
2.9
2.5
Sun TV Network
Neutral
407
-
16,053
2,510
2,763
71.8
71.5
21.9
24.8
18.6
16.4
4.4
4.0
22.8
24.3
5.6
5.1
Hindustan Media
Neutral
274
-
2,007
914
1,016
21.7
21.5
21.9
23.3
12.5
11.8
2.3
1.9
18.0
16.2
1.6
1.4
Ventures
Metals & Mining
Coal India
Buy
333
380
210,493
76,167
84,130
19.9
22.3
22.4
25.8
14.9
12.9
5.4
5.2
35.5
41.0
2.0
1.8
Hind. Zinc
Neutral
193
-
81,633
14,641
14,026
50.4
50.4
17.7
16.0
11.0
12.1
1.7
1.5
16.2
13.2
3.3
3.2
Hindalco
Neutral
134
-
27,578
104,356
111,186
8.7
9.5
6.7
11.1
19.9
12.1
0.7
0.7
3.5
5.9
0.8
0.7
JSW Steel
Neutral
1,610
-
38,927
42,308
45,147
16.4
20.7
(10.3)
49.5
32.5
1.8
1.7
(1.0)
5.6
2.0
1.8
NMDC
Neutral
96
-
38,061
8,237
10,893
46.6
44.5
10.0
11.7
9.7
8.2
1.1
0.9
12.5
13.0
4.4
3.3
SAIL
Neutral
47
-
19,288
45,915
53,954
7.2
10.5
1.5
4.4
31.0
10.7
0.5
0.4
2.3
4.1
1.1
1.0
Vedanta
Neutral
157
-
46,575
71,445
81,910
26.2
26.3
12.9
19.2
12.2
8.2
0.9
0.8
7.2
8.9
1.1
0.9
Tata Steel
Neutral
362
-
35,187
126,760
137,307
8.9
11.3
6.4
23.1
56.9
15.7
1.1
1.1
2.0
7.1
0.9
0.8
Stock Watch
July 22, 2016
Company Name
Reco
CMP
Target
Mkt Cap
Sales ( Čcr )
OPM(%)
EPS (Č)
PER(x)
P/BV(x)
RoE(%)
EV/Sales(x)
(Č)
Price ( Č)
( Č cr )
FY16E FY17E
FY16E
FY17E
FY16E
FY17E
FY16E
FY17E
FY16E
FY17E
FY16E
FY17E
FY16E
FY17E
Oil & Gas
Cairn India
Neutral
177
-
33,110
11,323
12,490
49.4
51.0
20.7
20.7
8.5
8.6
0.6
0.5
6.4
6.1
1.9
1.2
GAIL
Neutral
391
-
49,604
64,856
70,933
9.1
9.6
24.0
28.9
16.3
13.5
1.4
1.3
8.8
9.6
1.0
0.9
ONGC
Neutral
223
-
190,445
154,564
145,998
36.8
37.4
20.8
22.6
10.7
9.9
1.0
1.0
10.1
9.7
1.5
1.6
Petronet LNG
Neutral
292
-
21,866
29,691
31,188
5.8
6.2
12.8
13.4
22.8
21.7
3.4
3.0
15.8
14.8
0.8
0.8
Indian Oil Corp
Neutral
521
-
126,593
359,607
402,760
5.9
6.1
42.5
48.7
12.3
10.7
1.6
1.5
14.1
14.4
0.4
0.4
Reliance Industries
Neutral
1,007
-
326,417
304,775
344,392
12.6
13.4
91.3
102.6
11.0
9.8
1.2
1.1
11.8
12.0
1.0
0.8
Pharmaceuticals
Alembic Pharma
Neutral
585
-
11,029
3,145
3,483
31.9
16.2
38.2
18.7
15.3
31.3
6.9
5.8
57.9
20.1
3.4
3.1
Aurobindo Pharma
Buy
790
880
46,228
13,651
15,702
21.7
21.7
33.9
38.4
23.3
20.6
6.5
5.1
32.5
27.7
3.5
3.1
Aventis*
Accumulate
4,514
4,738
10,397
2,049
2,375
15.4
17.3
115.4
153.5
39.1
29.4
6.4
5.0
19.3
25.8
4.8
4.0
Cadila Healthcare
Accumulate
373
400
38,145
9,469
11,246
21.2
22.0
14.9
17.1
25.0
21.8
7.1
5.6
28.8
26.6
3.9
3.3
Cipla
Neutral
515
-
41,416
13,372
15,378
16.4
17.4
18.8
21.6
27.4
23.9
3.5
3.1
13.3
13.7
3.1
3.0
Dr Reddy's
Neutral
3,617
-
61,686
15,471
17,479
24.6
24.6
138.2
152.4
26.2
23.7
4.8
4.1
19.7
18.7
3.9
3.5
Dishman Pharma
Neutral
142
-
2,293
1,733
1,906
21.5
21.5
10.1
10.0
14.1
14.2
1.7
1.5
10.5
11.2
1.8
1.5
GSK Pharma*
Neutral
3,383
-
28,657
2,741
3,528
16.5
18.9
44.2
60.1
76.5
56.3
16.9
16.8
21.2
29.9
10.3
8.1
Indoco Remedies
Neutral
304
-
2,803
977
1,112
14.9
18.2
9.0
13.2
33.8
23.0
4.8
4.1
15.1
19.2
2.9
2.6
Ipca labs
Buy
484
613
6,103
2,844
3,799
10.6
15.3
10.6
17.3
45.6
28.0
2.7
2.4
5.9
9.1
2.2
1.7
Lupin
Accumulate
1,685
1,809
75,982
13,702
15,912
23.7
26.4
50.5
58.1
33.4
29.0
6.9
5.6
22.9
21.4
6.0
4.8
Sun Pharma
Buy
794
944
191,079
27,744
31,129
26.0
30.0
22.0
28.0
36.1
28.4
5.2
4.3
18.3
18.7
6.5
5.6
Power
Tata Power
Neutral
71
-
19,135
35,923
37,402
22.6
22.8
4.1
5.2
17.5
13.7
1.3
1.3
7.5
9.3
1.5
1.4
NTPC
Neutral
155
-
127,681
87,271
99,297
23.5
23.5
11.8
13.3
13.2
11.6
1.5
1.4
11.5
12.2
2.5
2.2
Power Grid
Neutral
163
-
85,144
20,702
23,361
86.7
86.4
12.1
13.2
13.5
12.3
2.0
1.8
15.6
15.1
9.1
8.4
Real Estate
MLIFE
Buy
457
554
1,877
826
1,011
20.1
21.9
22.7
30.7
20.2
14.9
1.2
1.1
6.0
7.4
4.2
3.2
Telecom
Bharti Airtel
Neutral
367
-
146,665
101,748
109,191
32.1
31.7
12.0
12.5
30.6
29.4
2.1
2.0
6.9
6.7
2.1
1.9
Idea Cellular
Neutral
105
-
37,934
34,282
36,941
32.0
31.5
5.9
6.2
17.9
17.0
1.6
1.5
9.9
9.3
1.7
1.7
zOthers
Abbott India
Neutral
4,724
-
10,039
2,715
3,153
14.5
14.1
134.3
152.2
35.2
31.0
8.8
7.2
27.4
25.6
3.4
2.9
Bajaj Electricals
Accumulate
242
268
2,449
4,612
5,351
5.6
5.7
9.5
12.4
25.6
19.6
3.2
2.8
12.5
14.4
0.5
0.4
Finolex Cables
Neutral
377
-
5,773
2,520
2,883
12.2
12.0
12.7
14.2
29.8
26.6
4.1
3.6
13.6
13.5
2.0
1.7
Goodyear India*
Buy
525
631
1,212
1,750
1,598
11.3
10.4
53.7
49.4
9.8
10.6
2.1
1.8
23.0
18.2
0.5
0.4
Hitachi
Neutral
1,400
-
3,807
1,779
2,081
7.8
8.8
21.8
33.4
64.2
41.9
10.4
8.4
17.4
22.1
2.2
1.8
Stock Watch
July 22, 2016
Company Name
Reco
CMP
Target
Mkt Cap
Sales ( Čcr )
OPM(%)
EPS (Č)
PER(x)
P/BV(x)
RoE(%)
EV/Sales(x)
(Č)
Price ( Č)
( Č cr )
FY16E
FY17E
FY16E
FY17E
FY16E
FY17E
FY16E
FY17E
FY16E
FY17E
FY16E
FY17E
FY16E
FY17E
zOthers
Jyothy Laboratories
Neutral
290
-
5,252
1,620
1,847
11.5
11.5
7.3
8.5
39.8
34.2
5.1
4.8
13.3
14.4
3.1
2.7
MRF
Buy
34,403
45,575
14,591
20,316
14,488
21.4
21.1
5,488.0
3,798.0
6.3
9.1
2.1
1.7
41.1
21.2
0.7
0.9
Page Industries
Neutral
13,570
-
15,136
1,929
2,450
19.8
20.1
229.9
299.0
59.0
45.4
26.0
18.1
52.1
47.1
7.8
6.1
Relaxo Footwears
Neutral
482
-
5,782
1,767
2,152
12.3
12.5
19.3
25.1
25.0
19.2
6.1
4.7
27.7
27.8
3.3
2.7
Siyaram Silk Mills
Buy
1,037
1,347
972
1,619
1,799
11.6
11.6
93.5
104.9
11.1
9.9
1.9
1.6
17.1
16.4
0.9
0.8
Styrolution ABS India* Neutral
625
-
1,099
1,271
1,440
8.6
9.2
32.0
41.1
19.5
15.2
2.0
1.8
10.7
12.4
0.9
0.7
TVS Srichakra
Buy
2,391
2,932
1,830
2,035
2,252
15.9
15.3
248.6
268.1
9.6
8.9
4.2
3.0
43.6
33.9
0.9
0.8
HSIL
Neutral
306
-
2,210
2,123
2,384
16.1
16.5
15.0
18.9
20.3
16.2
1.6
1.5
8.0
9.4
1.4
1.2
Kirloskar Engines India
Neutral
267
-
3,856
2,403
2,554
8.6
9.9
9.2
10.5
29.0
25.4
2.8
2.7
9.7
10.7
1.2
1.1
Ltd
M M Forgings
Buy
421
546
508
511
615
21.7
21.6
43.1
55.8
9.8
7.5
1.8
1.5
19.9
21.2
1.2
0.9
Banco Products (India) Neutral
162
-
1,156
1,208
1,353
11.0
12.3
10.8
14.5
15.0
11.2
1.7
1.5
11.9
14.5
0.9
0.7
Competent Automobiles Neutral
151
-
93
1,040
1,137
3.2
3.1
25.7
28.0
5.9
5.4
0.9
0.8
15.0
14.3
0.1
0.1
Nilkamal
Neutral
1,200
-
1,791
1,871
2,031
10.7
10.5
63.2
69.8
19.0
17.2
3.1
2.7
17.6
16.6
1.0
0.9
Visaka Industries
Neutral
156
-
248
1,020
1,120
8.7
9.1
13.9
20.1
11.2
7.8
0.7
0.7
6.4
8.7
0.5
0.4
Transport Corporation of
Neutral
348
-
2,663
2,830
3,350
8.8
9.0
14.4
18.3
24.2
19.0
3.7
3.2
15.4
17.1
1.1
1.0
India
Elecon Engineering
Neutral
62
-
674
1,359
1,482
10.3
13.7
0.8
3.9
77.1
15.9
1.3
1.2
1.6
7.8
0.9
0.8
Surya Roshni
Buy
162
201
712
2,992
3,223
8.1
8.4
14.7
18.3
11.1
8.9
1.0
0.9
9.7
11.0
0.5
0.5
MT Educare
Neutral
153
-
610
286
366
18.3
17.7
7.7
9.4
19.8
16.3
4.2
3.7
20.2
21.1
2.1
1.6
Radico Khaitan
Buy
91
125
1,213
1,543
1,659
12.6
13.0
5.8
6.3
15.8
14.4
1.3
1.2
8.5
8.6
1.3
1.2
Garware Wall Ropes
Accumulate
413
460
904
828
898
11.2
10.3
28.3
29.0
14.6
14.2
2.5
2.1
16.8
14.9
1.0
0.9
Wonderla Holidays
Neutral
402
-
2,271
206
308
44.0
43.6
9.0
12.9
44.7
31.2
6.1
5.5
13.7
17.8
10.7
7.1
Linc Pen & Plastics
Neutral
286
-
422
344
382
9.1
9.1
12.4
13.1
23.1
21.8
4.2
3.6
18.0
16.7
1.2
1.1
The Byke Hospitality
Neutral
162
-
648
222
287
20.5
20.5
5.6
7.6
28.6
21.4
5.4
4.4
18.9
20.8
3.0
2.3
Interglobe Aviation
Neutral
947
-
34,110
17,022
21,122
20.7
14.5
63.9
53.7
14.8
17.6
22.2
18.2
149.9
103.2
2.1
1.7
Coffee Day Enterprises
Neutral
244
-
5,026
2,692
2,964
17.0
18.6
-
4.7
-
51.5
3.0
2.8
0.2
5.5
2.2
2.1
Ltd
Navneet Education
Neutral
93
-
2,221
998
1,062
24.1
24.0
5.8
6.1
16.2
15.3
3.6
3.2
22.0
20.6
2.4
2.3
Navkar Corporation
Buy
212
265
3,017
347
408
43.2
42.9
6.7
6.8
31.7
31.2
2.3
2.2
7.3
6.9
9.2
8.3
UFO Moviez
Neutral
553
-
1,526
558
619
32.0
33.2
22.5
30.0
24.6
18.5
3.0
2.6
12.0
13.8
2.6
2.2
VRL Logistics
Neutral
349
-
3,187
1,725
1,902
16.5
16.7
12.2
14.6
28.7
24.0
6.0
5.3
20.8
21.9
1.8
1.6
Stock Watch
July 22, 2016
Company Name
Reco
CMP
Target Mkt Cap
Sales ( Čcr )
OPM(%)
EPS (Č)
PER(x)
P/BV(x)
RoE(%)
EV/Sales(x)
(Č)
Price ( Č)
( Č cr )
FY16E FY17E FY16E FY17E FY16E FY17E FY16E FY17E FY16E FY17E FY16E FY17E FY16E FY17E
zOthers
Team Lease Serv.
Neutral
1,040
-
1,778
2,565
3,229
1.3
1.5
15.2
22.8
68.5
45.7
5.5
4.9
8.0
10.7
0.6
0.4
S H Kelkar & Co.
Neutral
234
-
3,387
928
1,036
15.3
15.1
4.9
6.1
47.5
38.4
4.4
4.1
9.4
10.7
3.4
3.0
Quick Heal
Neutral
259
-
1,814
339
408
27.8
27.3
7.1
7.7
36.6
33.5
3.1
3.1
8.5
9.3
4.6
3.9
Narayana Hrudaya
Neutral
286
-
5,853
1,603
1,873
10.9
11.5
1.0
2.6
300.6
108.3
7.2
6.6
2.4
6.1
3.8
3.3
Manpasand Bever.
Neutral
701
-
3,510
540
836
19.9
19.6
10.2
16.9
68.5
41.5
5.5
5.0
8.1
12.0
5.9
3.8
Parag Milk Foods
Neutral
334
-
2,809
1,645
1,919
9.0
9.3
6.7
9.5
49.7
35.4
6.5
5.5
13.1
15.5
1.9
1.6
Source: Company, Angel Research; Note: *December year end; #September year end; &October year end; Price as on July 21, 2016
Market Outlook
July 22, 2016
Research Team Tel: 022 - 39357800
DISCLAIMER
Angel Broking Private Limited (hereinafter referred to as “Angel”) is a registered Member of National Stock Exchange of India Limited,
Bombay Stock Exchange Limited and Metropolitan Stock Exchange Limited. It is also registered as a Depository Participant with CDSL
and Portfolio Manager with SEBI. It also has registration with AMFI as a Mutual Fund Distributor. Angel Broking Private Limited is a
registered entity with SEBI for Research Analyst in terms of SEBI (Research Analyst) Regulations, 2014 vide registration number
INH000000164. Angel or its associates has not been debarred/ suspended by SEBI or any other regulatory authority for accessing
/dealing in securities Market. Angel or its associates/analyst has not received any compensation / managed or co-managed public
offering of securities of the company covered by Analyst during the past twelve months.
This document is solely for the personal information of the recipient, and must not be singularly used as the basis of any investment
decision. Nothing in this document should be construed as investment or financial advice. Each recipient of this document should make
such investigations as they deem necessary to arrive at an independent evaluation of an investment in the securities of the companies
referred to in this document (including the merits and risks involved), and should consult their own advisors to determine the merits and
risks of such an investment.
Reports based on technical and derivative analysis center on studying charts of a stock's price movement, outstanding positions and
trading volume, as opposed to focusing on a company's fundamentals and, as such, may not match with a report on a company's
fundamentals. Investors are advised to refer the Fundamental and Technical Research Reports available on our website to evaluate the
contrary view, if any.
The information in this document has been printed on the basis of publicly available information, internal data and other reliable
sources believed to be true, but we do not represent that it is accurate or complete and it should not be relied on as such, as this
document is for general guidance only. Angel Broking Pvt. Limited or any of its affiliates/ group companies shall not be in any way
responsible for any loss or damage that may arise to any person from any inadvertent error in the information contained in this report.
Angel Broking Pvt. Limited has not independently verified all the information contained within this document. Accordingly, we cannot
testify, nor make any representation or warranty, express or implied, to the accuracy, contents or data contained within this document.
While Angel Broking Pvt. Limited endeavors to update on a reasonable basis the information discussed in this material, there may be
regulatory, compliance, or other reasons that prevent us from doing so.
This document is being supplied to you solely for your information, and its contents, information or data may not be reproduced,
redistributed or passed on, directly or indirectly.
Neither Angel Broking Pvt. Limited, nor its directors, employees or affiliates shall be liable for any loss or damage that may arise from
or in connection with the use of this information.