Market Outlook
December 21, 2015
Market Cues
Domestic Indices
Chg (%)
(Pts)
(Close)
Indian markets are expected to open in the red tracking the SGX Nifty and Asian
BSE Sensex
(1.1)
(285)
25,519
peers.
Nifty
(1.1)
(82)
7,762
U.S. markets added to the losses of the previous session as profit booking continued
Mid Cap
0.1
9
10,919
after the three day rally witnessed earlier in the week. A continued decrease by the
Small Cap
(0.2)
(27)
11,532
price of crude oil also weighed on stocks.
Bankex
(0.9)
(168)
18,934
European markets also closed in the red as traders took profits after the rally post
the Feds decision. Most Asian markets also ended the day in the red after the Bank
Global Indices
Chg (%)
(Pts)
(Close)
of Japan’s policy decision.
Dow Jones
(2.1)
(367)
17,129
Indian shares took a beating after the government lowered its GDP growth
Nasdaq
(1.6)
(79)
4,923
projection for the current year. India's GDP is likely to grow 7-7.5% in the fiscal year
2015-16, lower than the earlier 8.1-8.5% estimate, according to the mid-year
FTSE
(0.8)
(50)
6,052
economic review.
Nikkei
(1.9)
(367)
18,987
Hang Seng
(0.5)
(116)
21,756
News & Result Analysis
Shanghai Com
(0.0)
(1)
3,579
Government likely to impose minimum import price for steel
M&M unveils micro SUV KUV100; to take on Grand i10 & Maruti Swift
Detailed analysis on Pg2
Advances / Declines
BSE
NSE
Advances
1,294
699
Investor’s Ready Reckoner
Declines
1,416
858
Key Domestic & Global Indicators
Unchanged
209
66
Stock Watch: Latest investment recommendations on 150+ stocks
Refer P5 onwards
Volumes (` Cr)
Top Picks
BSE
3,135
CMP
Target
Upside
Company
Sector
Rating
NSE
17,961
(`)
(`)
(%)
Axis Bank
Financials
Buy
432
630
45.6
HCL Tech
IT
Buy
847
1,132
33.7
Net Inflows (` Cr)
Net
Mtd
Ytd
ICICI Bank
Financials
Buy
250
354
41.5
FII
751
(3,015)
112,485
Ashok Leyland
Automobiles
Buy
90
111
23.8
MFs
71
1,486
89,879
Larsen & Toubro
Construction
Buy
1,288
1,646
27.8
More Top Picks on Pg4
Top Gainers
Price (`)
Chg (%)
Key Upcoming Events
Pipavavdoc
79
9.1
Previous
Consensus
Date
Region
Event Description
Kec
160
6.1
Reading
Expectations
Gati
176
5.1
Dec 22
US
Existing home sales
5.36Mn
5.36Mn
Dec 22
US
3QGDP
2.1%
1.9%
Bergepaint
240
4.9
Dec 23
US
New home sales
495K
500K
Beml
1,263
3.9
Dec 23
UK
3QGDP
2.3%
-
Top Losers
Price (`)
Chg (%)
Aloktext
6
(9.3)
Pmcfin
1
(8.8)
Frl
146
(3.9)
Iifl
197
(3.8)
Gdl
321
(3.4)
As on December 18, 2015
Market Outlook
December 21, 2015
Government likely to impose minimum import price for steel
With all major steel companies in the red and banks accumulating non-performing
assets (NPAs) in the sector, a push to impose a minimum price for imports is being
spearheaded by banks through the ministry of finance. Senior government officials
said the government is set to issue a minimum import price (MIP) notification later
this week. According to an industry report, 145 steel and iron companies
accumulated debt worth `2.98 lakh crore and an unfavourable debt to equity ratio
of 1.27. Similar to UDAY, the financial restructuring scheme for power distribution
companies, this notification would also be primarily to rescue banks.
The ministry of steel had earlier this month sent a long list of items for the
proposed MIP to the department of commerce. The latter has some reservations
and views it as a trade barrier which might not comply with World Trade
Organization norms. An official privy to the discussions within the government said
that the list is likely to be pruned down to ~34 items, with stainless steel products
expected to be left out. He added that the issue has also been discussed at the
prime minister’s office. Both ministries are trying for a consensus on the rates and
products to be covered. A final notification would come from the directorate
general of foreign trade, once approval is given by commerce minister Nirmala
Seetharaman, currently away to Nairobi for a scheduled WTO ministerial meeting.
The Sponge Iron Manufacturers' Association is opposed to the move. It says the
secondary steel industry would then be faced with a shutdown.
The government is also likely to put in place a mechanism whereby if the FOB
price of steel at the point of origin according to major indices is lower than the
invoiced price, the listed one would be considered for enforcing MIP. The
department of commerce wishes to exempt exporters of products from the MIP
norm if the imports were being used for manufacturing export products. To prevent
misuse of this, it is mulling a mandatory export obligation within six months and
refund of actual value and MIP.
These moves are positive for the steel players and we expect the bigger steel
players such as Tata Steel, JSW steel and Sail to benefit from these actions.
Mahindra & Mahindra unveils micro SUV KUV100; to take on
Grand i10 & Maruti Swift
Betting big on the hatchback crossover (or micro SUV) space, Mahindra &
Mahindra unveiled the official rendering of the “KUV100”. Bookings for KUV100
or the S101 (as it is codenamed) will open at all dealerships across India from
December 19, and the car will go on sale from January 15, 2016. As per media
sources, the KUV100 is likely to be priced between `3.9 lakh to `5.9 lakh. The
sub-4m crossover's nomenclature stands for 'Kool Utility Vehicle', and will be
available in four variants: K2, K4, K6 and K8. The company aims to lure buyers
looking at B-segment compact hatchbacks like the Hyundai Grand i10 and Maruti
Swift, whilst offering the road presence of an SUV, decent equipment list and a
new fuel efficient range of engines.
Powering the Mahindra KUV100 is a new range of "Falcon" aluminium-block
engines, which includes 1.2-liter three cylinder petrol (mFalcon G80) and 1.2-liter
three-cylinder diesel (mFalcon D75) engines. The dual VVT petrol unit outputs 82
bhp at 5,500 rpm and 114 Nm at 3,500 Nm, while the diesel engine produces 77
Market Outlook
December 21, 2015
bhp at 3,750 rpm and 190 Nm between 1,750-2,250 rpm. As for safety features,
ABS will be standard fitment, while airbags are optional across all variants.
The 'entry SUV' or crossover-styled vehicle is a segment that's unique to India and a
select few markets. Apart from novelty, a key trigger for the shrinking size of
vehicles has been the government's incentive to make smaller cars - sub-4 metre
vehicles attract half the excise duty of 12% for bigger vehicles. M&M had lost
market share in the utility vehicle space over the last two to three years (share fell
from about 50% to 35% currently) on account of absence in the compact SUV
space and growing popularity for the same. We believe that introduction of
KUV1OO would enable M&M to regain market share in the utility vehicle space.
We currently have Buy rating on the stock.
Economic and Political News
Mid-year review cuts GDP growth forecast for FY16 to 7-7.5% from 8.1-8.5%
Government to stick to 3.9% fiscal deficit target: Finance ministry report
Tea production for 2015-16 estimated to fall by 1.5%
Corporate News
Reliance Jio to start free 4G service for employees from December 27;
commercial launch expected in April-May
CCI approves $150mn JBF Group-KKR credit deal
Tata Teleservices to focus on broadening 120,000-km fibre network
Market Outlook
December 21, 2015
Top Picks ★★★★★
Large Cap
Market Cap
CMP
Target
Upside
Company
Rationale
(` Cr)
(`)
(`)
(%)
To outpace battery industry growth due to better technological
Amara Raja Batteries
14,581
854
1,040
21.8
products leading to market share gains in both the automotive
OEM and replacement segments.
Earnings to grow strongly given the MHCV cyclical upturn.
Ashok Leyland
25,513
90
111
23.8
Focus on exports and LCV's provides additional growth
avenue.
Healthy pace of branch expansion, backed by distribution
Axis Bank
1,02,858
432
630
45.6
network, will be the driving force for the bank’s retail business
and overall earnings.
The stock is trading at attractive valuations and is factoring all
HCL Tech
1,19,324
847
1,132
33.7
the bad news.
Strong visibility for a robust 20% earnings trajectory, coupled
HDFC Bank
2,70,667
1,073
1,262
17.7
with high quality of earnings on account of high quality retail
business and strategic focus on highly rated corporates.
Due to its robust franchise and capital adequacy position, the
bank is well positioned to grow by at least a few percentage
ICICI Bank
1,45,357
250
354
41.5
points higher than the average industry growth rate from a
structural point of view.
Back on the growth trend, expect a long term growth of 14%
Infosys
2,49,437
1,086
1,306
20.3
to be a US$20bn in FY2020.
Well positioned to benefit from such expected gradual
recovery in the overall domestic capex cycle, given its presence
Larsen & Toubro
1,19,950
1,288
1,646
27.8
across various infrastructure segments, its execution
capabilities, and its strong balance sheet.
LICHF continues to grow its retail loan book at a healthy pace
with improvement in asset quality. We expect the company to
LIC Housing Finance
24,426
484
571
18.0
post a healthy loan book which is likely to reflect in a strong
earnings growth.
Source: Company, Angel Research
Mid Cap
Market Cap
CMP
Target
Upside
Company
Rationale
(` Cr)
(`)
(`)
(%)
Favourable outlook for the AC industry to augur well for
Cooling products business which is out pacing the market
Blue Star
3,320
369
429
16.2
growth. EMPPAC division's profitability to improve once
operating environment turns around.
Change in business focus towards high-margin chronic &
Ipca labs
9,357
742
900
21.4
lifestyle segments and increasing penetration in Europe and
US
Economic recovery to have favourable impact on advertising &
circulation revenue growth. Further, the acquisition of a radio
Jagran Prakashan
5,162
158
169
7.0
business (Radio City) would also boost the company's revenue
growth.
Strong brand & quality teaching with innovative technologies &
MT Educare
673
169
169
-
higher government educational spending to boost growth
Earnings boost on back of stable material prices and
Radico Khaitan
1,541
116
156
34.7
favourable pricing environment. Valuation discount to peers
provides additional comfort
Strong brands and distribution network would boost growth
Siyaram Silk Mills
1,034
1,103
1,354
22.7
going ahead. Stock currently trades at an inexpensive
valuation.
Structural shift in the Lighting industry towards LED lighting will
Surya Roshni
629
143
183
27.6
drive growth.
Source: Company, Angel Research
Market Outlook
December 21, 2015
Key Upcoming Events
Global economic events release calendar
Date
Time
Country
Event Description
Unit
Period
Bloomberg Data
Last Reported Estimated
Dec 21, 2015
8:30PM
Euro Zone
Euro-Zone Consumer Confidence
Value
Dec A
(5.90)
(5.90)
Dec 22, 2015
8:30PM
US
Existing home sales
Million
Nov
5.36
5.34
7:00PM
US
GDP Qoq (Annualised)
% Change
3Q T
2.10
1.90
Dec 23, 2015
8:30PM
US
New home sales
Thousands
Nov
495.00
505.00
3:00PM
UK
GDP (YoY)
% Change
3Q F
2.30
2.30
Dec 24, 2015
7:00PM
US
Initial Jobless claims
Thousands
Dec 19
271.00
270.00
Dec 29, 2015
8:30PM
US
Consumer Confidence
S.A./ 1985=100
Dec
90.40
94.00
Jan 1, 2016
6:30AM
China
PMI Manufacturing
Value
Dec
49.60
--
Jan 4, 2016
2:25PM
Germany
PMI Manufacturing
Value
Dec F
53.00
--
3:00PM
UK
PMI Manufacturing
Value
Dec
52.70
--
Jan 5, 2016
2:25PM
Germany
Unemployment change (000's)
Thousands
Dec
(13.00)
--
Jan 6, 2016
2:25PM
Germany
PMI Services
Value
Dec F
55.40
--
Jan 8, 2016
India
Imports YoY%
% Change
Dec
(30.26)
--
India
Exports YoY%
% Change
Dec
(24.43)
--
7:00PM
US
Change in Nonfarm payrolls
Thousands
Dec
211.00
200.00
7:00PM
US
Unnemployment rate
%
Dec
5.00
5.00
Jan 12, 2016
5:30PM
India
Industrial Production YoY
% Change
Nov
9.80
--
3:00PM
UK
Industrial Production (YoY)
% Change
Nov
1.70
--
Jan 14, 2016
12:00PM
India
Monthly Wholesale Prices YoY%
% Change
Dec
(1.99)
--
5:30PM
UK
BOE Announces rates
% Ratio
Jan 14
0.50
0.50
Jan 15, 2016
7:45PM
US
Industrial Production
%
Dec
(0.56)
--
Jan 19, 2016
3:00PM
UK
CPI (YoY)
% Change
Dec
0.10
--
Jan 20, 2016
7:00PM
US
Housing Starts
Thousands
Dec
1,173.00
--
7:00PM
US
Building permits
Thousands
Dec
1,289.00
--
3:00PM
UK
Jobless claims change
% Change
Dec
3.90
--
7:00PM
US
Consumer price index (mom)
% Change
Dec
--
--
Jan 21, 2016
3:30PM
Euro Zone
Euro-Zone CPI (YoY)
%
Dec F
0.20
--
6:15PM
Euro Zone
ECB announces interest rates
%
Jan 21
0.05
--
Jan 28, 2016
12:30AM
US
FOMC rate decision
%
Jan 27
0.50
0.50
Source: Bloomberg, Angel Research
Market Outlook
December 21, 2015
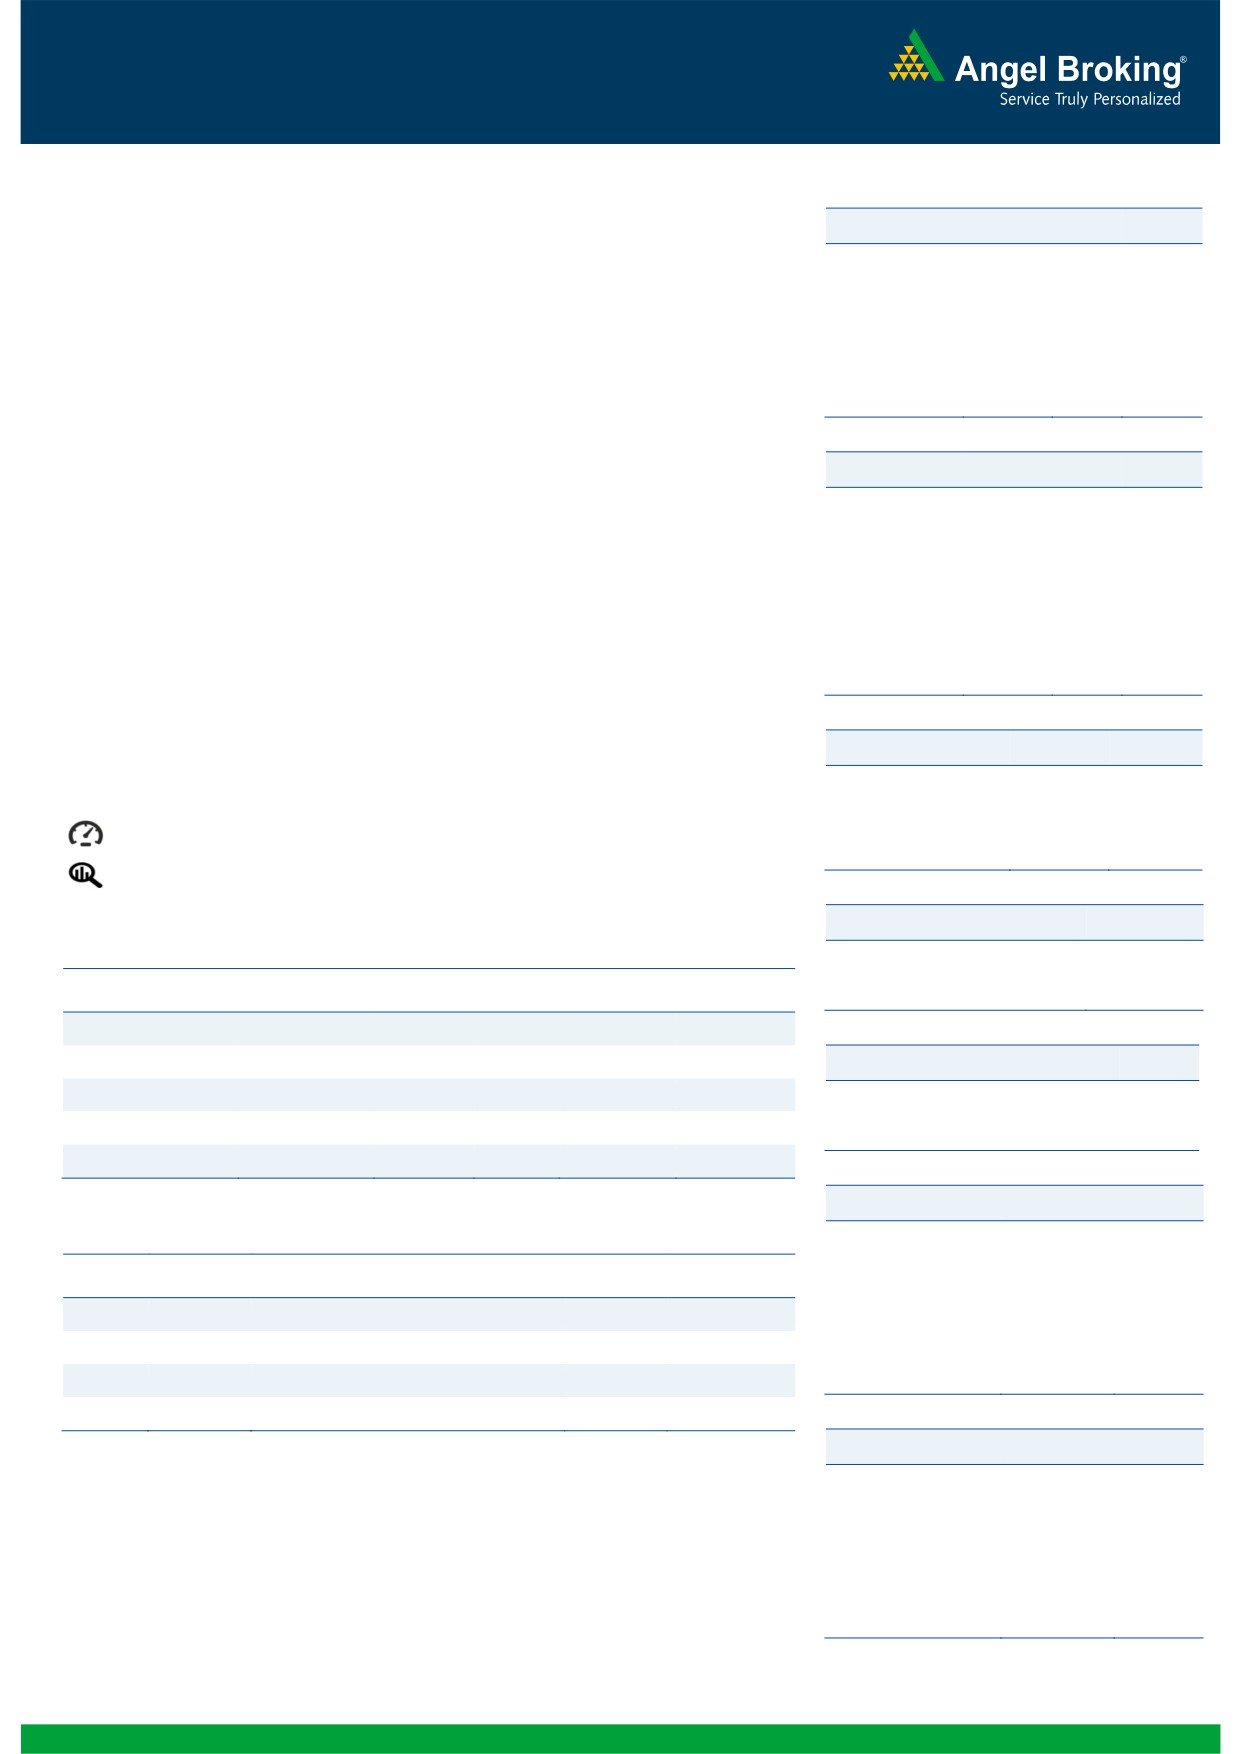
Macro watch
Exhibit 1: Quarterly GDP trends
Exhibit 2: IIP trends
(%)
(%)
9.0
8.4
12.0
9.8
8.0
7.5
7.5
7.4
10.0
7.0
7.0
6.7
6.7
6.6
7.0
6.4
8.0
6.3
6.0
6.0
4.8
5.0
4.2
4.3
4.7
3.6
3.8
5.0
4.0
2.8
3.0
2.5
2.5
4.0
2.0
3.0
-
Source: CSO, Angel Research
Source: MOSPI, Angel Research
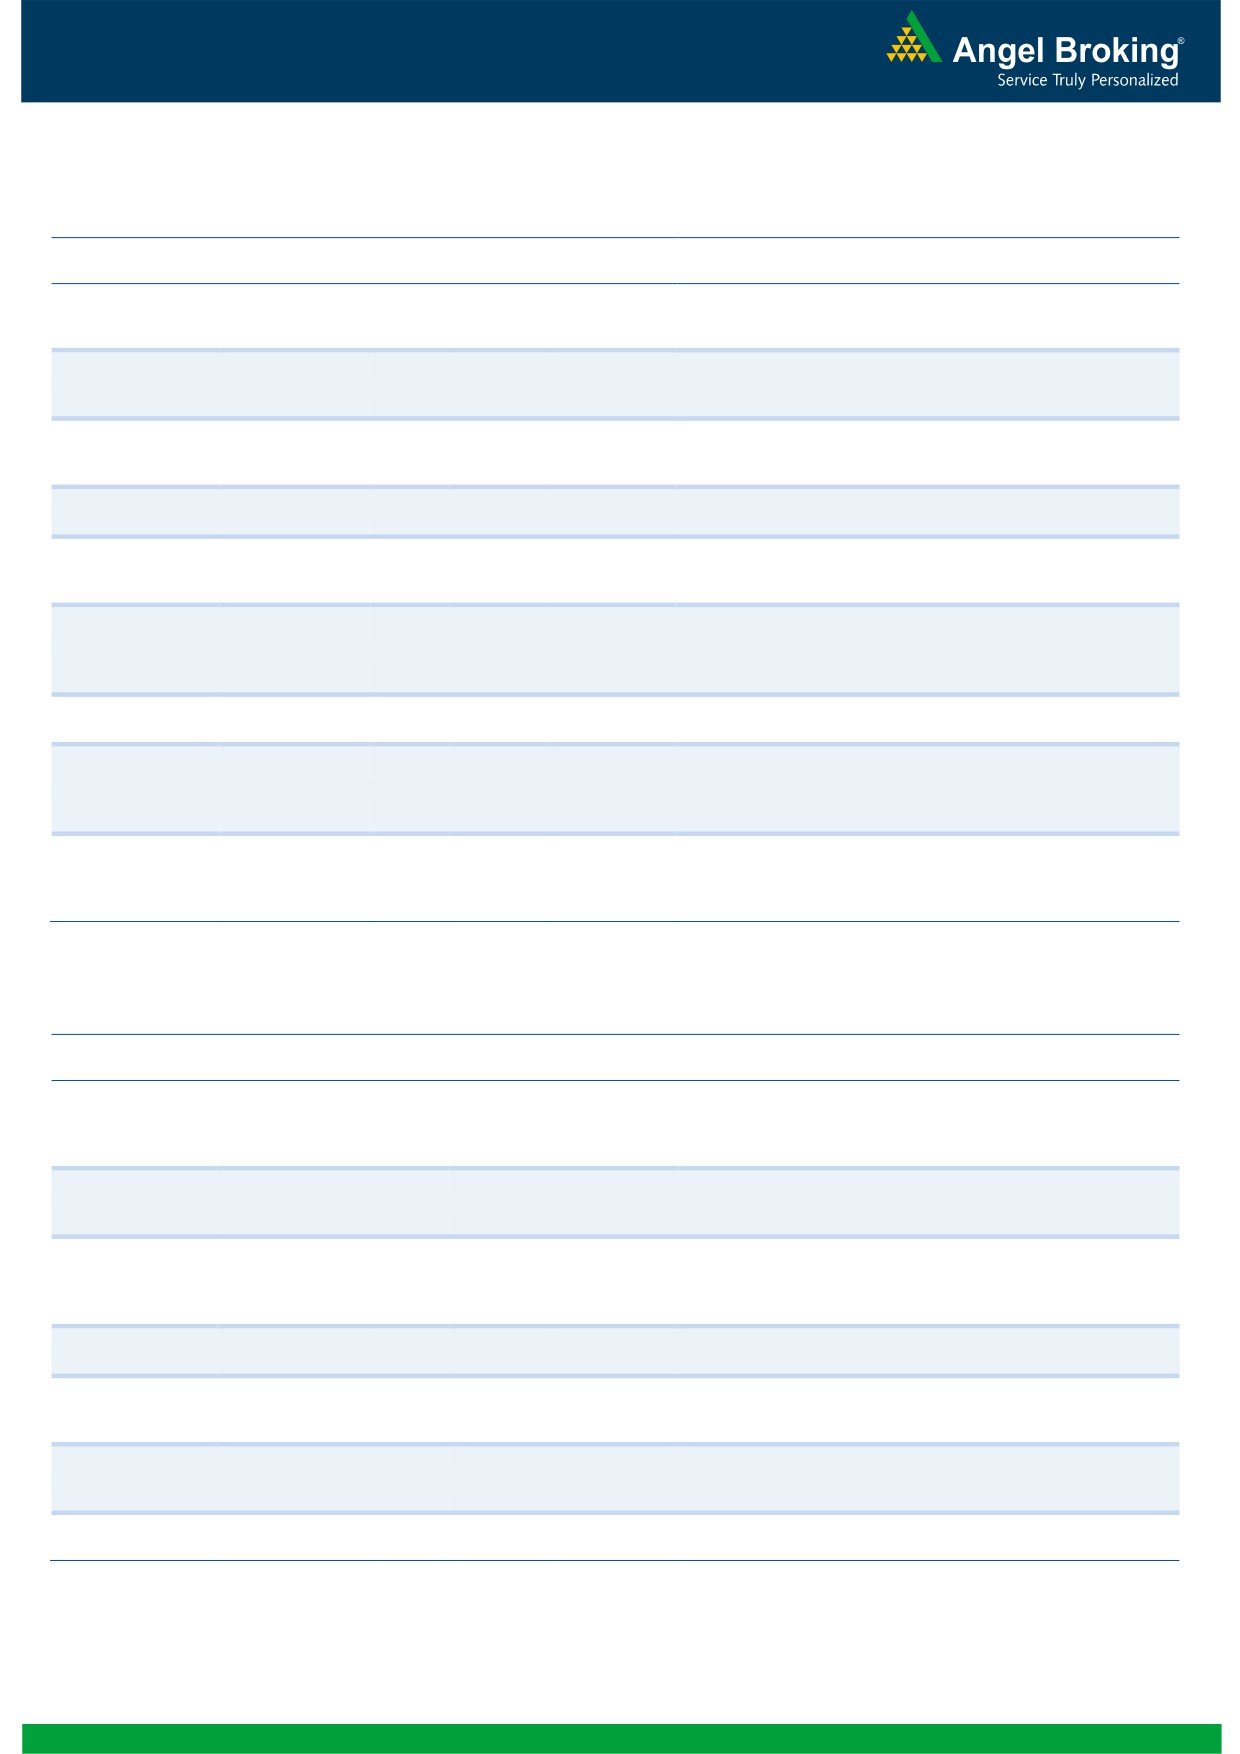
Exhibit 3: Monthly CPI inflation trends
Exhibit 4: Manufacturing and services PMI
(%)
56.0
Mfg. PMI
Services PMI
6.0
5.4
5.3
5.4
5.4
5.2
5.0
5.0
54.0
4.9
5.0
4.3
4.4
3.7
3.7
52.0
4.0
3.0
50.0
2.0
48.0
1.0
46.0
-
44.0
Source: MOSPI, Angel Research
Source: Market, Angel Research; Note: Level above 50 indicates expansion
Exhibit 5: Exports and imports growth trends
Exhibit 6: Key policy rates
(%)
Exports yoy growth
Imports yoy growth
(%)
Repo rate
Reverse Repo rate
CRR
0.0
8.00
(5.0)
7.50
7.00
(10.0)
6.50
(15.0)
6.00
5.50
(20.0)
5.00
(25.0)
4.50
4.00
(30.0)
3.50
(35.0)
3.00
Source: Bloomberg, Angel Research
Source: RBI, Angel Research
Market Outlook
December 21, 2015
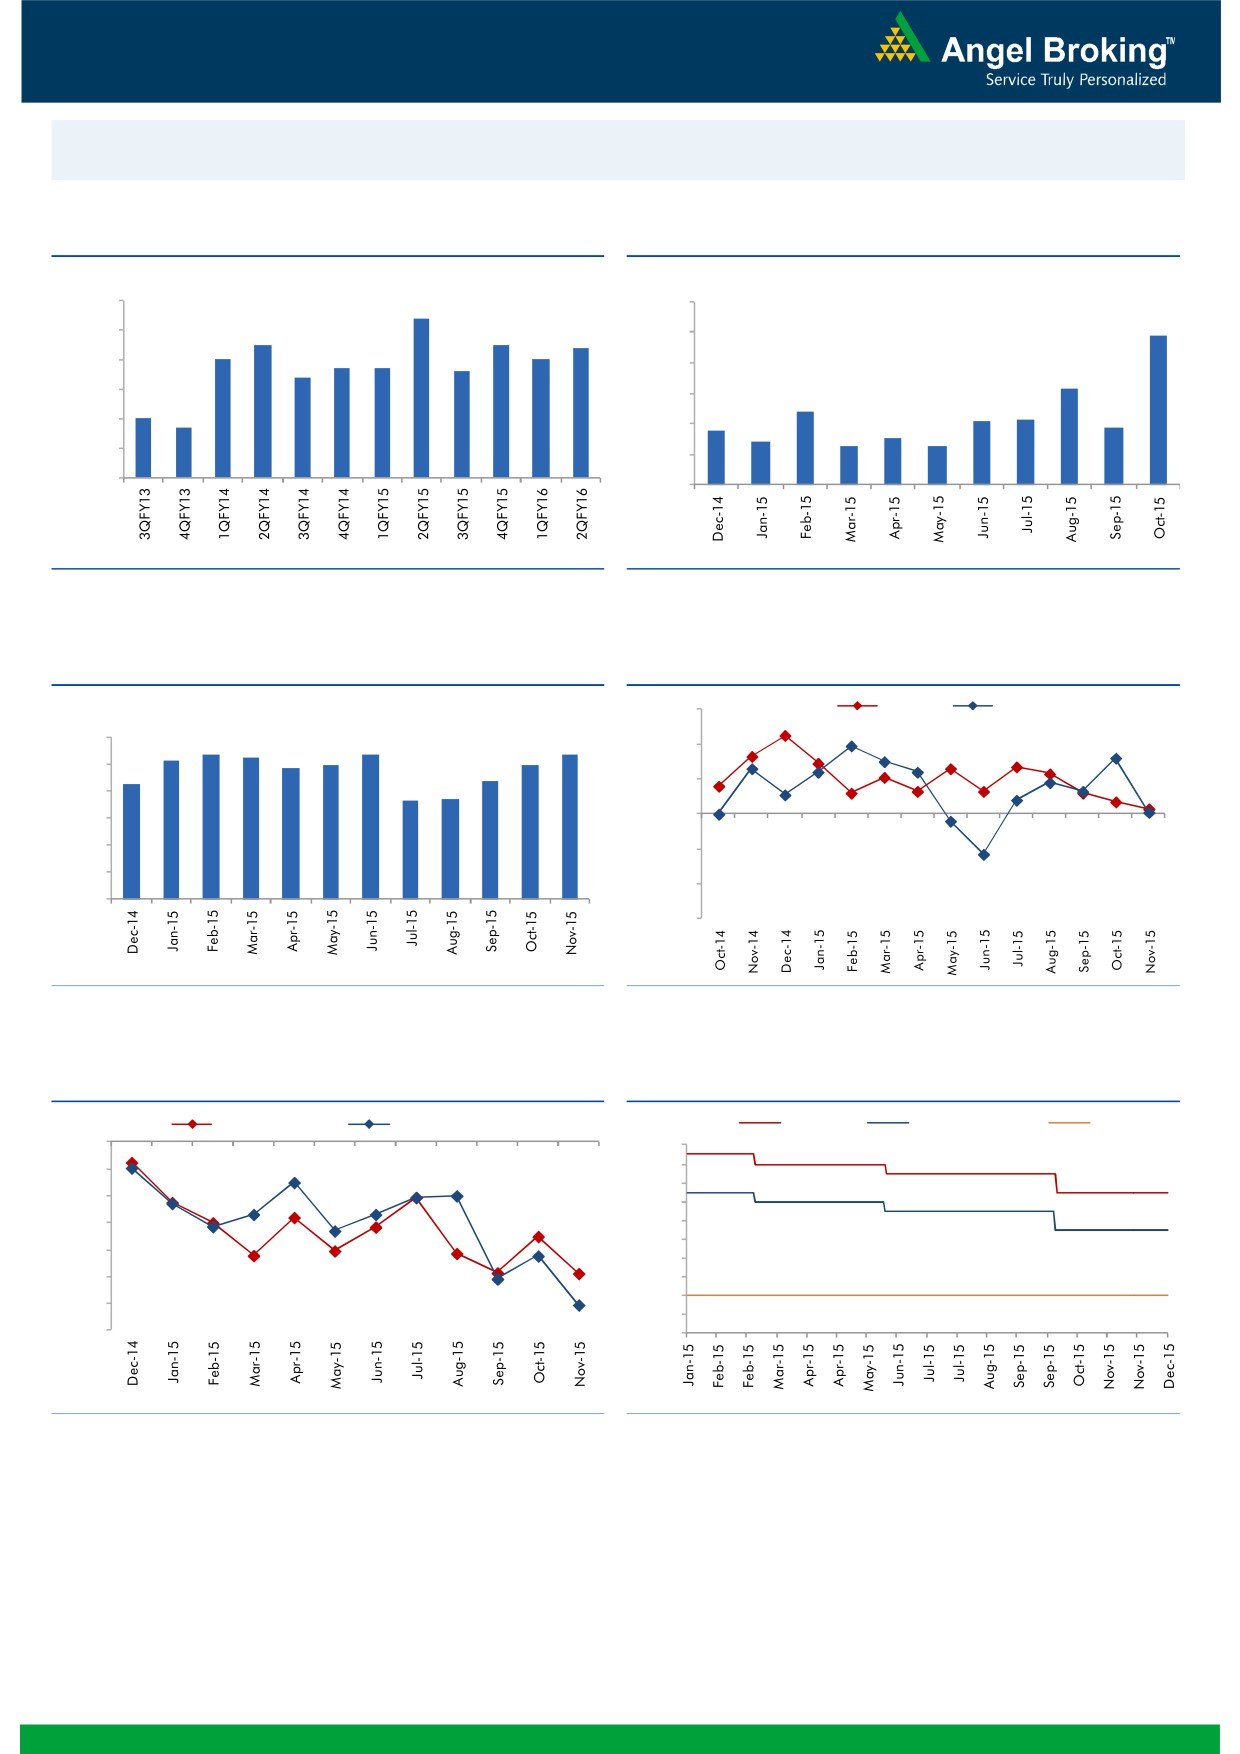
Global watch
Exhibit 1: Latest quarterly GDP Growth (%, yoy) across select developing and developed countries
(%)
8.0
6.9
6.0
5.3
4.7
4.7
4.0
2.9
2.3
2.2
1.8
1.2
1.6
2.0
1.0
-
(2.0)
(4.0)
(4.1)
(4.5)
(6.0)
Source: Bloomberg, Angel Research
Exhibit 2: 2015 GDP Growth projection by IMF (%, yoy) across select developing and developed countries
(%)
7.3
8.0
6.8
6.0
4.7
4.7
4.0
2.5
2.5
2.6
1.4
1.5
2.0
1.2
0.6
(3.8)
-
(2.0)
(4.0)
(3.0)
(6.0)
Source: IMF, Angel Research
Exhibit 3: One year forward P-E ratio across select developing and developed countries
(x)
20.0
18.0
16.0
14.0
12.0
10.0
8.0
6.0
4.0
2.0
-
Source: IMF, Angel Research
Market Outlook
December 21, 2015
Exhibit 4: Relative performance of indices across globe
Returns (%)
Country
Name of index
Closing price
1M
3M
1YR
Brazil
Bovespa
43,911
(7.1)
(9.6)
(11.9)
Russia
Micex
1,719
(5.0)
0.5
21.6
India
Nifty
7,762
(1.0)
(0.4)
(5.6)
China
Shanghai Composite
3,579
0.3
14.9
25.3
South Africa
Top 40
43,979
(5.9)
(4.7)
5.7
Mexico
Mexbol
42,937
(3.5)
(2.0)
1.1
Indonesia
LQ45
771
(0.0)
5.8
(12.5)
Malaysia
KLCI
1,644
(0.8)
(0.2)
(5.1)
Thailand
SET 50
816
(8.6)
(9.1)
(23.8)
USA
Dow Jones
17,129
(2.1)
4.5
(3.8)
UK
FTSE
6,052
(3.6)
(0.9)
(8.0)
Japan
Nikkei
18,987
(3.3)
4.0
6.6
Germany
DAX
10,608
(3.2)
6.6
8.4
France
CAC
4,625
(5.7)
0.9
7.7
Source: Bloomberg, Angel Research
Stock Watch
December 21, 2015
Company Name
Reco
CMP
Target
Mkt Cap
Sales ( Čcr )
OPM(%)
EPS (Č)
PER(x)
P/BV(x)
RoE(%)
EV/Sales(x)
(Č)
Price ( Č)
( Č cr )
FY16E FY17E
FY16E
FY17E
FY16E
FY17E
FY16E
FY17E
FY16E
FY17E
FY16E
FY17E
FY16E
FY17E
Agri / Agri Chemical
Rallis
Neutral
176
-
3,415
2,075
2,394
14.4
14.4
9.5
11.0
18.5
16.0
3.7
3.2
21.1
21.3
1.7
1.4
United Phosphorus
Buy
423
510
18,126
13,698
15,752
17.6
17.6
32.1
38.5
13.2
11.0
2.6
2.1
21.4
21.3
1.4
1.2
Auto & Auto Ancillary
Ashok Leyland
Buy
90
111
25,513
17,995
21,544
11.4
11.6
3.4
4.7
26.4
19.1
4.6
4.3
17.7
22.2
1.4
1.1
Bajaj Auto
Accumulate
2,482
2,728
71,819
23,695
27,298
21.3
20.4
134.6
151.5
18.4
16.4
5.9
5.0
31.8
30.6
2.6
2.3
Bharat Forge
Accumulate
836
943
19,466
7,867
8,881
20.0
20.3
34.4
41.0
24.3
20.4
4.7
3.9
21.1
20.9
2.6
2.3
Eicher Motors
Buy
16,160
19,036
43,882
15,379
16,498
15.6
16.6
473.2
574.8
34.2
28.1
12.6
9.4
36.7
33.2
2.8
2.6
Hero Motocorp
Neutral
2,642
-
52,749
28,561
31,559
14.7
14.7
151.1
163.2
17.5
16.2
6.8
5.8
38.7
35.6
1.7
1.5
Jamna Auto Industries Neutral
130
-
1,036
1,292
1,486
9.3
9.8
6.0
7.5
21.6
17.3
4.5
3.8
20.7
21.8
0.9
0.8
L G Balakrishnan & Bros Neutral
516
-
810
1,254
1,394
11.6
11.8
35.9
41.7
14.4
12.4
2.0
1.7
13.5
13.8
0.8
0.7
Mahindra and Mahindra Buy
1,244
1,449
77,283
39,031
44,440
13.8
13.9
57.9
67.6
21.5
18.4
3.5
3.1
16.1
16.6
1.6
1.4
Maruti
Neutral
4,620
-
139,569
57,865
68,104
16.4
16.7
176.3
225.5
26.2
20.5
5.1
4.3
19.4
21.2
2.2
1.8
Minda Industries
Neutral
878
-
1,393
2,567
2,965
8.0
8.3
46.1
57.8
19.1
15.2
3.2
2.6
16.7
17.3
0.6
0.5
Motherson Sumi
Accumulate
287
313
37,969
39,343
45,100
8.8
9.1
10.1
12.5
28.4
23.0
9.0
7.1
35.3
34.4
1.0
0.9
Rane Brake Lining
Accumulate
335
366
265
454
511
11.1
11.4
23.8
28.1
14.1
11.9
2.0
1.8
14.2
15.3
0.7
0.6
Setco Automotive
Neutral
45
-
597
594
741
12.7
13.7
1.7
3.2
26.3
14.0
2.8
2.4
10.4
16.9
1.5
1.2
Tata Motors
Accumulate
378
402
109,194
255,254
301,772
12.9
13.4
23.7
37.3
16.0
10.1
1.9
1.6
7.4
12.1
0.6
0.5
TVS Motor
Buy
286
338
13,592
11,569
13,648
7.3
8.7
10.3
16.1
27.8
17.8
6.9
5.4
24.8
30.5
1.2
1.0
Amara Raja Batteries
Buy
854
1,040
14,581
4,892
5,871
17.4
17.6
28.8
37.1
29.6
23.0
6.9
5.5
23.4
24.1
2.9
2.4
Exide Industries
Accumulate
145
162
12,334
6,950
7,784
14.4
14.8
6.6
7.3
22.0
19.9
2.8
2.5
12.6
12.8
1.5
1.3
Apollo Tyres
Accumulate
151
171
7,689
12,146
12,689
16.8
16.0
21.2
19.0
7.1
8.0
1.2
1.0
16.5
13.0
0.7
0.8
Ceat
Accumulate
1,030
1,119
4,166
6,041
6,597
14.1
13.7
99.5
111.9
10.4
9.2
2.0
1.7
19.6
18.5
0.8
0.7
JK Tyres
Neutral
108
-
2,444
7,446
7,669
15.2
14.0
19.6
18.4
5.5
5.9
1.4
1.2
25.2
19.5
0.7
0.6
Swaraj Engines
Neutral
941
-
1,168
552
630
14.2
14.7
44.6
54.1
21.1
17.4
4.9
4.5
23.2
25.6
1.9
1.6
Subros
Neutral
105
-
631
1,268
1,488
11.6
11.9
3.7
6.6
28.5
16.0
1.9
1.7
6.8
11.4
0.8
0.6
Indag Rubber
Neutral
208
-
547
283
329
17.0
17.2
13.0
15.4
16.1
13.5
3.5
2.9
21.8
21.6
1.6
1.4
Capital Goods
ACE
Neutral
43
-
429
660
839
4.7
8.2
1.0
3.9
43.4
11.1
1.4
1.2
3.2
11.3
0.8
0.6
BEML
Neutral
1,263
-
5,261
3,277
4,006
6.0
8.9
29.2
64.3
43.3
19.7
2.4
2.2
5.7
11.7
1.6
1.3
BGR Energy
Neutral
116
-
837
3,615
3,181
9.5
9.4
16.7
12.4
7.0
9.4
0.7
0.6
10.0
7.0
0.6
0.8
BHEL
Neutral
167
-
40,838
33,722
35,272
10.8
11.7
10.5
14.2
15.9
11.8
1.2
1.1
7.0
9.0
1.3
1.2
Stock Watch
December 21, 2015
Company Name
Reco
CMP
Target
Mkt Cap
Sales ( Čcr )
OPM(%)
EPS (Č)
PER(x)
P/BV(x)
RoE(%)
EV/Sales(x)
(Č)
Price ( Č)
( Č cr )
FY16E
FY17E
FY16E
FY17E
FY16E
FY17E
FY16E
FY17E
FY16E
FY17E
FY16E
FY17E
FY16E
FY17E
Capital Goods
Blue Star
Buy
369
429
3,320
3,548
3,977
6.3
6.9
13.7
17.2
27.0
21.5
6.8
4.4
26.1
25.4
1.0
0.9
Crompton Greaves
Accumulate
188
204
11,802
13,484
14,687
4.9
6.2
4.5
7.1
41.8
26.5
3.0
2.8
7.2
10.8
1.0
0.9
Inox Wind
Buy
352
505
7,817
4,980
5,943
17.0
17.5
26.6
31.6
13.2
11.2
4.0
2.9
35.0
30.0
1.7
1.4
KEC International
Neutral
160
-
4,112
8,791
9,716
6.1
6.8
5.4
8.2
29.6
19.5
3.0
2.7
10.0
14.0
0.7
0.6
Thermax
Neutral
918
-
10,943
6,413
7,525
7.4
8.5
30.5
39.3
30.1
23.4
4.6
4.0
15.0
17.0
1.7
1.4
Cement
ACC
Buy
1,351
1,630
25,357
13,151
14,757
16.4
18.3
63.9
83.4
21.1
16.2
2.7
2.5
13.3
16.1
1.8
1.5
Ambuja Cements
Buy
200
233
31,022
11,564
12,556
19.4
20.7
8.9
10.1
22.5
19.8
2.8
2.7
12.8
13.8
2.3
2.1
HeidelbergCement
Neutral
76
-
1,723
1,772
1,926
13.3
15.4
1.0
3.0
76.1
25.4
1.9
1.8
2.6
7.9
1.5
1.3
India Cements
Buy
89
112
2,728
4,216
4,840
18.0
19.5
4.0
9.9
22.2
9.0
0.9
0.8
4.0
9.5
1.0
0.8
JK Cement
Accumulate
648
744
4,528
3,661
4,742
10.1
15.8
18.0
61.0
36.0
10.6
2.6
2.3
7.5
22.9
1.7
1.3
J K Lakshmi Cement
Buy
334
430
3,930
2,947
3,616
16.7
19.9
11.5
27.2
29.0
12.3
2.8
2.4
9.8
20.8
1.8
1.4
Mangalam Cements
Neutral
211
-
563
1,053
1,347
10.5
13.3
8.4
26.0
25.1
8.1
1.1
1.0
4.3
12.5
0.9
0.7
Orient Cement
Accumulate
163
183
3,330
1,854
2,524
21.2
22.2
7.7
11.1
21.1
14.6
3.0
2.6
13.3
15.7
2.6
1.8
Ramco Cements
Neutral
364
-
8,656
4,036
4,545
20.8
21.3
15.1
18.8
24.1
19.3
2.9
2.6
12.9
14.3
2.7
2.3
Shree Cement^
Neutral
10,978
-
38,245
7,150
8,742
26.7
28.6
228.0
345.5
48.1
31.8
7.1
5.9
15.7
20.3
5.2
4.1
UltraTech Cement
Accumulate
2,824
3,282
77,507
25,021
30,023
19.1
21.6
89.0
132.0
31.7
21.4
3.7
3.2
12.2
15.9
3.2
2.7
Construction
ITNL
Neutral
83
-
2,727
7,360
8,825
34.0
35.9
7.0
9.0
11.8
9.2
0.4
0.4
3.2
3.7
3.7
3.6
KNR Constructions
Buy
568
673
1,597
937
1,470
14.3
14.0
33.5
38.6
17.0
14.7
2.6
2.2
15.4
15.4
1.8
1.2
Larsen & Toubro
Buy
1,288
1,646
119,950
65,065
77,009
11.5
11.7
61.5
65.6
20.9
19.6
2.1
1.9
13.4
14.0
2.1
1.7
Gujarat Pipavav Port
Neutral
150
-
7,249
629
684
51.0
52.2
6.4
5.9
23.4
25.4
3.1
2.8
15.9
12.7
11.6
10.4
MBL Infrastructures
Buy
215
285
893
2,313
2,797
12.2
14.6
19.0
20.0
11.3
10.8
1.2
1.1
11.3
10.6
1.1
1.0
Nagarjuna Const.
Neutral
76
-
4,250
7,892
8,842
8.8
9.1
3.0
5.3
25.5
14.4
1.3
1.2
5.0
8.5
0.8
0.7
PNC Infratech
Neutral
540
-
2,771
1,873
2,288
13.2
13.5
24.0
32.0
22.5
16.9
2.2
1.9
12.1
12.3
1.6
1.3
Simplex Infra
Neutral
338
-
1,674
5,955
6,829
10.3
10.5
16.0
31.0
21.2
10.9
1.1
1.0
5.3
9.9
0.8
0.7
Power Mech Projects
Neutral
630
-
927
1,539
1,801
12.8
12.7
59.0
72.1
10.7
8.7
1.6
1.4
18.6
16.8
0.6
0.5
Sadbhav Engineering
Neutral
324
-
5,553
3,481
4,219
10.7
10.8
8.0
12.0
40.5
27.0
3.8
3.3
10.3
13.5
1.8
1.5
NBCC
Accumulate
994
1,089
11,930
7,382
9,506
7.7
8.6
39.8
54.4
25.0
18.3
6.0
4.8
26.7
29.1
1.4
1.0
SIPL
Neutral
96
-
3,395
675
1,042
62.4
64.7
-
-
3.6
4.1
-
-
16.7
11.3
Financials
Allahabad Bank
Neutral
70
-
4,213
8,569
9,392
2.8
2.9
16.3
27.5
4.3
2.6
0.4
0.3
7.6
11.9
-
-
Stock Watch
December 21, 2015
Company Name
Reco
CMP
Target
Mkt Cap
Sales ( Čcr )
OPM(%)
EPS (Č)
PER(x)
P/BV(x)
RoE(%)
EV/Sales(x)
(Č)
Price ( Č)
( Č cr )
FY16E
FY17E
FY16E
FY17E
FY16E
FY17E
FY16E
FY17E
FY16E
FY17E
FY16E
FY17E
FY16E
FY17E
Financials
Axis Bank
Buy
432
630
102,858
26,473
31,527
3.5
3.6
35.7
43.5
12.1
9.9
2.3
2.0
17.9
18.9
-
-
Bank of Baroda
Neutral
159
-
36,682
18,485
21,025
1.9
2.0
13.5
21.1
11.8
7.5
0.9
0.8
7.3
10.6
-
-
Bank of India
Neutral
117
-
9,301
15,972
17,271
1.9
2.0
15.3
33.4
7.7
3.5
0.4
0.3
3.6
7.6
-
-
Canara Bank
Neutral
242
-
13,151
15,441
16,945
2.0
2.1
46.6
70.4
5.2
3.4
0.5
0.4
8.0
11.2
-
-
Dena Bank
Neutral
42
-
2,697
3,440
3,840
2.1
2.3
7.3
10.0
5.8
4.2
0.4
0.4
6.1
7.9
-
-
Federal Bank
Neutral
55
-
9,462
3,477
3,999
3.0
3.0
5.0
6.2
11.0
8.8
1.1
1.0
10.6
11.9
-
-
HDFC
Neutral
1,225
-
193,338
10,358
11,852
3.3
3.3
41.1
47.0
29.8
26.0
5.7
5.2
24.7
24.9
-
-
HDFC Bank
Buy
1,073
1,262
270,667
38,309
47,302
4.3
4.3
49.3
61.1
21.8
17.6
3.8
3.2
18.5
19.7
-
-
ICICI Bank
Buy
250
354
145,357
34,279
39,262
3.3
3.3
21.0
24.4
11.9
10.3
2.0
1.7
14.4
14.7
-
-
IDBI Bank
Neutral
89
-
14,283
9,625
10,455
1.8
1.8
8.5
14.2
10.4
6.3
0.7
0.6
5.9
9.3
-
-
Indian Bank
Neutral
114
-
5,451
6,160
6,858
2.5
2.5
24.5
29.8
4.6
3.8
0.4
0.3
7.7
8.6
-
-
LIC Housing Finance
Buy
484
571
24,426
3,101
3,745
2.5
2.5
33.0
40.2
14.7
12.1
2.7
2.3
19.7
20.5
-
-
Oriental Bank
Neutral
140
-
4,184
7,643
8,373
2.4
2.4
37.2
45.4
3.8
3.1
0.3
0.3
8.2
9.4
-
-
Punjab Natl.Bank
Neutral
122
-
23,966
23,638
26,557
2.8
2.8
17.9
27.2
6.8
4.5
0.7
0.6
8.5
12.0
-
-
South Ind.Bank
Neutral
19
-
2,606
1,965
2,185
2.5
2.5
2.5
3.3
7.8
5.8
0.8
0.7
9.5
11.7
-
-
St Bk of India
Buy
227
283
175,943
82,520
93,299
2.7
2.8
20.0
24.5
11.3
9.3
1.2
1.1
11.5
12.8
-
-
Union Bank
Neutral
150
-
10,312
12,646
14,129
2.3
2.4
31.0
39.1
4.8
3.8
0.5
0.4
9.8
11.4
-
-
Vijaya Bank
Neutral
34
-
2,912
3,536
3,827
1.9
1.9
5.5
6.7
6.1
5.1
0.5
0.5
7.8
8.8
-
-
Yes Bank
Buy
719
921
30,144
7,190
9,011
3.2
3.3
58.2
69.7
12.4
10.3
2.2
1.9
19.2
19.6
-
-
FMCG
Asian Paints
Neutral
881
-
84,496
16,553
19,160
16.0
16.2
17.7
21.5
49.8
41.0
13.2
11.9
29.4
31.2
4.9
4.2
Britannia
Neutral
2,891
-
34,679
8,065
9,395
9.6
10.2
47.2
65.5
61.2
44.1
20.4
19.2
38.3
41.2
4.2
3.6
Colgate
Neutral
992
-
26,992
4,836
5,490
19.5
19.7
48.5
53.2
20.5
18.7
15.0
13.1
99.8
97.5
5.5
4.8
Dabur India
Neutral
274
-
48,262
9,370
10,265
17.1
17.2
7.3
8.1
37.4
33.9
11.3
9.2
33.7
30.6
5.1
4.6
GlaxoSmith Con*
Neutral
6,647
-
27,953
4,919
5,742
17.2
17.4
168.3
191.2
39.5
34.8
11.2
9.5
28.8
28.9
5.2
4.4
Godrej Consumer
Neutral
1,311
-
44,659
10,168
12,886
16.1
16.1
32.1
38.4
40.9
34.2
8.3
7.7
19.7
21.0
4.4
3.5
HUL
Neutral
859
-
185,898
34,940
38,957
17.5
17.7
20.8
24.7
41.3
34.8
45.9
36.7
110.5
114.2
5.2
4.6
ITC
Buy
317
382
254,829
41,068
45,068
37.8
37.4
13.9
15.9
22.8
20.0
7.6
6.7
34.1
33.8
5.9
5.3
Marico
Neutral
455
-
29,322
6,551
7,766
15.7
16.0
10.4
12.5
43.8
36.4
12.7
10.6
33.2
32.4
4.4
3.7
Nestle*
Accumulate
5,676
6,646
54,724
11,291
12,847
22.2
22.3
158.9
184.6
35.7
30.8
18.7
16.8
55.0
57.3
4.9
4.2
Stock Watch
December 21, 2015
Company Name
Reco
CMP
Target
Mkt Cap
Sales ( Čcr )
OPM(%)
EPS (Č)
PER(x)
P/BV(x)
RoE(%)
EV/Sales(x)
(Č)
Price ( Č)
( Č cr )
FY16E FY17E
FY16E
FY17E
FY16E
FY17E
FY16E
FY17E
FY16E
FY17E
FY16E
FY17E
FY16E
FY17E
FMCG
Tata Global
Neutral
142
-
8,956
8,635
9,072
9.8
9.9
6.5
7.6
21.8
18.7
2.2
2.1
6.8
7.4
1.0
0.9
IT
HCL Tech^
Buy
847
1,132
119,324
42,038
47,503
23.2
23.5
55.8
62.9
15.2
13.5
3.5
2.7
23.0
19.8
2.5
2.0
Infosys
Buy
1,086
1,306
249,437
60,250
66,999
28.0
28.0
58.3
63.7
18.6
17.1
3.9
3.4
20.9
19.7
3.5
3.0
TCS
Buy
2,416
3,165
476,144
111,274
126,852
28.4
28.7
125.4
143.9
19.3
16.8
7.6
7.0
39.9
42.2
3.9
3.4
Tech Mahindra
Buy
523
646
50,588
25,566
28,890
16.0
17.0
26.3
31.9
19.9
16.4
3.6
3.1
17.9
18.6
1.8
1.5
Wipro
Buy
554
719
136,952
52,414
58,704
23.7
23.8
38.4
42.3
14.4
13.1
2.8
2.5
19.5
18.0
2.2
1.8
Media
D B Corp
Accumulate
328
356
6,023
2,241
2,495
27.8
27.9
21.8
25.6
15.1
12.8
3.9
3.5
26.7
28.5
2.6
2.4
HT Media
Neutral
83
-
1,923
2,495
2,603
11.2
11.2
7.3
8.6
11.3
9.6
0.9
0.8
7.4
8.1
0.3
0.3
Jagran Prakashan
Accumulate
158
169
5,162
2,170
2,355
27.2
26.2
8.9
9.9
17.7
16.0
3.7
3.3
20.9
20.5
2.3
2.1
Sun TV Network
Neutral
388
-
15,308
2,779
3,196
70.2
70.5
22.8
27.3
17.0
14.2
4.2
3.8
26.7
28.3
5.4
4.6
Hindustan Media
Neutral
282
-
2,072
920
1,031
20.0
20.0
19.2
20.9
14.7
13.5
2.4
2.1
16.4
15.3
1.8
1.6
Ventures
Metals & Mining
Coal India
Buy
317
380
199,945
76,167
84,130
19.9
22.3
22.4
25.8
14.1
12.3
5.1
5.0
35.5
41.0
2.0
1.7
Hind. Zinc
Buy
146
175
61,521
14,641
14,026
50.4
50.4
17.7
16.0
8.3
9.1
1.3
1.2
16.2
13.2
1.9
1.8
Hindalco
Neutral
80
-
16,499
104,356
111,186
8.7
9.5
6.7
11.1
11.9
7.2
0.4
0.4
3.5
5.9
0.7
0.6
JSW Steel
Neutral
1,033
-
24,965
42,308
45,147
16.4
20.7
(10.3)
49.5
20.9
1.2
1.1
(1.0)
5.6
1.6
1.5
NMDC
Neutral
90
-
35,821
8,237
10,893
46.6
44.5
10.0
11.7
9.1
7.8
1.0
0.9
12.5
13.0
4.2
3.2
SAIL
Neutral
48
-
19,618
45,915
53,954
7.2
10.5
1.5
4.4
31.5
10.9
0.5
0.5
2.3
4.1
1.1
1.0
Vedanta
Neutral
84
-
24,992
71,445
81,910
26.2
26.3
12.9
19.2
6.5
4.4
0.5
0.4
7.2
8.9
0.8
0.6
Tata Steel
Neutral
255
-
24,800
126,760
137,307
8.9
11.3
6.4
23.1
40.1
11.1
0.8
0.8
2.0
7.1
0.8
0.7
Oil & Gas
Cairn India
Neutral
131
-
24,533
11,323
12,490
49.4
51.0
20.7
20.7
6.3
6.3
0.4
0.4
6.4
6.1
1.2
0.6
GAIL
Neutral
340
-
43,128
64,856
70,933
9.1
9.6
24.0
28.9
14.2
11.8
1.2
1.1
8.8
9.6
0.9
0.8
ONGC
Neutral
223
-
191,001
154,564
167,321
36.8
37.4
28.6
32.5
7.8
6.9
1.0
0.9
12.7
13.5
1.4
1.4
Petronet LNG
Neutral
243
-
18,244
29,691
31,188
5.8
6.2
12.8
13.4
19.0
18.1
2.8
2.5
15.8
14.8
0.7
0.6
Indian Oil Corp
Accumulate
426
455
103,334
359,607
402,760
5.9
6.1
42.5
48.7
10.0
8.7
1.3
1.2
14.1
14.4
0.4
0.3
Reliance Industries
Neutral
992
-
321,346
304,775
344,392
12.6
13.4
91.3
102.6
10.9
9.7
1.2
1.1
11.8
12.0
1.0
0.8
Pharmaceuticals
Alembic Pharma
Neutral
674
-
12,710
2,658
3,112
24.1
20.2
24.6
23.9
27.4
28.2
9.8
7.5
42.5
30.2
4.8
4.0
Aurobindo Pharma
Neutral
832
-
48,563
14,923
17,162
23.0
23.0
38.2
43.6
21.8
19.1
6.7
5.1
36.0
30.2
3.6
3.1
Aventis*
Neutral
4,343
-
10,003
2,082
2,371
17.4
20.8
118.2
151.5
36.7
28.7
5.4
4.3
19.9
25.5
4.5
3.8
Cadila Healthcare
Neutral
391
-
40,003
10,224
11,840
21.0
22.0
14.6
17.6
26.8
22.2
7.3
5.7
30.8
29.0
4.0
3.4
Stock Watch
December 21, 2015
Company Name
Reco
CMP
Target
Mkt Cap
Sales ( Čcr )
OPM(%)
EPS (Č)
PER(x)
P/BV(x)
RoE(%)
EV/Sales(x)
(Č)
Price ( Č)
( Č cr )
FY16E FY17E
FY16E
FY17E
FY16E
FY17E
FY16E
FY17E
FY16E
FY17E
FY16E
FY17E
FY16E
FY17E
Pharmaceuticals
Cipla
Neutral
642
-
51,576
14,211
16,611
20.6
19.0
27.0
28.9
23.8
22.2
4.0
3.5
18.4
16.8
3.6
3.0
Dr Reddy's
Buy
2,975
3,933
50,724
16,838
19,575
25.0
23.1
167.5
178.8
17.8
16.6
3.7
3.1
23.1
20.4
3.0
2.5
Dishman Pharma
Neutral
319
-
2,575
1,733
1,906
21.5
21.5
17.0
19.9
18.8
16.0
1.9
1.7
10.5
11.2
2.0
1.7
GSK Pharma*
Neutral
3,277
-
27,755
2,870
3,158
20.0
22.1
59.5
68.3
55.1
48.0
16.3
16.7
28.5
34.3
9.2
8.4
Indoco Remedies
Neutral
319
-
2,942
1,033
1,199
15.9
18.2
9.4
13.6
34.0
23.5
5.0
4.3
15.7
19.7
2.9
2.5
Ipca labs
Buy
742
900
9,357
3,363
3,909
12.9
18.6
13.4
28.0
55.3
26.5
4.0
3.5
7.4
14.0
3.1
2.6
Lupin
Neutral
1,786
-
80,423
13,092
16,561
25.0
27.0
50.4
68.3
35.4
26.1
7.3
5.8
22.8
24.7
6.0
4.6
Sun Pharma
Buy
790
950
190,230
28,163
32,610
25.8
30.7
17.4
26.9
45.4
29.4
4.3
3.7
13.0
16.6
6.3
5.3
Power
Tata Power
Neutral
65
-
17,580
35,923
37,402
22.6
22.8
4.1
5.2
16.0
12.6
1.2
1.1
7.5
9.3
1.4
1.3
NTPC
Buy
136
157
112,344
87,064
98,846
23.5
23.5
11.7
13.2
11.6
10.3
1.3
1.2
11.4
12.1
2.3
2.1
Power Grid
Buy
135
170
70,810
20,702
23,361
86.7
86.4
12.1
13.2
11.2
10.3
1.7
1.5
15.6
15.1
8.3
7.7
Telecom
Bharti Airtel
Neutral
319
-
127,577
101,748
109,191
32.1
31.7
12.0
12.5
26.6
25.5
1.8
1.7
6.9
6.7
1.9
1.7
Idea Cellular
Neutral
135
-
48,618
34,282
36,941
32.0
31.5
5.9
6.2
22.9
21.8
2.1
1.9
9.9
9.3
2.0
1.9
zOthers
Abbott India
Neutral
5,678
-
12,065
2,715
3,153
14.5
14.1
134.3
152.2
42.3
37.3
10.6
8.7
27.4
25.6
4.1
3.5
Bajaj Electricals
Buy
205
341
2,064
4,719
5,287
5.2
5.8
8.6
12.7
23.9
16.2
2.7
2.4
11.4
14.8
0.4
0.4
Finolex Cables
Neutral
257
-
3,937
2,520
2,883
12.2
12.0
12.7
14.2
20.3
18.1
2.8
2.5
13.6
13.5
1.3
1.1
Goodyear India*
Accumulate
570
622
1,314
1,888
1,680
12.1
11.9
62.2
56.6
9.2
10.1
2.1
1.8
25.9
19.7
0.5
0.5
Hitachi
Neutral
1,438
-
3,909
1,779
2,081
7.8
8.8
21.8
33.4
66.0
43.0
10.6
8.6
17.4
22.1
2.2
1.9
Jyothy Laboratories
Neutral
302
-
5,466
1,620
1,847
11.5
11.5
7.3
8.5
41.4
35.6
5.4
5.0
13.3
14.4
3.3
2.8
MRF
Buy
39,177
45,575
16,616
20,316
14,488
21.4
21.1
5,488.0
3,798.0
7.1
10.3
2.4
2.0
41.1
21.2
0.8
1.0
Page Industries
Neutral
12,919
-
14,410
1,929
2,450
19.8
20.1
229.9
299.0
56.2
43.2
24.8
17.2
52.1
47.1
7.6
6.0
Relaxo Footwears
Neutral
487
-
5,851
1,767
2,152
12.3
12.5
19.3
25.1
25.3
19.5
6.2
4.8
27.7
27.8
3.4
2.8
Siyaram Silk Mills
Buy
1,103
1,354
1,034
1,636
1,815
11.5
11.5
89.9
104.1
12.3
10.6
2.0
1.8
17.9
17.8
0.8
0.7
Styrolution ABS India*
Neutral
691
-
1,215
1,271
1,440
8.6
9.2
32.0
41.1
21.6
16.8
2.2
2.0
10.7
12.4
0.9
0.8
TVS Srichakra
Accumulate
2,837
3,240
2,172
2,101
2,338
15.7
15.0
248.6
270.0
11.4
10.5
5.0
3.6
43.6
34.0
1.1
0.9
HSIL
Neutral
294
-
2,124
2,123
2,384
16.1
16.5
15.0
18.9
19.5
15.6
1.5
1.4
8.0
9.4
1.4
1.2
Kirloskar Engines India
Neutral
242
-
3,500
2,471
2,826
8.8
10.4
9.1
13.3
26.5
18.2
2.5
2.4
9.7
13.4
1.1
0.9
Ltd
M M Forgings
Buy
521
614
629
511
615
21.7
21.6
43.1
55.8
12.1
9.3
2.2
1.8
19.9
21.2
1.4
1.1
Banco Products (India)
Neutral
137
-
980
1,208
1,353
11.0
12.3
10.8
14.5
12.7
9.5
1.5
1.3
11.9
14.5
0.8
0.7
Stock Watch
December 21, 2015
Company Name
Reco
CMP
Target Mkt Cap
Sales ( Čcr )
OPM(%)
EPS (Č)
PER(x)
P/BV(x)
RoE(%)
EV/Sales(x)
(Č)
Price ( Č)
( Č cr )
FY16E FY17E FY16E FY17E FY16E FY17E FY16E FY17E FY16E FY17E FY16E FY17E FY16E FY17E
zOthers
Competent Automobiles Neutral
149
-
92
1,040
1,137
3.2
3.1
25.7
28.0
5.8
5.3
0.9
0.8
15.0
14.3
0.1
0.1
Nilkamal
Neutral
1,071
-
1,598
1,910
2,083
10.5
10.3
63.3
69.2
16.9
15.5
2.8
2.4
17.6
16.5
0.9
0.8
Visaka Industries
Accumulate
127
144
202
1,086
1,197
9.9
10.3
21.5
28.8
5.9
4.4
0.6
0.5
9.6
11.6
0.4
0.3
Transport Corporation of
Neutral
304
-
2,315
2,830
3,350
8.8
9.0
14.4
18.3
21.2
16.6
3.3
2.8
15.4
17.1
0.9
0.8
India
Elecon Engineering
Neutral
87
-
950
1,369
1,533
13.7
14.9
3.3
6.1
26.3
14.4
1.7
1.6
6.6
11.4
1.0
0.9
Surya Roshni
Buy
143
183
629
2,992
3,223
8.1
8.4
14.7
18.3
9.8
7.8
0.9
0.8
9.7
11.0
0.5
0.5
MT Educare
Accumulate
169
169
673
286
366
18.3
17.7
7.7
9.4
21.9
18.0
4.6
4.0
20.2
21.1
2.0
1.5
Radico Khaitan
Buy
116
156
1,541
1,565
1,687
12.2
13.0
5.7
7.1
20.3
16.3
1.7
1.6
8.3
9.6
1.4
1.3
Garware Wall Ropes
Accumulate
391
423
855
861
967
10.9
10.9
24.0
28.2
16.3
13.9
2.4
2.1
14.6
14.9
1.0
0.9
Wonderla Holidays
Neutral
382
-
2,156
206
308
44.0
43.6
9.0
12.9
42.4
29.6
5.8
5.3
13.7
17.8
10.3
6.8
Linc Pen & Plastics
Neutral
208
-
307
340
371
8.3
8.9
10.8
13.2
19.2
15.7
3.1
2.7
16.0
17.1
0.9
0.8
The Byke Hospitality
Accumulate
150
181
601
222
287
20.5
20.5
5.6
7.6
26.6
19.8
5.0
4.1
18.9
20.8
3.0
2.3
Interglobe Aviation
Neutral
1,139
-
41,054
17,022
21,122
20.7
14.5
63.9
53.7
17.8
21.2
26.7
21.9
149.9
103.2
2.6
2.0
Coffee Day Enterprises
Neutral
286
-
5,884
2,692
2,964
17.0
18.6
-
4.7
-
60.3
3.5
3.3
0.2
5.5
2.6
2.4
Ltd
Navneet Education
Buy
83
97
1,977
998
1,062
24.1
24.0
5.8
6.1
14.4
13.6
3.2
2.8
22.0
20.6
2.0
1.9
Source: Company, Angel Research; Note: *December year end; #September year end; &October year end; Price as on December 18, 2015
Market Outlook
December 21, 2015
Research Team Tel: 022 - 39357800
DISCLAIMER
Angel Broking Private Limited (hereinafter referred to as “Angel”) is a registered Member of National Stock Exchange of India Limited,
Bombay Stock Exchange Limited and Metropolitian Stock Exchange of India Limited. It is also registered as a Depository Participant with
CDSL and Portfolio Manager with SEBI. It also has registration with AMFI as a Mutual Fund Distributor. Angel Broking Private Limited is a
registered entity with SEBI for Research Analyst in terms of SEBI (Research Analyst) Regulations, 2014 vide registration number
INH000000164. Angel or its associates has not been debarred/ suspended by SEBI or any other regulatory authority for accessing
/dealing in securities Market. Angel or its associates including its relatives/analyst do not hold any financial interest/beneficial ownership
of more than 1% in the company covered by Analyst. Angel or its associates/analyst has not received any compensation / managed or co
-managed public offering of securities of the company covered by Analyst during the past twelve months. Angel/analyst has not served as
an officer, director or employee of company covered by Analyst and has not been engaged in market making activity of the company
covered by Analyst.
This document is solely for the personal information of the recipient, and must not be singularly used as the basis of any investment
decision. Nothing in this document should be construed as investment or financial advice. Each recipient of this document should make
such investigations as they deem necessary to arrive at an independent evaluation of an investment in the securities of the companies
referred to in this document (including the merits and risks involved), and should consult their own advisors to determine the merits and
risks of such an investment.
Reports based on technical and derivative analysis center on studying charts of a stock's price movement, outstanding positions and
trading volume, as opposed to focusing on a company's fundamentals and, as such, may not match with a report on a company's
fundamentals.
The information in this document has been printed on the basis of publicly available information, internal data and other reliable sources
believed to be true, but we do not represent that it is accurate or complete and it should not be relied on as such, as this document is for
general guidance only. Angel Broking Pvt. Limited or any of its affiliates/ group companies shall not be in any way responsible for any
loss or damage that may arise to any person from any inadvertent error in the information contained in this report. Angel Broking Pvt.
Limited has not independently verified all the information contained within this document. Accordingly, we cannot testify, nor make any
representation or warranty, express or implied, to the accuracy, contents or data contained within this document. While Angel Broking
Pvt. Limited endeavors to update on a reasonable basis the information discussed in this material, there may be regulatory, compliance,
or other reasons that prevent us from doing so.
This document is being supplied to you solely for your information, and its contents, information or data may not be reproduced,
redistributed or passed on, directly or indirectly.
Neither Angel Broking Pvt. Limited, nor its directors, employees or affiliates shall be liable for any loss or damage that may arise from or
in connection with the use of this information.
Note: Please refer to the important ‘Stock Holding Disclosure' report on the Angel website (Research Section). Also, please refer to the
latest update on respective stocks for the disclosure status in respect of those stocks. Angel Broking Pvt. Limited and its affiliates may have
investment positions in the stocks recommended in this report.