Market Outlook
June 21, 2016
Market Cues
Domestic Indices
Chg (%)
(Pts)
(Close)
Indian markets are expected to open in green tracking SGX Nifty and Asian markets.
BSE Sensex
0.9
241
26,867
Nifty
0.8
68
8,239
U.S. Markets rose sharply on Monday as investors grew more hopeful that Britain
will remain in the European Union, letting go of fears that have pulled stocks down
Mid Cap
0.4
45
11,404
in the last two weeks.
Small Cap
0.4
43
11,478
Bankex
0.2
41
20,285
The European markets rallied sharply Monday after the results of recent polls eased
concerns over a possible "Brexit." These were the first opinion polls on the EU
referendum since the killing of lawmaker Jo Cox. The polls showed a shift among
Global Indices
Chg (%)
(Pts)
(Close)
British voters towards the "Remain" camp.
Dow Jones
0.7
130
17,805
Indian markets rose on Monday, tracking a rally in global markets after polls
Nasdaq
0.8
37
4,837
showed support for Britain staying in the European Union regaining momentum
FTSE
3.0
183
6,204
before this week's referendum.
Nikkei
2.3
366
15,965
News Analysis
Hang Seng
1.7
340
20,510
New FDI norms for Pharmaceuticals
Shanghai Com
0.1
4
2,889
Zydus Cadila- Acquires two ANDA’s form Teva
Detailed analysis on Pg2
Advances / Declines
BSE
NSE
Advances
1,387
871
Investor’s Ready Reckoner
Declines
1,210
699
Key Domestic & Global Indicators
Unchanged
201
97
Stock Watch: Latest investment recommendations on 150+ stocks
Refer Pg4 onwards
Volumes (` Cr)
Top Picks
BSE
2,704
CMP
Target
Upside
Company
Sector
Rating
(`)
(`)
(%)
NSE
16,638
Amara Raja
Auto/Auto Ancillary
Buy
858
1,076
25.5
HCL Tech
IT
Buy
769
1,000
30.0
Net Inflows (` Cr)
Net
Mtd
Ytd
LIC Housing
Financials
Buy
480
592
23.2
FII
(537)
3,188
21,823
Bharat Electronics
Capital Goods
Accumulate
1,285
1,414
10.1
MFs
724
(1,917)
7,509
Navkar Corporation Others
Buy
194
265
36.3
More Top Picks on Pg3
Top Gainers
Price (`)
Chg (%)
Key Upcoming Events
Indianb
141
13.8
Previous
Consensus
Date
Region
Event Description
Reading
Expectations
Aloktext
4
9.3
June 22 US
Existing Home sales
5.5
5.6
Rdel
66
7.4
June 22 Euro Zone
Euro Zone Consumer Confidence
(7.0)
(7.0)
Unitech
6
6.7
June 23 US
Intial Jobless claims
277.0
270.0
Jetairways
586
6.6
June 23 Germany
PMI Manufacturing
52.1
52.0
6.(
More Events on Pg4
Top Losers
Price (`)
Chg (%)
Oberoirlty
279
(3.5)
Bajajfinsv
2,007
(2.4)
Wabag
594
(2.4)
Torntpower
177
(2.2)
Muthootfin
260
(2.2)
As on June 20, 2016
Market Outlook
June 21, 2016
New FDI norms for Pharmaceuticals
Under the new FDI norms, 74% FDI would be allowed in pharmaceutical sector
under the automatic route, which means that investors will not need government's
approval to invest up to 74% in existing companies. Currently, FDI up to 100% is
permitted in new projects in the pharmaceutical sector, but in Brownfield ones -the
existing companies- the foreign investment is permitted through FIPB approval.
The new norms will enable enhanced investments (in the form of M&A Activity)
from the MNC companies, which believe in the growth potential of the Domestic
Industry. We remain positive on the sector, maintaining our recommendations.
Zydus Cadila- Acquires two ANDA’s form Teva
Zydus Cadila has acquired 2 ANDA’s by its 100% subsidiary, Zydus Worldwide
DMCC. Zydus has strengthened its US portfolio with ANDAs acquisition from Teva
that are being divested by Teva as a pre-condition to its acquisition of Allergan's
generic business. The estimated market size of two ANDAs put together is nearly
US$200mn. The acquired portfolio comprises an ANDA which is already
commercialised and one pipeline ANDA which is a transdermal patch. The
transaction will be financed through the group's internal accruals. Zydus has made
significant investments in the transdermal manufacturing technology and had also
acquired a transdermal manufacturing facility in the US a few years ago. Given
that the, products are in the transdermal segment, the competition is expected to
be limited, hence would add to the overall profitability. We maintain our buy with
a price target of `400.
Economic and Political News
Govt allows 100% FDI in trading of food products
I&B sets ball rolling for e-auction of 2nd batch of FM radio
World Bank retains 7.6% growth rate for India in 2016-17
Corporate News
Mahindra's services arm aims 400 service outlets this financial year
Apollo Hospitals to establish healthcare facility in China
Eros to buy 50% stake in Vashu Bhagnani's Puja Films
Market Outlook
June 21, 2016
Top Picks ★★★★★
Large Cap
Market Cap
CMP
Target
Upside
Company
Rationale
(` Cr)
(`)
(`)
(%)
To outpace battery industry growth due to better technological
Amara Raja Batteries
14,648
858
1,076
25.5
products leading to market share gains in both the automotive
OEM and replacement segments.
Uptick in defense capex by government, coupled with BELs
Bharat Electronics
30,834
1,285
1,414
10.1
strong market positioning, indicate good times ahead for BEL.
HCL Tech
1,08,487
769
1,000
30.0
Stock is trading at attractive valuations & factors all bad news.
Strong visibility for a robust 20% earnings trajectory, coupled
HDFC Bank
2,96,834
1,172
1,262
7.7
with high quality of earnings on account of high quality retail
business and strategic focus on highly rated corporates.
Back on the growth trend, expect a long term growth of 14% to
Infosys
2,77,609
1,209
1,374
13.7
be a US$20bn in FY2020.
Continues to grow its retail loan book at healthy pace with
LIC Housing Finance
24,241
480
592
23.2
improvement in asset quality. Expect LICHF to post a healthy
loan book which is likely to reflect in a strong earnings growth.
Huge bid pipeline of re-development works at Delhi and other
NBCC
11,166
186
220
18.2
State Governments and opportunity from Smart City, positions
NBCC to report strong growth, going forward.
Strong market positioning within the domestic AC markets to
Voltas
10,621
321
407
26.8
continue, EMP business set to revive
Source: Company, Angel Research
Mid Cap
Market Cap
CMP
Target
Upside
Company
Rationale
(` Cr)
(`)
(`)
(%)
Among the top 4 players in the consumer durables segment.
Bajaj Electricals
2,314
229
268
17.1
Improved profitability backed by turn around in E&P segment.
Strong order book lends earnings visibility.
Favourable outlook for AC industry to augur well for Cooling
Blue Star
3,810
424
495
16.9
products business. EMPPAC division's profitability to improve
once operating environment turns around.
With a focus on the low and medium income (LMI) consumer
Dewan Housing
5,973
205
270
31.9
segment, the company has increased its presence in tier-II & III
cities where the growth opportunity is immense.
Strong loan growth backed by diversified loan portfolio and
Equitas Holdings
6,035
180
235
30.6
adequate CAR. ROE & ROA likely to remain decent as risk of
dilution remains low. Attractive valuations considering growth.
Commencement of new projects, downtrend in the interest rate
IL&FS Transport
2,482
75
93
23.3
cycle, to lead to stock re-rating
Economic recovery to have favourable impact on advertising &
circulation revenue growth. Further, the acquisition of a radio
Jagran Prakashan
5,602
171
205
19.6
business (Radio City) would also boost the company's revenue
growth.
Speedier execution and speedier sales, strong revenue visibility
Mahindra Lifespace
1,876
457
554
21.2
in short-to-long run, attractive valuations
Massive capacity expansion along with rail advantage at ICD
Navkar Corporation
2,772
194
265
36.3
as well CFS augurs well for the company
Earnings boost on back of stable material prices and
Radico Khaitan
1,153
87
125
44.2
favourable pricing environment. Valuation discount to peers
provides additional comfort
Strong brands and distribution network would boost growth
Siyaram Silk Mills
965
1,029
1,347
30.9
going ahead. Stock currently trades at an inexpensive
valuation.
Source: Company, Angel Research
Market Outlook
June 21, 2016
Key Upcoming Events
Global economic events release calendar
Date
Time
Country
Event Description
Unit
Period
Bloomberg Data
Last Reported Estimated
Jun 22, 2016
7:30PM
Euro Zone
Euro-Zone Consumer Confidence
Value
Jun A
(7.00)
(7.00)
7:30PM
US
Existing home sales
Million
May
5.45
5.55
Jun 23, 2016
1:00PM
Germany
PMI Services
Value
Jun P
55.20
55.00
6:00PM
US
Initial Jobless claims
Thousands
Jun 18
277.00
270.00
1:00PM
Germany
PMI Manufacturing
Value
Jun P
52.10
52.00
6:00PM
US
GDP Qoq (Annualised)
% Change
1Q T
0.80
1.00
Jun 28, 2016
7:30PM
US
New home sales
Thousands
May
619.00
560.00
7:30PM
US
Consumer Confidence
S.A./ 1985=100
Jun
92.60
93.10
Jun 30, 2016
1:25PM
Germany
Unemployment change (000's)
Thousands
Jun
(11.00)
--
2:00PM
UK
GDP (YoY)
% Change
1Q F
2.10
--
Jul 1, 2016
2:00PM
UK
PMI Manufacturing
Value
Jun
50.10
--
6:30AM
China
PMI Manufacturing
Value
Jun
50.10
50.10
Jul 7, 2016
2:00PM
UK
Industrial Production (YoY)
% Change
May
1.60
--
Jul 8, 2016
India
Imports YoY%
% Change
Jun
(13.20)
--
India
Exports YoY%
% Change
Jun
(0.80)
--
6:00PM
US
Change in Nonfarm payrolls
Thousands
Jun
38.00
--
6:00PM
US
Unnemployment rate
%
Jun
4.70
--
Jul 10, 2016
5:30PM
India
Industrial Production YoY
% Change
May
(0.80)
--
Jul 12, 2016
7:00AM
China
Consumer Price Index (YoY)
% Change
Jun
2.00
--
Jul 13, 2016
China
Exports YoY%
% Change
Jun
(4.10)
--
Jul 14, 2016
4:30PM
UK
BOE Announces rates
% Ratio
Jul 14
0.50
--
US
Producer Price Index (mom)
% Change
Jun
0.50
--
12:00PM
India
Monthly Wholesale Prices YoY%
% Change
Jun
0.79
--
Jul 15, 2016
2:30PM
Euro Zone
Euro-Zone CPI (YoY)
%
Jun F
(0.10)
--
6:00PM
US
Consumer price index (mom)
% Change
Jun
0.20
--
6:45PM
US
Industrial Production
%
Jun
(0.42)
--
7:30AM
China
Industrial Production (YoY)
% Change
Jun
6.00
--
6:00PM
US
Housing Starts
Thousands
Jun
1,164.00
--
Source: Bloomberg, Angel Research
Market Outlook
June 21, 2016
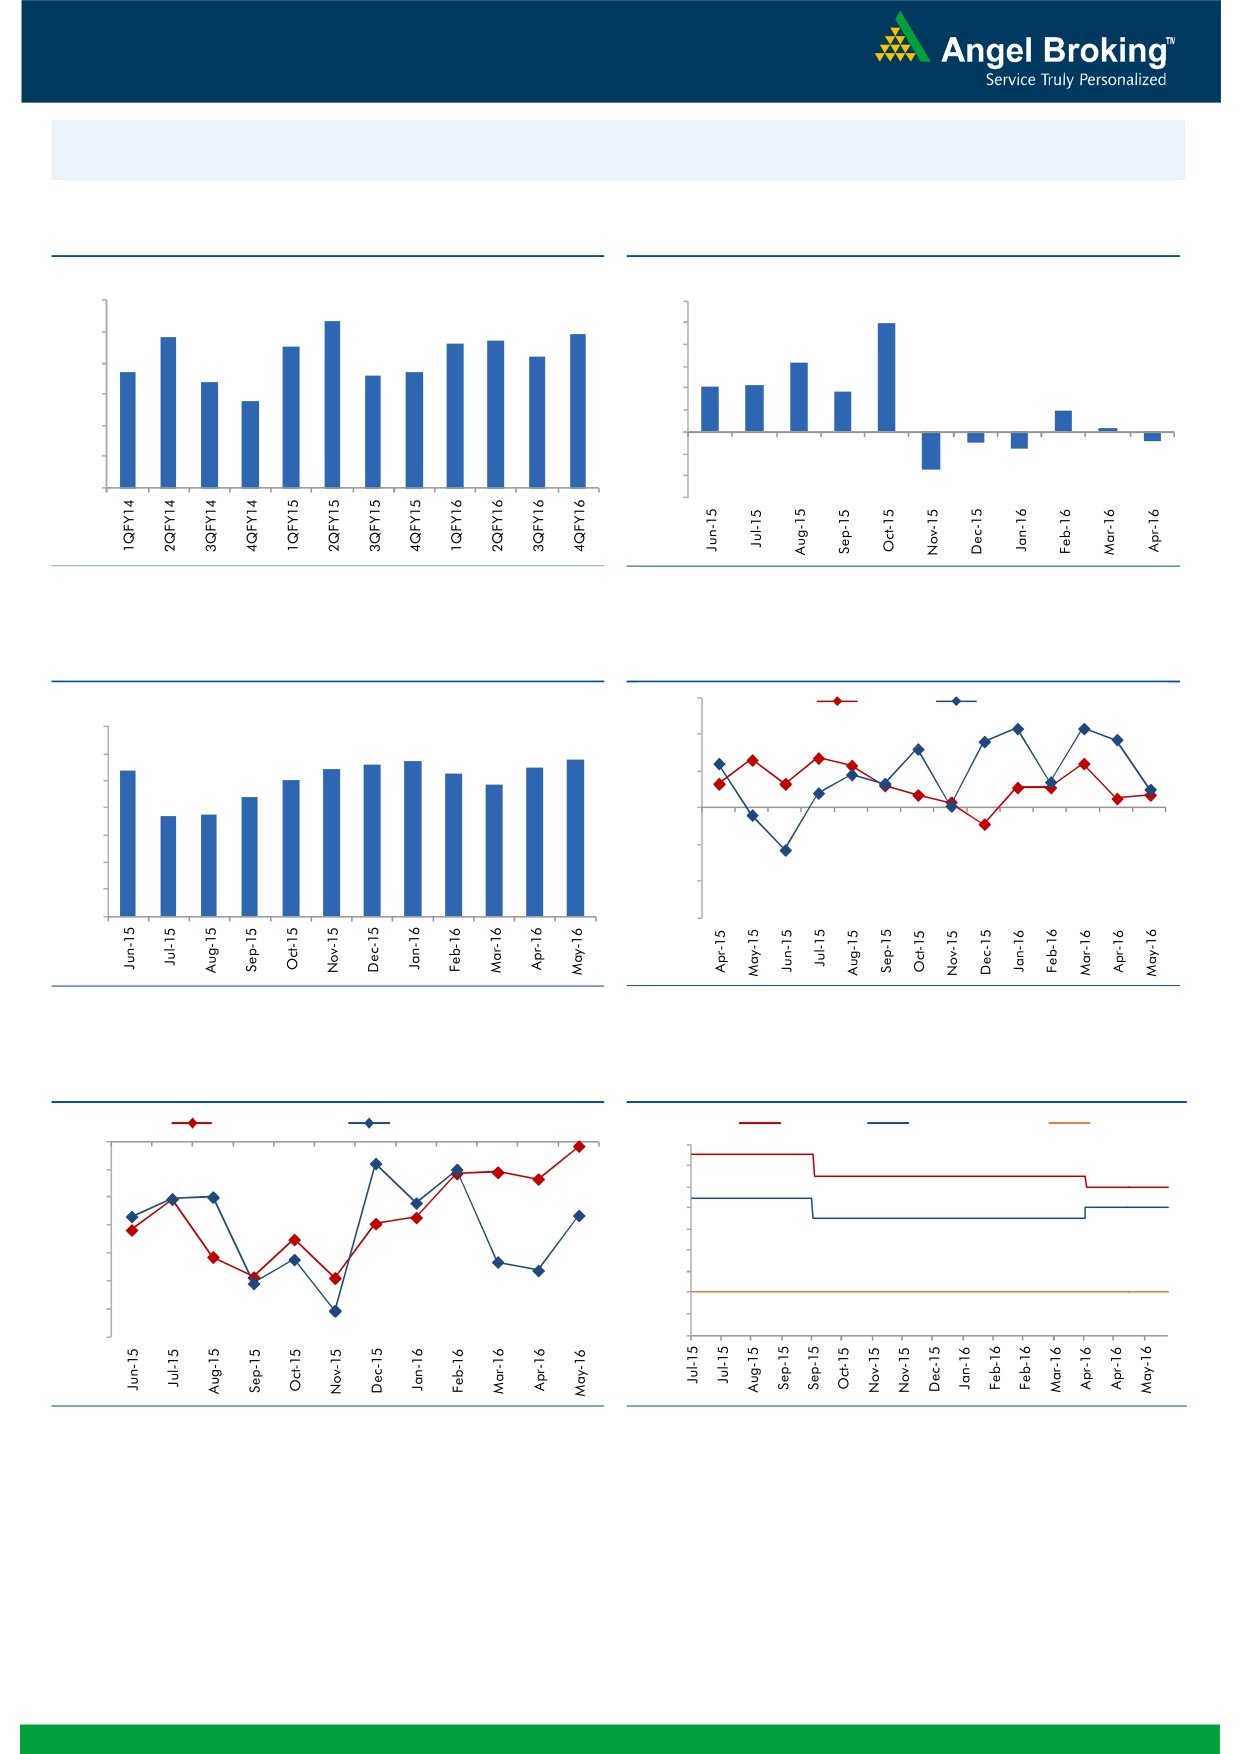
Macro watch
Exhibit 1: Quarterly GDP trends
Exhibit 2: IIP trends
(%)
(%)
9.0
12.0
8.3
9.9
7.8
7.7
7.9
10.0
8.0
7.5
7.6
7.2
8.0
6.3
6.7
6.6
6.7
7.0
6.4
6.0
4.2
4.3
3.7
5.8
4.0
6.0
2.0
2.0
0.3
5.0
-
4.0
(2.0)
(0.9)
(0.8)
(1.6)
(4.0)
3.0
(3.4)
(6.0)
Source: CSO, Angel Research
Source: MOSPI, Angel Research
Exhibit 3: Monthly CPI inflation trends
Exhibit 4: Manufacturing and services PMI
56.0
Mfg. PMI
Services PMI
(%)
7.0
54.0
5.7
5.8
5.4
5.4
5.6
5.5
6.0
5.3
5.0
4.8
52.0
5.0
4.4
3.7
3.7
4.0
50.0
3.0
48.0
2.0
46.0
1.0
-
44.0
Source: MOSPI, Angel Research
Source: Market, Angel Research; Note: Level above 50 indicates expansion
Exhibit 5: Exports and imports growth trends
Exhibit 6: Key policy rates
(%)
Exports yoy growth
Imports yoy growth
(%)
Repo rate
Reverse Repo rate
CRR
0.0
7.50
(5.0)
7.00
6.50
(10.0)
6.00
(15.0)
5.50
(20.0)
5.00
4.50
(25.0)
4.00
(30.0)
3.50
(35.0)
3.00
Source: Bloomberg, Angel Research
Source: RBI, Angel Research
Market Outlook
June 21, 2016
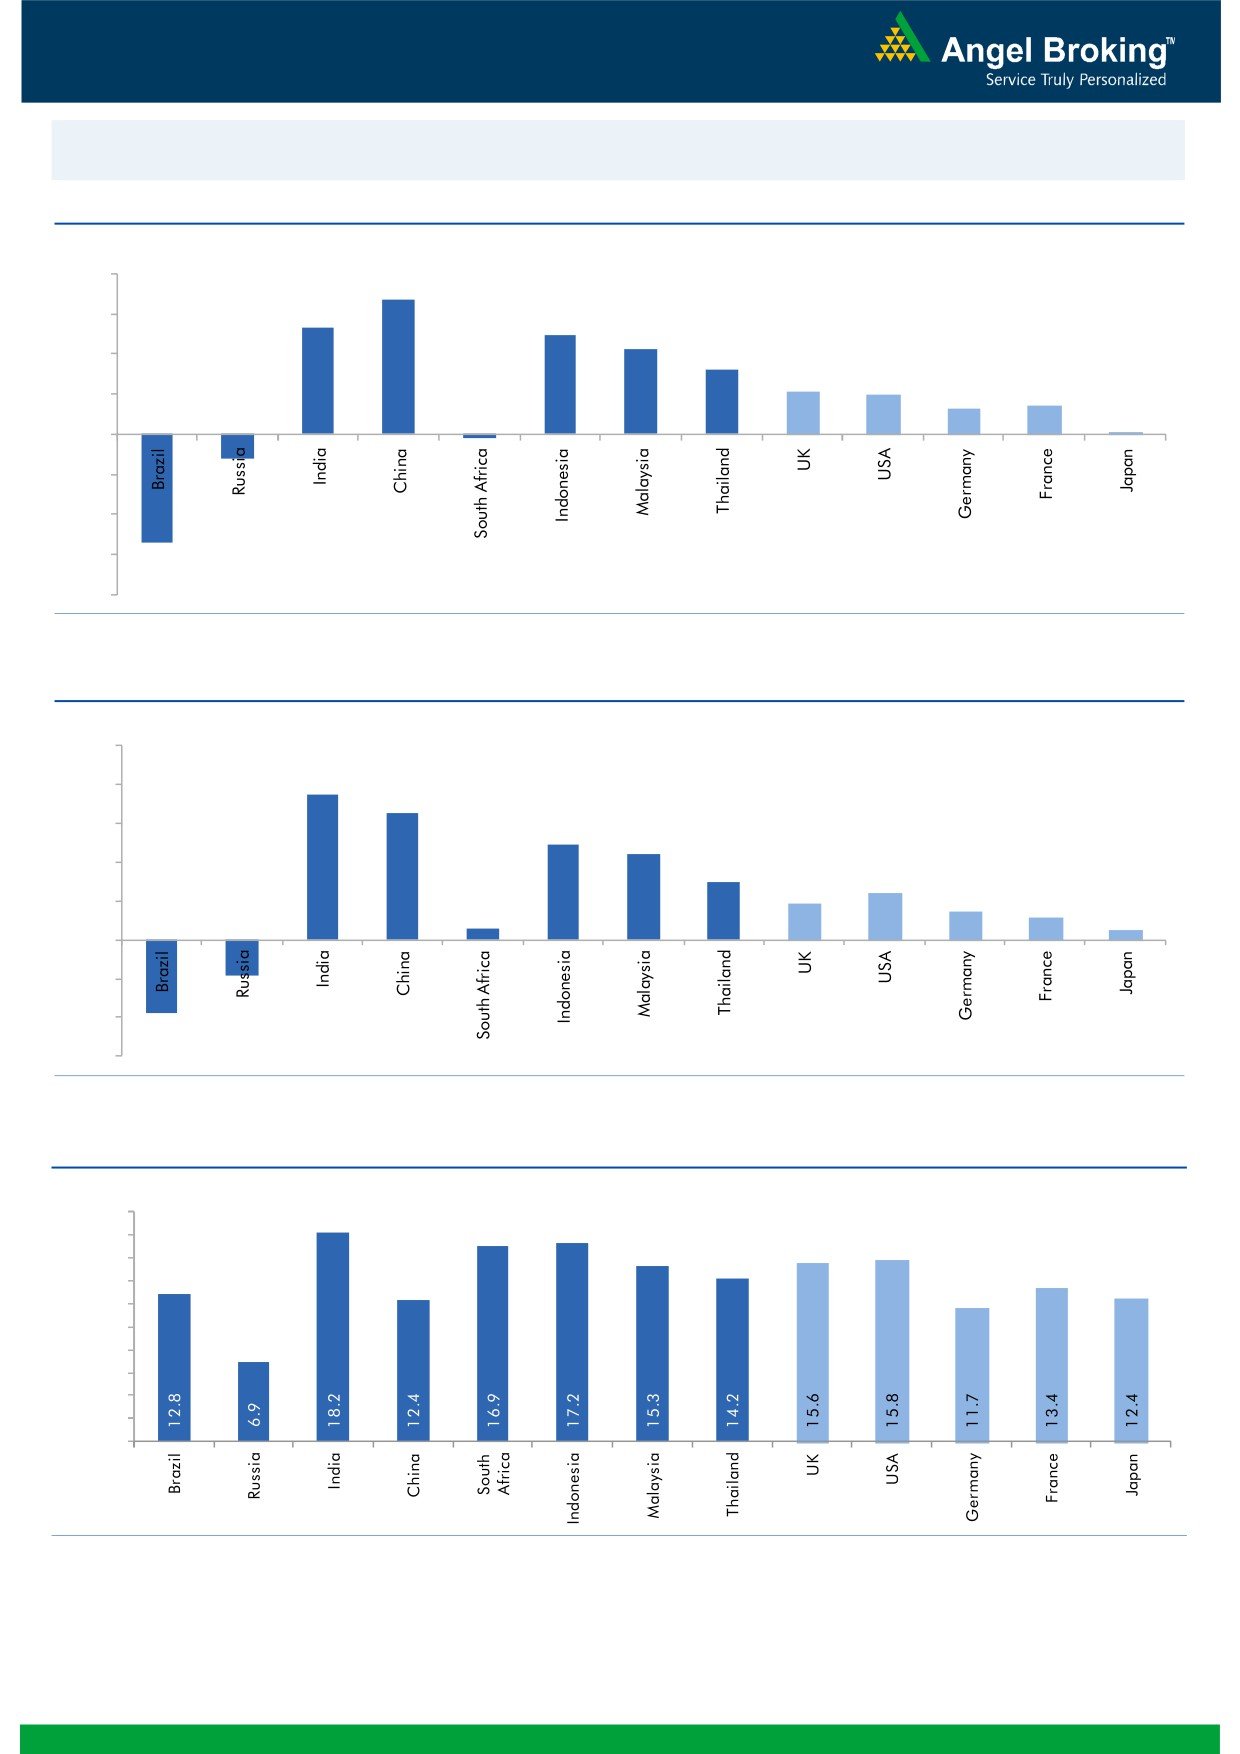
Global watch
Exhibit 1: Latest quarterly GDP Growth (%, yoy) across select developing and developed countries
(%)
8.0
6.7
6.0
5.3
4.9
4.2
4.0
3.2
2.1
2.0
1.3
1.4
2.0
0.1
-
(0.2)
(2.0)
(4.0)
(1.2)
(6.0)
(5.4)
(8.0)
Source: Bloomberg, Angel Research
Exhibit 2: 2016 GDP Growth projection by IMF (%, yoy) across select developing and developed countries
(%)
10.0
7.5
8.0
6.5
6.0
4.9
4.4
4.0
3.0
2.4
1.9
1.5
2.0
1.1
0.6
0.5
(3.8)
(1.8)
-
(2.0)
(4.0)
(6.0)
Source: IMF, Angel Research
Exhibit 3: One year forward P-E ratio across select developing and developed countries
(x)
20.0
18.0
16.0
14.0
12.0
10.0
8.0
6.0
4.0
2.0
-
Source: IMF, Angel Research
Stock Watch
June 21, 2016
Company Name
Reco
CMP
Target
Mkt Cap
Sales ( Čcr )
OPM(%)
EPS (Č)
PER(x)
P/BV(x)
RoE(%)
EV/Sales(x)
(Č)
Price ( Č)
( Č cr )
FY16E FY17E
FY16E
FY17E
FY16E
FY17E
FY16E
FY17E
FY16E
FY17E
FY16E
FY17E
FY16E
FY17E
Agri / Agri Chemical
Rallis
Neutral
214
-
4,157
1,612
1,911
13.3
13.3
7.4
9.5
28.9
22.5
4.6
4.1
16.7
18.4
2.6
2.2
United Phosphorus
Buy
569
684
24,394
13,083
15,176
18.5
18.5
31.5
37.4
18.1
15.2
3.6
3.0
21.4
21.4
2.0
1.7
Auto & Auto Ancillary
Ashok Leyland
Accumulate
100
111
28,388
17,995
21,544
11.4
11.6
3.4
4.7
29.3
21.2
5.1
4.7
17.7
22.2
1.5
1.2
Bajaj Auto
Neutral
2,612
-
75,584
22,709
25,860
20.9
20.1
129.0
143.6
20.3
18.2
6.2
5.3
30.7
29.4
2.8
2.4
Bharat Forge
Buy
755
875
17,571
7,351
8,318
19.9
19.7
31.2
36.5
24.2
20.7
4.3
3.7
19.3
19.2
2.5
2.1
Eicher Motors
Accumulate
18,661
20,044
50,684
15,556
16,747
15.5
17.3
464.8
597.5
40.2
31.2
14.7
10.8
36.2
34.3
3.2
2.9
Gabriel India
Accumulate
94
101
1,350
1,415
1,544
8.7
9.0
4.6
5.4
20.4
17.4
3.7
3.3
18.1
18.9
0.9
0.8
Hero Motocorp
Neutral
3,049
-
60,878
28,244
30,532
15.5
15.9
156.7
168.5
19.5
18.1
7.8
6.6
39.9
36.4
2.0
1.8
Jamna Auto Industries Neutral
174
-
1,387
1,281
1,473
11.2
11.5
7.6
9.2
22.9
18.9
5.8
4.7
25.4
25.2
1.1
1.0
L G Balakrishnan & Bros Neutral
461
-
724
1,254
1,394
11.6
11.8
35.9
41.7
12.9
11.1
1.7
1.5
13.5
13.8
0.7
0.6
Mahindra and Mahindra Neutral
1,351
-
83,897
38,416
42,904
13.7
13.9
54.8
63.4
24.7
21.3
3.8
3.4
15.4
15.8
1.8
1.6
Maruti
Neutral
4,134
-
124,884
57,865
68,104
16.4
16.7
176.3
225.5
23.5
18.3
4.6
3.9
19.4
21.2
1.9
1.6
Minda Industries
Neutral
1,157
-
1,836
2,523
2,890
8.7
9.0
55.0
65.4
21.0
17.7
4.1
3.3
19.3
18.7
0.8
0.7
Motherson Sumi
Accumulate
297
313
39,219
39,343
45,100
8.8
9.1
10.1
12.5
29.4
23.7
9.3
7.3
35.3
34.4
1.1
0.9
Rane Brake Lining
Buy
379
465
300
454
511
11.5
12.0
25.2
31.0
15.0
12.2
2.3
2.0
14.9
16.6
0.8
0.7
Setco Automotive
Neutral
44
-
590
594
741
12.7
13.7
1.7
3.2
26.0
13.8
2.7
2.4
10.4
16.9
1.4
1.2
Tata Motors
Neutral
482
-
139,062
259,686
273,957
13.0
13.4
25.9
29.5
18.6
16.3
2.4
2.1
8.0
9.0
0.7
0.7
TVS Motor
Accumulate
293
330
13,915
11,263
13,122
6.9
8.5
9.2
15.0
31.8
19.5
7.3
5.8
22.7
29.6
1.2
1.0
Amara Raja Batteries
Buy
858
1,076
14,648
4,690
5,429
17.5
17.5
28.5
35.3
30.1
24.3
7.0
5.7
23.1
25.9
3.1
2.7
Exide Industries
Neutral
162
-
13,736
6,950
7,784
14.4
14.8
6.6
7.3
24.5
22.1
3.1
2.8
12.6
12.8
1.7
1.5
Apollo Tyres
Buy
150
183
7,638
12,056
12,714
17.2
16.4
23.0
20.3
6.5
7.4
1.2
1.0
17.7
13.6
0.7
0.7
Ceat
Buy
839
1,119
3,394
6,041
6,597
14.1
13.7
99.5
111.9
8.4
7.5
1.7
1.4
19.6
18.5
0.7
0.6
JK Tyres
Neutral
89
-
2,010
7,446
7,669
15.2
14.0
19.6
18.4
4.5
4.8
1.1
0.9
25.2
19.5
0.7
0.6
Swaraj Engines
Neutral
1,108
-
1,376
552
630
14.2
14.7
44.6
54.1
24.8
20.5
5.8
5.3
23.2
25.6
2.4
2.0
Subros
Neutral
89
-
536
1,293
1,527
11.8
11.9
4.2
6.7
21.3
13.3
1.6
1.5
7.7
11.5
0.7
0.6
Indag Rubber
Neutral
193
-
508
283
329
17.0
17.2
13.0
15.4
14.9
12.5
3.3
2.7
21.8
21.6
1.5
1.3
Capital Goods
ACE
Neutral
40
-
400
660
839
4.7
8.2
1.0
3.9
40.5
10.4
1.3
1.1
3.2
11.3
0.8
0.6
BEML
Buy
869
1,157
3,617
3,277
4,006
6.0
8.9
36.2
64.3
24.0
13.5
1.7
1.5
5.7
11.7
1.1
0.9
Bharat Electronics
Accumulate
1,285
1,414
30,834
7,295
8,137
20.0
16.8
56.5
58.7
22.7
21.9
3.4
3.0
42.1
44.6
3.3
2.9
Stock Watch
June 21, 2016
Company Name
Reco
CMP
Target
Mkt Cap
Sales ( Čcr )
OPM(%)
EPS (Č)
PER(x)
P/BV(x)
RoE(%)
EV/Sales(x)
(Č)
Price ( Č)
( Č cr )
FY16E
FY17E
FY16E
FY17E
FY16E
FY17E
FY16E
FY17E
FY16E
FY17E
FY16E
FY17E
FY16E
FY17E
Capital Goods
Voltas
Buy
321
407
10,621
5,857
6,511
7.5
7.9
11.7
12.9
27.4
24.9
4.5
3.9
17.1
16.7
1.8
1.6
BGR Energy
Neutral
113
-
819
3,615
3,181
9.5
9.4
16.7
12.4
6.8
9.2
0.6
0.6
10.0
7.0
0.6
0.8
BHEL
Neutral
124
-
30,338
33,722
35,272
10.8
11.7
10.5
14.2
11.8
8.7
0.9
0.8
7.0
9.0
1.0
0.9
Blue Star
Accumulate
424
495
3,810
3,770
4,351
5.7
6.4
11.4
17.2
37.1
24.7
5.8
5.4
18.4
23.1
1.1
0.9
Crompton Greaves
Neutral
74
-
4,635
13,484
14,687
4.9
6.2
4.5
7.1
16.4
10.4
1.2
1.1
7.2
10.8
0.5
0.4
Greaves Cotton
Neutral
138
-
3,376
1,655
1,755
16.6
16.8
7.4
7.8
18.7
17.7
3.7
3.5
21.1
20.6
2.0
1.8
Inox Wind
Buy
230
286
5,106
4,406
5,605
15.5
15.7
20.4
24.8
11.3
9.3
2.6
1.9
27.9
25.9
1.4
1.1
KEC International
Neutral
138
-
3,548
8,791
9,716
6.1
6.8
5.4
8.2
25.6
16.8
2.6
2.3
10.0
14.0
0.6
0.6
Thermax
Neutral
801
-
9,549
6,413
7,525
7.4
8.5
30.5
39.3
26.3
20.4
4.1
3.5
15.0
17.0
1.5
1.2
VATech Wabag
Accumulate
592
681
3,226
2,722
3,336
7.9
8.1
19.5
24.6
30.4
24.1
3.2
2.8
11.1
12.4
1.3
1.1
Cement
ACC
Neutral
1,570
-
29,490
13,151
14,757
16.4
18.3
63.9
83.4
24.6
18.8
3.2
2.9
13.3
16.1
2.1
1.8
Ambuja Cements
Neutral
241
-
37,455
11,564
12,556
19.4
20.7
8.9
10.1
27.1
23.9
3.4
3.2
12.8
13.8
2.8
2.5
HeidelbergCement
Neutral
107
-
2,417
1,772
1,926
13.3
15.4
1.0
3.0
106.7
35.6
2.7
2.5
2.6
7.9
1.9
1.7
India Cements
Neutral
105
-
3,222
4,216
4,840
18.0
19.5
4.0
9.9
26.2
10.6
1.0
1.0
4.0
9.5
1.1
0.9
JK Cement
Neutral
653
-
4,563
3,661
4,742
10.1
15.8
7.5
28.5
87.0
22.9
2.6
2.3
7.5
22.9
1.7
1.3
J K Lakshmi Cement
Neutral
391
-
4,598
2,947
3,616
16.7
19.9
11.5
27.2
34.0
14.4
3.2
2.8
9.8
20.8
1.9
1.5
Mangalam Cements
Neutral
288
-
769
1,053
1,347
10.5
13.3
8.4
26.0
34.3
11.1
1.5
1.3
4.3
12.5
1.1
0.8
Orient Cement
Neutral
164
-
3,368
1,854
2,524
21.2
22.2
7.7
11.1
21.4
14.8
3.1
2.6
13.3
15.7
2.6
1.8
Ramco Cements
Neutral
557
-
13,256
4,036
4,545
20.8
21.3
15.1
18.8
36.9
29.6
4.5
4.0
12.9
14.3
3.7
3.3
Shree Cement^
Neutral
13,736
-
47,852
7,150
8,742
26.7
28.6
228.0
345.5
60.2
39.8
8.9
7.4
15.7
20.3
6.4
5.2
UltraTech Cement
Neutral
3,363
-
92,303
24,669
29,265
18.2
20.6
82.0
120.0
41.0
28.0
4.4
3.9
11.3
14.7
3.7
3.2
Construction
ITNL
Buy
75
93
2,482
7,360
8,682
34.0
32.2
7.0
8.6
10.8
8.8
0.4
0.4
3.2
2.5
3.7
3.5
KNR Constructions
Accumulate
557
603
1,566
937
1,470
14.3
14.0
44.2
38.6
12.6
14.4
2.5
2.2
15.4
15.4
1.7
1.1
Larsen & Toubro
Buy
1,506
1,700
140,328
58,870
65,708
8.3
10.3
42.0
53.0
35.9
28.4
2.5
2.3
8.8
11.2
2.6
2.3
Gujarat Pipavav Port
Neutral
154
-
7,421
629
684
51.0
52.2
6.4
5.9
24.0
26.0
3.2
2.9
15.9
12.7
11.5
10.3
MBL Infrastructures
Buy
117
285
486
2,313
2,797
12.2
14.6
19.0
20.0
6.2
5.9
0.6
0.6
11.3
10.6
0.9
0.8
Nagarjuna Const.
Neutral
76
-
4,225
7,892
8,842
8.8
9.1
3.0
5.3
25.3
14.3
1.3
1.2
5.0
8.5
0.8
0.6
PNC Infratech
Buy
552
647
2,832
1,873
2,288
13.2
13.5
24.0
32.0
23.0
17.3
2.2
2.0
12.1
12.3
1.6
1.3
Simplex Infra
Neutral
273
-
1,348
5,955
6,829
10.3
10.5
16.0
31.0
17.0
8.8
0.9
0.8
5.3
9.9
0.7
0.6
Stock Watch
June 21, 2016
Company Name
Reco
CMP
Target
Mkt Cap
Sales ( Čcr )
OPM(%)
EPS (Č)
PER(x)
P/BV(x)
RoE(%)
EV/Sales(x)
(Č)
Price ( Č)
( Č cr )
FY16E
FY17E
FY16E
FY17E
FY16E
FY17E
FY16E
FY17E
FY16E
FY17E
FY16E
FY17E
FY16E
FY17E
Construction
Power Mech Projects
Neutral
544
-
800
1,539
1,801
12.8
12.7
59.0
72.1
9.2
7.6
1.4
1.2
18.6
16.8
0.5
0.5
Sadbhav Engineering
Neutral
282
-
4,833
3,186
3,598
10.2
10.3
8.0
9.0
35.2
31.3
3.3
2.9
9.4
9.9
1.9
1.7
NBCC
Buy
186
220
11,166
5,838
7,428
6.0
7.9
5.2
8.2
35.8
22.7
1.1
0.9
21.9
28.2
1.7
1.2
MEP Infra
Neutral
38
-
611
1,956
1,876
28.1
30.5
1.3
3.0
28.9
12.5
6.1
4.1
21.2
32.8
1.7
1.7
SIPL
Neutral
100
-
3,505
675
1,042
62.4
64.7
-
-
3.7
4.3
-
-
16.9
11.4
Engineers India
Neutral
201
-
6,783
1,667
1,725
13.5
16.0
9.7
11.4
20.8
17.7
2.4
2.4
11.7
13.4
2.9
2.9
Financials
Allahabad Bank
Neutral
60
-
4,327
8,569
9,392
2.8
2.9
16.3
27.5
3.7
2.2
0.3
0.3
7.6
11.9
-
-
Axis Bank
Neutral
525
-
125,204
26,204
29,738
3.6
3.5
34.5
35.4
15.2
14.8
2.4
2.1
16.8
14.9
-
-
Bank of Baroda
Neutral
152
-
35,000
18,802
21,088
2.0
2.2
(7.4)
13.0
11.7
1.2
1.0
(4.2)
7.3
-
-
Bank of India
Neutral
97
-
9,032
15,972
17,271
1.9
2.0
15.3
33.4
6.3
2.9
0.3
0.3
3.6
7.6
-
-
Canara Bank
Neutral
209
-
11,338
15,441
16,945
2.0
2.1
46.6
70.4
4.5
3.0
0.4
0.3
8.0
11.2
-
-
Dena Bank
Neutral
37
-
2,451
3,440
3,840
2.1
2.3
7.3
10.0
5.1
3.7
0.4
0.3
6.1
7.9
-
-
Dewan Housing Finance Buy
205
270
5,973
1,828
2,225
2.9
3.0
24.9
29.7
8.2
6.9
1.3
1.1
15.1
16.1
-
-
Equitas Holdings
Buy
180
235
6,035
679
1,076
12.4
11.7
6.2
6.7
29.1
26.9
3.6
2.6
13.3
12.5
-
-
Federal Bank
Neutral
57
-
9,802
3,279
3,787
2.8
2.9
3.9
5.5
14.5
10.3
1.2
1.1
8.4
10.8
-
-
HDFC
Neutral
1,228
-
194,079
10,358
11,852
3.3
3.3
41.1
47.0
29.9
26.1
5.7
5.2
24.7
24.9
-
-
HDFC Bank
Accumulate
1,172
1,262
296,834
38,606
47,696
4.4
4.5
48.8
61.4
24.0
19.1
4.1
3.6
18.7
20.0
-
-
ICICI Bank
Neutral
238
-
138,588
34,279
39,262
3.3
3.3
21.0
24.4
11.4
9.8
1.9
1.6
14.4
14.7
-
-
IDBI Bank
Neutral
71
-
14,700
9,625
10,455
1.8
1.8
8.5
14.2
8.4
5.0
0.5
0.5
5.9
9.3
-
-
Indian Bank
Neutral
141
-
6,770
6,160
6,858
2.5
2.5
24.5
29.8
5.8
4.7
0.5
0.4
7.7
8.6
-
-
LIC Housing Finance
Buy
480
592
24,241
3,179
3,758
2.6
2.6
32.9
40.6
14.6
11.8
2.7
2.3
19.6
20.7
-
-
Oriental Bank
Neutral
103
-
3,548
7,643
8,373
2.4
2.4
37.2
45.4
2.8
2.3
0.2
0.2
8.2
9.4
-
-
Punjab Natl.Bank
Neutral
96
-
18,909
23,122
26,022
2.8
2.8
7.0
21.6
13.8
4.5
0.7
0.6
3.4
10.0
-
-
South Ind.Bank
Neutral
20
-
2,755
1,965
2,185
2.5
2.5
2.5
3.3
8.2
6.2
0.8
0.7
9.5
11.7
-
-
St Bk of India
Neutral
216
-
167,521
79,958
86,061
2.6
2.6
13.4
20.7
16.1
10.4
1.3
1.2
11.5
12.8
-
-
Union Bank
Neutral
128
-
8,810
12,646
14,129
2.3
2.4
31.0
39.1
4.1
3.3
0.4
0.4
9.8
11.4
-
-
Vijaya Bank
Neutral
37
-
3,681
3,536
3,827
1.9
1.9
5.5
6.7
6.7
5.5
0.6
0.5
7.8
8.8
-
-
Yes Bank
Neutral
1,075
-
45,247
7,190
9,011
3.2
3.3
58.2
69.7
18.5
15.4
3.3
2.8
19.2
19.6
-
-
FMCG
Asian Paints
Neutral
992
-
95,143
15,534
17,445
17.7
16.8
18.4
19.6
54.0
50.6
19.1
18.0
34.6
35.6
6.0
5.4
Stock Watch
June 21, 2016
Company Name
Reco
CMP
Target
Mkt Cap
Sales ( Čcr )
OPM(%)
EPS (Č)
PER(x)
P/BV(x)
RoE(%)
EV/Sales(x)
(Č)
Price ( Č)
( Č cr )
FY16E FY17E
FY16E
FY17E
FY16E
FY17E
FY16E
FY17E
FY16E
FY17E
FY16E
FY17E
FY16E
FY17E
FMCG
Britannia
Neutral
2,623
-
31,469
8,481
9,795
14.0
14.1
65.5
78.3
40.1
33.5
19.0
15.6
38.3
41.2
3.7
3.2
Colgate
Neutral
866
-
23,544
4,136
4,632
22.5
23.3
22.2
25.3
39.0
34.2
23.7
21.1
68.6
67.5
5.5
4.9
Dabur India
Neutral
313
-
55,096
9,370
10,265
17.6
17.3
7.3
8.1
42.7
38.7
11.1
10.1
31.7
30.6
5.7
5.2
GlaxoSmith Con*
Accumulate
5,620
6,118
23,636
4,519
5,142
19.6
19.8
164.3
191.2
34.2
29.4
9.5
8.1
30.8
29.9
4.7
4.1
Godrej Consumer
Neutral
1,557
-
53,031
9,003
10,335
18.1
18.7
34.1
41.8
45.7
37.3
9.9
8.5
23.9
24.8
5.9
5.2
HUL
Neutral
880
-
190,408
33,299
35,497
17.1
17.1
18.9
20.0
46.6
44.0
40.8
35.5
87.6
80.8
5.5
5.2
ITC
Accumulate
358
380
288,331
36,837
39,726
38.8
38.7
12.2
13.5
29.3
26.6
8.2
7.2
27.8
26.9
7.3
6.8
Marico
Neutral
254
-
32,796
6,151
6,966
17.2
17.3
5.4
6.4
47.1
39.7
14.8
11.7
33.2
32.4
5.2
4.6
Nestle*
Neutral
6,518
-
62,846
9,393
10,507
22.2
22.3
106.8
121.8
61.0
53.5
21.4
19.3
34.8
36.7
6.4
5.7
Tata Global
Accumulate
126
137
7,962
8,635
9,072
9.8
9.9
5.8
7.2
21.8
17.5
1.9
1.9
6.8
7.4
1.0
0.9
Procter & Gamble
Buy
6,260
7,369
20,320
2,588
2,939
23.3
23.2
130.2
146.2
48.1
42.8
95.9
91.9
27.6
25.3
7.4
6.4
Hygiene
IT
HCL Tech^
Buy
769
1,000
108,487
37,061
30,781
21.5
20.5
51.4
40.0
15.0
19.2
3.9
2.8
20.1
20.3
2.6
2.8
Infosys
Buy
1,209
1,374
277,609
62,441
70,558
27.5
27.5
59.0
65.3
20.5
18.5
4.1
3.7
22.2
22.4
3.8
3.3
TCS
Buy
2,656
3,004
523,287
108,646
122,770
28.3
28.3
123.7
141.0
21.5
18.8
7.1
6.5
33.1
34.6
4.3
3.7
Tech Mahindra
Buy
545
700
52,885
26,494
30,347
16.3
17.0
32.2
37.5
16.9
14.5
3.7
3.2
21.7
21.8
1.7
1.4
Wipro
Buy
557
680
137,606
50,808
56,189
23.7
23.8
37.3
40.7
14.9
13.7
2.8
2.6
19.2
17.7
2.1
1.8
Media
D B Corp
Neutral
372
-
6,828
2,025
2,187
27.4
27.4
17.4
18.9
21.4
19.7
4.8
4.4
22.9
23.7
3.4
3.1
HT Media
Neutral
78
-
1,814
2,495
2,673
12.9
13.2
6.8
7.2
11.5
10.8
0.9
0.8
7.5
7.8
0.3
0.2
Jagran Prakashan
Buy
171
205
5,602
2,107
2,355
33.5
28.0
10.1
10.8
17.1
15.9
4.0
3.4
23.3
21.7
2.7
2.4
Sun TV Network
Neutral
372
-
14,648
2,510
2,763
71.8
71.5
21.9
24.8
17.0
15.0
4.0
3.6
22.8
24.3
5.3
4.8
Hindustan Media
Neutral
272
-
1,997
914
1,016
21.7
21.5
21.9
23.3
12.4
11.7
2.2
1.9
18.0
16.2
1.6
1.4
Ventures
Metals & Mining
Coal India
Buy
312
380
197,007
76,167
84,130
19.9
22.3
22.4
25.8
13.9
12.1
5.0
4.9
35.5
41.0
1.9
1.7
Hind. Zinc
Neutral
176
-
74,429
14,641
14,026
50.4
50.4
17.7
16.0
10.0
11.0
1.5
1.4
16.2
13.2
2.6
2.5
Hindalco
Neutral
121
-
25,007
104,356
111,186
8.7
9.5
6.7
11.1
18.0
11.0
0.6
0.6
3.5
5.9
0.8
0.7
JSW Steel
Neutral
1,404
-
33,938
42,308
45,147
16.4
20.7
(10.3)
49.5
28.4
1.6
1.5
(1.0)
5.6
1.8
1.7
NMDC
Neutral
93
-
36,674
8,237
10,893
46.6
44.5
10.0
11.7
9.3
7.9
1.0
0.9
12.5
13.0
4.3
3.3
SAIL
Neutral
45
-
18,627
45,915
53,954
7.2
10.5
1.5
4.4
29.9
10.3
0.4
0.4
2.3
4.1
1.0
0.9
Vedanta
Neutral
129
-
38,096
71,445
81,910
26.2
26.3
12.9
19.2
10.0
6.7
0.7
0.6
7.2
8.9
1.0
0.7
Tata Steel
Neutral
336
-
32,647
126,760
137,307
8.9
11.3
6.4
23.1
52.8
14.6
1.1
1.0
2.0
7.1
0.8
0.8
Stock Watch
June 21, 2016
Company Name
Reco
CMP
Target
Mkt Cap
Sales ( Čcr )
OPM(%)
EPS (Č)
PER(x)
P/BV(x)
RoE(%)
EV/Sales(x)
(Č)
Price ( Č)
( Č cr )
FY16E FY17E
FY16E
FY17E
FY16E
FY17E
FY16E
FY17E
FY16E
FY17E
FY16E
FY17E
FY16E
FY17E
Oil & Gas
Cairn India
Neutral
138
-
25,798
11,323
12,490
49.4
51.0
20.7
20.7
6.6
6.7
0.4
0.4
6.4
6.1
1.4
0.7
GAIL
Neutral
385
-
48,849
64,856
70,933
9.1
9.6
24.0
28.9
16.1
13.3
1.4
1.3
8.8
9.6
0.9
0.8
ONGC
Neutral
214
-
182,916
154,564
145,998
36.8
37.4
20.8
22.6
10.3
9.5
1.0
0.9
10.1
9.7
1.4
1.5
Petronet LNG
Neutral
287
-
21,529
29,691
31,188
5.8
6.2
12.8
13.4
22.5
21.4
3.4
3.0
15.8
14.8
0.8
0.8
Indian Oil Corp
Accumulate
411
455
99,667
359,607
402,760
5.9
6.1
42.5
48.7
9.7
8.4
1.3
1.1
14.1
14.4
0.4
0.3
Reliance Industries
Neutral
991
-
321,180
304,775
344,392
12.6
13.4
91.3
102.6
10.9
9.7
1.2
1.1
11.8
12.0
1.0
0.8
Pharmaceuticals
Alembic Pharma
Neutral
527
-
9,933
3,145
3,483
31.9
16.2
38.2
18.7
13.8
28.2
6.2
5.2
57.9
20.1
3.1
2.8
Aurobindo Pharma
Accumulate
738
768
43,212
13,651
15,702
21.7
21.7
33.9
38.4
21.8
19.2
6.1
4.7
32.5
27.7
3.4
3.0
Aventis*
Accumulate
4,192
4,738
9,654
2,049
2,375
15.4
17.3
115.4
153.5
36.3
27.3
5.9
4.6
19.3
25.8
4.5
3.7
Cadila Healthcare
Buy
316
400
32,350
9,469
11,246
21.2
22.0
14.9
17.1
21.2
18.5
6.0
4.7
28.8
26.6
3.4
2.8
Cipla
Neutral
487
-
39,106
13,372
15,378
16.4
17.4
18.8
21.6
25.9
22.5
3.3
2.9
13.3
13.7
2.9
2.8
Dr Reddy's
Buy
3,058
3,476
52,149
15,471
17,479
24.6
24.6
138.2
152.4
22.1
20.1
4.1
3.5
19.7
18.7
3.3
2.9
Dishman Pharma
Neutral
136
-
2,201
1,733
1,906
21.5
21.5
10.1
10.0
13.5
13.6
1.6
1.4
10.5
11.2
1.8
1.5
GSK Pharma*
Neutral
3,487
-
29,535
2,741
3,528
16.5
18.9
44.2
60.1
78.9
58.0
17.4
17.3
21.2
29.9
10.5
8.2
Indoco Remedies
Neutral
270
-
2,488
977
1,112
14.9
18.2
9.0
13.2
30.0
20.5
4.3
3.6
15.1
19.2
2.8
2.4
Ipca labs
Buy
478
613
6,025
2,844
3,799
10.6
15.3
10.6
17.3
45.1
27.6
2.6
2.4
5.9
9.1
2.3
1.7
Lupin
Buy
1,461
1,809
65,865
13,702
15,912
23.7
26.4
50.5
58.1
28.9
25.2
6.0
4.9
22.9
21.4
5.3
4.2
Sun Pharma
Buy
740
944
178,107
27,744
31,129
26.0
30.0
22.0
28.0
33.6
26.4
4.9
4.1
18.3
18.7
6.3
5.4
Power
Tata Power
Neutral
75
-
20,298
35,923
37,402
22.6
22.8
4.1
5.2
18.5
14.6
1.4
1.3
7.5
9.3
1.5
1.4
NTPC
Neutral
154
-
126,980
87,271
99,297
23.5
23.5
11.8
13.3
13.1
11.6
1.5
1.4
11.5
12.2
2.5
2.2
Power Grid
Accumulate
157
170
81,901
20,702
23,361
86.7
86.4
12.1
13.2
13.0
11.9
1.9
1.7
15.6
15.1
8.9
8.3
Real Estate
MLIFE
Buy
457
554
1,876
826
1,011
20.1
21.9
22.7
30.7
20.1
14.9
1.2
1.1
6.0
7.4
4.2
3.2
Telecom
Bharti Airtel
Neutral
365
-
145,885
101,748
109,191
32.1
31.7
12.0
12.5
30.4
29.2
2.1
2.0
6.9
6.7
2.0
1.8
Idea Cellular
Neutral
103
-
37,068
34,282
36,941
32.0
31.5
5.9
6.2
17.5
16.6
1.6
1.5
9.9
9.3
1.6
1.6
zOthers
Abbott India
Neutral
4,421
-
9,394
2,715
3,153
14.5
14.1
134.3
152.2
32.9
29.0
8.2
6.8
27.4
25.6
3.2
2.7
Bajaj Electricals
Buy
229
268
2,314
4,612
5,351
5.6
5.7
23.4
18.0
9.8
12.8
3.0
2.7
12.5
14.4
0.5
0.4
Finolex Cables
Neutral
361
-
5,521
2,520
2,883
12.2
12.0
12.7
14.2
28.5
25.4
3.9
3.4
13.6
13.5
2.0
1.7
Goodyear India*
Buy
516
631
1,190
1,800
1,600
11.7
11.5
58.7
52.9
8.8
9.7
2.0
1.7
24.6
18.7
0.5
0.4
Hitachi
Neutral
1,267
-
3,444
1,779
2,081
7.8
8.8
21.8
33.4
58.1
37.9
9.4
7.6
17.4
22.1
2.0
1.7
Stock Watch
June 21, 2016
Company Name
Reco
CMP
Target
Mkt Cap
Sales ( Čcr )
OPM(%)
EPS (Č)
PER(x)
P/BV(x)
RoE(%)
EV/Sales(x)
(Č)
Price ( Č)
( Č cr )
FY16E
FY17E
FY16E
FY17E
FY16E
FY17E
FY16E
FY17E
FY16E
FY17E
FY16E
FY17E
FY16E
FY17E
zOthers
Jyothy Laboratories
Neutral
297
-
5,381
1,620
1,847
11.5
11.5
7.3
8.5
40.8
35.1
5.3
4.9
13.3
14.4
3.2
2.7
MRF
Buy
32,251
45,575
13,678
20,316
14,488
21.4
21.1
5,488.0
3,798.0
5.9
8.5
2.0
1.6
41.1
21.2
0.6
0.8
Page Industries
Neutral
13,673
-
15,250
1,929
2,450
19.8
20.1
229.9
299.0
59.5
45.7
26.2
18.2
52.1
47.1
7.9
6.2
Relaxo Footwears
Neutral
496
-
5,957
1,767
2,152
12.3
12.5
19.3
25.1
25.8
19.8
6.3
4.9
27.7
27.8
3.4
2.8
Siyaram Silk Mills
Buy
1,029
1,347
965
1,619
1,799
11.6
11.6
93.5
104.9
11.0
9.8
1.9
1.6
17.1
16.4
0.8
0.8
Styrolution ABS India* Neutral
609
-
1,071
1,271
1,440
8.6
9.2
32.0
41.1
19.0
14.8
1.9
1.7
10.7
12.4
0.8
0.7
TVS Srichakra
Buy
2,343
2,932
1,794
2,035
2,252
15.9
15.3
248.6
268.1
9.4
8.7
4.1
3.0
43.6
33.9
0.9
0.8
HSIL
Buy
258
310
1,863
2,123
2,384
16.1
16.5
15.0
18.9
17.1
13.7
1.3
1.2
8.0
9.4
1.2
1.1
Kirloskar Engines India
Neutral
260
-
3,760
2,403
2,554
8.6
9.9
9.2
10.5
28.3
24.8
2.7
2.6
9.7
10.7
1.2
1.1
Ltd
M M Forgings
Buy
429
546
518
511
615
21.7
21.6
43.1
55.8
10.0
7.7
1.8
1.5
19.9
21.2
1.2
0.9
Banco Products (India) Neutral
144
-
1,032
1,208
1,353
11.0
12.3
10.8
14.5
13.4
10.0
1.5
1.4
11.9
14.5
0.8
0.7
Competent Automobiles Neutral
142
-
87
1,040
1,137
3.2
3.1
25.7
28.0
5.5
5.1
0.8
0.7
15.0
14.3
0.1
0.1
Nilkamal
Neutral
1,150
-
1,716
1,871
2,031
10.7
10.5
63.2
69.8
18.2
16.5
3.0
2.5
17.6
16.6
1.0
0.8
Visaka Industries
Accumulate
153
162
243
1,020
1,120
8.7
9.1
13.9
20.1
11.0
7.6
0.7
0.7
6.4
8.7
0.5
0.4
Transport Corporation of
Neutral
308
-
2,362
2,830
3,350
8.8
9.0
14.4
18.3
21.5
16.9
3.3
2.9
15.4
17.1
0.9
0.8
India
Elecon Engineering
Neutral
63
-
684
1,359
1,482
10.3
13.7
0.8
3.9
78.2
16.1
1.3
1.2
1.6
7.8
0.9
0.8
Surya Roshni
Buy
162
201
709
2,992
3,223
8.1
8.4
14.7
18.3
11.0
8.8
1.0
0.9
9.7
11.0
0.5
0.5
MT Educare
Neutral
171
-
681
286
366
18.3
17.7
7.7
9.4
22.1
18.3
4.7
4.1
20.2
21.1
2.3
1.7
Radico Khaitan
Buy
87
125
1,153
1,543
1,659
12.6
13.0
5.8
6.3
15.0
13.7
1.3
1.2
8.5
8.6
1.2
1.1
Garware Wall Ropes
Buy
353
460
773
828
898
11.2
10.3
28.3
29.0
12.5
12.2
2.1
1.8
16.8
14.9
0.8
0.8
Wonderla Holidays
Neutral
395
-
2,232
206
308
44.0
43.6
9.0
12.9
43.9
30.6
6.0
5.4
13.7
17.8
10.9
7.2
Linc Pen & Plastics
Neutral
232
-
343
344
382
9.1
9.1
12.4
13.1
18.7
17.7
3.4
3.0
18.0
16.7
1.1
1.0
The Byke Hospitality
Neutral
160
-
641
222
287
20.5
20.5
5.6
7.6
28.4
21.2
5.4
4.4
18.9
20.8
2.9
2.3
Interglobe Aviation
Neutral
1,072
-
38,619
17,022
21,122
20.7
14.5
63.9
53.7
16.8
20.0
25.1
20.6
149.9
103.2
2.2
1.7
Coffee Day Enterprises
Neutral
256
-
5,275
2,692
2,964
17.0
18.6
-
4.7
-
54.0
3.1
3.0
0.2
5.5
2.3
2.2
Ltd
Navneet Education
Neutral
94
-
2,232
998
1,062
24.1
24.0
5.8
6.1
16.3
15.4
3.6
3.2
22.0
20.6
2.3
2.2
Navkar Corporation
Buy
194
265
2,772
347
408
43.2
42.9
6.7
6.8
29.1
28.7
2.1
2.0
7.3
6.9
8.6
7.8
UFO Moviez
Neutral
518
-
1,430
558
619
32.0
33.2
22.5
30.0
23.0
17.3
2.8
2.4
12.0
13.8
2.5
2.1
VRL Logistics
Neutral
303
-
2,767
1,725
1,902
16.5
16.7
12.2
14.6
24.9
20.8
5.2
4.6
20.8
21.9
1.7
1.5
Stock Watch
June 21, 2016
Company Name
Reco
CMP
Target Mkt Cap
Sales ( Čcr )
OPM(%)
EPS (Č)
PER(x)
P/BV(x)
RoE(%)
EV/Sales(x)
(Č)
Price ( Č)
( Č cr )
FY16E FY17E FY16E FY17E FY16E FY17E FY16E FY17E FY16E FY17E FY16E FY17E FY16E FY17E
zOthers
Team Lease Serv.
Neutral
889
-
1,520
2,565
3,229
1.3
1.5
15.2
22.8
58.6
39.0
4.7
4.2
8.0
10.7
0.5
0.4
S H Kelkar & Co.
Neutral
212
-
3,065
928
1,036
15.3
15.1
4.9
6.1
42.9
34.7
4.0
3.7
9.4
10.7
3.2
2.8
Quick Heal
Neutral
268
-
1,878
339
408
27.8
27.3
7.1
7.7
37.9
34.6
3.2
3.2
8.5
9.3
4.6
3.8
Narayana Hrudaya
Neutral
322
-
6,585
1,603
1,873
10.9
11.5
1.0
2.6
338.2
121.8
8.1
7.5
2.4
6.1
4.2
3.5
Manpasand Bever.
Neutral
542
-
2,714
540
836
19.9
19.6
10.2
16.9
53.0
32.1
4.3
3.9
8.1
12.0
4.7
3.0
Source: Company, Angel Research; Note: *December year end; #September year end; &October year end; Price as on June 20, 2016
Market Outlook
June 21, 2016
Research Team Tel: 022 - 39357800
DISCLAIMER
Angel Broking Private Limited (hereinafter referred to as “Angel”) is a registered Member of National Stock Exchange of India Limited,
Bombay Stock Exchange Limited and Metropolitian Stock Exchange of India Limited. It is also registered as a Depository Participant with
CDSL and Portfolio Manager with SEBI. It also has registration with AMFI as a Mutual Fund Distributor. Angel Broking Private Limited is a
registered entity with SEBI for Research Analyst in terms of SEBI (Research Analyst) Regulations, 2014 vide registration number
INH000000164. Angel or its associates has not been debarred/ suspended by SEBI or any other regulatory authority for accessing
/dealing in securities Market. Angel or its associates including its relatives/analyst do not hold any financial interest/beneficial ownership
of more than 1% in the company covered by Analyst. Angel or its associates/analyst has not received any compensation / managed or co
-managed public offering of securities of the company covered by Analyst during the past twelve months. Angel/analyst has not served as
an officer, director or employee of company covered by Analyst and has not been engaged in market making activity of the company
covered by Analyst.
This document is solely for the personal information of the recipient, and must not be singularly used as the basis of any investment
decision. Nothing in this document should be construed as investment or financial advice. Each recipient of this document should make
such investigations as they deem necessary to arrive at an independent evaluation of an investment in the securities of the companies
referred to in this document (including the merits and risks involved), and should consult their own advisors to determine the merits and
risks of such an investment.
Reports based on technical and derivative analysis center on studying charts of a stock's price movement, outstanding positions and
trading volume, as opposed to focusing on a company's fundamentals and, as such, may not match with a report on a company's
fundamentals.
The information in this document has been printed on the basis of publicly available information, internal data and other reliable sources
believed to be true, but we do not represent that it is accurate or complete and it should not be relied on as such, as this document is for
general guidance only. Angel Broking Pvt. Limited or any of its affiliates/ group companies shall not be in any way responsible for any
loss or damage that may arise to any person from any inadvertent error in the information contained in this report. Angel Broking Pvt.
Limited has not independently verified all the information contained within this document. Accordingly, we cannot testify, nor make any
representation or warranty, express or implied, to the accuracy, contents or data contained within this document. While Angel Broking
Pvt. Limited endeavors to update on a reasonable basis the information discussed in this material, there may be regulatory, compliance,
or other reasons that prevent us from doing so.
This document is being supplied to you solely for your information, and its contents, information or data may not be reproduced,
redistributed or passed on, directly or indirectly.
Neither Angel Broking Pvt. Limited, nor its directors, employees or affiliates shall be liable for any loss or damage that may arise from or
in connection with the use of this information.
Note: Please refer to the important ‘Stock Holding Disclosure' report on the Angel website (Research Section). Also, please refer to the
latest update on respective stocks for the disclosure status in respect of those stocks. Angel Broking Pvt. Limited and its affiliates may have
investment positions in the stocks recommended in this report.