Market Outlook
April 21, 2016
Market Cues
Domestic Indices
Chg (%)
(Pts)
(Close)
BSE Sensex
0.1
28
25,844
Indian markets are expected to open positive tracking SGX Nifty.
Nifty
0.0
0
7,915
US markets closed higher though off from day’s high as oil futures and upbeat
Mid Cap
0.1
11
11,064
housing data acted as a support. A data from the US Energy Information
Small Cap
0.6
70
11,134
Administration showed a fall in weekly domestic output for a six straight week, as a
result crude oil futures turned higher. The Dowjones closed up 42 points. Over the
Bankex
0.8
142
18,588
past one month the market has been supported by formerly beaten down sectors
indicating a possible broader investor churn in sectors like energy, materials and
Global Indices
Chg (%)
(Pts)
(Close)
industrial.
Dow Jones
0.2
43
18,096
European indexes closed higher, with DAX closing up 70 points and CAC closing
Nasdaq
0.2
8
4,948
25 points up. Speculation over further easing of monetary policy by the ECB lifted
FTSE
0.0
5
6,410
the indices.
Nikkei
0.2
32
16,907
Indian indices closed flattish on Wednesday ahead of results to be announced by
Hang Seng
(0.9)
-200
21,236
index heavy weight Reliance Industries and HDFC Bank during the week. However
Shanghai Com
(2.3)
-70
2,973
BSE Midcap and Small cap indices showed some strength and selective stocks
witnessed seed buying interest.
Advances / Declines
BSE
NSE
News & Result Analysis
Advances
1,481
902
Result Review: Wipro
Detailed analysis on Pg2
Declines
1,154
674
Unchanged
149
67
Investor’s Ready Reckoner
Key Domestic & Global Indicators
Volumes (` Cr)
Stock Watch: Latest investment recommendations on 150+ stocks
BSE
2,707
Refer Pg5 onwards
NSE
20,538
Top Picks
CMP
Target
Upside
Net Inflows (` Cr)
Net
Mtd
Ytd
Company
Sector
Rating
(`)
(`)
(%)
FII
741
252
(11,729)
Amara Raja
Auto & Auto Ancillary
Buy
924
1,040
12.6
MFs
(63)
(414)
61,145
HCL Tech
IT
Buy
841
1,038
23.4
LIC Housing
Financials
Buy
468
592
26.4
Top Gainers
Price (`)
Chg (%)
Bharat Electronics
Capital Goods
Buy
1,198
1,414
18.0
Navkar Corporation Others
Buy
194
265
36.4
Amtekauto
36
19.0
More Top Picks on Pg4
Frl
149
11.1
Dcbbank
97
10.6
Key Upcoming Events
Previous
Consensus
Vedl
106
9.2
Date
Region
Event Description
Reading
Expectations
Crisil
2,152
8.5
Apr 21 GBP
Retail Sales (MoM) (Mar)
-0.4%
-0.2%
Apr 21 US
Philadelphia Fed Man. Index (Apr)
12.4
8.9
Top Losers
Price (`)
Chg (%)
Apr 22 Germany
PMI Services
55.1
55.1
Indiacem
90
(4.0)
Apr25 US
New Home sales(thousand)
512
525
6.(6.(
Lichsgfin
468
(3.5)
More Events on Pg5
Idea
117
(3.4)
Eidparry
230
(3.4)
Balramchin
106
(3.2)
As on April 20, 2016
Market Outlook
April 21, 2016
Results Review
Wipro (CMP: `601 / TP: `680 / Upside: 13.1%)
Wipro announced its 4QFY2016 results, which were below expectations. The
company’s IT services posted revenues of US$1,882mn V/s US$1,902mn expected
a 2.4% QoQ. On Constant Currency (CC) terms the company posted a QoQ
growth of 2.7%. This was against the guidance of US$1,875mn to US$1,912mn
for 4QFY2016. Overall, in rupee terms, revenues grew by
6.0% QoQ to
`13,632cr V/s `13,735cr, lead by rupee deprecation.
In terms of the geography, Americas grew 8.5% on a constant currency YoY basis,
India and Middle East grew 14.0% on a constant currency YoY basis, APAC and
Other Emerging Markets grew 7.8% on a constant currency YoY basis. In terms of
business units, Healthcare, Life Sciences & Services grew 20.1% on a constant
currency YoY basis, Retail, Consumer Goods and Transportation grew 15.2% on a
constant currency YoY basis, while Manufacturing grew 9.1% on a constant
currency YoY basis. During the quarter, Wipro completed the acquisition of Health
Plan Services, a BPaaS company in US.
On the operating front, the IT Services EBIT Margins for the quarter was 20.1%.
Overall, the EBIT margins came in at 18.2% V/s 18.7% expected a 34bps QoQ
expansion. On the net profit front, the company posted a net profit of `2,240cr
V/s `2,237cr expected, posting a QoQ growth of 0.3%. On operating front, the
quarterly annualized voluntary attrition dropped from 16.3% in 3QFY2016 to
14.9% in 4QFY2016.
For guidance in 1QFY2017, the company is expected to have IT services revenues
in the range of US$1,901mn- US$1,939mn, posting a QoQ growth of 1.0-3.0%.
Also, board approved a buyback proposal for purchase by the company of up to
4cr shares at a price of `625 per equity share aggregating up to `2,500cr. Payout
for the year including interim, final dividend & the approved buyback amount is
48% .We maintain our accumulate rating on the stock with target price of `680.
Y/E
Sales OPM
PAT EPS ROE P/E P/BV EV/EBITDA EV/Sales
March
(` cr)
(%)
(` cr)
(`)
(%)
(x)
(x)
(x)
(x)
FY2016E
52,827
23.7
9,547
38.6
19.6
15.6
3.1
10.2
2.3
FY2017E
58,410
23.8
10,403
42.1
18.1
14.3
2.8
8.5
1.9
Market Outlook
April 21, 2016
Quarterly Bloomberg Brokers Consensus Estimate
Hindustan Zinc (Consol)- April 21, 2016
Particulars (` cr)
4QFY16E
4QFY15
y-o-y (%)
3QFY16
q-o-q (%)
Net sales
3,221
4,073
(20.9)
3,385
(4.9)
EBITDA
1,396
1,978
(29.4)
1,478
(5.6)
EBITDA margin (%)
43.3
48.6
43.7
Net profit
1,574
1,997
(21.2)
1,811
(13.1)
IndusInd Bank Ltd- April 21, 2016
Particulars (` cr)
4QFY16E
4QFY15
y-o-y (%)
3QFY16
q-o-q (%)
PAT
627
495
26.6
581
7.9
Reliance Industries Ltd- April 22, 2016
Particulars (` cr)
4QFY16E
4QFY15
y-o-y (%)
3QFY16
q-o-q (%)
Net sales
50,310
56,043
(10.2)
56,567
(11.1)
EBITDA
10,173
8,629
17.9
10,272
(1.0)
EBITDA margin (%)
20.2
15.4
18.2
Net profit
7,016
6,243
12.4
7,218
(2.8)
Economic and Political News
Indian drug control system the weakest; Pharma secretary
State -run firms likely to launch $ 1 bn Masala bonds in UK
India’s services sector grew 10% a year in FY16-CII
India set to sign climate change treaty on Friday.
Corporate News
Maruti to add over 320 outlets this year
Bharti Airtel plans to sell 5% in tower arm Bharti Infratel
Hyundai to increase creta production by 20%.
Tata Steel UK staff seeks management buyout of 6.5 mn ton unit.
Cipla bets big on consumer health space.
Network18 Media Q4 net loss at Rs 3.7 cr
Market Outlook
April 21, 2016
Top Picks ★★★★★
Large Cap
Market Cap
CMP
Target
Upside
Company
Rationale
(` Cr)
(`)
(`)
(%)
To outpace battery industry growth due to better technological
Amara Raja Batteries
15,775
924
1,040
12.6
products leading to market share gains in both the automotive
OEM and replacement segments.
Uptick in defense capex by government when coupled with
Bharat Electronics
28,756
1,198
1,414
18.0
BELs strong market positioning, indicate that good times are
ahead for BEL.
The stock is trading at attractive valuations and is factoring all
HCL Tech
1,18,648
841
1,038
23.4
the bad news.
Strong visibility for a robust 20% earnings trajectory, coupled
HDFC Bank
2,77,241
1,097
1,262
15.1
with high quality of earnings on account of high quality retail
business and strategic focus on highly rated corporates.
Back on the growth trend, expect a long term growth of 14%
Infosys
2,86,500
1,243
1,347
8.3
to be a US$20bn in FY2020.
LICHF continues to grow its retail loan book at a healthy pace
with improvement in asset quality. We expect the company to
LIC Housing Finance
23,621
468
592
26.4
post a healthy loan book which is likely to reflect in a strong
earnings growth.
Huge bid pipeline of re-development works at Delhi and other
NBCC
11,989
999
1,089
9.0
State Governments and opportunity from Smart City, positions
NBCC to report strong growth, going forward.
Source: Company, Angel Research
Mid Cap
Market Cap
CMP
Target
Upside
Company
Rationale
(` Cr)
(`)
(`)
(%)
Favorable outlook for the AC industry to augur well for
Cooling products business which is out pacing the market
Blue Star
3,726
414
458
10.6
growth. EMPPAC division's profitability to improve once
operating environment turns around.
With a focus on the low and medium income (LMI) consumer
Dewan Housing
6,040
207
270
30.4
segment, the company has increased its presence in tier-II &
III cities where the growth opportunity is immense.
Commencement of new projects, downtrend in the interest
IL&FS Transport
2,668
81
93
14.7
rate cycle, to lead to stock re-rating
Economic recovery to have favourable impact on advertising
& circulation revenue growth. Further, the acquisition of a
Jagran Prakashan
5,577
171
189
10.8
radio business (Radio City) would also boost the company's
revenue growth.
Speedier execution and speedier sales, strong revenue visibilty
Mahindra Lifespace
1,828
446
554
24.3
in short-to-long run, attractive valuations
Massive capacity expansion along with rail advantage at ICD
Navkar Corporation
2,770
194
265
36.4
as well CFS augurs well for the company
Earnings boost on back of stable material prices and
Radico Khaitan
1,210
91
156
71.5
favourable pricing environment. Valuation discount to peers
provides additional comfort
Strong brands and distribution network would boost growth
Siyaram Silk Mills
1,031
1,100
1,354
23.1
going ahead. Stock currently trades at an inexpensive
valuation.
Source: Company, Angel Research
Market Outlook
April 21, 2016
Key Upcoming Events
Result Calendar
Date
Company
Apr 21, 2016
IndusInd Bank, Infotech Enterprises, Hind. Zinc
Apr 22, 2016
HDFC Bank, Cairn India
Apr 24, 2016
Persistent
Apr 25, 2016
ABB
Apr 26, 2016
Rallis, Maruti, Axis Bank
Apr 27, 2016
Exide Industries, FAG Bearings, Yes Bank, KPIT Cummins, Elecon Engineering
Apr 28, 2016
Ambuja Cements, Dabur India
Apr 29, 2016
ICICI Bank, Aventis
May 2, 2016
HDFC
May 3, 2016
TVS Motor, Godrej Consumer
May 4, 2016
Vesuvius India
Source: Bloomberg, Angel Research
Global economic events release calendar
Date
Time
Country
Event Description
Unit
Period
Bloomberg Data
Last Reported Estimated
Apr 21, 2016
6:00PM US
Initial Jobless claims
Thousands
Apr 16
253.00
265.00
7:30PM Euro Zone
Euro-Zone Consumer Confidence
Value
Apr A
(9.70)
(9.30)
Apr 22, 2016
1:00PM Germany
PMI Services
Value
Apr P
55.10
55.10
Apr 25, 2016
7:30PM US
New home sales
Thousands
Mar
512.00
525.00
Apr 26, 2016
7:30PM US
Consumer Confidence
S.A./ 1985=100
Apr
96.20
95.75
Apr 27, 2016
2:00PM UK
GDP (YoY)
% Change
1Q A
2.10
--
Apr 28, 2016
1:25PM Germany
Unemployment change (000's)
Thousands
Apr
--
--
Apr 29, 2016
2:30PM Euro Zone
Euro-Zone GDP s.a. (QoQ)
% Change
1Q A
0.30
--
May 1,, 2016 6:30AM China
PMI Manufacturing
Value
Apr
50.20
--
May 3,, 2016 2:00PM UK
PMI Manufacturing
Value
Apr
51.00
--
May 6,, 2016 6:00PM US
Change in Nonfarm payrolls
Thousands
Apr
215.00
--
Source: Bloomberg, Angel Research
Market Outlook
April 21, 2016
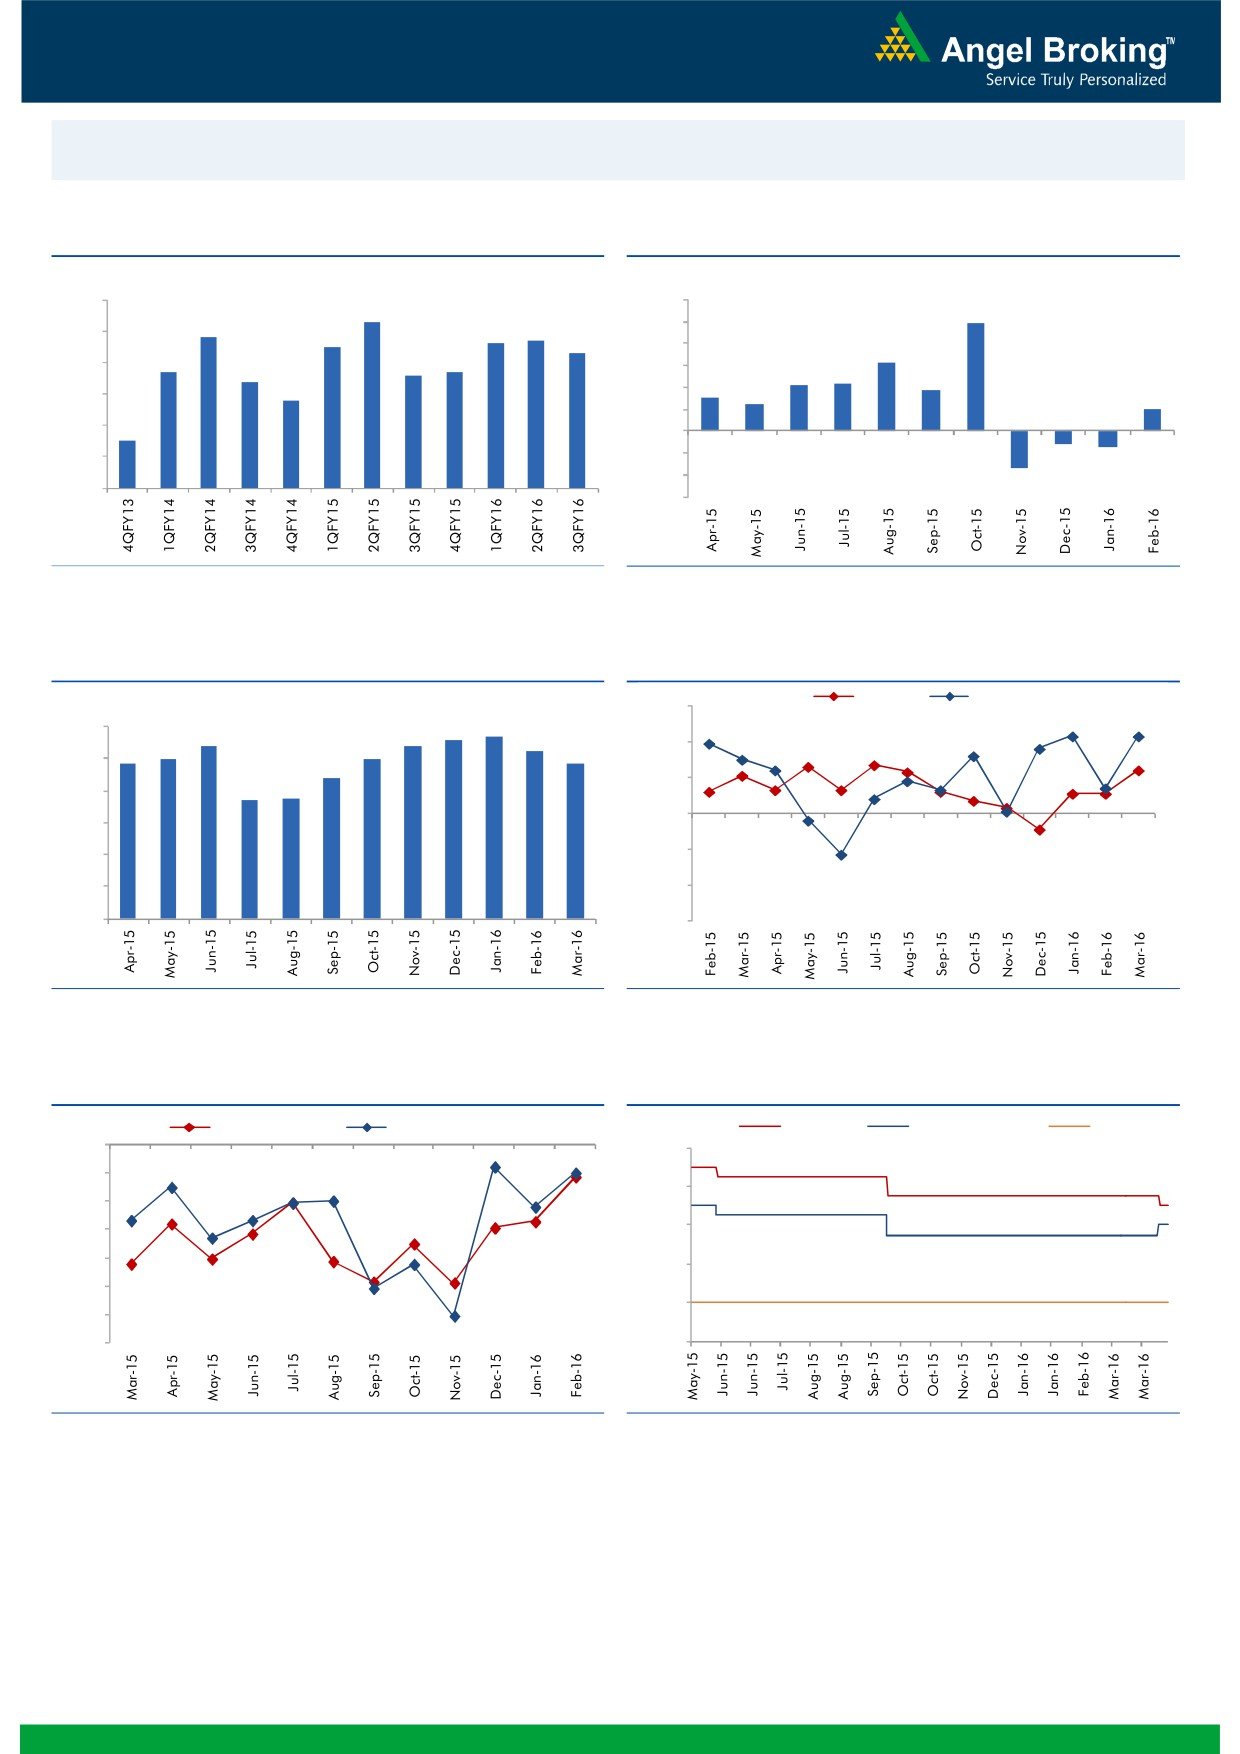
Macro watch
Exhibit 1: Quarterly GDP trends
Exhibit 2: IIP trends
(%)
(%)
9.0
12.0
8.3
9.9
7.8
7.7
10.0
8.0
7.5
7.6
7.3
8.0
6.3
6.7
6.6
6.7
7.0
6.4
6.0
4.2
4.3
3.7
5.8
3.0
4.0
2.5
6.0
2.0
2.0
5.0
4.5
-
4.0
(2.0)
(1.2)
(1.5)
(4.0)
3.0
(3.4)
(6.0)
Source: CSO, Angel Research
Source: MOSPI, Angel Research
Exhibit 3: Monthly CPI inflation trends
Exhibit 4: Manufacturing and services PMI
Mfg. PMI
Services PMI
(%)
56.0
5.6
5.7
6.0
5.4
5.4
5.3
5.0
5.0
54.0
4.9
4.8
5.0
4.4
3.7
3.7
52.0
4.0
50.0
3.0
2.0
48.0
1.0
46.0
-
44.0
Source: MOSPI, Angel Research
Source: Market, Angel Research; Note: Level above 50 indicates expansion
Exhibit 5: Exports and imports growth trends
Exhibit 6: Key policy rates
(%)
Exports yoy growth
Imports yoy growth
(%)
Repo rate
Reverse Repo rate
CRR
0.0
8.00
(5.0)
7.00
(10.0)
(15.0)
6.00
(20.0)
5.00
(25.0)
4.00
(30.0)
(35.0)
3.00
Source: Bloomberg, Angel Research
Source: RBI, Angel Research
Market Outlook
April 21, 2016
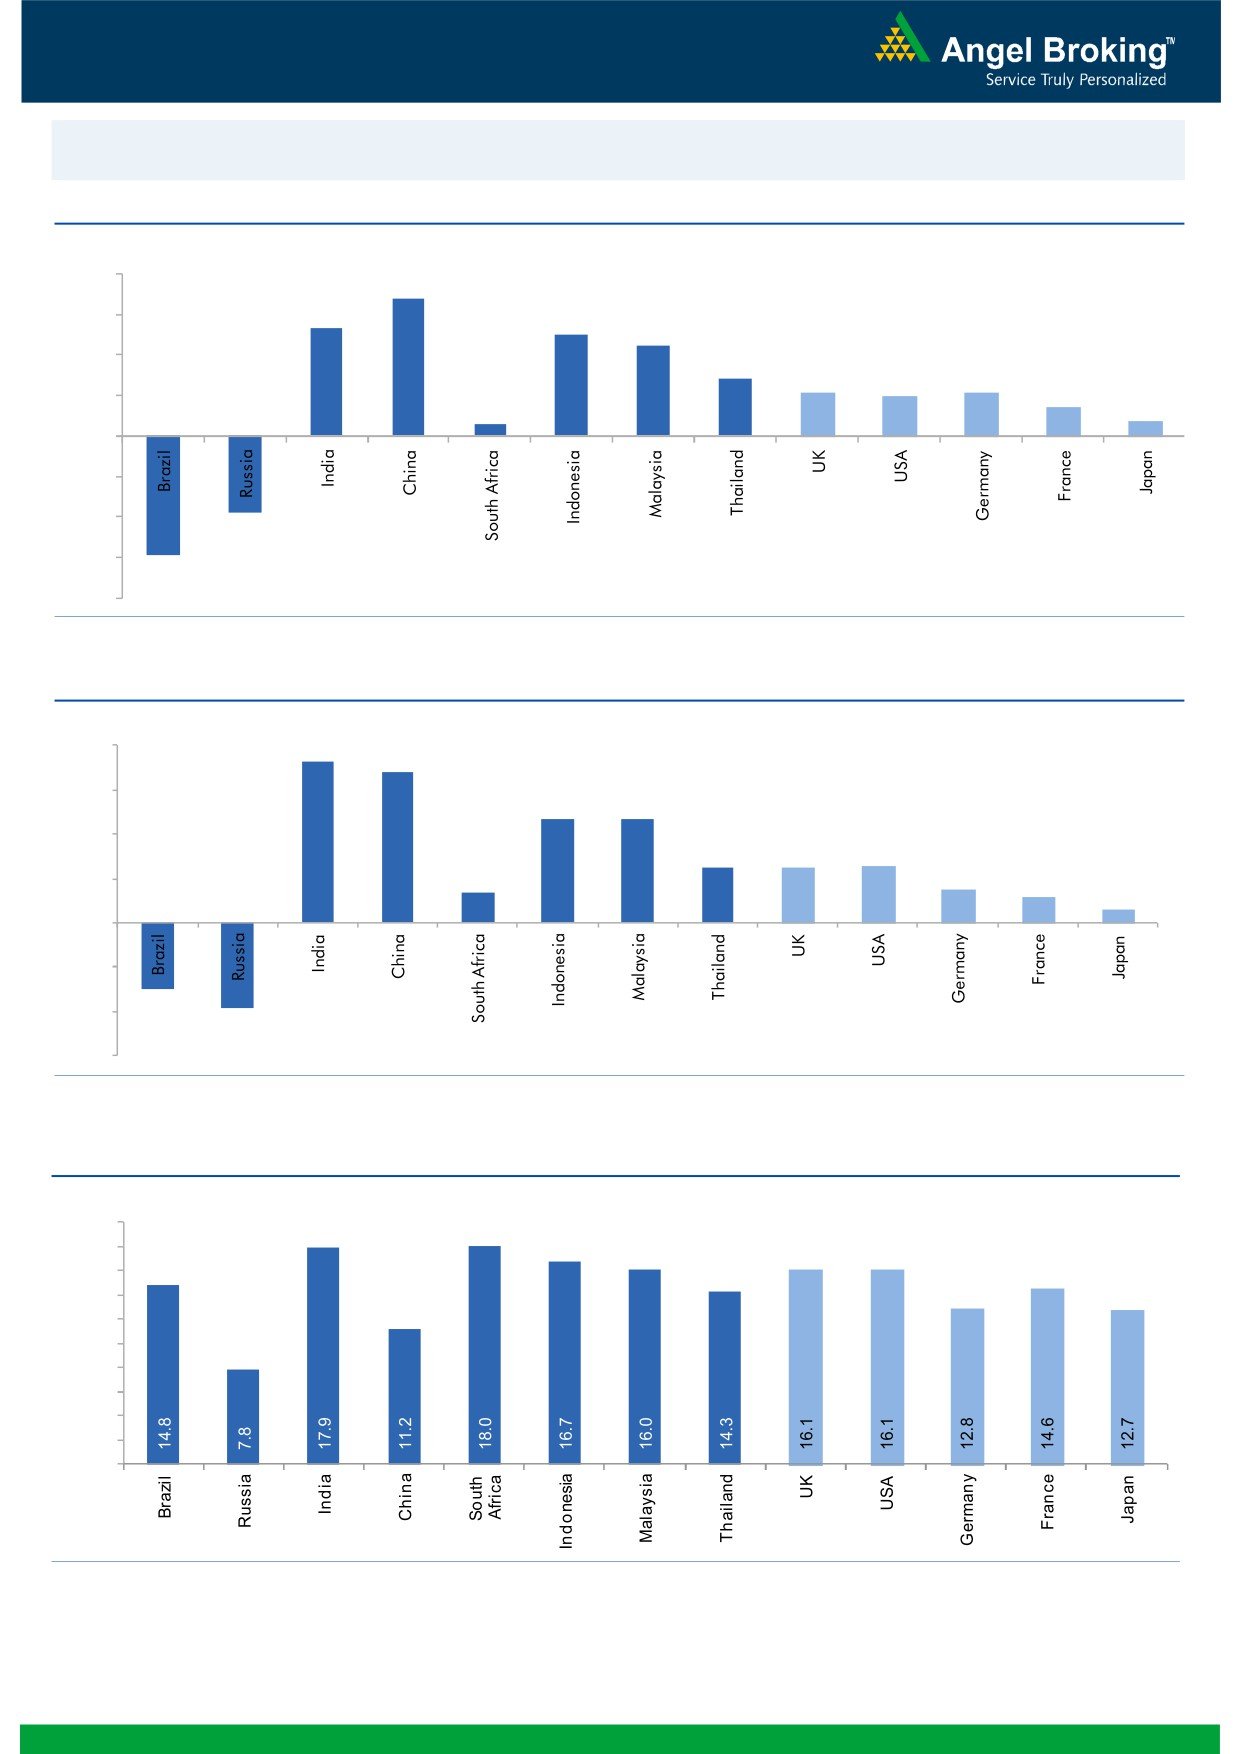
Global watch
Exhibit 1: Latest quarterly GDP Growth (%, yoy) across select developing and developed countries
(%)
8.0
6.8
6.0
5.3
5.0
4.5
4.0
2.8
2.1
2.0
2.1
1.4
2.0
0.6
0.7
-
(2.0)
(4.0)
(3.8)
(6.0)
(5.9)
(8.0)
Source: Bloomberg, Angel Research
Exhibit 2: 2015 GDP Growth projection by IMF (%, yoy) across select developing and developed countries
(%)
8.0
7.3
6.8
6.0
4.7
4.7
4.0
2.5
2.5
2.6
1.4
1.5
2.0
1.2
0.6
-
(2.0)
(3.0)
(4.0)
(3.8)
(6.0)
Source: IMF, Angel Research
Exhibit 3: One year forward P-E ratio across select developing and developed countries
(x)
20.0
18.0
16.0
14.0
12.0
10.0
8.0
6.0
4.0
2.0
-
Source: IMF, Angel Research
Market Outlook
April 21, 2016
Exhibit 4: Relative performance of indices across globe
Returns (%)
Country
Name of index
Closing price
1M
3M
1YR
Brazil
Bovespa
53,631
5.5
39.1
(1.1)
Russia
Micex
1,960
2.9
19.1
16.5
India
Nifty
7,914
5.0
5.4
(10.4)
China
Shanghai Composite
2,973
(1.9)
(1.5)
(28.4)
South Africa
Top 40
47,272
1.0
12.3
(0.6)
Mexico
Mexbol
45,650
2.0
11.8
0.8
Indonesia
LQ45
846
(0.4)
8.5
(10.9)
Malaysia
KLCI
1,709
(0.5)
4.9
(7.1)
Thailand
SET 50
903
1.5
14.3
(12.1)
USA
Dow Jones
18,096
2.8
13.0
0.3
UK
FTSE
6,410
3.4
9.1
(9.1)
Japan
Nikkei
16,907
1.1
(0.8)
(15.1)
Germany
DAX
10,421
5.3
7.8
(11.1)
France
CAC
4,592
3.4
7.5
(11.2)
Source: Bloomberg, Angel Research
Stock Watch
April 21, 2016
Company Name
Reco
CMP
Target
Mkt Cap
Sales ( Čcr )
OPM(%)
EPS (Č)
PER(x)
P/BV(x)
RoE(%)
EV/Sales(x)
(Č)
Price ( Č)
( Č cr )
FY16E FY17E
FY16E
FY17E
FY16E
FY17E
FY16E
FY17E
FY16E
FY17E
FY16E
FY17E
FY16E
FY17E
Agri / Agri Chemical
Rallis
Neutral
202
-
3,929
2,097
2,415
14.4
14.4
9.5
11.0
21.3
18.4
4.2
3.7
21.1
21.3
1.7
1.5
United Phosphorus
Neutral
504
-
21,602
12,500
14,375
18.3
18.3
29.8
35.9
16.9
14.0
3.1
2.6
20.0
20.3
1.8
1.5
Auto & Auto Ancillary
Ashok Leyland
Neutral
108
-
30,778
17,995
21,544
11.4
11.6
3.4
4.7
31.8
23.0
5.6
5.1
17.7
22.2
1.7
1.4
Bajaj Auto
Accumulate
2,536
2,585
73,392
22,709
25,860
20.9
20.1
129.0
143.6
19.7
17.7
6.0
5.2
30.7
29.4
2.7
2.3
Bharat Forge
Accumulate
817
875
19,013
7,351
8,318
19.9
19.7
31.2
36.5
26.2
22.4
4.7
4.0
19.3
19.2
2.7
2.3
Eicher Motors
Neutral
20,511
-
55,711
15,556
16,747
15.5
17.3
464.8
597.5
44.1
34.3
16.1
11.9
36.2
34.3
3.3
3.1
Gabriel India
Accumulate
93
101
1,334
1,415
1,544
8.7
9.0
4.6
5.4
20.2
17.2
3.7
3.3
18.1
18.9
0.9
0.8
Hero Motocorp
Neutral
3,041
-
60,719
28,244
30,532
15.5
15.9
156.7
168.5
19.4
18.1
7.8
6.6
39.9
36.4
2.0
1.8
Jamna Auto Industries Accumulate
145
160
1,161
1,281
1,473
11.2
11.5
7.6
9.2
19.1
15.8
4.8
4.0
25.4
25.2
1.0
0.8
L G Balakrishnan & Bros Neutral
483
-
758
1,254
1,394
11.6
11.8
35.9
41.7
13.5
11.6
1.8
1.6
13.5
13.8
0.7
0.6
Mahindra and Mahindra Accumulate
1,327
1,364
82,441
38,416
42,904
13.7
13.9
54.8
63.4
24.2
20.9
3.7
3.3
15.4
15.8
1.7
1.4
Maruti
Neutral
3,670
-
110,851
57,865
68,104
16.4
16.7
176.3
225.5
20.8
16.3
4.0
3.4
19.4
21.2
1.6
1.3
Minda Industries
Neutral
1,015
-
1,610
2,523
2,890
8.7
9.0
55.0
65.4
18.5
15.5
3.6
2.9
19.3
18.7
0.7
0.6
Motherson Sumi
Buy
269
313
35,535
39,343
45,100
8.8
9.1
10.1
12.5
26.6
21.5
8.4
6.6
35.3
34.4
0.9
0.8
Rane Brake Lining
Buy
380
465
300
454
511
11.5
12.0
25.2
31.0
15.1
12.2
2.3
2.0
14.9
16.6
0.8
0.7
Setco Automotive
Neutral
33
-
443
594
741
12.7
13.7
1.7
3.2
19.5
10.4
2.1
1.8
10.4
16.9
1.1
0.9
Tata Motors
Neutral
404
-
116,657
259,686
273,957
13.0
13.4
25.9
29.5
15.6
13.7
2.0
1.8
8.0
9.0
0.6
0.6
TVS Motor
Neutral
336
-
15,958
11,263
13,122
6.9
8.5
9.2
15.0
36.5
22.4
8.3
6.6
22.7
29.6
1.3
1.1
Amara Raja Batteries
Buy
924
1,040
15,775
4,892
5,871
17.4
17.6
28.8
37.1
32.1
24.9
7.5
6.0
23.4
24.1
3.1
2.5
Exide Industries
Buy
137
162
11,641
6,950
7,784
14.4
14.8
6.6
7.3
20.8
18.8
2.6
2.4
12.6
12.8
1.4
1.2
Apollo Tyres
Accumulate
169
183
8,613
12,056
12,714
17.2
16.4
23.0
20.3
7.4
8.3
1.3
1.1
17.7
13.6
0.8
0.8
Ceat
Neutral
1,135
-
4,590
6,041
6,597
14.1
13.7
99.5
111.9
11.4
10.1
2.2
1.9
19.6
18.5
0.9
0.8
JK Tyres
Neutral
87
-
1,971
7,446
7,669
15.2
14.0
19.6
18.4
4.4
4.7
1.1
0.9
25.2
19.5
0.7
0.6
Swaraj Engines
Neutral
1,110
-
1,379
552
630
14.2
14.7
44.6
54.1
24.9
20.5
5.8
5.3
23.2
25.6
2.1
1.8
Subros
Neutral
92
-
551
1,293
1,527
11.8
11.9
4.2
6.7
21.9
13.7
1.7
1.5
7.7
11.5
0.7
0.6
Indag Rubber
Neutral
174
-
457
283
329
17.0
17.2
13.0
15.4
13.4
11.3
2.9
2.4
21.8
21.6
1.5
1.2
Capital Goods
ACE
Neutral
40
-
395
660
839
4.7
8.2
1.0
3.9
40.0
10.2
1.3
1.1
3.2
11.3
0.8
0.6
BEML
Buy
947
1,157
3,942
3,277
4,006
6.0
8.9
36.2
64.3
26.2
14.7
1.8
1.6
5.7
11.7
1.2
1.0
Bharat Electronics
Buy
1,198
1,414
28,756
7,737
8,634
16.8
17.2
54.0
61.5
22.2
19.5
3.2
2.8
39.3
45.6
2.8
2.4
Stock Watch
April 21, 2016
Company Name
Reco
CMP
Target
Mkt Cap
Sales ( Čcr )
OPM(%)
EPS (Č)
PER(x)
P/BV(x)
RoE(%)
EV/Sales(x)
(Č)
Price ( Č)
( Č cr )
FY16E
FY17E
FY16E
FY17E
FY16E
FY17E
FY16E
FY17E
FY16E
FY17E
FY16E
FY17E
FY16E
FY17E
Capital Goods
Voltas
Buy
302
353
10,006
5,363
5,963
8.0
9.1
11.0
13.8
27.5
21.9
4.2
3.7
16.2
17.9
1.7
1.5
BGR Energy
Neutral
111
-
801
3,615
3,181
9.5
9.4
16.7
12.4
6.7
9.0
0.6
0.6
10.0
7.0
0.6
0.8
BHEL
Neutral
133
-
32,516
33,722
35,272
10.8
11.7
10.5
14.2
12.7
9.4
0.9
0.9
7.0
9.0
1.0
1.0
Blue Star
Accumulate
414
458
3,726
3,548
3,977
6.3
6.9
13.7
17.2
30.3
24.1
7.6
4.9
26.1
25.4
1.1
0.9
Crompton Greaves
Neutral
59
-
3,692
13,484
14,687
4.9
6.2
4.5
7.1
13.1
8.3
0.9
0.9
7.2
10.8
0.4
0.3
Greaves Cotton
Neutral
133
-
3,241
1,655
1,755
16.6
16.8
7.4
7.8
17.9
17.0
3.6
3.4
21.1
20.6
1.9
1.8
Inox Wind
Buy
275
458
6,102
4,980
5,943
17.0
17.5
26.6
31.6
10.3
8.7
3.1
2.3
35.0
30.0
1.3
1.0
KEC International
Neutral
131
-
3,363
8,791
9,716
6.1
6.8
5.4
8.2
24.2
16.0
2.4
2.2
10.0
14.0
0.6
0.6
Thermax
Neutral
786
-
9,360
6,413
7,525
7.4
8.5
30.5
39.3
25.8
20.0
4.0
3.5
15.0
17.0
1.4
1.1
VATech Wabag
Neutral
577
-
3,145
2,722
3,336
7.9
8.1
19.5
24.6
29.6
23.5
3.1
2.8
11.1
12.4
1.2
1.0
Cement
ACC
Neutral
1,468
-
27,559
13,151
14,757
16.4
18.3
63.9
83.4
23.0
17.6
3.0
2.7
13.3
16.1
1.9
1.6
Ambuja Cements
Neutral
226
-
35,112
11,564
12,556
19.4
20.7
8.9
10.1
25.4
22.4
3.2
3.0
12.8
13.8
2.6
2.4
HeidelbergCement
Neutral
103
-
2,332
1,772
1,926
13.3
15.4
1.0
3.0
102.9
34.3
2.6
2.4
2.6
7.9
1.8
1.6
India Cements
Neutral
90
-
2,760
4,216
4,840
18.0
19.5
4.0
9.9
22.5
9.1
0.9
0.8
4.0
9.5
1.0
0.8
JK Cement
Neutral
639
-
4,469
3,661
4,742
10.1
15.8
7.5
28.5
85.2
22.4
2.6
2.3
7.5
22.9
1.7
1.3
J K Lakshmi Cement
Neutral
370
-
4,354
2,947
3,616
16.7
19.9
11.5
27.2
32.2
13.6
3.1
2.6
9.8
20.8
1.8
1.4
Mangalam Cements
Neutral
278
-
741
1,053
1,347
10.5
13.3
8.4
26.0
33.0
10.7
1.4
1.3
4.3
12.5
1.0
0.7
Orient Cement
Neutral
153
-
3,137
1,854
2,524
21.2
22.2
7.7
11.1
19.9
13.8
2.9
2.5
13.3
15.7
2.4
1.7
Ramco Cements
Neutral
470
-
11,179
4,036
4,545
20.8
21.3
15.1
18.8
31.1
25.0
3.8
3.4
12.9
14.3
3.0
2.6
Shree Cement^
Neutral
13,024
-
45,372
7,150
8,742
26.7
28.6
228.0
345.5
57.1
37.7
8.4
7.1
15.7
20.3
5.8
4.7
UltraTech Cement
Neutral
3,370
-
92,477
24,669
29,265
18.2
20.6
82.0
120.0
41.1
28.1
4.4
3.9
11.3
14.7
3.6
3.0
Construction
ITNL
Buy
81
93
2,668
7,360
8,825
34.0
35.9
7.0
9.0
11.6
9.0
0.4
0.4
3.2
3.7
3.7
3.6
KNR Constructions
Buy
559
603
1,571
937
1,470
14.3
14.0
44.2
38.6
12.6
14.5
2.5
2.2
15.4
15.4
1.6
1.1
Larsen & Toubro
Accumulate
1,264
1,310
117,748
58,870
65,708
8.3
10.3
42.0
53.0
30.1
23.9
2.1
1.9
8.8
11.2
2.2
1.9
Gujarat Pipavav Port
Neutral
175
-
8,441
629
684
51.0
52.2
6.4
5.9
27.3
29.6
3.6
3.3
15.9
12.7
13.3
12.0
MBL Infrastructures
Buy
155
285
642
2,313
2,797
12.2
14.6
19.0
20.0
8.2
7.8
0.9
0.8
11.3
10.6
1.0
0.9
Nagarjuna Const.
Neutral
75
-
4,183
7,892
8,842
8.8
9.1
3.0
5.3
25.1
14.2
1.3
1.2
5.0
8.5
0.8
0.6
PNC Infratech
Accumulate
534
558
2,741
1,873
2,288
13.2
13.5
24.0
32.0
22.3
16.7
2.2
1.9
12.1
12.3
1.6
1.3
Simplex Infra
Neutral
252
-
1,246
5,955
6,829
10.3
10.5
16.0
31.0
15.7
8.1
0.8
0.8
5.3
9.9
0.7
0.6
Stock Watch
April 21, 2016
Company Name
Reco
CMP
Target
Mkt Cap
Sales ( Čcr )
OPM(%)
EPS (Č)
PER(x)
P/BV(x)
RoE(%)
EV/Sales(x)
(Č)
Price ( Č)
( Č cr )
FY16E
FY17E
FY16E
FY17E
FY16E
FY17E
FY16E
FY17E
FY16E
FY17E
FY16E
FY17E
FY16E
FY17E
Construction
Power Mech Projects
Neutral
585
-
861
1,539
1,801
12.8
12.7
59.0
72.1
9.9
8.1
1.5
1.3
18.6
16.8
0.6
0.5
Sadbhav Engineering
Neutral
286
-
4,908
3,481
4,219
10.7
10.8
8.2
11.7
34.9
24.5
3.3
2.9
10.3
13.5
1.6
1.4
NBCC
Accumulate
999
1,089
11,989
5,816
7,382
6.9
7.7
29.6
39.8
33.8
25.1
6.1
4.8
24.1
26.7
1.8
1.4
MEP Infra
Neutral
41
-
666
1,956
1,876
28.1
30.5
1.3
3.0
31.5
13.7
6.6
4.5
21.2
32.8
1.8
1.7
SIPL
Neutral
102
-
3,575
675
1,042
62.4
64.7
-
-
3.8
4.3
-
-
17.0
11.5
Engineers India
Neutral
173
-
5,822
1,667
1,725
13.5
16.0
9.7
11.4
17.8
15.2
2.1
2.0
11.7
13.4
2.2
2.2
Financials
Allahabad Bank
Neutral
59
-
3,597
8,569
9,392
2.8
2.9
16.3
27.5
3.6
2.1
0.3
0.3
7.6
11.9
-
-
Axis Bank
Accumulate
458
494
109,146
26,473
31,527
3.5
3.6
35.7
43.5
12.8
10.5
2.2
1.9
17.9
18.9
-
-
Bank of Baroda
Neutral
152
-
35,092
18,485
21,025
1.9
2.0
13.5
21.1
11.3
7.2
0.9
0.8
7.3
10.6
-
-
Bank of India
Neutral
95
-
7,729
15,972
17,271
1.9
2.0
15.3
33.4
6.2
2.8
0.3
0.2
3.6
7.6
-
-
Canara Bank
Neutral
197
-
10,700
15,441
16,945
2.0
2.1
46.6
70.4
4.2
2.8
0.4
0.3
8.0
11.2
-
-
Dena Bank
Neutral
30
-
1,907
3,440
3,840
2.1
2.3
7.3
10.0
4.1
2.9
0.3
0.3
6.1
7.9
-
-
Dewan Housing Finance Buy
207
270
6,040
1,892
2,277
2.9
2.9
25.9
30.8
8.0
6.7
1.2
1.1
15.3
15.9
-
-
Federal Bank
Neutral
44
-
7,559
3,477
3,999
3.0
3.0
5.0
6.2
8.8
7.1
0.9
0.8
10.6
11.9
-
-
HDFC
Neutral
1,138
-
179,849
10,358
11,852
3.3
3.3
41.1
47.0
27.7
24.2
5.3
4.8
24.7
24.9
-
-
HDFC Bank
Buy
1,097
1,262
277,241
38,309
47,302
4.3
4.3
49.3
61.1
22.2
18.0
3.8
3.3
18.5
19.7
-
-
ICICI Bank
Accumulate
238
254
138,482
34,279
39,262
3.3
3.3
21.0
24.4
11.4
9.8
1.9
1.6
14.4
14.7
-
-
IDBI Bank
Neutral
72
-
14,813
9,625
10,455
1.8
1.8
8.5
14.2
8.4
5.1
0.5
0.5
5.9
9.3
-
-
Indian Bank
Neutral
97
-
4,678
6,160
6,858
2.5
2.5
24.5
29.8
4.0
3.3
0.3
0.3
7.7
8.6
-
-
LIC Housing Finance
Buy
468
592
23,621
3,101
3,745
2.5
2.5
33.0
40.2
14.2
11.7
2.7
2.3
19.7
20.5
-
-
Oriental Bank
Neutral
94
-
3,010
7,643
8,373
2.4
2.4
37.2
45.4
2.5
2.1
0.2
0.2
8.2
9.4
-
-
Punjab Natl.Bank
Neutral
84
-
16,543
23,638
26,557
2.8
2.8
17.9
27.2
4.7
3.1
0.5
0.4
8.5
12.0
-
-
South Ind.Bank
Neutral
18
-
2,491
1,965
2,185
2.5
2.5
2.5
3.3
7.4
5.6
0.7
0.7
9.5
11.7
-
-
St Bk of India
Neutral
187
-
145,397
79,958
86,061
2.6
2.6
13.4
20.7
14.0
9.1
1.1
1.1
11.5
12.8
-
-
Union Bank
Neutral
127
-
8,737
12,646
14,129
2.3
2.4
31.0
39.1
4.1
3.3
0.4
0.4
9.8
11.4
-
-
Vijaya Bank
Neutral
31
-
2,933
3,536
3,827
1.9
1.9
5.5
6.7
5.7
4.7
0.5
0.4
7.8
8.8
-
-
Yes Bank
Neutral
882
-
37,080
7,190
9,011
3.2
3.3
58.2
69.7
15.1
12.7
2.7
2.3
19.2
19.6
-
-
FMCG
Asian Paints
Neutral
886
-
84,942
16,553
19,160
16.0
16.2
17.7
21.5
50.1
41.2
13.3
12.0
29.4
31.2
4.9
4.2
Britannia
Neutral
2,844
-
34,126
8,481
9,795
14.0
14.1
65.5
78.3
43.4
36.3
20.6
16.9
38.3
41.2
3.7
3.2
Stock Watch
April 21, 2016
Company Name
Reco
CMP
Target
Mkt Cap
Sales ( Čcr )
OPM(%)
EPS (Č)
PER(x)
P/BV(x)
RoE(%)
EV/Sales(x)
(Č)
Price ( Č)
( Č cr )
FY16E FY17E
FY16E
FY17E
FY16E
FY17E
FY16E
FY17E
FY16E
FY17E
FY16E
FY17E
FY16E
FY17E
FMCG
Colgate
Neutral
852
-
23,160
4,836
5,490
19.5
19.7
48.5
53.2
17.6
16.0
12.9
11.2
99.8
97.5
4.5
4.0
Dabur India
Neutral
268
-
47,075
9,370
10,265
17.1
17.2
7.3
8.1
36.5
33.0
11.0
9.0
33.7
30.6
4.8
4.4
GlaxoSmith Con*
Neutral
6,007
-
25,262
4,919
5,742
17.2
17.4
168.3
191.2
35.7
31.4
10.1
8.6
28.8
28.9
4.7
4.0
Godrej Consumer
Neutral
1,354
-
46,110
10,168
12,886
16.1
16.1
32.1
38.4
42.2
35.3
8.6
7.9
19.7
21.0
4.6
3.6
HUL
Neutral
903
-
195,317
34,940
38,957
17.5
17.7
20.8
24.7
43.4
36.5
48.3
38.6
110.5
114.2
5.2
4.6
ITC
Accumulate
335
359
269,581
36,804
38,776
37.9
37.9
12.2
12.9
27.5
26.0
7.6
6.7
27.7
25.8
6.6
6.3
Marico
Neutral
254
-
32,712
6,551
7,766
15.7
16.0
10.4
12.5
24.4
20.3
7.1
5.9
33.2
32.4
5.0
4.2
Nestle*
Accumulate
6,036
6,646
58,194
11,291
12,847
22.2
22.3
158.9
184.6
38.0
32.7
19.9
17.9
55.0
57.3
5.1
4.4
Tata Global
Buy
122
144
7,690
8,635
9,072
9.8
9.9
6.5
7.6
18.8
16.0
1.9
1.8
6.8
7.4
0.8
0.8
Procter & Gamble
Accumulate
6,486
7,369
21,055
2,588
2,939
23.3
23.2
130.2
146.2
49.8
44.4
99.3
95.3
27.6
25.3
2.6
2.2
Hygiene
IT
HCL Tech^
Buy
841
1,038
118,648
42,038
47,503
21.2
21.5
51.5
57.7
16.3
14.6
3.5
2.7
21.5
18.8
2.4
2.0
Infosys
Accumulate
1,243
1,347
286,500
61,850
69,981
27.5
27.5
59.4
65.7
20.9
18.9
4.4
3.8
21.2
20.1
3.7
3.1
TCS
Accumulate
2,452
2,854
483,129
108,487
122,590
28.3
28.5
122.8
138.4
20.0
17.7
7.6
6.9
38.0
38.9
4.2
3.6
Tech Mahindra
Accumulate
483
530
46,765
26,524
29,177
16.2
17.0
28.8
33.6
16.8
14.4
3.2
2.8
19.3
19.1
1.5
1.3
Wipro
Buy
601
680
148,576
50,808
56,189
23.7
23.8
37.3
40.7
16.1
14.8
3.1
2.8
19.2
17.7
2.2
1.9
Media
D B Corp
Accumulate
331
356
6,081
2,241
2,495
27.8
27.9
21.8
25.6
15.2
12.9
4.0
3.5
26.7
28.5
2.5
2.2
HT Media
Neutral
85
-
1,967
2,495
2,603
11.2
11.2
7.3
8.6
11.6
9.8
0.9
0.8
7.4
8.1
0.3
0.3
Jagran Prakashan
Buy
171
189
5,577
2,170
2,355
27.2
26.2
8.9
9.9
19.2
17.2
4.0
3.5
20.9
20.5
2.3
2.1
Sun TV Network
Neutral
357
-
14,059
2,779
3,196
70.2
70.5
22.8
27.3
15.7
13.1
3.9
3.5
26.7
28.3
4.9
4.2
Hindustan Media
Neutral
270
-
1,982
920
1,031
20.0
20.0
19.2
20.9
14.1
12.9
2.3
2.0
16.4
15.3
1.5
1.3
Ventures
Metals & Mining
Coal India
Buy
279
380
176,005
76,167
84,130
19.9
22.3
22.4
25.8
12.4
10.8
4.5
4.4
35.5
41.0
1.6
1.4
Hind. Zinc
Accumulate
175
175
73,795
14,641
14,026
50.4
50.4
17.7
16.0
9.9
10.9
1.5
1.4
16.2
13.2
2.2
2.1
Hindalco
Neutral
102
-
21,011
104,356
111,186
8.7
9.5
6.7
11.1
15.1
9.2
0.5
0.5
3.5
5.9
0.7
0.6
JSW Steel
Neutral
1,361
-
32,891
42,308
45,147
16.4
20.7
(10.3)
49.5
27.5
1.5
1.5
(1.0)
5.6
1.8
1.7
NMDC
Neutral
102
-
40,500
8,237
10,893
46.6
44.5
10.0
11.7
10.3
8.8
1.1
1.0
12.5
13.0
4.6
3.5
SAIL
Neutral
46
-
19,164
45,915
53,954
7.2
10.5
1.5
4.4
30.8
10.6
0.5
0.4
2.3
4.1
1.0
0.9
Vedanta
Neutral
106
-
31,530
71,445
81,910
26.2
26.3
12.9
19.2
8.3
5.5
0.6
0.5
7.2
8.9
0.8
0.6
Tata Steel
Neutral
357
-
34,658
126,760
137,307
8.9
11.3
6.4
23.1
56.1
15.5
1.1
1.1
2.0
7.1
0.8
0.8
Oil & Gas
Cairn India
Neutral
150
-
28,198
11,323
12,490
49.4
51.0
20.7
20.7
7.3
7.3
0.5
0.5
6.4
6.1
1.6
0.9
Stock Watch
April 21, 2016
Company Name
Reco
CMP
Target
Mkt Cap
Sales ( Čcr )
OPM(%)
EPS (Č)
PER(x)
P/BV(x)
RoE(%)
EV/Sales(x)
(Č)
Price ( Č)
( Č cr )
FY16E FY17E
FY16E
FY17E
FY16E
FY17E
FY16E
FY17E
FY16E
FY17E
FY16E
FY17E
FY16E
FY17E
Oil & Gas
GAIL
Neutral
367
-
46,559
64,856
70,933
9.1
9.6
24.0
28.9
15.3
12.7
1.3
1.2
8.8
9.6
0.9
0.8
ONGC
Neutral
210
-
179,580
154,564
167,321
36.8
37.4
28.6
32.5
7.3
6.5
0.9
0.9
12.7
13.5
1.4
1.3
Petronet LNG
Neutral
267
-
19,999
29,691
31,188
5.8
6.2
12.8
13.4
20.9
19.9
3.1
2.8
15.8
14.8
0.7
0.7
Indian Oil Corp
Accumulate
424
455
102,848
359,607
402,760
5.9
6.1
42.5
48.7
10.0
8.7
1.3
1.2
14.1
14.4
0.4
0.3
Reliance Industries
Accumulate
1,038
1,150
336,448
304,775
344,392
12.6
13.4
91.3
102.6
11.4
10.1
1.3
1.2
11.8
12.0
1.0
0.9
Pharmaceuticals
Alembic Pharma
Neutral
571
-
10,773
3,274
3,802
26.9
19.4
35.0
28.7
16.3
19.9
7.2
5.5
55.6
31.2
3.1
2.6
Aurobindo Pharma
Accumulate
772
856
45,152
14,923
17,162
22.0
23.0
35.7
42.8
21.6
18.0
6.4
4.8
34.0
30.2
3.4
2.9
Aventis*
Neutral
4,245
-
9,776
2,082
2,371
17.4
20.8
118.2
151.5
35.9
28.0
5.3
4.2
19.9
25.5
4.5
3.8
Cadila Healthcare
Accumulate
326
352
33,410
10,224
11,840
21.0
22.0
14.6
17.6
22.4
18.5
6.1
4.8
30.8
29.0
3.2
2.7
Cipla
Buy
527
605
42,358
13,979
16,447
20.2
18.6
25.7
27.5
20.5
19.2
3.3
2.9
17.6
16.1
2.9
2.4
Dr Reddy's
Buy
3,111
3,933
53,048
16,838
19,575
25.0
23.1
167.5
178.8
18.6
17.4
3.9
3.3
23.1
20.4
3.1
2.6
Dishman Pharma
Neutral
348
-
2,808
1,733
1,906
21.5
21.5
17.0
19.9
20.5
17.5
2.1
1.9
10.5
11.2
2.1
1.8
GSK Pharma*
Neutral
3,678
-
31,156
2,870
3,158
20.0
22.1
59.5
68.3
61.8
53.9
18.2
18.7
28.5
34.3
10.3
9.5
Indoco Remedies
Neutral
281
-
2,585
1,033
1,199
15.9
18.2
9.4
13.6
29.9
20.6
4.4
3.8
15.7
19.7
2.5
2.2
Ipca labs
Buy
492
900
6,203
3,363
3,909
12.9
18.6
13.4
28.0
36.7
17.6
2.6
2.3
7.4
14.0
2.1
1.8
Lupin
Neutral
1,572
-
70,843
13,092
16,561
25.0
27.0
50.4
68.3
31.2
23.0
6.4
5.1
22.8
24.7
5.0
3.8
Sun Pharma
Buy
828
950
199,248
28,163
32,610
25.8
30.7
17.4
26.9
47.6
30.8
4.5
3.9
13.0
16.6
6.5
5.4
Power
Tata Power
Neutral
71
-
19,081
35,923
37,402
22.6
22.8
4.1
5.2
17.4
13.7
1.3
1.2
7.5
9.3
1.5
1.3
NTPC
Accumulate
141
146
116,426
87,271
99,297
23.5
23.5
11.8
13.3
12.0
10.6
1.3
1.3
11.5
12.2
2.3
2.1
Power Grid
Buy
148
170
77,401
20,702
23,361
86.7
86.4
12.1
13.2
12.3
11.2
1.8
1.6
15.6
15.1
8.5
7.9
Real Estate
MLIFE
Buy
446
554
1,828
697
1,011
14.9
19.3
13.8
20.1
32.3
22.2
1.2
1.2
3.8
5.3
3.9
2.6
Telecom
Bharti Airtel
Neutral
357
-
142,507
101,748
109,191
32.1
31.7
12.0
12.5
29.7
28.5
2.0
1.9
6.9
6.7
2.0
1.8
Idea Cellular
Neutral
117
-
42,000
34,282
36,941
32.0
31.5
5.9
6.2
19.8
18.8
1.8
1.6
9.9
9.3
1.8
1.7
zOthers
Abbott India
Neutral
4,754
-
10,101
2,715
3,153
14.5
14.1
134.3
152.2
35.4
31.2
8.8
7.3
27.4
25.6
3.5
2.9
Bajaj Electricals
Accumulate
220
237
2,220
4,719
5,287
5.2
5.8
8.6
12.7
25.7
17.4
2.9
2.6
11.4
14.8
0.5
0.4
Finolex Cables
Neutral
289
-
4,421
2,520
2,883
12.2
12.0
12.7
14.2
22.8
20.4
3.1
2.8
13.6
13.5
1.5
1.2
Goodyear India*
Accumulate
505
582
1,166
1,800
1,600
11.7
11.5
58.7
52.9
8.6
9.6
1.9
1.7
24.6
18.7
0.4
0.4
Hitachi
Neutral
1,512
-
4,112
1,779
2,081
7.8
8.8
21.8
33.4
69.4
45.2
11.2
9.1
17.4
22.1
1.9
1.6
Jyothy Laboratories
Neutral
307
-
5,569
1,620
1,847
11.5
11.5
7.3
8.5
42.2
36.3
5.5
5.1
13.3
14.4
3.3
2.8
Stock Watch
April 21, 2016
Company Name
Reco
CMP
Target
Mkt Cap
Sales ( Čcr )
OPM(%)
EPS (Č)
PER(x)
P/BV(x)
RoE(%)
EV/Sales(x)
(Č)
Price ( Č)
( Č cr )
FY16E
FY17E
FY16E
FY17E
FY16E
FY17E
FY16E
FY17E
FY16E
FY17E
FY16E
FY17E
FY16E
FY17E
zOthers
MRF
Buy
36,781
45,575
15,599
20,316
14,488
21.4
21.1
5,488.0
3,798.0
6.7
9.7
2.3
1.9
41.1
21.2
0.7
0.9
Page Industries
Neutral
13,535
-
15,097
1,929
2,450
19.8
20.1
229.9
299.0
58.9
45.3
26.0
18.1
52.1
47.1
7.5
5.9
Relaxo Footwears
Neutral
504
-
6,048
1,767
2,152
12.3
12.5
19.3
25.1
26.2
20.1
6.4
4.9
27.7
27.8
3.4
2.7
Siyaram Silk Mills
Buy
1,100
1,354
1,031
1,636
1,815
11.5
11.5
89.9
104.1
12.2
10.6
2.0
1.8
17.9
17.8
0.7
0.7
Styrolution ABS India* Neutral
621
-
1,092
1,271
1,440
8.6
9.2
32.0
41.1
19.4
15.1
2.0
1.8
10.7
12.4
0.8
0.7
TVS Srichakra
Buy
2,527
3,217
1,935
2,035
2,252
15.9
15.3
248.6
268.1
10.2
9.4
4.4
3.2
43.6
33.9
1.0
0.8
HSIL
Neutral
310
-
2,238
2,123
2,384
16.1
16.5
15.0
18.9
20.6
16.4
1.6
1.5
8.0
9.4
1.4
1.2
Kirloskar Engines India
Neutral
250
-
3,614
2,403
2,554
8.6
9.9
9.2
10.5
27.2
23.8
2.6
2.5
9.7
10.7
1.0
1.0
Ltd
M M Forgings
Buy
453
614
547
511
615
21.7
21.6
43.1
55.8
10.5
8.1
1.9
1.6
19.9
21.2
1.3
1.0
Banco Products (India) Neutral
133
-
953
1,208
1,353
11.0
12.3
10.8
14.5
12.4
9.2
1.4
1.3
11.9
14.5
0.7
0.6
Competent Automobiles Neutral
153
-
94
1,040
1,137
3.2
3.1
25.7
28.0
5.9
5.5
0.9
0.8
15.0
14.3
0.1
0.1
Nilkamal
Neutral
1,315
-
1,962
1,871
2,031
10.7
10.5
63.2
69.8
20.8
18.9
3.4
2.9
17.6
16.6
1.1
1.0
Visaka Industries
Buy
120
144
190
1,086
1,197
9.9
10.3
21.5
28.8
5.6
4.2
0.5
0.5
9.6
11.6
0.4
0.3
Transport Corporation of
Neutral
272
-
2,070
2,830
3,350
8.8
9.0
14.4
18.3
18.9
14.9
2.9
2.5
15.4
17.1
0.9
0.7
India
Elecon Engineering
Neutral
65
-
703
1,359
1,482
10.3
13.7
0.8
3.9
80.4
16.6
1.3
1.3
1.6
7.8
0.9
0.8
Surya Roshni
Buy
156
201
684
2,992
3,223
8.1
8.4
14.7
18.3
10.6
8.5
1.0
0.9
9.7
11.0
0.5
0.5
MT Educare
Neutral
181
-
723
286
366
18.3
17.7
7.7
9.4
23.5
19.4
5.0
4.3
20.2
21.1
2.3
1.8
Radico Khaitan
Buy
91
156
1,210
1,517
1,635
12.7
13.4
5.8
7.1
15.6
12.8
1.3
1.2
8.6
9.6
1.2
1.1
Garware Wall Ropes
Buy
367
473
804
862
974
11.2
11.2
24.9
29.6
14.8
12.4
2.2
1.9
15.1
15.4
0.9
0.7
Wonderla Holidays
Neutral
381
-
2,155
206
308
44.0
43.6
9.0
12.9
42.4
29.6
5.8
5.3
13.7
17.8
10.3
6.9
Linc Pen & Plastics
Neutral
187
-
277
340
371
8.3
8.9
10.8
13.2
17.3
14.2
2.8
2.4
16.0
17.1
0.9
0.8
The Byke Hospitality
Neutral
160
-
643
222
287
20.5
20.5
5.6
7.6
28.5
21.2
5.4
4.4
18.9
20.8
2.8
2.2
Interglobe Aviation
Neutral
1,019
-
36,729
17,022
21,122
20.7
14.5
63.9
53.7
16.0
19.0
23.9
19.6
149.9
103.2
2.2
1.7
Coffee Day Enterprises
Neutral
246
-
5,074
2,692
2,964
17.0
18.6
-
4.7
-
52.0
3.0
2.9
0.2
5.5
2.2
2.0
Ltd
Navneet Education
Neutral
89
-
2,115
998
1,062
24.1
24.0
5.8
6.1
15.4
14.6
3.4
3.0
22.0
20.6
2.1
1.9
Navkar Corporation
Buy
194
265
2,770
365
436
38.3
37.5
5.6
5.9
34.5
33.1
2.2
2.0
6.3
6.1
7.9
6.8
UFO Moviez
Neutral
520
-
1,429
558
619
32.0
33.2
22.5
30.0
23.1
17.3
2.8
2.4
12.0
13.8
2.4
2.0
VRL Logistics
Neutral
410
-
3,745
1,725
1,902
16.5
16.7
12.2
14.6
33.7
28.2
7.0
6.2
20.8
21.9
2.2
1.9
Team Lease Serv.
Neutral
882
-
1,507
2,565
3,229
1.3
1.5
15.2
22.8
58.1
38.7
4.7
4.2
8.0
10.7
0.5
0.4
Stock Watch
April 21, 2016
Company Name
Reco
CMP
Target Mkt Cap
Sales ( Čcr )
OPM(%)
EPS (Č)
PER(x)
P/BV(x)
RoE(%)
EV/Sales(x)
(Č)
Price ( Č)
( Č cr )
FY16E FY17E FY16E FY17E FY16E FY17E FY16E FY17E FY16E FY17E FY16E FY17E FY16E FY17E
zOthers
S H Kelkar & Co.
Neutral
250
-
3,613
928
1,036
15.3
15.1
4.9
6.1
50.6
40.9
4.7
4.4
9.4
10.7
3.6
3.2
Quick Heal
Neutral
246
-
1,723
339
408
27.8
27.3
7.1
7.7
34.8
31.8
2.9
3.0
8.5
9.3
3.5
3.0
Narayana Hrudaya
Neutral
296
-
6,050
1,603
1,873
10.9
11.5
1.0
2.6
310.8
111.9
7.5
6.9
2.4
6.1
4.0
3.4
Manpasand Bever.
Neutral
560
-
2,803
540
836
19.9
19.6
10.2
16.9
54.7
33.1
4.4
4.0
8.1
12.0
4.3
2.7
Source: Company, Angel Research; Note: *December year end; #September year end; &October year end; Price as on April 20, 2016
Market Outlook
April 21, 2016
Research Team Tel: 022 - 39357800
DISCLAIMER
Angel Broking Private Limited (hereinafter referred to as “Angel”) is a registered Member of National Stock Exchange of India Limited,
Bombay Stock Exchange Limited and Metropolitian Stock Exchange of India Limited. It is also registered as a Depository Participant with
CDSL and Portfolio Manager with SEBI. It also has registration with AMFI as a Mutual Fund Distributor. Angel Broking Private Limited is a
registered entity with SEBI for Research Analyst in terms of SEBI (Research Analyst) Regulations, 2014 vide registration number
INH000000164. Angel or its associates has not been debarred/ suspended by SEBI or any other regulatory authority for accessing
/dealing in securities Market. Angel or its associates including its relatives/analyst do not hold any financial interest/beneficial ownership
of more than 1% in the company covered by Analyst. Angel or its associates/analyst has not received any compensation / managed or co
-managed public offering of securities of the company covered by Analyst during the past twelve months. Angel/analyst has not served as
an officer, director or employee of company covered by Analyst and has not been engaged in market making activity of the company
covered by Analyst.
This document is solely for the personal information of the recipient, and must not be singularly used as the basis of any investment
decision. Nothing in this document should be construed as investment or financial advice. Each recipient of this document should make
such investigations as they deem necessary to arrive at an independent evaluation of an investment in the securities of the companies
referred to in this document (including the merits and risks involved), and should consult their own advisors to determine the merits and
risks of such an investment.
Reports based on technical and derivative analysis center on studying charts of a stock's price movement, outstanding positions and
trading volume, as opposed to focusing on a company's fundamentals and, as such, may not match with a report on a company's
fundamentals.
The information in this document has been printed on the basis of publicly available information, internal data and other reliable sources
believed to be true, but we do not represent that it is accurate or complete and it should not be relied on as such, as this document is for
general guidance only. Angel Broking Pvt. Limited or any of its affiliates/ group companies shall not be in any way responsible for any
loss or damage that may arise to any person from any inadvertent error in the information contained in this report. Angel Broking Pvt.
Limited has not independently verified all the information contained within this document. Accordingly, we cannot testify, nor make any
representation or warranty, express or implied, to the accuracy, contents or data contained within this document. While Angel Broking
Pvt. Limited endeavors to update on a reasonable basis the information discussed in this material, there may be regulatory, compliance,
or other reasons that prevent us from doing so.
This document is being supplied to you solely for your information, and its contents, information or data may not be reproduced,
redistributed or passed on, directly or indirectly.
Neither Angel Broking Pvt. Limited, nor its directors, employees or affiliates shall be liable for any loss or damage that may arise from or
in connection with the use of this information.
Note: Please refer to the important ‘Stock Holding Disclosure' report on the Angel website (Research Section). Also, please refer to the
latest update on respective stocks for the disclosure status in respect of those stocks. Angel Broking Pvt. Limited and its affiliates may have
investment positions in the stocks recommended in this report.