Market Outlook
January 21, 2016
Market Cues
Domestic Indices
Chg (%)
(Pts)
(Close)
Indian markets are expected to open in the green tracking the SGX Nifty and Asian
BSE Sensex
(1.7)
(418)
24,062
markets.
Nifty
(1.7)
(126)
7,309
US markets recovered from the lows of the day to end marginally lower as value
Mid Cap
(2.0)
(206)
10,032
buying emerged in the later part of the session. Falling crude prices dragged the
Small Cap
(2.0)
(215)
10,311
major indices down by ~4% at one point before recovering with energy stocks
Bankex
(2.3)
(407)
16,917
leading the slide.
Lower crude prices dragged the European markets down after the International
Global Indices
Chg (%)
(Pts)
(Close)
Energy Agency warned that the oil market could "drown in oversupply" until at least
late 2016. Crude prices plunged to its lowest levels in ~12 years resulting in broad-
Dow Jones
(1.6)
(249)
15,767
based selling.
Nasdaq
(0.1)
(5)
4,472
Indian markets witnessed intense selling pressure after global cues turned negative
FTSE
(3.5)
(203)
5,674
on the back of further weakness in crude prices and the cut in growth forecasts by
Nikkei
(3.7)
(632)
16,416
the IMF. The International Monetary Fund cut its global growth forecasts for the third
Hang Seng
(3.8)
(750)
18,886
time in the last one year on the back of sharp slowdown in China and weakness in
Shanghai Com
(1.0)
(31)
2,977
commodity prices that are hurting markets like Brazil and Russia.
News & Result Analysis
Advances / Declines
BSE
NSE
TVS Motor reintroduces the “Victor” motorcycle at a starting price of `49,490
Advances
471
223
Result Review: Axis Bank
Declines
2,170
1,339
Detailed analysis on Pg2
Unchanged
125
42
Investor’s Ready Reckoner
Key Domestic & Global Indicators
Volumes (` Cr)
Stock Watch: Latest investment recommendations on 150+ stocks
BSE
3,332
Refer P5 onwards
NSE
18,064
Top Picks
CMP
Target
Upside
Net Inflows (` Cr)
Net
Mtd
Ytd
Company
Sector
Rating
(`)
(`)
(%)
FII
(761)
(8,251)
7,459
Amara Raja Batteries Auto & Auto Ancillary
Buy
795
1,040
30.8
MFs
313
1,954
70,675
HCL Tech
IT
Buy
839
1,132
35.0
Larsen & Toubro
Construction
Buy
1,113
1,646
47.9
Top Gainers
Price (`)
Chg (%)
LIC Housing Finance Financials
Buy
460
592
28.7
Repcohome
604
4.6
Navkar Corporation Others
Buy
197
265
34.4
More Top Picks on Pg4
Fsl
36
4.4
Kpit
144
3.5
Key Upcoming Events
Gruh
240
3.4
Previous
Consensus
Date
Region
Event Description
Reading
Expectations
Pipavavdoc
78
3.3
Jan 21
USA
Initial Jobless claims (‘000)
284
280
Euro Zone
Consumer Confidence
(5.70)
(5.70)
Top Losers
Price (`)
Chg (%)
Euro Zone
ECB Interest Rates Announcement (%)
0.05
0.05
Vedl
64
(8.0)
Jan 22
USA
Existing Home Sales
4.76
5.20
Suntv
340
(7.9)
Jpinfratec
10
(7.5)
Den
83
(7.3)
Gvkpil
7
(7.2)
As on January 20, 2015
Market Outlook
January 21, 2016
TVS Motor reintroduces the “Victor” motorcycle at a starting price
of `49,490
In a bid to strengthen its position in commuter motorcycle segment, TVS Motor has
relaunched its popular “Victor” in an all-new avatar, pricing the bike at `49,490
ex-showroom. The TVS Victor was first introduced way back in 2001 and was the
first motorcycle developed and manufactured by TVS in India post its split with
Suzuki. Victor went on to become TVS Motors most successful product back then
clocking monthly average volumes of about 40,000 units/month in 2002.
The new Victor though is an all-new motorcycle powered by a heavily reworked
110cc engine also employed on the TVS Star City+. The engine produces 8.3PS of
power and 9Nm of peak torque. TVS has claimed fuel efficiency of 76kmpl. The
new Victor will face off against established names in the commuter space like the
Hero Splendor/Passion Pro and the Honda Dream series and Livo primarily. TVS
“Victor” has a strong brand recall and we believe the relaunch should help TVS
increase market share in the motorcycle space. We have Buy rating on the stock.
Result Review
Axis Bank (CMP: `389 / TP: Under Review)
Axis Bank reported a positive set of numbers on the operating front for 3QFY2016
with PAT growing by 14.5% yoy to `2,175.3cr surpassing street as well as our
expectations. On the balance sheet front, advances for the quarter grew by 21%
yoy, which is strong, considering the slower credit growth in the economy. Retail
advances grew 27% yoy and accounted for 40% of the net advances of the Bank.
On the operating front, the net interest income for the bank grew at a moderate
pace by 15.9% yoy, in-line with our expectations. Provisions for the bank surged
40.5% yoy whereas on a qoq basis, it increased marginally by 0.8%.
Asset quality deteriorated with surge in gross and net NPA ratios to 1.68% and
0.75% from 1.38% and 0.48% for the previous quarter. Slippages came in higher
at `2,082cr, whereas bank transferred four accounts worth `1,600cr under 5/25
scheme and strategic debt restructuring in one account (which is a construction
company) worth `500cr. However, the bank has stated that it has taken into
account the full impact of asset quality review conducted by RBI, which accounted
for ~50% of the total slippages for the quarter.
Quarterly Bloomberg Brokers Consensus Estimate
Hindustan Zinc Ltd - January 21, 2016
Particulars (` cr)
2QFY16E
2QFY15
y-o-y (%)
1QFY16
q-o-q (%)
Net sales
3,384
3,803
(11.0)
3,908
(13.4)
EBITDA
1,471
2,089
(29.6)
2,164
(32.0)
EBITDA margin (%)
43.5
54.9
55.4
Net profit
1,656
2,379
(30.4)
2,285
(27.5)
Market Outlook
January 21, 2016
Exide Industries - January 21, 2016
Particulars (` cr)
2QFY16E
2QFY15
y-o-y (%)
1QFY16
q-o-q (%)
Net sales
1,626
1,558
4.3
1,736
(6.4)
EBITDA
234
180
29.7
257
(9.3)
EBITDA margin (%)
14.4
11.6
14.8
Net profit
132
97
36.0
156
(15.3)
Idea Cellular Ltd Consl - January 21, 2016
Particulars (` cr)
2QFY16E
2QFY15
y-o-y (%)
1QFY16
q-o-q (%)
Net sales
9,072
8,009
13.3
8,676
4.6
EBITDA
3,208
2,752
16.6
3,057
4.9
EBITDA margin (%)
35.4
34.4
35.2
Net profit
796
767
3.8
809
(1.6)
M & M Fin Ser Ltd - January 21, 2016
Particulars (` cr)
3QFY16E
3QFY15
y-o-y (%)
2QFY16
q-o-q (%)
PAT
168
136
23.5
146
15.1
Economic and Political News
Infrastructure status granted to shipyard industry
Government approves `5,050cr funding to push solar projects
FDI flows to India doubles to $59 billion in 2015: Report
Cabinet panel okays six-laning of NH2 in Bihar and Jharkhand
Corporate News
Pricol to invest `500cr to support its target of doubling revenue by 2020
Cipla to sell hepatitis C drug Daclatasvir
Gayatri infrastructure to sell stake in Western UP Tollway highway
MRF may set up factory in Gujarat, ASEAN countries
Market Outlook
January 21, 2016
Top Picks HHHHH
Large Cap
Market Cap
CMP
Target
Upside
Company
Rationale
(` Cr)
(`)
(`)
(%)
To outpace battery industry growth due to better technological
Amara Raja Batteries
13,586
795
1,040
30.8
products leading to market share gains in both the automotive
OEM and replacement segments.
Earnings to grow strongly given the MHCV cyclical upturn.
Ashok Leyland
23,792
84
111
32.8
Focus on exports and LCV's provides additional growth
avenue.
The stock is trading at attractive valuations and is factoring all
HCL Tech
1,18,171
839
1,132
35.0
the bad news.
Strong visibility for a robust 20% earnings trajectory, coupled
HDFC Bank
2,56,852
1,017
1,262
24.1
with high quality of earnings on account of high quality retail
business and strategic focus on highly rated corporates.
Back on the growth trend, expect a long term growth of 14%
Infosys
2,57,637
1,122
1,347
20.1
to be a US$20bn in FY2020.
Well positioned to benefit from such expected gradual
recovery in the overall domestic capex cycle, given its presence
Larsen & Toubro
1,03,654
1,113
1,646
47.9
across various infrastructure segments, its execution
capabilities, and its strong balance sheet.
LICHF continues to grow its retail loan book at a healthy pace
with improvement in asset quality. We expect the company to
LIC Housing Finance
23,194
460
592
28.7
post a healthy loan book which is likely to reflect in a strong
earnings growth.
Source: Company, Angel Research
Mid Cap
Market Cap
CMP
Target
Upside
Company
Rationale
(` Cr)
(`)
(`)
(%)
Favourable outlook for the AC industry to augur well for
Cooling products business which is out pacing the market
Blue Star
3,099
345
439
27.4
growth. EMPPAC division's profitability to improve once
operating environment turns around.
Change in business focus towards high-margin chronic &
Garware Wall Ropes
744
340
473
39.1
lifestyle segments and increasing penetration in Europe and
US
Economic recovery to have favourable impact on advertising &
circulation revenue growth. Further, the acquisition of a radio
Jagran Prakashan
5,219
160
189
18.4
business (Radio City) would also boost the company's revenue
growth.
Massive capacity expansion along with rail advantage at ICD
Navkar Corporation
2,812
197
265
34.4
as well CFS augurs well for the company
Earnings boost on back of stable material prices and
Radico Khaitan
1,426
107
156
45.6
favourable pricing environment. Valuation discount to peers
provides additional comfort
Strong brands and distribution network would boost growth
Siyaram Silk Mills
983
1,049
1,354
29.1
going ahead. Stock currently trades at an inexpensive
valuation.
Structural shift in the Lighting industry towards LED lighting will
Surya Roshni
607
139
201
45.1
drive growth.
Source: Company, Angel Research
Market Outlook
January 21, 2016
Key Upcoming Events
Result Calendar
Date
Company
Jan 20, 2016
UltraTech Cement, Axis Bank, South Ind.Bank, KPIT Cummins, NIIT, Reliance Infra.
Jan 21, 2016
Exide Industries, Reliance Capital, Hind. Zinc, Heritage Foods, Alembic Pharma, Interglobe Aviation
Jan 22, 2016
ITC, D B Corp, Cairn India
Jan 23, 2016
Persistent, Siyaram Silk Mills
Jan 25, 2016
Subros, HDFC Bank, Hindustan Media Ventures, MRF, Nilkamal
Jan 27, 2016
Colgate, Godrej Consumer, HT Media, Kirloskar Engines India Ltd, L G Balakrishnan & Bros, Power Grid Corpn
Maruti, ICICI Bank, Syndicate Bank, Dabur India, Sesa Goa, Jyothy Laboratories, Tide Water Oil India, Glenmark
Jan 28, 2016
Pharma.
Jan 29, 2016
TVS Motor, Siemens, Thermax, Blue Star, Yes Bank, JSW Steel , Banco, Elecon Engineering, Indoco Remedies, NTPC
Jan 30, 2016
IDFC, Electrosteel Castings, Relaxo
Feb 1, 2016
Tech Mahindra, Transport Corporation of India
Feb 2, 2016
Amara Raja Batteries, Cummins India, Crompton Greaves
Feb 3, 2016
Hexaware, IOC
Feb 4, 2016
Bajaj Auto, ABB, J K Lakshmi Cements, Mphasis, Tata Steel
Feb 5, 2016
Lupin, Tata Power Co.
Source: Bloomberg, Angel Research
Global economic events release calendar
Date
Time
Country
Event Description
Unit
Period
Bloomberg Data
Last Reported Estimated
Jan 21, 2016
7:00PM US
Initial Jobless claims
Thousands
Jan 16
284.00
277.50
8:30PM Euro Zone
Euro-Zone Consumer Confidence
Value
Jan A
(5.70)
(5.70)
6:15PM Euro Zone
ECB announces interest rates
%
Jan 21
0.05
0.05
Jan 22, 2016
2:00PM Germany
PMI Services
Value
Jan P
56.00
55.50
2:00PM Germany
PMI Manufacturing
Value
Jan P
53.20
53.00
8:30PM US
Existing home sales
Million
Dec
4.76
5.20
Jan 26, 2016
8:30PM US
Consumer Confidence
S.A./ 1985=100
Jan
96.50
97.00
Jan 27, 2016
8:30PM US
New home sales
Thousands
Dec
490.00
501.00
Jan 28, 2016
3:00PM UK
GDP (YoY)
% Change
4Q A
2.10
--
12:30AM US
FOMC rate decision
%
Jan 27
0.50
0.50
Jan 29, 2016
7:00PM US
GDP Qoq (Annualised)
% Change
4Q A
2.00
0.90
Feb 1, 2016
3:00PM UK
PMI Manufacturing
Value
Jan
51.90
--
6:30AM China
PMI Manufacturing
Value
Jan
49.70
--
Feb 2, 2016
2:25PM Germany
Unemployment change (000's)
Thousands
Jan
(14.00)
--
11:00AM India
RBI Reverse Repo rate
%
Feb 2
5.75
--
11:00AM India
RBI Repo rate
%
Feb 2
6.75
--
11:00AM India
RBI Cash Reserve ratio
%
Feb 2
4.00
--
Source: Bloomberg, Angel Research
Market Outlook
January 21, 2016
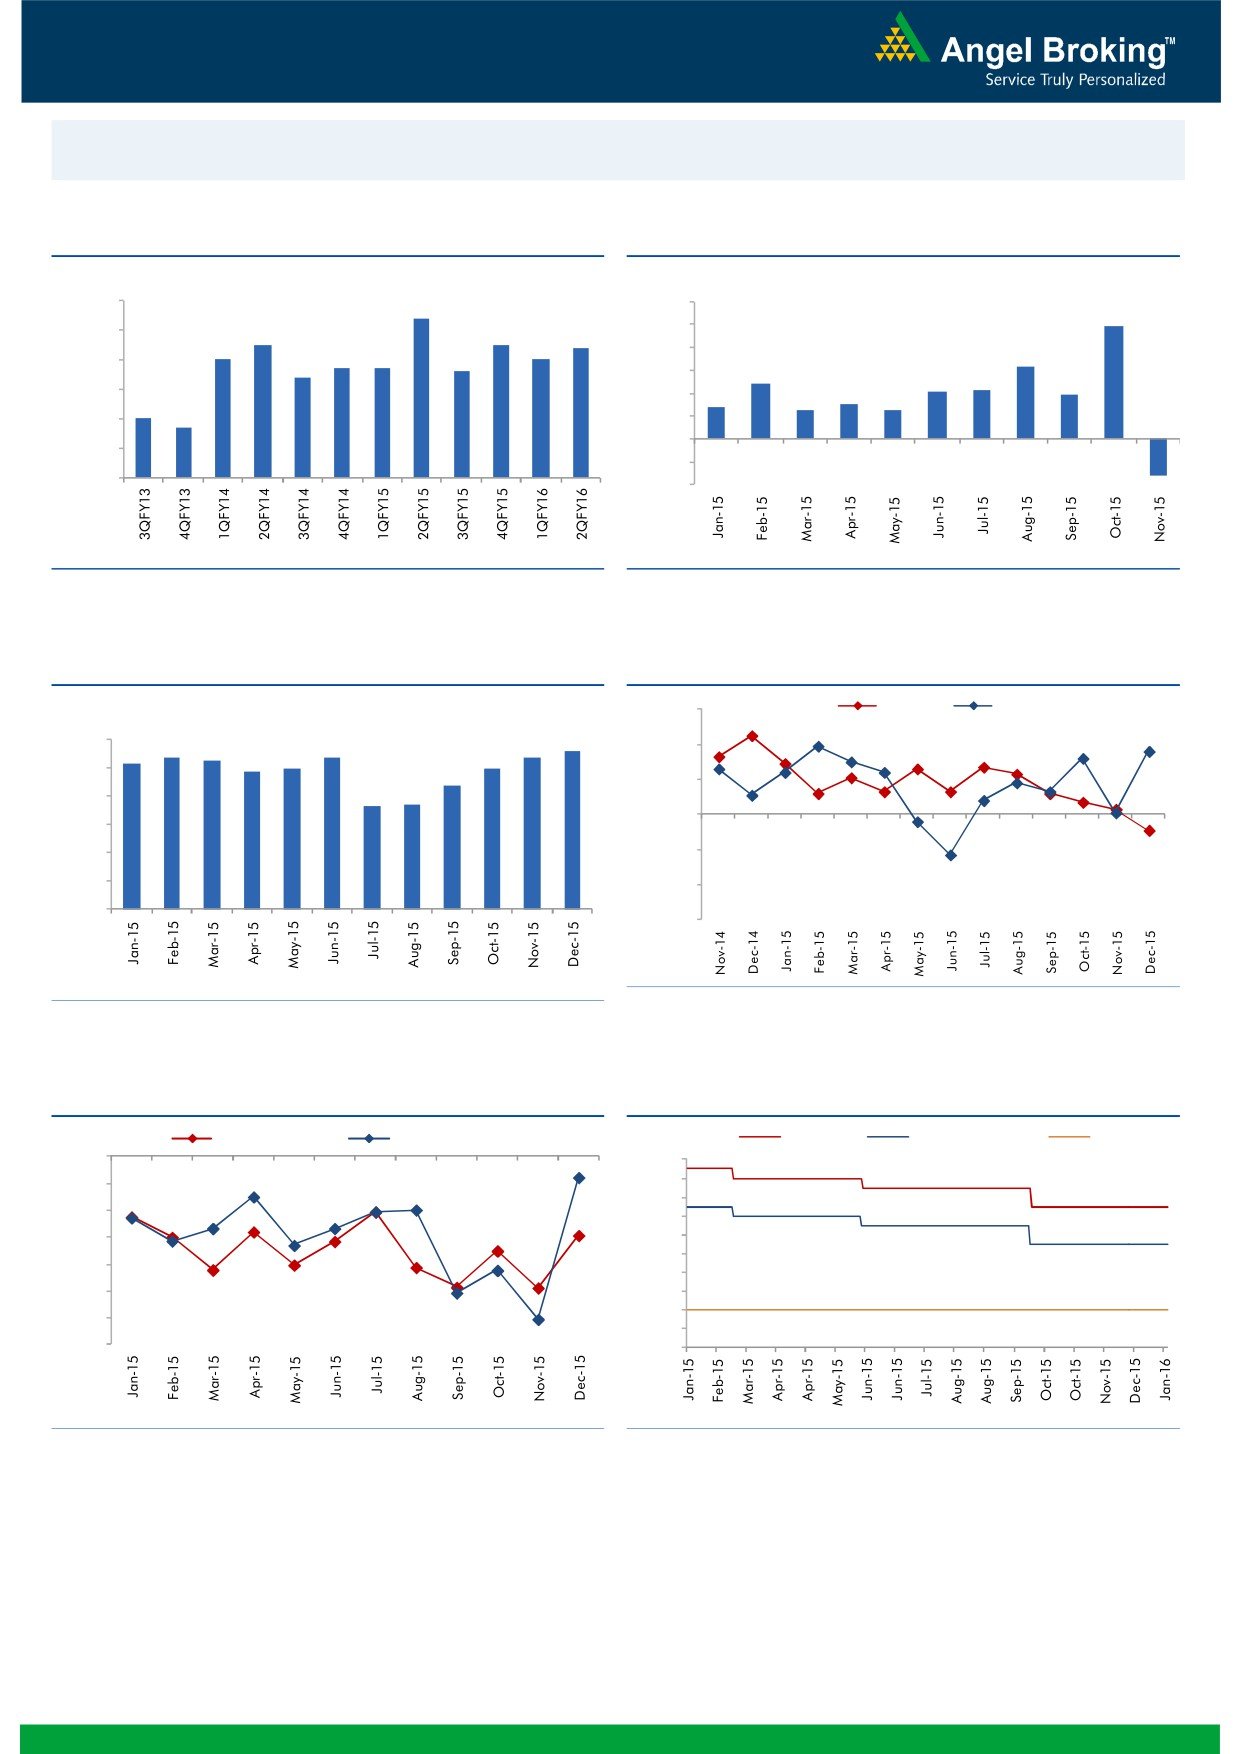
Macro watch
Exhibit 1: Quarterly GDP trends
Exhibit 2: IIP trends
(%)
(%)
9.0
8.4
12.0
9.9
7.5
7.5
10.0
8.0
7.4
7.0
7.0
6.7
6.7
8.0
6.3
6.6
7.0
6.4
6.0
4.8
4.3
4.2
3.8
6.0
2.8
3.0
4.0
2.5
2.5
5.0
4.7
5.0
2.0
-
4.0
(2.0)
3.0
(4.0)
(3.2)
Source: CSO, Angel Research
Source: MOSPI, Angel Research
Exhibit 3: Monthly CPI inflation trends
Exhibit 4: Manufacturing and services PMI
(%)
56.0
Mfg. PMI
Services PMI
5.6
6.0
5.4
5.3
5.4
5.4
54.0
5.2
5.0
5.0
4.9
5.0
4.4
52.0
3.7
3.7
4.0
50.0
3.0
2.0
48.0
1.0
46.0
-
44.0
Source: Market, Angel Research; Note: Level above 50 indicates expansion
Source: MOSPI, Angel Research
Exhibit 5: Exports and imports growth trends
Exhibit 6: Key policy rates
(%)
Exports yoy growth
Imports yoy growth
(%)
Repo rate
Reverse Repo rate
CRR
0.0
8.00
(5.0)
7.50
7.00
(10.0)
6.50
(15.0)
6.00
5.50
(20.0)
5.00
(25.0)
4.50
4.00
(30.0)
3.50
(35.0)
3.00
Source: Bloomberg, Angel Research
Source: RBI, Angel Research
Market Outlook
January 21, 2016
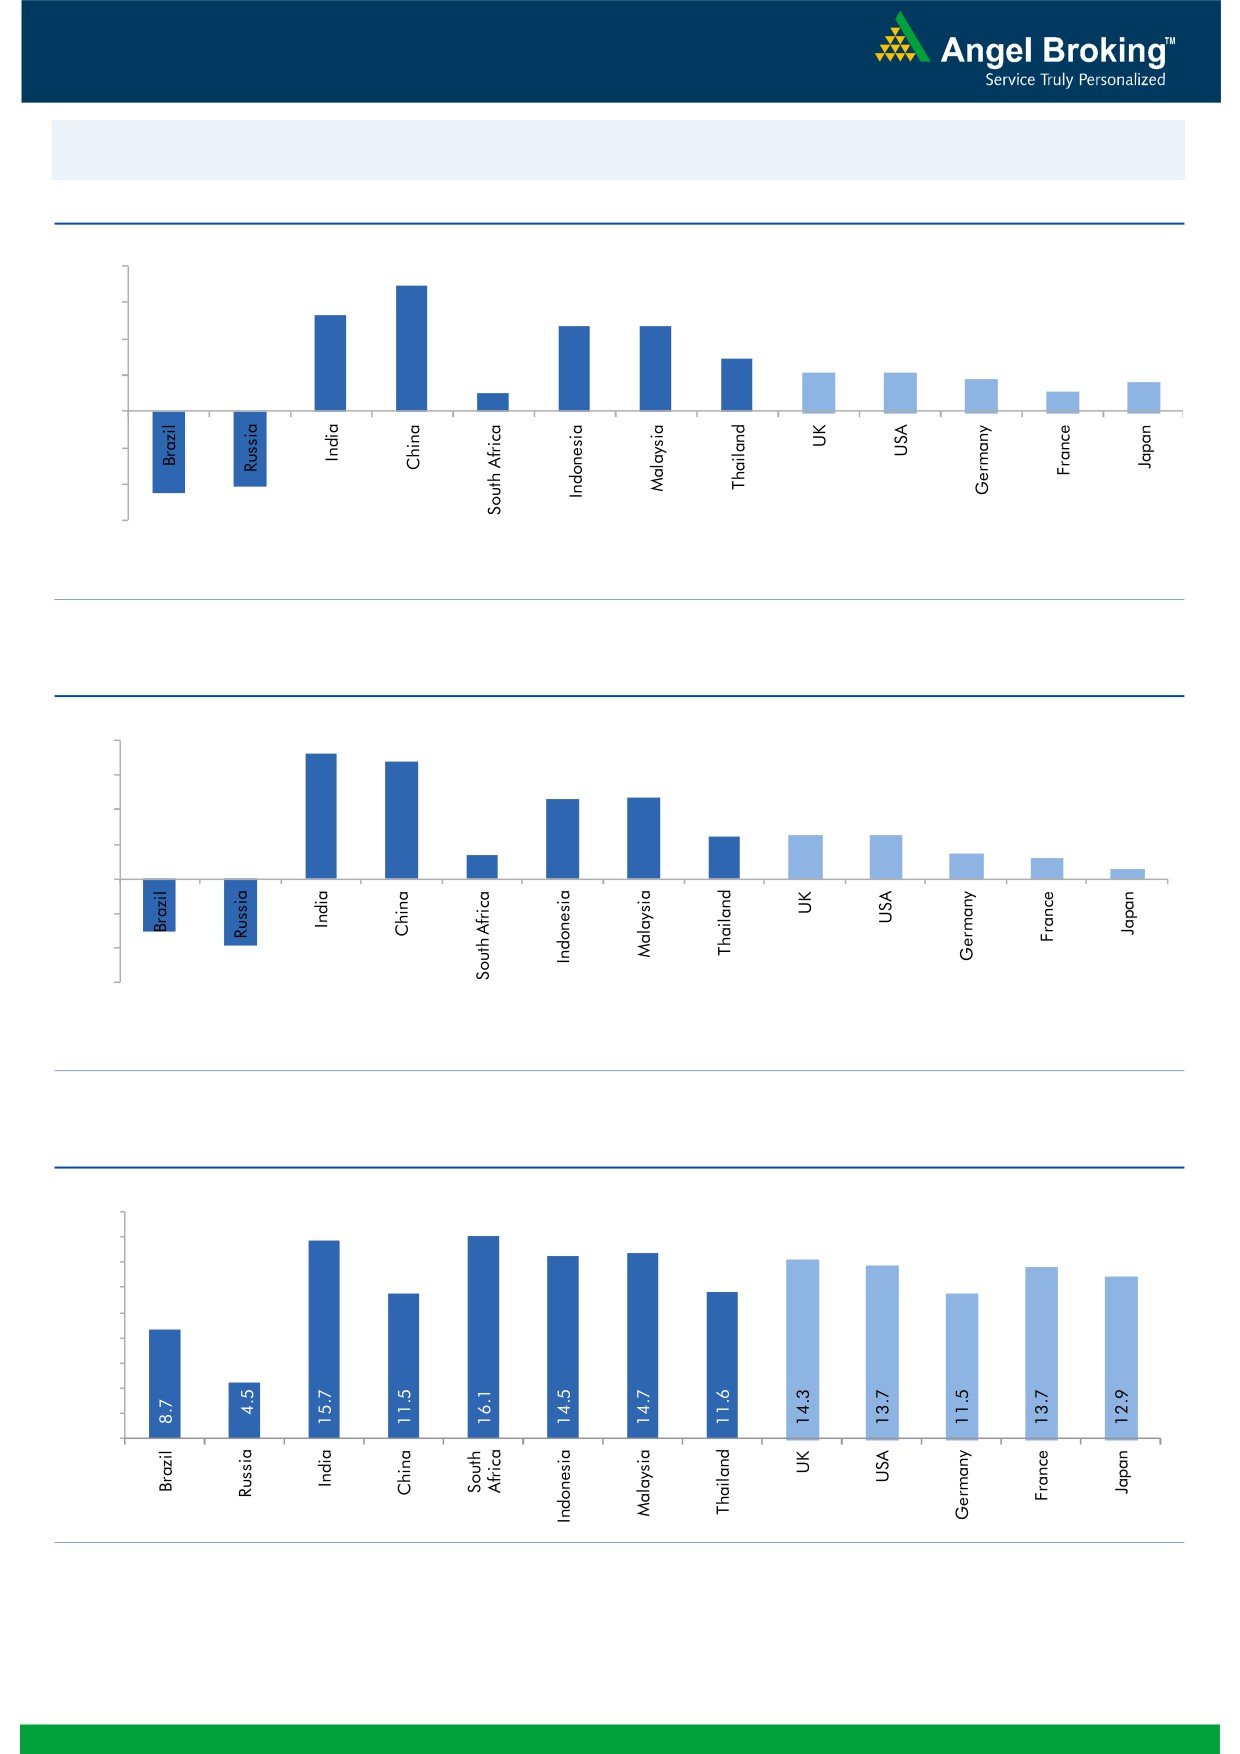
Global watch
Exhibit 1: Latest quarterly GDP Growth (%, yoy) across select developing and developed countries
(%)
8.0
6.9
6.0
5.3
4.7
4.7
4.0
2.9
2.1
2.1
1.8
2.0
1.0
1.1
1.6
-
(2.0)
(4.0)
(4.1)
(4.5)
(6.0)
Source: Bloomberg, Angel Research
Exhibit 2: 2015 GDP Growth projection by IMF (%, yoy) across select developing and developed countries
(%)
7.3
8.0
6.8
6.0
4.7
4.7
4.0
2.5
2.5
2.6
1.4
1.5
2.0
1.2
0.6
-
(2.0)
(4.0)
(3.0)
(3.8)
(6.0)
Source: IMF, Angel Research
Exhibit 3: One year forward P-E ratio across select developing and developed countries
(x)
18.0
16.0
14.0
12.0
10.0
8.0
6.0
4.0
2.0
-
Source: IMF, Angel Research
Market Outlook
January 21, 2016
Exhibit 4: Relative performance of indices across globe
Returns (%)
Country
Name of index
Closing price
1M
3M
1YR
Brazil
Bovespa
37,645
(16.1)
(19.4)
(21.6)
Russia
Micex
1,630
(6.4)
(5.9)
3.4
India
Nifty
7,309
(5.8)
(11.3)
(13.9)
China
Shanghai Composite
2,977
(19.4)
(12.9)
(9.3)
South Africa
Top 40
41,611
(7.4)
(12.8)
(3.4)
Mexico
Mexbol
40,844
(6.1)
(7.9)
(2.2)
Indonesia
LQ45
769
1.7
(0.1)
(14.4)
Malaysia
KLCI
1,619
(0.9)
(5.7)
(7.4)
Thailand
SET 50
776
(7.3)
(16.0)
(23.8)
USA
Dow Jones
15,767
(11.2)
(8.4)
(10.2)
UK
FTSE
5,674
(6.4)
(10.7)
(16.5)
Japan
Nikkei
16,416
(11.6)
(8.2)
(4.5)
Germany
DAX
9,392
(10.1)
(7.1)
(10.0)
France
CAC
4,125
(11.8)
(11.7)
(10.8)
Source: Bloomberg, Angel Research
Stock Watch
January 21, 2016
Company Name
Reco
CMP
Target
Mkt Cap
Sales ( Čcr )
OPM(%)
EPS (Č)
PER(x)
P/BV(x)
RoE(%)
EV/Sales(x)
(Č)
Price ( Č)
( Č cr )
FY16E FY17E
FY16E
FY17E
FY16E
FY17E
FY16E
FY17E
FY16E
FY17E
FY16E
FY17E
FY16E
FY17E
Agri / Agri Chemical
Rallis
Neutral
144
-
2,795
2,097
2,415
14.4
14.4
9.5
11.0
15.1
13.1
3.0
2.6
21.1
21.3
1.4
1.2
United Phosphorus
Buy
374
510
16,008
13,698
15,752
17.6
17.6
32.1
38.5
11.6
9.7
2.3
1.9
21.4
21.3
1.3
1.0
Auto & Auto Ancillary
Ashok Leyland
Buy
84
111
23,792
17,995
21,544
11.4
11.6
3.4
4.7
24.6
17.8
4.3
4.0
17.7
22.2
1.3
1.0
Bajaj Auto
Buy
2,276
2,728
65,867
23,695
27,298
21.3
20.4
134.6
151.5
16.9
15.0
5.4
4.6
31.8
30.6
2.3
2.0
Bharat Forge
Buy
775
943
18,047
7,867
8,881
20.0
20.3
34.4
41.0
22.5
18.9
4.4
3.6
21.1
20.9
2.4
2.1
Eicher Motors
Buy
15,539
19,036
42,194
15,379
16,498
15.6
16.6
473.2
574.8
32.8
27.0
12.1
9.0
36.7
33.2
2.7
2.4
Gabriel India
Buy
83
101
1,195
1,415
1,544
8.7
9.0
4.6
5.4
18.1
15.4
3.3
2.9
18.1
18.9
0.8
0.7
Hero Motocorp
Accumulate
2,488
2,774
49,683
28,561
31,559
14.7
14.7
151.1
163.2
16.5
15.3
6.4
5.4
38.7
35.6
1.6
1.4
Jamna Auto Industries Neutral
134
-
1,071
1,292
1,486
9.3
9.8
6.0
7.5
22.3
17.9
4.6
3.9
20.7
21.8
0.9
0.8
L G Balakrishnan & Bros Neutral
462
-
725
1,254
1,394
11.6
11.8
35.9
41.7
12.9
11.1
1.7
1.5
13.5
13.8
0.7
0.6
Mahindra and Mahindra Buy
1,151
1,449
71,457
39,031
44,440
13.8
13.9
57.9
67.6
19.9
17.0
3.2
2.8
16.1
16.6
1.5
1.2
Maruti
Neutral
4,059
-
122,611
57,865
68,104
16.4
16.7
176.3
225.5
23.0
18.0
4.5
3.8
19.4
21.2
1.9
1.6
Minda Industries
Accumulate
769
867
1,220
2,567
2,965
8.0
8.3
46.1
57.8
16.7
13.3
2.8
2.3
16.7
17.3
0.6
0.5
Motherson Sumi
Buy
252
313
33,359
39,343
45,100
8.8
9.1
10.1
12.5
25.0
20.2
7.9
6.2
35.3
34.4
0.9
0.8
Rane Brake Lining
Buy
291
366
230
454
511
11.1
11.4
23.8
28.1
12.2
10.4
1.7
1.6
14.2
15.3
0.6
0.6
Setco Automotive
Neutral
34
-
454
594
741
12.7
13.7
1.7
3.2
20.0
10.6
2.1
1.8
10.4
16.9
1.2
1.0
Tata Motors
Buy
342
409
98,757
266,022
312,667
12.8
13.1
26.3
38.3
13.0
8.9
1.7
1.5
8.4
12.1
0.5
0.5
TVS Motor
Buy
274
338
13,022
11,569
13,648
7.3
8.7
10.3
16.1
26.6
17.0
6.6
5.2
24.8
30.5
1.1
0.9
Amara Raja Batteries
Buy
795
1,040
13,586
4,892
5,871
17.4
17.6
28.8
37.1
27.6
21.4
6.5
5.2
23.4
24.1
2.7
2.2
Exide Industries
Buy
125
162
10,625
6,950
7,784
14.4
14.8
6.6
7.3
18.9
17.1
2.4
2.2
12.6
12.8
1.2
1.1
Apollo Tyres
Buy
135
171
6,864
12,146
12,689
16.8
16.0
21.2
19.0
6.4
7.1
1.1
0.9
16.5
13.0
0.6
0.7
Ceat
Buy
889
1,119
3,596
6,041
6,597
14.1
13.7
99.5
111.9
8.9
7.9
1.8
1.5
19.6
18.5
0.7
0.6
JK Tyres
Neutral
86
-
1,948
7,446
7,669
15.2
14.0
19.6
18.4
4.4
4.7
1.1
0.9
25.2
19.5
0.7
0.6
Swaraj Engines
Neutral
907
-
1,126
552
630
14.2
14.7
44.6
54.1
20.3
16.8
4.7
4.3
23.2
25.6
1.9
1.6
Subros
Neutral
86
-
517
1,268
1,488
11.6
11.9
3.7
6.6
23.3
13.1
1.6
1.4
6.8
11.4
0.7
0.6
Indag Rubber
Neutral
172
-
452
283
329
17.0
17.2
13.0
15.4
13.3
11.2
2.9
2.4
21.8
21.6
1.3
1.1
Capital Goods
ACE
Neutral
37
-
364
660
839
4.7
8.2
1.0
3.9
36.8
9.4
1.2
1.0
3.2
11.3
0.7
0.6
BEML
Neutral
1,095
-
4,559
3,277
4,006
6.0
8.9
29.2
64.3
37.5
17.0
2.1
1.9
5.7
11.7
1.5
1.2
Bharat Electronics
Buy
1,213
1,414
29,110
7,737
8,634
16.8
17.2
54.0
61.0
22.5
19.9
3.2
2.9
39.3
45.6
2.9
2.5
Stock Watch
January 21, 2016
Company Name
Reco
CMP
Target
Mkt Cap
Sales ( Čcr )
OPM(%)
EPS (Č)
PER(x)
P/BV(x)
RoE(%)
EV/Sales(x)
(Č)
Price ( Č)
( Č cr )
FY16E
FY17E
FY16E
FY17E
FY16E
FY17E
FY16E
FY17E
FY16E
FY17E
FY16E
FY17E
FY16E
FY17E
Capital Goods
Voltas
Buy
270
353
8,927
5,363
5,963
8.0
9.1
11.0
13.8
24.5
19.6
3.8
3.3
16.2
17.9
1.6
1.4
BGR Energy
Neutral
104
-
751
3,615
3,181
9.5
9.4
16.7
12.4
6.2
8.4
0.6
0.6
10.0
7.0
0.6
0.8
BHEL
Neutral
143
-
34,915
33,722
35,272
10.8
11.7
10.5
14.2
13.6
10.1
1.0
0.9
7.0
9.0
1.1
1.1
Blue Star
Buy
345
439
3,099
3,548
3,977
6.3
6.9
13.7
17.2
25.2
20.1
6.3
4.1
26.1
25.4
1.0
0.8
Crompton Greaves
Buy
169
204
10,608
13,484
14,687
4.9
6.2
4.5
7.1
37.6
23.8
2.7
2.5
7.2
10.8
0.9
0.8
Inox Wind
Buy
321
458
7,115
4,980
5,943
17.0
17.5
26.6
31.6
12.1
10.2
3.6
2.7
35.0
30.0
1.6
1.3
KEC International
Neutral
112
-
2,881
8,791
9,716
6.1
6.8
5.4
8.2
20.8
13.7
2.1
1.9
10.0
14.0
0.5
0.5
Thermax
Neutral
850
-
10,128
6,413
7,525
7.4
8.5
30.5
39.3
27.9
21.6
4.3
3.7
15.0
17.0
1.6
1.3
Cement
ACC
Buy
1,215
1,630
22,813
13,151
14,757
16.4
18.3
63.9
83.4
19.0
14.6
2.5
2.2
13.3
16.1
1.6
1.3
Ambuja Cements
Buy
187
233
29,020
11,564
12,556
19.4
20.7
8.9
10.1
21.0
18.5
2.6
2.5
12.8
13.8
2.2
2.0
HeidelbergCement
Neutral
70
-
1,577
1,772
1,926
13.3
15.4
1.0
3.0
69.6
23.2
1.8
1.6
2.6
7.9
1.5
1.3
India Cements
Buy
80
112
2,468
4,216
4,840
18.0
19.5
4.0
9.9
20.1
8.1
0.8
0.7
4.0
9.5
0.9
0.7
JK Cement
Buy
457
744
3,193
3,661
4,742
10.1
15.8
18.0
61.0
25.4
7.5
1.8
1.6
7.5
22.9
1.3
1.0
J K Lakshmi Cement
Buy
280
430
3,295
2,947
3,616
16.7
19.9
11.5
27.2
24.4
10.3
2.3
2.0
9.8
20.8
1.5
1.2
Mangalam Cements
Neutral
174
-
464
1,053
1,347
10.5
13.3
8.4
26.0
20.7
6.7
0.9
0.8
4.3
12.5
0.8
0.6
Orient Cement
Buy
140
183
2,869
1,854
2,524
21.2
22.2
7.7
11.1
18.2
12.6
2.6
2.3
13.3
15.7
2.3
1.6
Ramco Cements
Neutral
361
-
8,603
4,036
4,545
20.8
21.3
15.1
18.8
23.9
19.2
2.9
2.6
12.9
14.3
2.6
2.3
Shree Cement^
Neutral
9,707
-
33,815
7,150
8,742
26.7
28.6
228.0
345.5
42.6
28.1
6.3
5.3
15.7
20.3
4.5
3.6
UltraTech Cement
Buy
2,625
3,282
72,042
25,021
30,023
19.1
21.6
89.0
132.0
29.5
19.9
3.4
3.0
12.2
15.9
2.9
2.5
Construction
ITNL
Neutral
71
-
2,342
7,360
8,825
34.0
35.9
7.0
9.0
10.2
7.9
0.4
0.3
3.2
3.7
3.7
3.6
KNR Constructions
Buy
464
673
1,305
937
1,470
14.3
14.0
33.5
38.6
13.9
12.0
2.1
1.8
15.4
15.4
1.5
1.0
Larsen & Toubro
Buy
1,113
1,646
103,654
65,065
77,009
11.5
11.7
61.5
65.6
18.1
17.0
1.8
1.7
13.4
14.0
1.8
1.5
Gujarat Pipavav Port
Neutral
143
-
6,908
629
684
51.0
52.2
6.4
5.9
22.3
24.2
2.9
2.7
15.9
12.7
10.6
9.6
MBL Infrastructures
Buy
162
285
672
2,313
2,797
12.2
14.6
19.0
20.0
8.5
8.1
0.9
0.8
11.3
10.6
1.0
0.9
Nagarjuna Const.
Neutral
64
-
3,558
7,892
8,842
8.8
9.1
3.0
5.3
21.3
12.1
1.1
1.0
5.0
8.5
0.7
0.6
PNC Infratech
Buy
470
558
2,411
1,873
2,288
13.2
13.5
24.0
32.0
19.6
14.7
1.9
1.7
12.1
12.3
1.4
1.2
Simplex Infra
Neutral
281
-
1,389
5,955
6,829
10.3
10.5
16.0
31.0
17.5
9.1
0.9
0.9
5.3
9.9
0.7
0.6
Power Mech Projects
Neutral
575
-
846
1,539
1,801
12.8
12.7
59.0
72.1
9.7
8.0
1.5
1.2
18.6
16.8
0.6
0.5
Sadbhav Engineering
Neutral
294
-
5,043
3,481
4,219
10.7
10.8
8.0
12.0
36.8
24.5
3.4
3.0
10.3
13.5
1.7
1.4
Stock Watch
January 21, 2016
Company Name
Reco
CMP
Target
Mkt Cap
Sales ( Čcr )
OPM(%)
EPS (Č)
PER(x)
P/BV(x)
RoE(%)
EV/Sales(x)
(Č)
Price ( Č)
( Č cr )
FY16E
FY17E
FY16E
FY17E
FY16E
FY17E
FY16E
FY17E
FY16E
FY17E
FY16E
FY17E
FY16E
FY17E
Construction
NBCC
Buy
879
1,089
10,552
7,382
9,506
7.7
8.6
39.8
54.4
22.1
16.2
5.3
4.2
26.7
29.1
1.2
0.9
MEP Infra
Neutral
41
-
671
1,956
1,876
28.1
30.5
1.3
3.0
31.7
13.8
6.7
4.5
21.2
32.8
1.8
1.7
SIPL
Neutral
81
-
2,862
675
1,042
62.4
64.7
-
-
3.0
3.5
-
-
15.9
10.7
Financials
Allahabad Bank
Neutral
50
-
3,024
8,569
9,392
2.8
2.9
16.3
27.5
3.1
1.8
0.3
0.2
7.6
11.9
-
-
Axis Bank
Buy
389
531
92,469
26,473
31,527
3.5
3.6
35.7
43.5
10.9
8.9
2.1
1.8
17.9
18.9
-
-
Bank of Baroda
Neutral
121
-
27,938
18,485
21,025
1.9
2.0
13.5
21.1
9.0
5.7
0.7
0.6
7.3
10.6
-
-
Bank of India
Neutral
91
-
7,238
15,972
17,271
1.9
2.0
15.3
33.4
6.0
2.7
0.3
0.2
3.6
7.6
-
-
Canara Bank
Neutral
172
-
9,353
15,441
16,945
2.0
2.1
46.6
70.4
3.7
2.5
0.3
0.3
8.0
11.2
-
-
Dena Bank
Neutral
35
-
2,226
3,440
3,840
2.1
2.3
7.3
10.0
4.8
3.4
0.4
0.3
6.1
7.9
-
-
Federal Bank
Neutral
48
-
8,184
3,477
3,999
3.0
3.0
5.0
6.2
9.5
7.6
1.0
0.9
10.6
11.9
-
-
HDFC
Neutral
1,135
-
179,217
10,358
11,852
3.3
3.3
41.1
47.0
27.6
24.1
5.3
4.8
24.7
24.9
-
-
HDFC Bank
Buy
1,017
1,262
256,852
38,309
47,302
4.3
4.3
49.3
61.1
20.6
16.7
3.6
3.1
18.5
19.7
-
-
ICICI Bank
Buy
224
304
130,282
34,279
39,262
3.3
3.3
21.0
24.4
10.7
9.2
1.8
1.5
14.4
14.7
-
-
IDBI Bank
Neutral
55
-
10,507
9,625
10,455
1.8
1.8
8.5
14.2
6.5
3.9
0.4
0.4
5.9
9.3
-
-
Indian Bank
Neutral
89
-
4,263
6,160
6,858
2.5
2.5
24.5
29.8
3.6
3.0
0.3
0.3
7.7
8.6
-
-
LIC Housing Finance
Buy
460
592
23,194
3,101
3,745
2.5
2.5
33.0
40.2
13.9
11.4
2.6
2.2
19.7
20.5
-
-
Oriental Bank
Neutral
104
-
3,132
7,643
8,373
2.4
2.4
37.2
45.4
2.8
2.3
0.3
0.2
8.2
9.4
-
-
Punjab Natl.Bank
Neutral
88
-
17,201
23,638
26,557
2.8
2.8
17.9
27.2
4.9
3.2
0.5
0.4
8.5
12.0
-
-
South Ind.Bank
Neutral
18
-
2,424
1,965
2,185
2.5
2.5
2.5
3.3
7.2
5.4
0.7
0.6
9.5
11.7
-
-
St Bk of India
Buy
174
237
134,839
82,520
93,299
2.7
2.8
20.0
24.5
8.7
7.1
0.9
0.8
11.5
12.8
-
-
Union Bank
Neutral
111
-
7,655
12,646
14,129
2.3
2.4
31.0
39.1
3.6
2.9
0.4
0.3
9.8
11.4
-
-
Vijaya Bank
Neutral
30
-
2,543
3,536
3,827
1.9
1.9
5.5
6.7
5.4
4.5
0.4
0.4
7.8
8.8
-
-
Yes Bank
Buy
645
825
27,043
7,190
9,011
3.2
3.3
58.2
69.7
11.1
9.3
2.0
1.7
19.2
19.6
-
-
FMCG
Asian Paints
Neutral
839
-
80,510
16,553
19,160
16.0
16.2
17.7
21.5
47.5
39.0
12.6
11.3
29.4
31.2
4.7
4.1
Britannia
Neutral
2,678
-
32,133
8,065
9,395
9.6
10.2
47.2
65.5
56.7
40.9
18.9
17.8
38.3
41.2
3.8
3.3
Colgate
Neutral
916
-
24,902
4,836
5,490
19.5
19.7
48.5
53.2
18.9
17.2
13.8
12.1
99.8
97.5
5.0
4.4
Dabur India
Accumulate
249
267
43,803
9,370
10,265
17.1
17.2
7.3
8.1
34.0
30.7
10.2
8.3
33.7
30.6
4.6
4.2
GlaxoSmith Con*
Accumulate
5,762
6,118
24,231
4,919
5,742
17.2
17.4
168.3
191.2
34.2
30.1
9.7
8.3
28.8
28.9
4.5
3.8
Godrej Consumer
Neutral
1,190
-
40,539
10,168
12,886
16.1
16.1
32.1
38.4
37.1
31.0
7.5
7.0
19.7
21.0
4.1
3.2
Stock Watch
January 21, 2016
Company Name
Reco
CMP
Target
Mkt Cap
Sales ( Čcr )
OPM(%)
EPS (Č)
PER(x)
P/BV(x)
RoE(%)
EV/Sales(x)
(Č)
Price ( Č)
( Č cr )
FY16E FY17E
FY16E
FY17E
FY16E
FY17E
FY16E
FY17E
FY16E
FY17E
FY16E
FY17E
FY16E
FY17E
FMCG
HUL
Neutral
797
-
172,352
34,940
38,957
17.5
17.7
20.8
24.7
38.3
32.3
42.6
34.0
110.5
114.2
4.7
4.2
ITC
Buy
309
382
248,374
41,068
45,068
37.8
37.4
13.9
15.9
22.2
19.4
7.4
6.6
34.1
33.8
5.7
5.1
Marico
Neutral
225
-
29,087
6,551
7,766
15.7
16.0
10.4
12.5
21.7
18.0
6.3
5.2
33.2
32.4
4.4
3.7
Nestle*
Buy
5,471
6,646
52,750
11,291
12,847
22.2
22.3
158.9
184.6
34.4
29.6
18.0
16.2
55.0
57.3
4.5
3.9
Tata Global
Buy
123
144
7,734
8,635
9,072
9.8
9.9
6.5
7.6
18.9
16.1
1.9
1.8
6.8
7.4
0.8
0.8
IT
HCL Tech^
Buy
839
1,132
118,171
42,038
47,503
23.2
23.5
55.8
62.9
15.0
13.3
3.5
2.7
23.0
19.8
2.4
1.9
Infosys
Buy
1,122
1,347
257,637
61,850
69,981
27.5
27.5
59.4
65.7
18.9
17.1
4.0
3.4
21.2
20.1
3.4
2.9
TCS
Buy
2,278
2,854
448,785
108,487
122,590
28.3
28.5
122.8
138.4
18.6
16.5
7.1
6.4
38.0
38.9
3.7
3.3
Tech Mahindra
Buy
507
646
49,043
25,566
28,890
16.0
17.0
26.3
31.9
19.3
15.9
3.5
3.0
17.9
18.6
1.7
1.4
Wipro
Buy
542
719
133,937
50,808
58,713
23.7
23.8
37.3
42.3
14.5
12.8
2.8
2.5
19.0
17.9
2.2
1.7
Media
D B Corp
Buy
302
356
5,549
2,241
2,495
27.8
27.9
21.8
25.6
13.9
11.8
3.6
3.2
26.7
28.5
2.4
2.2
HT Media
Neutral
80
-
1,868
2,495
2,603
11.2
11.2
7.3
8.6
11.0
9.3
0.9
0.8
7.4
8.1
0.3
0.2
Jagran Prakashan
Buy
160
189
5,219
2,170
2,355
27.2
26.2
8.9
9.9
17.9
16.1
3.8
3.3
20.9
20.5
2.3
2.1
Sun TV Network
Neutral
340
-
13,385
2,779
3,196
70.2
70.5
22.8
27.3
14.9
12.4
3.7
3.3
26.7
28.3
4.6
4.0
Hindustan Media
Neutral
270
-
1,982
920
1,031
20.0
20.0
19.2
20.9
14.1
12.9
2.3
2.0
16.4
15.3
1.7
1.5
Ventures
Metals & Mining
Coal India
Buy
298
380
188,196
76,167
84,130
19.9
22.3
22.4
25.8
13.3
11.5
4.8
4.7
35.5
41.0
1.8
1.6
Hind. Zinc
Buy
139
175
58,690
14,641
14,026
50.4
50.4
17.7
16.0
7.9
8.7
1.2
1.1
16.2
13.2
1.6
1.5
Hindalco
Neutral
68
-
13,980
104,356
111,186
8.7
9.5
6.7
11.1
10.1
6.1
0.4
0.4
3.5
5.9
0.7
0.6
JSW Steel
Neutral
1,019
-
24,631
42,308
45,147
16.4
20.7
(10.3)
49.5
20.6
1.1
1.1
(1.0)
5.6
1.6
1.5
NMDC
Neutral
81
-
32,094
8,237
10,893
46.6
44.5
10.0
11.7
8.1
6.9
0.9
0.8
12.5
13.0
3.7
2.8
SAIL
Neutral
41
-
17,078
45,915
53,954
7.2
10.5
1.5
4.4
27.5
9.5
0.4
0.4
2.3
4.1
1.0
0.9
Vedanta
Neutral
64
-
18,944
71,445
81,910
26.2
26.3
12.9
19.2
5.0
3.3
0.3
0.3
7.2
8.9
0.7
0.5
Tata Steel
Neutral
232
-
22,503
126,760
137,307
8.9
11.3
6.4
23.1
36.4
10.0
0.7
0.7
2.0
7.1
0.8
0.7
Oil & Gas
Cairn India
Neutral
111
-
20,792
11,323
12,490
49.4
51.0
20.7
20.7
5.4
5.4
0.3
0.3
6.4
6.1
0.9
0.3
GAIL
Neutral
340
-
43,065
64,856
70,933
9.1
9.6
24.0
28.9
14.2
11.8
1.2
1.1
8.8
9.6
0.9
0.8
ONGC
Neutral
213
-
182,317
154,564
167,321
36.8
37.4
28.6
32.5
7.5
6.6
1.0
0.9
12.7
13.5
1.4
1.3
Petronet LNG
Neutral
243
-
18,199
29,691
31,188
5.8
6.2
12.8
13.4
19.0
18.1
2.8
2.5
15.8
14.8
0.7
0.6
Indian Oil Corp
Accumulate
403
455
97,895
359,607
402,760
5.9
6.1
42.5
48.7
9.5
8.3
1.3
1.1
14.1
14.4
0.4
0.3
Reliance Industries
Accumulate
1,004
1,150
325,330
304,775
344,392
12.6
13.4
91.3
102.6
11.0
9.8
1.2
1.1
11.8
12.0
1.0
0.8
Stock Watch
January 21, 2016
Company Name
Reco
CMP
Target
Mkt Cap
Sales ( Čcr )
OPM(%)
EPS (Č)
PER(x)
P/BV(x)
RoE(%)
EV/Sales(x)
(Č)
Price ( Č)
( Č cr )
FY16E FY17E
FY16E
FY17E
FY16E
FY17E
FY16E
FY17E
FY16E
FY17E
FY16E
FY17E
FY16E
FY17E
Pharmaceuticals
Alembic Pharma
Neutral
588
-
11,076
2,658
3,112
24.1
20.2
24.6
23.9
23.9
24.6
8.6
6.6
42.5
30.2
4.2
3.5
Aurobindo Pharma
Accumulate
801
856
46,764
14,923
17,162
22.0
23.0
35.7
42.8
22.4
18.7
6.6
5.0
34.0
30.2
3.5
3.0
Aventis*
Neutral
4,144
-
9,544
2,082
2,371
17.4
20.8
118.2
151.5
35.1
27.4
5.1
4.1
19.9
25.5
4.3
3.5
Cadila Healthcare
Buy
301
352
30,845
10,224
11,840
21.0
22.0
14.6
17.6
20.6
17.1
5.7
4.4
30.8
29.0
3.1
2.6
Cipla
Accumulate
594
636
47,672
14,211
16,611
20.6
19.0
27.0
28.9
22.0
20.5
3.7
3.2
18.4
16.8
3.3
2.8
Dr Reddy's
Buy
2,868
3,933
48,915
16,838
19,575
25.0
23.1
167.5
178.8
17.1
16.0
3.6
3.0
23.1
20.4
2.8
2.4
Dishman Pharma
Neutral
295
-
2,377
1,733
1,906
21.5
21.5
17.0
19.9
17.3
14.8
1.7
1.6
10.5
11.2
1.9
1.6
GSK Pharma*
Neutral
3,143
-
26,618
2,870
3,158
20.0
22.1
59.5
68.3
52.8
46.0
15.6
16.0
28.5
34.3
8.8
8.0
Indoco Remedies
Neutral
304
-
2,803
1,033
1,199
15.9
18.2
9.4
13.6
32.4
22.4
4.8
4.1
15.7
19.7
2.8
2.4
Ipca labs
Buy
639
900
8,058
3,363
3,909
12.9
18.6
13.4
28.0
47.7
22.8
3.4
3.0
7.4
14.0
2.7
2.3
Lupin
Neutral
1,692
-
76,204
13,092
16,561
25.0
27.0
50.4
68.3
33.6
24.8
6.9
5.5
22.8
24.7
5.5
4.3
Sun Pharma
Buy
794
950
191,048
28,163
32,610
25.8
30.7
17.4
26.9
45.6
29.5
4.3
3.8
13.0
16.6
6.3
5.2
Power
Tata Power
Neutral
62
-
16,701
35,923
37,402
22.6
22.8
4.1
5.2
15.2
12.0
1.2
1.1
7.5
9.3
1.4
1.3
NTPC
Buy
132
157
109,005
87,064
98,846
23.5
23.5
11.7
13.2
11.3
10.0
1.3
1.2
11.4
12.1
2.3
2.0
Power Grid
Buy
135
170
70,470
20,702
23,361
86.7
86.4
12.1
13.2
11.2
10.2
1.6
1.5
15.6
15.1
8.3
7.8
Telecom
Bharti Airtel
Neutral
309
-
123,680
101,748
109,191
32.1
31.7
12.0
12.5
25.8
24.8
1.8
1.7
6.9
6.7
1.9
1.7
Idea Cellular
Neutral
117
-
42,286
34,282
36,941
32.0
31.5
5.9
6.2
19.9
18.9
1.8
1.7
9.9
9.3
1.8
1.7
zOthers
Abbott India
Neutral
5,106
-
10,850
2,715
3,153
14.5
14.1
134.3
152.2
38.0
33.5
9.5
7.8
27.4
25.6
3.7
3.1
Bajaj Electricals
Buy
176
290
1,772
4,719
5,287
5.2
5.8
8.6
12.7
20.5
13.9
2.3
2.1
11.4
14.8
0.4
0.3
Finolex Cables
Neutral
212
-
3,238
2,520
2,883
12.2
12.0
12.7
14.2
16.7
14.9
2.3
2.0
13.6
13.5
1.0
0.9
Goodyear India*
Buy
486
622
1,120
1,888
1,680
12.1
11.9
62.2
56.6
7.8
8.6
1.8
1.6
25.9
19.7
0.4
0.4
Hitachi
Neutral
1,073
-
2,917
1,779
2,081
7.8
8.8
21.8
33.4
49.2
32.1
7.9
6.4
17.4
22.1
1.7
1.4
Jyothy Laboratories
Neutral
274
-
4,969
1,620
1,847
11.5
11.5
7.3
8.5
37.6
32.4
4.9
4.5
13.3
14.4
2.9
2.5
MRF
Buy
34,977
45,575
14,834
20,316
14,488
21.4
21.1
5,488.0
3,798.0
6.4
9.2
2.2
1.8
41.1
21.2
0.7
0.9
Page Industries
Neutral
12,460
-
13,897
1,929
2,450
19.8
20.1
229.9
299.0
54.2
41.7
23.9
16.6
52.1
47.1
7.2
5.7
Relaxo Footwears
Neutral
429
-
5,149
1,767
2,152
12.3
12.5
19.3
25.1
22.3
17.1
5.5
4.2
27.7
27.8
3.0
2.4
Siyaram Silk Mills
Buy
1,049
1,354
983
1,636
1,815
11.5
11.5
89.9
104.1
11.7
10.1
1.9
1.7
17.9
17.8
0.8
0.7
Styrolution ABS India*
Accumulate
655
698
1,152
1,271
1,440
8.6
9.2
32.0
41.1
20.5
16.0
2.1
1.9
10.7
12.4
0.9
0.8
TVS Srichakra
Buy
2,365
3,240
1,811
2,101
2,338
15.7
15.0
248.6
270.0
9.5
8.8
4.2
3.0
43.6
34.0
0.9
0.8
Stock Watch
January 21, 2016
Company Name
Reco
CMP
Target
Mkt Cap
Sales ( Čcr )
OPM(%)
EPS (Č)
PER(x)
P/BV(x)
RoE(%)
EV/Sales(x)
(Č)
Price ( Č)
( Č cr )
FY16E
FY17E
FY16E
FY17E
FY16E
FY17E
FY16E
FY17E
FY16E
FY17E
FY16E
FY17E
FY16E
FY17E
zOthers
HSIL
Buy
261
302
1,886
2,123
2,384
16.1
16.5
15.0
18.9
17.3
13.8
1.4
1.3
8.0
9.4
1.2
1.1
Kirloskar Engines India
Neutral
235
-
3,399
2,471
2,826
8.8
10.4
9.1
13.3
25.8
17.6
2.5
2.3
9.7
13.4
1.0
0.9
Ltd
M M Forgings
Buy
471
614
569
511
615
21.7
21.6
43.1
55.8
10.9
8.4
2.0
1.6
19.9
21.2
1.3
1.0
Banco Products (India) Neutral
122
-
869
1,208
1,353
11.0
12.3
10.8
14.5
11.3
8.4
1.3
1.2
11.9
14.5
0.7
0.6
Competent Automobiles Neutral
137
-
84
1,040
1,137
3.2
3.1
25.7
28.0
5.3
4.9
0.8
0.7
15.0
14.3
0.1
0.1
Nilkamal
Neutral
1,144
-
1,708
1,910
2,083
10.5
10.3
63.3
69.2
18.1
16.5
3.0
2.5
17.6
16.5
1.0
0.8
Visaka Industries
Buy
103
144
163
1,086
1,197
9.9
10.3
21.5
28.8
4.8
3.6
0.5
0.4
9.6
11.6
0.4
0.3
Transport Corporation of
Neutral
247
-
1,877
2,830
3,350
8.8
9.0
14.4
18.3
17.2
13.5
2.6
2.3
15.4
17.1
0.8
0.7
India
Elecon Engineering
Buy
63
85
685
1,369
1,533
13.7
14.9
3.3
6.1
18.9
10.4
1.2
1.1
6.6
11.4
0.8
0.7
Surya Roshni
Buy
139
201
607
2,992
3,223
8.1
8.4
14.7
18.3
9.4
7.6
0.9
0.8
9.7
11.0
0.5
0.4
MT Educare
Neutral
154
-
613
286
366
18.3
17.7
7.7
9.4
19.9
16.4
4.2
3.7
20.2
21.1
2.0
1.6
Radico Khaitan
Buy
107
156
1,426
1,565
1,687
12.2
13.0
5.7
7.1
18.8
15.1
1.6
1.5
8.3
9.6
1.4
1.3
Garware Wall Ropes
Buy
340
473
744
862
974
11.2
11.2
24.9
29.6
13.7
11.5
2.1
1.8
15.1
15.4
0.9
0.7
Wonderla Holidays
Neutral
371
-
2,096
206
308
44.0
43.6
9.0
12.9
41.2
28.8
5.6
5.1
13.7
17.8
10.1
6.7
Linc Pen & Plastics
Neutral
205
-
303
340
371
8.3
8.9
10.8
13.2
19.0
15.5
3.0
2.7
16.0
17.1
0.9
0.8
The Byke Hospitality
Neutral
149
-
595
222
287
20.5
20.5
5.6
7.6
26.3
19.7
5.0
4.1
18.9
20.8
2.7
2.1
Interglobe Aviation
Neutral
1,202
-
43,318
17,022
21,122
20.7
14.5
63.9
53.7
18.8
22.4
28.2
23.1
149.9
103.2
2.6
2.1
Coffee Day Enterprises
Neutral
244
-
5,019
2,692
2,964
17.0
18.6
-
4.7
-
51.4
3.0
2.8
0.2
5.5
2.3
2.1
Ltd
Navneet Education
Neutral
81
-
1,940
998
1,062
24.1
24.0
5.8
6.1
14.2
13.4
3.1
2.8
22.0
20.6
2.0
1.9
Navkar Corporation
Buy
197
265
2,812
365
436
38.3
37.5
5.6
5.9
35.0
33.6
2.2
2.1
6.3
6.1
8.5
7.3
Source: Company, Angel Research; Note: *December year end; #September year end; &October year end; Price as on January 20, 2016
Market Outlook
January 21, 2016
Research Team Tel: 022 - 39357800
DISCLAIMER
Angel Broking Private Limited (hereinafter referred to as “Angel”) is a registered Member of National Stock Exchange of India Limited,
Bombay Stock Exchange Limited and Metropolitian Stock Exchange of India Limited. It is also registered as a Depository Participant with
CDSL and Portfolio Manager with SEBI. It also has registration with AMFI as a Mutual Fund Distributor. Angel Broking Private Limited is a
registered entity with SEBI for Research Analyst in terms of SEBI (Research Analyst) Regulations, 2014 vide registration number
INH000000164. Angel or its associates has not been debarred/ suspended by SEBI or any other regulatory authority for accessing
/dealing in securities Market. Angel or its associates including its relatives/analyst do not hold any financial interest/beneficial ownership
of more than 1% in the company covered by Analyst. Angel or its associates/analyst has not received any compensation / managed or co
-managed public offering of securities of the company covered by Analyst during the past twelve months. Angel/analyst has not served as
an officer, director or employee of company covered by Analyst and has not been engaged in market making activity of the company
covered by Analyst.
This document is solely for the personal information of the recipient, and must not be singularly used as the basis of any investment
decision. Nothing in this document should be construed as investment or financial advice. Each recipient of this document should make
such investigations as they deem necessary to arrive at an independent evaluation of an investment in the securities of the companies
referred to in this document (including the merits and risks involved), and should consult their own advisors to determine the merits and
risks of such an investment.
Reports based on technical and derivative analysis center on studying charts of a stock's price movement, outstanding positions and
trading volume, as opposed to focusing on a company's fundamentals and, as such, may not match with a report on a company's
fundamentals.
The information in this document has been printed on the basis of publicly available information, internal data and other reliable sources
believed to be true, but we do not represent that it is accurate or complete and it should not be relied on as such, as this document is for
general guidance only. Angel Broking Pvt. Limited or any of its affiliates/ group companies shall not be in any way responsible for any
loss or damage that may arise to any person from any inadvertent error in the information contained in this report. Angel Broking Pvt.
Limited has not independently verified all the information contained within this document. Accordingly, we cannot testify, nor make any
representation or warranty, express or implied, to the accuracy, contents or data contained within this document. While Angel Broking
Pvt. Limited endeavors to update on a reasonable basis the information discussed in this material, there may be regulatory, compliance,
or other reasons that prevent us from doing so.
This document is being supplied to you solely for your information, and its contents, information or data may not be reproduced,
redistributed or passed on, directly or indirectly.
Neither Angel Broking Pvt. Limited, nor its directors, employees or affiliates shall be liable for any loss or damage that may arise from or
in connection with the use of this information.
Note: Please refer to the important ‘Stock Holding Disclosure' report on the Angel website (Research Section). Also, please refer to the
latest update on respective stocks for the disclosure status in respect of those stocks. Angel Broking Pvt. Limited and its affiliates may have
investment positions in the stocks recommended in this report.