Market Outlook
June 20, 2016
Market Cues
Domestic Indices
Chg (%)
(Pts)
(Close)
Indian markets are expected to open in red tracking SGX Nifty.
BSE Sensex
0.4
100
26,626
Nifty
0.4
29
8,170
U.S. Markets closed lower Friday, with health care and tech stocks lagging, amid
continued uncertainty ahead of next week's scheduled Brexit vote.
Mid Cap
(0.0)
(6)
11,359
Small Cap
0.3
34
11,435
European markets rose on Friday, helped by a rebound in the battered banking
Bankex
0.0
2
20,244
sector, with investors attributing the rebound partly to the suspension of
campaigning for Britain's EU referendum following the shooting of a lawmaker.
Global Indices
Chg (%)
(Pts)
(Close)
Indian markets eked out modest gains on Friday as news of a pro-EU British
lawmaker's death brought the Brexit campaign to a standstill and spurred
Dow Jones
(0.3)
(58)
17,675
speculation that the incident may influence public opinion on the referendum
Nasdaq
(0.9)
(45)
4,800
scheduled to take place next Thursday. Gains in rupee on data showing narrowing
FTSE
1.2
71
6,021
current account deficit also offered some support.
Nikkei
1.1
166
15,600
News Analysis
Hang Seng
0.7
132
20,170
Centum Electronics aquires 51% stake of France's Adetel Group
Shanghai Com
0.4
12
2,885
Auto component industry to grow in double digits this fiscal year
Detailed analysis on Pg2
Advances / Declines
BSE
NSE
Advances
1,259
749
Investor’s Ready Reckoner
Declines
1,344
800
Key Domestic & Global Indicators
Unchanged
180
82
Stock Watch: Latest investment recommendations on 150+ stocks
Refer Pg4 onwards
Volumes (` Cr)
Top Picks
BSE
2,830
CMP
Target
Upside
Company
Sector
Rating
(`)
(`)
(%)
NSE
17,711
Amara Raja
Auto/Auto Ancillary
Buy
865
1,076
24.4
HCL Tech
IT
Buy
753
1,000
32.9
Net Inflows (` Cr)
Net
Mtd
Ytd
LIC Housing
Financials
Buy
475
592
24.7
FII
(81)
4,375
18,743
Bharat Electronics
Capital Goods
Accumulate
1,257
1,414
12.5
MFs
373
(5)
9,426
Navkar Corporation Others
Buy
198
265
33.9
More Top Picks on Pg3
Top Gainers
Price (`)
Chg (%)
Key Upcoming Events
Unitech
6
15.8
Previous
Consensus
Date
Region
Event Description
Reading
Expectations
Denabank
37
12.9
June 22 US
Existing Home sales
5.5
5.6
Centralbk
105
12.7
June 22 Euro Zone
Euro Zone Consumer Confidence
(7.0)
--
Mfsl
473
10.3
June 23 US
Intial Jobless claims
277.0
--
Sreinfra
65
7.7
June 23 Germany
PMI Manufacturing
52.1
52.0
6.(
More Events on Pg4
Top Losers
Price (`)
Chg (%)
Renuka
17
(4.6)
Polaris
184
(4.1)
Tatapower
74
(3.4)
Ceatltd
828
(3.3)
Iifl
208
(2.8)
As on June 17, 2016
Market Outlook
June 20, 2016
Centum Electronics aquires 51% stake of France's Adetel Group
Centum Electronics announced acquisition of controlling stake in France's Adetel
Group. According to company, Centum Electronics will hold 51% controlling stake
in Adetel Group, with an option to increase it further at a future date. This
acquisition will help the company to consolidate and grow in these geographies
where Adetel operates. The company however did not disclose the size of the deal.
The company can now accelerate growth, fill product portfolio gaps, improve the
company’s market position, benefit from the use of even more advanced
technology and of course, establish a wider, more international presence. Adetel
has operations in the US, Europe and Canada.
Auto component industry to grow in double digits this fiscal year
The domestic auto component industry is expected to grow in early double digits
on back of recovery in vehicles sales in the ongoing financial year. Despite a
challenging year, the auto component industry has registered a satisfactory growth
of 8.8% in FY16. With signs of recovery in the auto market in the country and
prospects of a better monsoon, the component sector in expected to witness
growth in early double digits this year. The domestic auto component industry
grew by 8.8% to $ 39 billion in the last financial year. Volatility in global markets,
however, hit exports which dropped by 3.7% to $ 10.8 billion. Imports grew at a
faster pace by 9.3% to $13.8 billion. Investments in the auto component sector
during 2014-15 stood at around $ 0.44-0.66 billion.
Economic and Political News
Odisha plans advance skill training institutes with `1,000cr outlay
PM to launch work on Smart City projects on June 25: Venkaiah Naidu
Sugar exports unviable after imposition of 20% duty: ISMA
Corporate News
Srei Infra completes share swap deal with BNP Paribas
US court releases JSW Steel from further liability to MM Steel
Axis Bank, KBank of Thailand ink pact for trade, investment
Market Outlook
June 20, 2016
Top Picks ★★★★★
Large Cap
Market Cap
CMP
Target
Upside
Company
Rationale
(` Cr)
(`)
(`)
(%)
To outpace battery industry growth due to better technological
Amara Raja Batteries
14,774
865
1,076
24.4
products leading to market share gains in both the automotive
OEM and replacement segments.
Uptick in defense capex by government, coupled with BELs
Bharat Electronics
30,178
1,257
1,414
12.5
strong market positioning, indicate good times ahead for BEL.
HCL Tech
1,06,166
753
1,000
32.9
Stock is trading at attractive valuations & factors all bad news.
Strong visibility for a robust 20% earnings trajectory, coupled
HDFC Bank
2,96,011
1,169
1,262
8.0
with high quality of earnings on account of high quality retail
business and strategic focus on highly rated corporates.
Back on the growth trend, expect a long term growth of 14% to
Infosys
2,70,649
1,178
1,374
16.6
be a US$20bn in FY2020.
Continues to grow its retail loan book at healthy pace with
LIC Housing Finance
23,951
475
592
24.7
improvement in asset quality. Expect LICHF to post a healthy
loan book which is likely to reflect in a strong earnings growth.
Huge bid pipeline of re-development works at Delhi and other
NBCC
11,106
185
220
18.9
State Governments and opportunity from Smart City, positions
NBCC to report strong growth, going forward.
Strong market positioning within the domestic AC markets to
Voltas
10,583
320
407
27.2
continue, EMP business set to revive
Source: Company, Angel Research
Mid Cap
Market Cap
CMP
Target
Upside
Company
Rationale
(` Cr)
(`)
(`)
(%)
Among the top 4 players in the consumer durables segment.
Bajaj Electricals
2,314
229
268
17.1
Improved profitability backed by turn around in E&P segment.
Strong order book lends earnings visibility.
Favourable outlook for AC industry to augur well for Cooling
Blue Star
3,873
431
495
15.0
products business. EMPPAC division's profitability to improve
once operating environment turns around.
With a focus on the low and medium income (LMI) consumer
Dewan Housing
5,890
202
270
33.8
segment, the company has increased its presence in tier-II & III
cities where the growth opportunity is immense.
Strong loan growth backed by diversified loan portfolio and
Equitas Holdings
5,837
174
235
35.0
adequate CAR. ROE & ROA likely to remain decent as risk of
dilution remains low. Attractive valuations considering growth.
Commencement of new projects, downtrend in the interest rate
IL&FS Transport
2,502
76
93
22.3
cycle, to lead to stock re-rating
Economic recovery to have favourable impact on advertising &
circulation revenue growth. Further, the acquisition of a radio
Jagran Prakashan
5,549
170
205
20.8
business (Radio City) would also boost the company's revenue
growth.
Speedier execution and speedier sales, strong revenue visibility
Mahindra Lifespace
1,890
461
554
20.3
in short-to-long run, attractive valuations
Massive capacity expansion along with rail advantage at ICD
Navkar Corporation
2,822
198
265
33.9
as well CFS augurs well for the company
Earnings boost on back of stable material prices and
Radico Khaitan
1,177
89
125
41.2
favourable pricing environment. Valuation discount to peers
provides additional comfort
Strong brands and distribution network would boost growth
Siyaram Silk Mills
960
1,024
1,347
31.5
going ahead. Stock currently trades at an inexpensive
valuation.
Source: Company, Angel Research
Market Outlook
June 20, 2016
Key Upcoming Events
Global economic events release calendar
Bloomberg Data
Date
Time
Country
Event Description
Unit
Period
Last Reported
Estimated
Jun 22, 2016
7:30 PM
US
Existing home sales
Million
May
5.45
5.55
7:30 PM Euro Zone
Euro-Zone Consumer Confidence
Value
Jun A
-7.00
(7.00)
Jun 23, 2016
6:00 PM
US
Initial Jobless claims
Thousands Jun 18
277.00
7:30 PM
US
New home sales
Thousands
May
619.00
565.00
1:00 PM Germany
PMI Services
Value
Jun P
55.20
55.00
1:00 PM Germany
PMI Manufacturing
Value
Jun P
52.10
52.00
June 28, 2016
7:30 PM
US
Consumer Confidence S.A./ 1985=100
Jun
92.60
6:00 PM
US
GDP Qoq (Annualised)
% Change
1Q T
0.80
June 30, 2016
1:25 PM Germany
Unemployment change (000's)
Thousands
Jun
-11.00
2:00 PM
UK
GDP (YoY)
% Change
1Q F
2.10
Jul 01, 2016
2:00 PM
UK
PMI Manufacturing
Value
Jun
50.10
6:30 AM
China
PMI Manufacturing
Value
Jun
50.10
Jul 07, 2016
2:00 PM
UK
Industrial Production (YoY)
% Change
May
1.60
Jul 08, 2016
India
Imports YoY%
% Change
Jun
(13.20)
India
Exports YoY%
% Change
Jun
(0.80)
Source: Bloomberg, Angel Research
Market Outlook
June 20, 2016
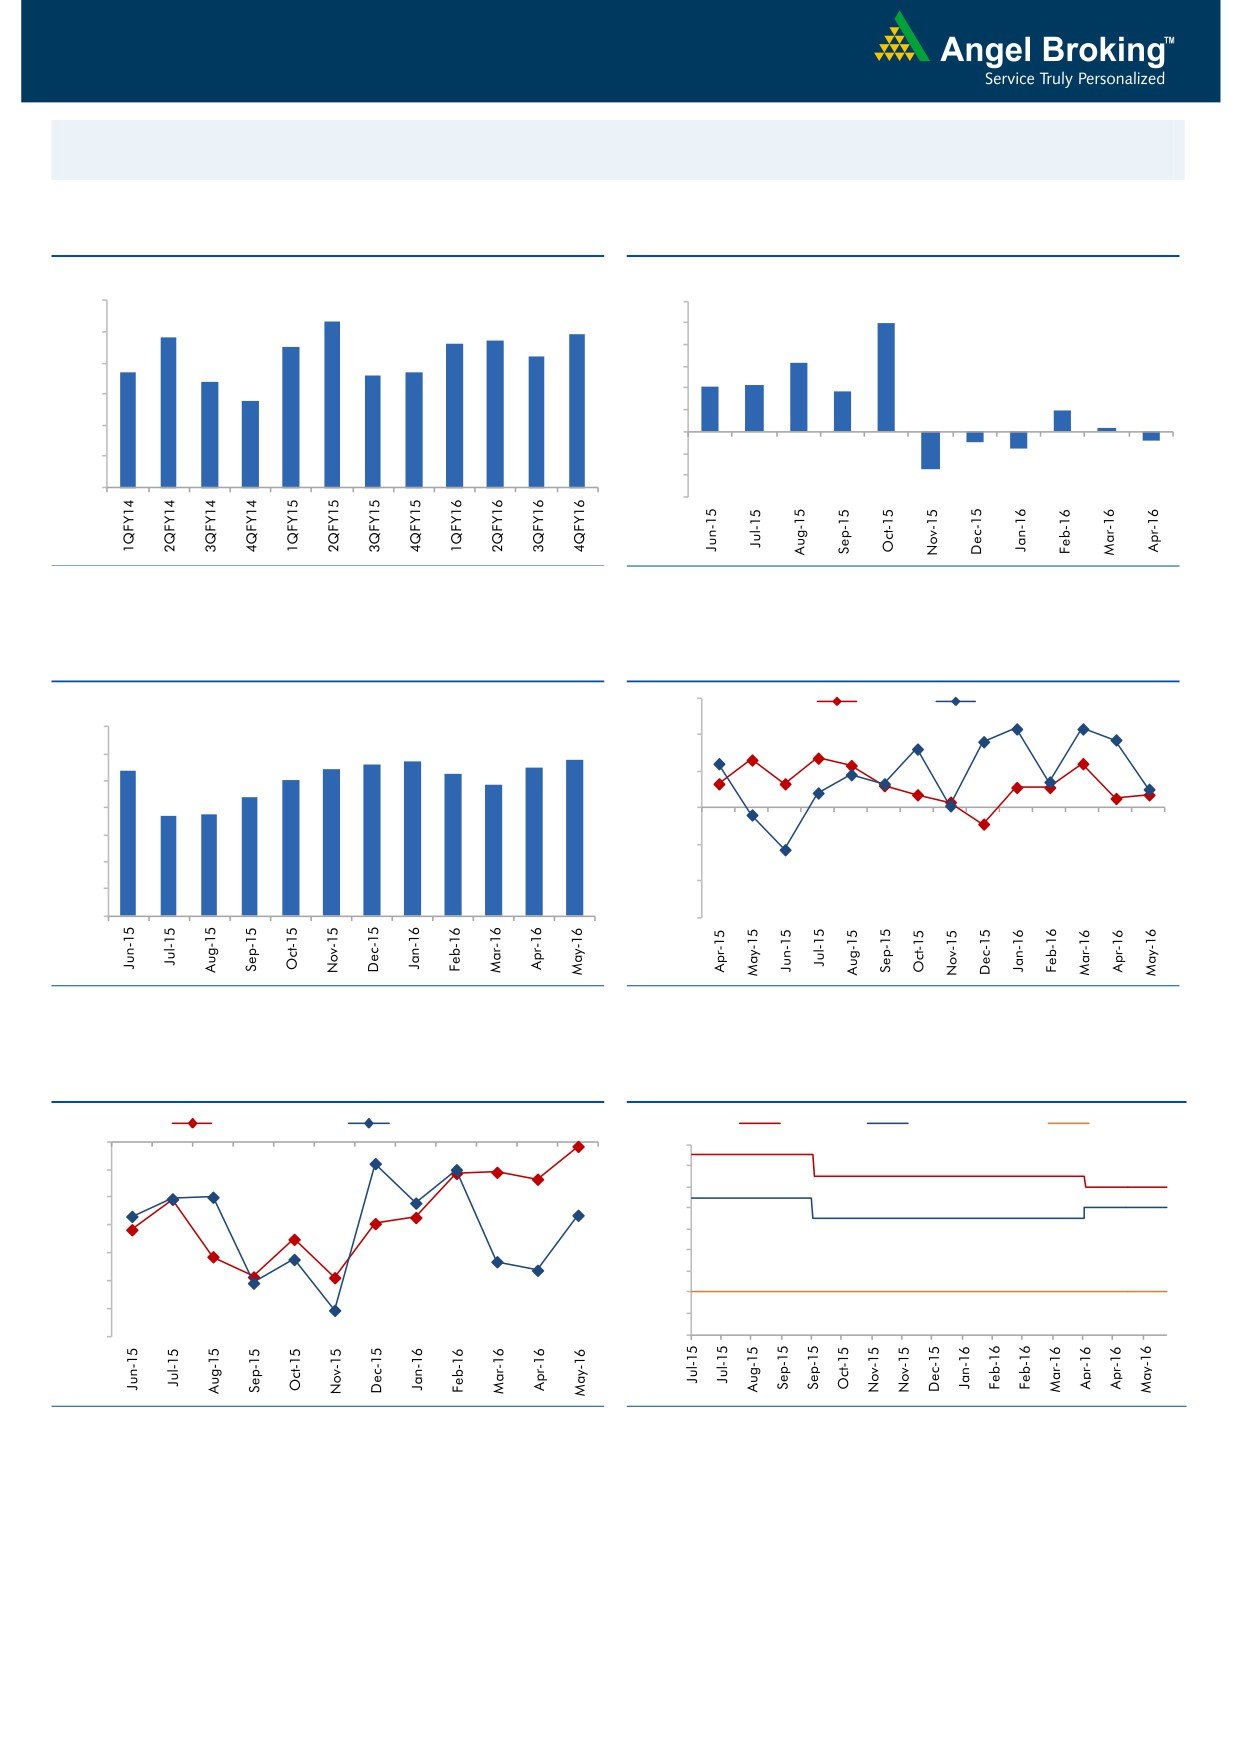
Macro watch
Exhibit 1: Quarterly GDP trends
Exhibit 2: IIP trends
(%)
(%)
9.0
12.0
8.3
9.9
7.8
7.7
7.9
10.0
8.0
7.5
7.6
7.2
8.0
6.3
6.7
6.6
6.7
7.0
6.4
6.0
4.2
4.3
3.7
5.8
4.0
6.0
2.0
2.0
0.3
5.0
-
4.0
(2.0)
(0.9)
(0.8)
(1.6)
(4.0)
3.0
(3.4)
(6.0)
Source: CSO, Angel Research
Source: MOSPI, Angel Research
Exhibit 3: Monthly CPI inflation trends
Exhibit 4: Manufacturing and services PMI
56.0
Mfg. PMI
Services PMI
(%)
7.0
54.0
5.6
5.7
5.8
5.4
5.4
5.5
6.0
5.3
5.0
4.8
52.0
5.0
4.4
3.7
3.7
4.0
50.0
3.0
48.0
2.0
46.0
1.0
-
44.0
Source: MOSPI, Angel Research
Source: Market, Angel Research; Note: Level above 50 indicates expansion
Exhibit 5: Exports and imports growth trends
Exhibit 6: Key policy rates
(%)
Exports yoy growth
Imports yoy growth
(%)
Repo rate
Reverse Repo rate
CRR
0.0
7.50
(5.0)
7.00
6.50
(10.0)
6.00
(15.0)
5.50
(20.0)
5.00
4.50
(25.0)
4.00
(30.0)
3.50
(35.0)
3.00
Source: Bloomberg, Angel Research
Source: RBI, Angel Research
Market Outlook
June 20, 2016
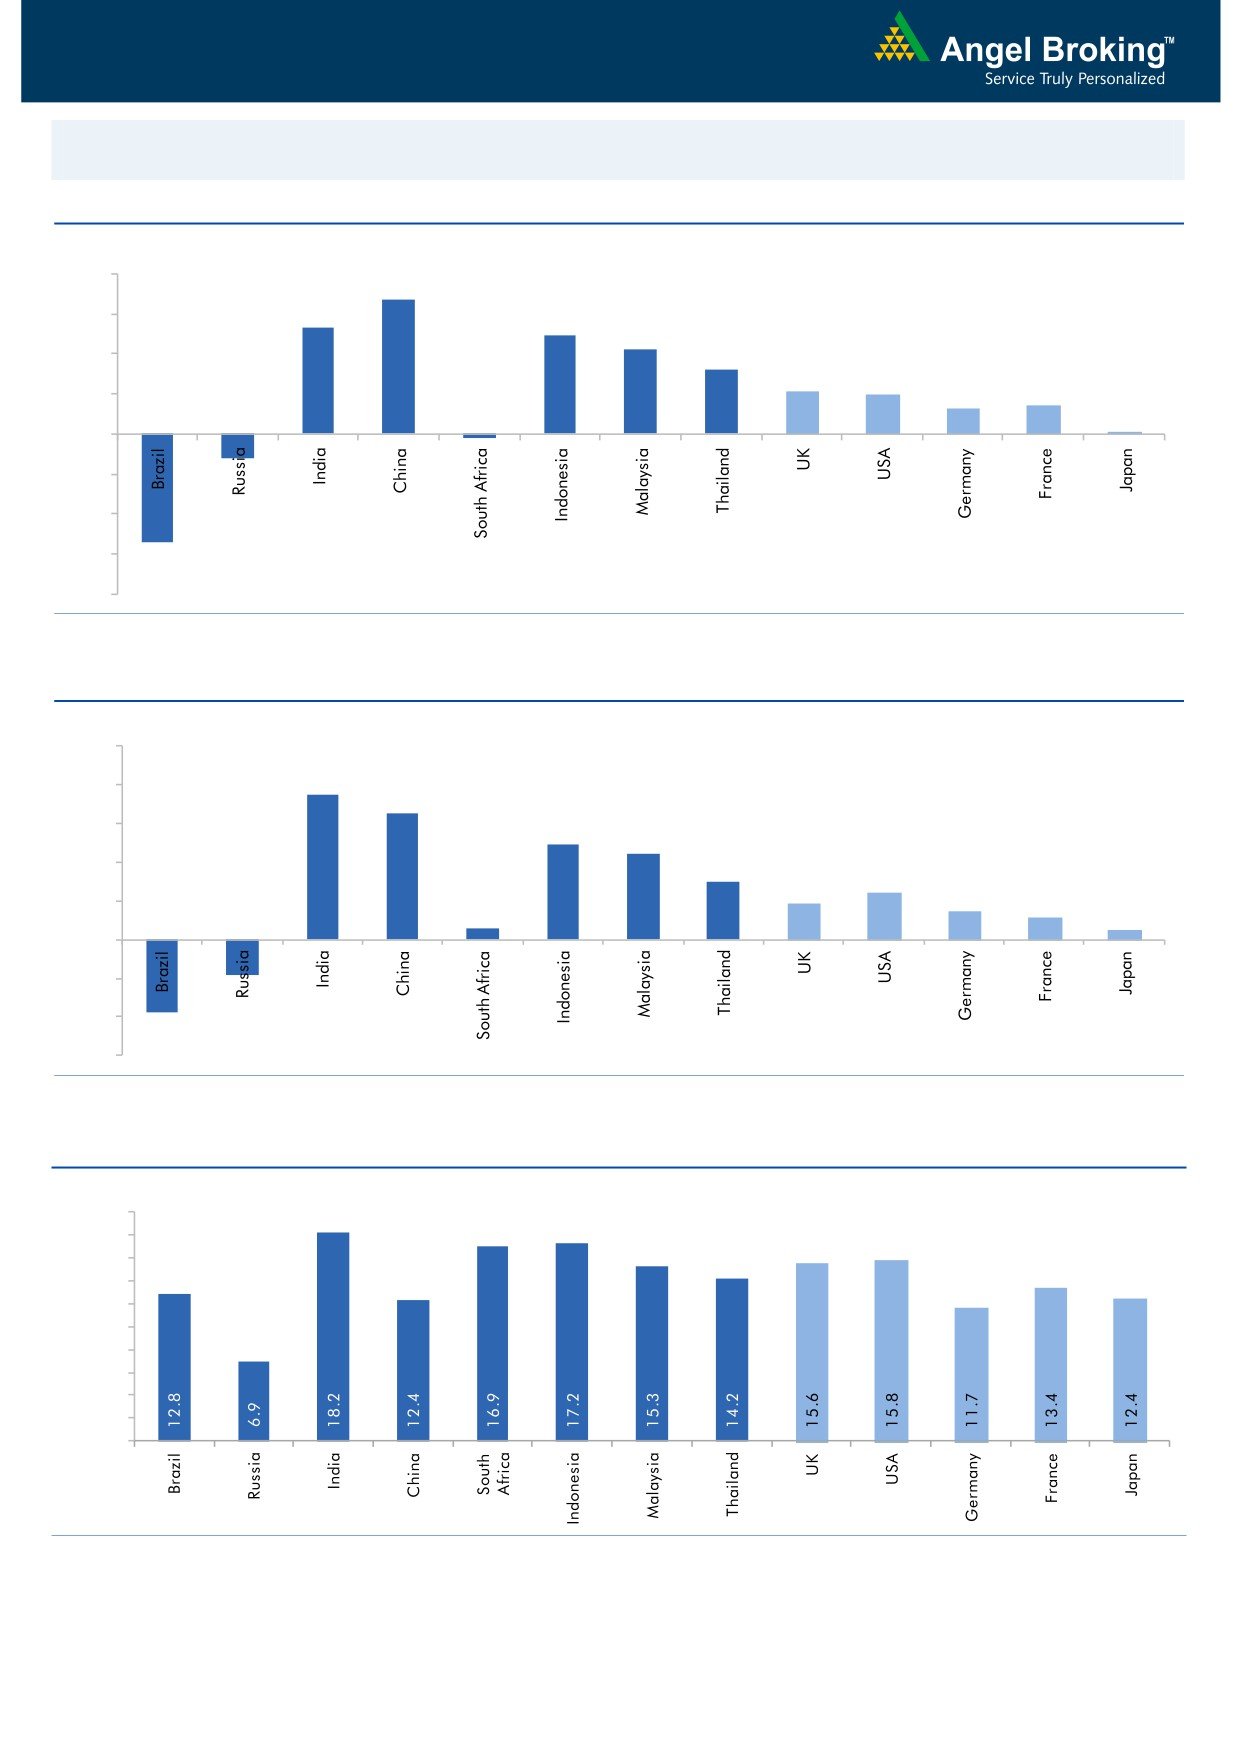
Global watch
Exhibit 1: Latest quarterly GDP Growth (%, yoy) across select developing and developed countries
(%)
8.0
6.7
6.0
5.3
4.9
4.2
4.0
3.2
2.1
2.0
1.3
1.4
2.0
0.1
-
(0.2)
(2.0)
(4.0)
(1.2)
(6.0)
(5.4)
(8.0)
Source: Bloomberg, Angel Research
Exhibit 2: 2016 GDP Growth projection by IMF (%, yoy) across select developing and developed countries
(%)
10.0
7.5
8.0
6.5
6.0
4.9
4.4
4.0
3.0
2.4
1.9
1.5
2.0
1.1
0.6
0.5
(3.8)
(1.8)
-
(2.0)
(4.0)
(6.0)
Source: IMF, Angel Research
Exhibit 3: One year forward P-E ratio across select developing and developed countries
(x)
20.0
18.0
16.0
14.0
12.0
10.0
8.0
6.0
4.0
2.0
-
Source: IMF, Angel Research
Market Outlook
June 20, 2016
Exhibit 4: Relative performance of indices across globe
Returns (%)
Country
Name of index
Closing price
1M
3M
1YR
Brazil
Bovespa
49,534
(5.6)
0.1
(7.4)
Russia
Micex
1,877
(2.8)
(0.2)
11.6
India
Nifty
8,170
3.2
8.4
2.2
China
Shanghai Composite
2,885
1.6
0.5
(42.8)
South Africa
Top 40
46,137
(0.5)
1.1
1.0
Mexico
Mexbol
45,306
(1.8)
0.7
0.5
Indonesia
LQ45
825
1.5
(3.1)
(5.0)
Malaysia
KLCI
1,624
(0.7)
(5.4)
(6.4)
Thailand
SET 50
900
0.5
0.6
(10.1)
USA
Dow Jones
17,675
0.6
2.3
(1.6)
UK
FTSE
6,021
(2.4)
(1.9)
(11.8)
Japan
Nikkei
15,600
(6.3)
(9.5)
(22.4)
Germany
DAX
9,631
(3.5)
(3.9)
(16.7)
France
CAC
4,194
(3.4)
(7.0)
(17.7)
Source: Bloomberg, Angel Research
Stock Watch
June 20, 2016
Company Name
Reco
CMP
Target
Mkt Cap
Sales ( Čcr )
OPM(%)
EPS (Č)
PER(x)
P/BV(x)
RoE(%)
EV/Sales(x)
(Č)
Price ( Č)
( Č cr )
FY16E FY17E
FY16E
FY17E
FY16E
FY17E
FY16E
FY17E
FY16E
FY17E
FY16E
FY17E
FY16E
FY17E
Agri / Agri Chemical
Rallis
Neutral
209
-
4,071
1,612
1,911
13.3
13.3
7.4
9.5
28.3
22.0
4.5
4.1
16.7
18.4
2.6
2.2
United Phosphorus
Buy
567
684
24,319
13,083
15,176
18.5
18.5
31.5
37.4
18.0
15.2
3.6
3.0
21.4
21.4
2.0
1.7
Auto & Auto Ancillary
Ashok Leyland
Accumulate
99
111
28,075
17,995
21,544
11.4
11.6
3.4
4.7
29.0
21.0
5.1
4.7
17.7
22.2
1.5
1.2
Bajaj Auto
Neutral
2,577
-
74,573
22,709
25,860
20.9
20.1
129.0
143.6
20.0
18.0
6.1
5.3
30.7
29.4
2.8
2.4
Bharat Forge
Buy
731
875
17,023
7,351
8,318
19.9
19.7
31.2
36.5
23.4
20.0
4.2
3.5
19.3
19.2
2.5
2.1
Eicher Motors
Accumulate
18,779
20,044
51,006
15,556
16,747
15.5
17.3
464.8
597.5
40.4
31.4
14.8
10.9
36.2
34.3
3.2
2.9
Gabriel India
Accumulate
94
101
1,343
1,415
1,544
8.7
9.0
4.6
5.4
20.3
17.3
3.7
3.3
18.1
18.9
0.9
0.8
Hero Motocorp
Neutral
3,028
-
60,469
28,244
30,532
15.5
15.9
156.7
168.5
19.3
18.0
7.7
6.6
39.9
36.4
2.0
1.8
Jamna Auto Industries Neutral
172
-
1,370
1,281
1,473
11.2
11.5
7.6
9.2
22.6
18.6
5.7
4.7
25.4
25.2
1.1
1.0
L G Balakrishnan & Bros Neutral
469
-
737
1,254
1,394
11.6
11.8
35.9
41.7
13.1
11.3
1.8
1.6
13.5
13.8
0.7
0.6
Mahindra and Mahindra Neutral
1,342
-
83,347
38,416
42,904
13.7
13.9
54.8
63.4
24.5
21.2
3.8
3.4
15.4
15.8
1.8
1.6
Maruti
Neutral
4,110
-
124,152
57,865
68,104
16.4
16.7
176.3
225.5
23.3
18.2
4.5
3.9
19.4
21.2
1.9
1.6
Minda Industries
Neutral
1,170
-
1,856
2,523
2,890
8.7
9.0
55.0
65.4
21.3
17.9
4.1
3.3
19.3
18.7
0.8
0.7
Motherson Sumi
Accumulate
291
313
38,498
39,343
45,100
8.8
9.1
10.1
12.5
28.8
23.3
9.1
7.2
35.3
34.4
1.1
0.9
Rane Brake Lining
Buy
370
465
293
454
511
11.5
12.0
25.2
31.0
14.7
11.9
2.2
2.0
14.9
16.6
0.8
0.7
Setco Automotive
Neutral
45
-
595
594
741
12.7
13.7
1.7
3.2
26.2
13.9
2.8
2.4
10.4
16.9
1.4
1.2
Tata Motors
Neutral
463
-
133,735
259,686
273,957
13.0
13.4
25.9
29.5
17.9
15.7
2.3
2.0
8.0
9.0
0.7
0.7
TVS Motor
Accumulate
292
330
13,892
11,263
13,122
6.9
8.5
9.2
15.0
31.8
19.5
7.3
5.8
22.7
29.6
1.2
1.0
Amara Raja Batteries
Buy
865
1,076
14,774
4,690
5,429
17.5
17.5
28.5
35.3
30.4
24.5
7.0
5.8
23.1
25.9
3.1
2.7
Exide Industries
Neutral
161
-
13,668
6,950
7,784
14.4
14.8
6.6
7.3
24.4
22.0
3.1
2.8
12.6
12.8
1.7
1.5
Apollo Tyres
Buy
149
183
7,579
12,056
12,714
17.2
16.4
23.0
20.3
6.5
7.3
1.1
1.0
17.7
13.6
0.7
0.7
Ceat
Buy
832
1,119
3,366
6,041
6,597
14.1
13.7
99.5
111.9
8.4
7.4
1.6
1.4
19.6
18.5
0.7
0.6
JK Tyres
Neutral
88
-
1,996
7,446
7,669
15.2
14.0
19.6
18.4
4.5
4.8
1.1
0.9
25.2
19.5
0.7
0.6
Swaraj Engines
Neutral
1,120
-
1,391
552
630
14.2
14.7
44.6
54.1
25.1
20.7
5.8
5.3
23.2
25.6
2.4
2.0
Subros
Neutral
91
-
544
1,293
1,527
11.8
11.9
4.2
6.7
21.6
13.5
1.6
1.5
7.7
11.5
0.7
0.6
Indag Rubber
Neutral
196
-
514
283
329
17.0
17.2
13.0
15.4
15.1
12.7
3.3
2.7
21.8
21.6
1.5
1.3
Capital Goods
ACE
Neutral
41
-
405
660
839
4.7
8.2
1.0
3.9
41.0
10.5
1.3
1.1
3.2
11.3
0.8
0.6
BEML
Buy
836
1,157
3,480
3,277
4,006
6.0
8.9
36.2
64.3
23.1
13.0
1.6
1.5
5.7
11.7
1.1
0.9
Bharat Electronics
Accumulate
1,257
1,414
30,178
7,295
8,137
20.0
16.8
56.5
58.7
22.3
21.4
3.3
3.0
42.1
44.6
3.3
2.9
Stock Watch
June 20, 2016
Company Name
Reco
CMP
Target
Mkt Cap
Sales ( Čcr )
OPM(%)
EPS (Č)
PER(x)
P/BV(x)
RoE(%)
EV/Sales(x)
(Č)
Price ( Č)
( Č cr )
FY16E
FY17E
FY16E
FY17E
FY16E
FY17E
FY16E
FY17E
FY16E
FY17E
FY16E
FY17E
FY16E
FY17E
Capital Goods
Voltas
Buy
320
407
10,583
5,857
6,511
7.5
7.9
11.7
12.9
27.3
24.8
4.5
3.9
17.1
16.7
1.8
1.6
BGR Energy
Neutral
113
-
815
3,615
3,181
9.5
9.4
16.7
12.4
6.8
9.1
0.6
0.6
10.0
7.0
0.6
0.8
BHEL
Neutral
122
-
29,934
33,722
35,272
10.8
11.7
10.5
14.2
11.7
8.6
0.9
0.8
7.0
9.0
1.0
0.9
Blue Star
Accumulate
431
495
3,873
3,770
4,351
5.7
6.4
11.4
17.2
37.7
25.1
5.8
5.4
18.4
23.1
1.1
0.9
Crompton Greaves
Neutral
75
-
4,685
13,484
14,687
4.9
6.2
4.5
7.1
16.6
10.5
1.2
1.1
7.2
10.8
0.5
0.4
Greaves Cotton
Neutral
136
-
3,321
1,655
1,755
16.6
16.8
7.4
7.8
18.4
17.4
3.7
3.5
21.1
20.6
2.0
1.8
Inox Wind
Buy
233
286
5,161
4,406
5,605
15.5
15.7
20.4
24.8
11.4
9.4
2.6
1.9
27.9
25.9
1.4
1.1
KEC International
Neutral
136
-
3,491
8,791
9,716
6.1
6.8
5.4
8.2
25.2
16.6
2.5
2.3
10.0
14.0
0.6
0.6
Thermax
Neutral
804
-
9,578
6,413
7,525
7.4
8.5
30.5
39.3
26.4
20.5
4.1
3.5
15.0
17.0
1.5
1.2
VATech Wabag
Accumulate
607
681
3,306
2,722
3,336
7.9
8.1
19.5
24.6
31.1
24.7
3.3
2.9
11.1
12.4
1.3
1.1
Cement
ACC
Neutral
1,552
-
29,140
13,151
14,757
16.4
18.3
63.9
83.4
24.3
18.6
3.1
2.9
13.3
16.1
2.1
1.8
Ambuja Cements
Neutral
235
-
36,532
11,564
12,556
19.4
20.7
8.9
10.1
26.5
23.3
3.3
3.1
12.8
13.8
2.8
2.5
HeidelbergCement
Neutral
104
-
2,364
1,772
1,926
13.3
15.4
1.0
3.0
104.3
34.8
2.6
2.4
2.6
7.9
1.9
1.7
India Cements
Neutral
104
-
3,205
4,216
4,840
18.0
19.5
4.0
9.9
26.1
10.5
1.0
1.0
4.0
9.5
1.1
0.9
JK Cement
Neutral
648
-
4,528
3,661
4,742
10.1
15.8
7.5
28.5
86.3
22.7
2.6
2.3
7.5
22.9
1.7
1.3
J K Lakshmi Cement
Neutral
379
-
4,457
2,947
3,616
16.7
19.9
11.5
27.2
32.9
13.9
3.1
2.7
9.8
20.8
1.9
1.5
Mangalam Cements
Neutral
290
-
774
1,053
1,347
10.5
13.3
8.4
26.0
34.5
11.2
1.5
1.3
4.3
12.5
1.1
0.8
Orient Cement
Neutral
165
-
3,373
1,854
2,524
21.2
22.2
7.7
11.1
21.4
14.8
3.1
2.7
13.3
15.7
2.6
1.8
Ramco Cements
Neutral
549
-
13,062
4,036
4,545
20.8
21.3
15.1
18.8
36.3
29.2
4.4
4.0
12.9
14.3
3.7
3.3
Shree Cement^
Neutral
13,742
-
47,873
7,150
8,742
26.7
28.6
228.0
345.5
60.3
39.8
8.9
7.4
15.7
20.3
6.4
5.2
UltraTech Cement
Neutral
3,295
-
90,425
24,669
29,265
18.2
20.6
82.0
120.0
40.2
27.5
4.3
3.8
11.3
14.7
3.7
3.2
Construction
ITNL
Buy
76
93
2,502
7,360
8,682
34.0
32.2
7.0
8.6
10.9
8.8
0.4
0.4
3.2
2.5
3.7
3.5
KNR Constructions
Accumulate
555
603
1,561
937
1,470
14.3
14.0
44.2
38.6
12.6
14.4
2.5
2.2
15.4
15.4
1.7
1.1
Larsen & Toubro
Buy
1,478
1,700
137,769
58,870
65,708
8.3
10.3
42.0
53.0
35.2
27.9
2.4
2.2
8.8
11.2
2.6
2.3
Gujarat Pipavav Port
Neutral
154
-
7,428
629
684
51.0
52.2
6.4
5.9
24.0
26.0
3.2
2.9
15.9
12.7
11.5
10.3
MBL Infrastructures
Buy
116
285
480
2,313
2,797
12.2
14.6
19.0
20.0
6.1
5.8
0.6
0.6
11.3
10.6
0.9
0.8
Nagarjuna Const.
Neutral
75
-
4,178
7,892
8,842
8.8
9.1
3.0
5.3
25.1
14.2
1.3
1.2
5.0
8.5
0.8
0.6
PNC Infratech
Buy
555
647
2,850
1,873
2,288
13.2
13.5
24.0
32.0
23.1
17.4
2.3
2.0
12.1
12.3
1.6
1.3
Simplex Infra
Neutral
275
-
1,362
5,955
6,829
10.3
10.5
16.0
31.0
17.2
8.9
0.9
0.8
5.3
9.9
0.7
0.6
Stock Watch
June 20, 2016
Company Name
Reco
CMP
Target
Mkt Cap
Sales ( Čcr )
OPM(%)
EPS (Č)
PER(x)
P/BV(x)
RoE(%)
EV/Sales(x)
(Č)
Price ( Č)
( Č cr )
FY16E
FY17E
FY16E
FY17E
FY16E
FY17E
FY16E
FY17E
FY16E
FY17E
FY16E
FY17E
FY16E
FY17E
Construction
Power Mech Projects
Neutral
558
-
821
1,539
1,801
12.8
12.7
59.0
72.1
9.5
7.7
1.4
1.2
18.6
16.8
0.5
0.5
Sadbhav Engineering
Neutral
286
-
4,912
3,186
3,598
10.2
10.3
8.0
9.0
35.8
31.8
3.3
2.9
9.4
9.9
1.9
1.7
NBCC
Buy
185
220
11,106
5,838
7,428
6.0
7.9
5.2
8.2
35.6
22.6
1.1
0.9
21.9
28.2
1.7
1.2
MEP Infra
Neutral
37
-
607
1,956
1,876
28.1
30.5
1.3
3.0
28.7
12.5
6.0
4.1
21.2
32.8
1.7
1.7
SIPL
Neutral
100
-
3,522
675
1,042
62.4
64.7
-
-
3.8
4.3
-
-
16.9
11.4
Engineers India
Neutral
201
-
6,769
1,667
1,725
13.5
16.0
9.7
11.4
20.7
17.6
2.4
2.4
11.7
13.4
2.9
2.9
Financials
Allahabad Bank
Neutral
58
-
4,208
8,569
9,392
2.8
2.9
16.3
27.5
3.6
2.1
0.3
0.3
7.6
11.9
-
-
Axis Bank
Neutral
527
-
125,693
26,204
29,738
3.6
3.5
34.5
35.4
15.3
14.9
2.4
2.1
16.8
14.9
-
-
Bank of Baroda
Neutral
151
-
34,724
18,802
21,088
2.0
2.2
(7.4)
13.0
11.6
1.2
0.9
(4.2)
7.3
-
-
Bank of India
Neutral
94
-
8,771
15,972
17,271
1.9
2.0
15.3
33.4
6.1
2.8
0.3
0.2
3.6
7.6
-
-
Canara Bank
Neutral
203
-
11,017
15,441
16,945
2.0
2.1
46.6
70.4
4.4
2.9
0.4
0.3
8.0
11.2
-
-
Dena Bank
Neutral
37
-
2,454
3,440
3,840
2.1
2.3
7.3
10.0
5.1
3.7
0.4
0.3
6.1
7.9
-
-
Dewan Housing Finance Buy
202
270
5,890
1,828
2,225
2.9
3.0
24.9
29.7
8.1
6.8
1.3
1.1
15.1
16.1
-
-
Equitas Holdings
Buy
174
235
5,837
679
1,076
12.4
11.7
6.2
6.7
28.1
26.0
3.5
2.6
13.3
12.5
-
-
Federal Bank
Neutral
58
-
9,914
3,279
3,787
2.8
2.9
3.9
5.5
14.6
10.4
1.2
1.1
8.4
10.8
-
-
HDFC
Neutral
1,228
-
194,111
10,358
11,852
3.3
3.3
41.1
47.0
29.9
26.1
5.7
5.2
24.7
24.9
-
-
HDFC Bank
Accumulate
1,169
1,262
296,011
38,606
47,696
4.4
4.5
48.8
61.4
24.0
19.1
4.1
3.5
18.7
20.0
-
-
ICICI Bank
Neutral
238
-
138,646
34,279
39,262
3.3
3.3
21.0
24.4
11.4
9.8
1.9
1.6
14.4
14.7
-
-
IDBI Bank
Neutral
71
-
14,710
9,625
10,455
1.8
1.8
8.5
14.2
8.4
5.0
0.5
0.5
5.9
9.3
-
-
Indian Bank
Neutral
124
-
5,951
6,160
6,858
2.5
2.5
24.5
29.8
5.1
4.2
0.4
0.4
7.7
8.6
-
-
LIC Housing Finance
Buy
475
592
23,951
3,179
3,758
2.6
2.6
32.9
40.6
14.4
11.7
2.7
2.3
19.6
20.7
-
-
Oriental Bank
Neutral
100
-
3,450
7,643
8,373
2.4
2.4
37.2
45.4
2.7
2.2
0.2
0.2
8.2
9.4
-
-
Punjab Natl.Bank
Neutral
95
-
18,556
23,122
26,022
2.8
2.8
7.0
21.6
13.5
4.4
0.7
0.6
3.4
10.0
-
-
South Ind.Bank
Neutral
20
-
2,755
1,965
2,185
2.5
2.5
2.5
3.3
8.2
6.2
0.8
0.7
9.5
11.7
-
-
St Bk of India
Neutral
213
-
165,658
79,958
86,061
2.6
2.6
13.4
20.7
15.9
10.3
1.3
1.2
11.5
12.8
-
-
Union Bank
Neutral
127
-
8,703
12,646
14,129
2.3
2.4
31.0
39.1
4.1
3.2
0.4
0.4
9.8
11.4
-
-
Vijaya Bank
Neutral
37
-
3,731
3,536
3,827
1.9
1.9
5.5
6.7
6.8
5.6
0.6
0.5
7.8
8.8
-
-
Yes Bank
Neutral
1,070
-
45,059
7,190
9,011
3.2
3.3
58.2
69.7
18.4
15.4
3.3
2.8
19.2
19.6
-
-
FMCG
Asian Paints
Neutral
998
-
95,714
15,534
17,445
17.7
16.8
18.4
19.6
54.3
50.9
19.2
18.1
34.6
35.6
6.0
5.4
Stock Watch
June 20, 2016
Company Name
Reco
CMP
Target
Mkt Cap
Sales ( Čcr )
OPM(%)
EPS (Č)
PER(x)
P/BV(x)
RoE(%)
EV/Sales(x)
(Č)
Price ( Č)
( Č cr )
FY16E FY17E
FY16E
FY17E
FY16E
FY17E
FY16E
FY17E
FY16E
FY17E
FY16E
FY17E
FY16E
FY17E
FMCG
Britannia
Neutral
2,641
-
31,680
8,481
9,795
14.0
14.1
65.5
78.3
40.3
33.7
19.1
15.7
38.3
41.2
3.7
3.2
Colgate
Neutral
857
-
23,312
4,136
4,632
22.5
23.3
22.2
25.3
38.6
33.9
23.5
20.9
68.6
67.5
5.5
4.9
Dabur India
Neutral
315
-
55,387
9,370
10,265
17.6
17.3
7.3
8.1
42.9
38.9
11.1
10.2
31.7
30.6
5.7
5.2
GlaxoSmith Con*
Accumulate
5,630
6,118
23,678
4,519
5,142
19.6
19.8
164.3
191.2
34.3
29.5
9.5
8.1
30.8
29.9
4.7
4.1
Godrej Consumer
Neutral
1,532
-
52,163
9,003
10,335
18.1
18.7
34.1
41.8
44.9
36.7
9.7
8.3
23.9
24.8
5.9
5.2
HUL
Neutral
881
-
190,657
33,299
35,497
17.1
17.1
18.9
20.0
46.6
44.0
40.9
35.6
87.6
80.8
5.5
5.2
ITC
Accumulate
360
380
289,337
36,837
39,726
38.8
38.7
12.2
13.5
29.4
26.7
8.2
7.2
27.8
26.9
7.3
6.8
Marico
Neutral
255
-
32,957
6,151
6,966
17.2
17.3
5.4
6.4
47.3
39.9
14.9
11.7
33.2
32.4
5.2
4.6
Nestle*
Neutral
6,462
-
62,306
9,393
10,507
22.2
22.3
106.8
121.8
60.5
53.1
21.3
19.1
34.8
36.7
6.4
5.7
Tata Global
Accumulate
126
137
7,933
8,635
9,072
9.8
9.9
5.8
7.2
21.7
17.5
1.9
1.9
6.8
7.4
1.0
0.9
Procter & Gamble
Buy
6,250
7,369
20,288
2,588
2,939
23.3
23.2
130.2
146.2
48.0
42.8
95.7
91.8
27.6
25.3
7.4
6.4
Hygiene
IT
HCL Tech^
Buy
753
1,000
106,166
37,061
30,781
21.5
20.5
51.4
40.0
14.6
18.8
3.8
2.8
20.1
20.3
2.6
2.8
Infosys
Buy
1,178
1,374
270,649
62,441
70,558
27.5
27.5
59.0
65.3
20.0
18.0
4.0
3.7
22.2
22.4
3.8
3.3
TCS
Buy
2,604
3,004
513,001
108,646
122,770
28.3
28.3
123.7
141.0
21.1
18.5
7.0
6.4
33.1
34.6
4.3
3.7
Tech Mahindra
Buy
536
700
51,996
26,494
30,347
16.3
17.0
32.2
37.5
16.6
14.3
3.6
3.1
21.7
21.8
1.7
1.4
Wipro
Buy
552
680
136,433
50,808
56,189
23.7
23.8
37.3
40.7
14.8
13.6
2.8
2.6
19.2
17.7
2.1
1.8
Media
D B Corp
Neutral
374
-
6,869
2,025
2,187
27.4
27.4
17.4
18.9
21.5
19.8
4.8
4.4
22.9
23.7
3.4
3.1
HT Media
Neutral
78
-
1,805
2,495
2,673
12.9
13.2
6.8
7.2
11.4
10.8
0.9
0.8
7.5
7.8
0.3
0.2
Jagran Prakashan
Buy
170
205
5,549
2,107
2,355
33.5
28.0
10.1
10.8
16.9
15.7
3.9
3.4
23.3
21.7
2.7
2.4
Sun TV Network
Neutral
370
-
14,581
2,510
2,763
71.8
71.5
21.9
24.8
16.9
14.9
4.0
3.6
22.8
24.3
5.3
4.8
Hindustan Media
Neutral
271
-
1,989
914
1,016
21.7
21.5
21.9
23.3
12.4
11.7
2.2
1.9
18.0
16.2
1.6
1.4
Ventures
Metals & Mining
Coal India
Buy
313
380
197,923
76,167
84,130
19.9
22.3
22.4
25.8
14.0
12.1
5.0
4.9
35.5
41.0
1.9
1.7
Hind. Zinc
Neutral
172
-
72,697
14,641
14,026
50.4
50.4
17.7
16.0
9.8
10.8
1.5
1.4
16.2
13.2
2.6
2.5
Hindalco
Neutral
119
-
24,470
104,356
111,186
8.7
9.5
6.7
11.1
17.6
10.7
0.6
0.6
3.5
5.9
0.8
0.7
JSW Steel
Neutral
1,394
-
33,698
42,308
45,147
16.4
20.7
(10.3)
49.5
28.2
1.6
1.5
(1.0)
5.6
1.8
1.7
NMDC
Neutral
93
-
36,852
8,237
10,893
46.6
44.5
10.0
11.7
9.3
8.0
1.0
0.9
12.5
13.0
4.3
3.3
SAIL
Neutral
45
-
18,462
45,915
53,954
7.2
10.5
1.5
4.4
29.7
10.2
0.4
0.4
2.3
4.1
1.0
0.9
Vedanta
Neutral
123
-
36,332
71,445
81,910
26.2
26.3
12.9
19.2
9.5
6.4
0.7
0.6
7.2
8.9
1.0
0.7
Tata Steel
Neutral
326
-
31,613
126,760
137,307
8.9
11.3
6.4
23.1
51.2
14.1
1.0
1.0
2.0
7.1
0.8
0.8
Stock Watch
June 20, 2016
Company Name
Reco
CMP
Target
Mkt Cap
Sales ( Čcr )
OPM(%)
EPS (Č)
PER(x)
P/BV(x)
RoE(%)
EV/Sales(x)
(Č)
Price ( Č)
( Č cr )
FY16E FY17E
FY16E
FY17E
FY16E
FY17E
FY16E
FY17E
FY16E
FY17E
FY16E
FY17E
FY16E
FY17E
Oil & Gas
Cairn India
Neutral
138
-
25,939
11,323
12,490
49.4
51.0
20.7
20.7
6.7
6.7
0.4
0.4
6.4
6.1
1.4
0.7
GAIL
Neutral
386
-
49,020
64,856
70,933
9.1
9.6
24.0
28.9
16.1
13.4
1.4
1.3
8.8
9.6
0.9
0.8
ONGC
Neutral
211
-
180,179
154,564
145,998
36.8
37.4
20.8
22.6
10.1
9.3
1.0
0.9
10.1
9.7
1.4
1.5
Petronet LNG
Neutral
285
-
21,409
29,691
31,188
5.8
6.2
12.8
13.4
22.3
21.3
3.3
3.0
15.8
14.8
0.8
0.8
Indian Oil Corp
Accumulate
413
455
100,311
359,607
402,760
5.9
6.1
42.5
48.7
9.7
8.5
1.3
1.2
14.1
14.4
0.4
0.3
Reliance Industries
Buy
973
1,150
315,571
304,775
344,392
12.6
13.4
91.3
102.6
10.7
9.5
1.2
1.1
11.8
12.0
1.0
0.8
Pharmaceuticals
Alembic Pharma
Neutral
529
-
9,972
3,145
3,483
31.9
16.2
38.2
18.7
13.9
28.3
6.2
5.3
57.9
20.1
3.1
2.8
Aurobindo Pharma
Accumulate
727
768
42,518
13,651
15,702
21.7
21.7
33.9
38.4
21.4
18.9
6.0
4.7
32.5
27.7
3.4
3.0
Aventis*
Accumulate
4,186
4,738
9,641
2,049
2,375
15.4
17.3
115.4
153.5
36.3
27.3
5.9
4.6
19.3
25.8
4.5
3.7
Cadila Healthcare
Buy
313
400
32,079
9,469
11,246
21.2
22.0
14.9
17.1
21.0
18.3
6.0
4.7
28.8
26.6
3.4
2.8
Cipla
Neutral
486
-
39,017
13,372
15,378
16.4
17.4
19.6
18.8
24.8
25.8
3.2
2.9
13.1
13.8
2.9
2.8
Dr Reddy's
Buy
3,005
3,476
51,254
15,471
17,479
24.6
24.6
138.2
152.4
21.8
19.7
4.0
3.4
19.7
18.7
3.3
2.9
Dishman Pharma
Neutral
138
-
2,232
1,733
1,906
21.5
21.5
10.1
10.0
13.7
13.8
1.6
1.5
10.5
11.2
1.8
1.5
GSK Pharma*
Neutral
3,513
-
29,757
2,870
3,158
20.0
22.1
59.5
68.3
59.0
51.4
17.4
17.9
28.5
34.3
9.9
9.0
Indoco Remedies
Neutral
280
-
2,583
1,033
1,199
15.9
18.2
9.4
13.6
29.8
20.6
4.4
3.8
15.7
19.7
2.6
2.2
Ipca labs
Buy
488
750
6,156
3,363
3,909
12.9
18.6
13.4
28.0
36.4
17.4
2.6
2.3
7.4
14.0
2.1
1.8
Lupin
Buy
1,464
1,809
66,023
13,702
15,912
23.7
26.4
50.5
58.1
29.0
25.2
6.0
4.9
22.9
21.4
5.3
4.2
Sun Pharma
Buy
743
950
178,769
28,163
32,610
25.8
30.7
17.4
26.9
42.7
27.6
4.1
3.5
13.0
16.6
5.8
4.8
Power
Tata Power
Neutral
74
-
19,933
35,923
37,402
22.6
22.8
4.1
5.2
18.2
14.3
1.4
1.3
7.5
9.3
1.5
1.4
NTPC
Neutral
152
-
125,537
87,271
99,297
23.5
23.5
11.8
13.3
13.0
11.5
1.5
1.4
11.5
12.2
2.5
2.2
Power Grid
Accumulate
157
170
82,084
20,702
23,361
86.7
86.4
12.1
13.2
13.0
11.9
1.9
1.7
15.6
15.1
8.9
8.3
Real Estate
MLIFE
Buy
461
554
1,890
826
1,011
20.1
21.9
22.7
30.7
20.3
15.0
1.2
1.1
6.0
7.4
4.2
3.2
Telecom
Bharti Airtel
Neutral
356
-
142,188
101,748
109,191
32.1
31.7
12.0
12.5
29.6
28.5
2.0
1.9
6.9
6.7
2.0
1.8
Idea Cellular
Neutral
101
-
36,384
34,282
36,941
32.0
31.5
5.9
6.2
17.1
16.3
1.6
1.4
9.9
9.3
1.6
1.6
zOthers
Abbott India
Neutral
4,387
-
9,322
2,715
3,153
14.5
14.1
134.3
152.2
32.7
28.8
8.2
6.7
27.4
25.6
3.2
2.7
Bajaj Electricals
Buy
229
268
2,314
4,612
5,351
5.6
5.7
23.4
18.0
9.8
12.8
3.0
2.7
12.5
14.4
0.5
0.4
Finolex Cables
Neutral
369
-
5,640
2,520
2,883
12.2
12.0
12.7
14.2
29.1
26.0
4.0
3.5
13.6
13.5
2.0
1.7
Goodyear India*
Buy
526
631
1,213
1,800
1,600
11.7
11.5
58.7
52.9
9.0
9.9
2.0
1.7
24.6
18.7
0.5
0.4
Hitachi
Neutral
1,237
-
3,364
1,779
2,081
7.8
8.8
21.8
33.4
56.8
37.0
9.2
7.4
17.4
22.1
2.0
1.7
Stock Watch
June 20, 2016
Company Name
Reco
CMP
Target
Mkt Cap
Sales ( Čcr )
OPM(%)
EPS (Č)
PER(x)
P/BV(x)
RoE(%)
EV/Sales(x)
(Č)
Price ( Č)
( Č cr )
FY16E
FY17E
FY16E
FY17E
FY16E
FY17E
FY16E
FY17E
FY16E
FY17E
FY16E
FY17E
FY16E
FY17E
zOthers
Jyothy Laboratories
Neutral
296
-
5,369
1,620
1,847
11.5
11.5
7.3
8.5
40.7
35.0
5.3
4.9
13.3
14.4
3.2
2.7
MRF
Buy
31,344
45,575
13,294
20,316
14,488
21.4
21.1
5,488.0
3,798.0
5.7
8.3
2.0
1.6
41.1
21.2
0.6
0.8
Page Industries
Neutral
13,696
-
15,277
1,929
2,450
19.8
20.1
229.9
299.0
59.6
45.8
26.3
18.3
52.1
47.1
7.9
6.2
Relaxo Footwears
Neutral
494
-
5,930
1,767
2,152
12.3
12.5
19.3
25.1
25.7
19.7
6.3
4.8
27.7
27.8
3.4
2.8
Siyaram Silk Mills
Buy
1,024
1,347
960
1,619
1,799
11.6
11.6
93.5
104.9
11.0
9.8
1.9
1.6
17.1
16.4
0.8
0.8
Styrolution ABS India* Neutral
610
-
1,073
1,271
1,440
8.6
9.2
32.0
41.1
19.0
14.9
1.9
1.7
10.7
12.4
0.8
0.7
TVS Srichakra
Buy
2,353
2,932
1,802
2,035
2,252
15.9
15.3
248.6
268.1
9.5
8.8
4.1
3.0
43.6
33.9
0.9
0.8
HSIL
Buy
258
310
1,865
2,123
2,384
16.1
16.5
15.0
18.9
17.2
13.7
1.3
1.2
8.0
9.4
1.2
1.1
Kirloskar Engines India
Neutral
259
-
3,746
2,403
2,554
8.6
9.9
9.2
10.5
28.2
24.7
2.7
2.6
9.7
10.7
1.2
1.1
Ltd
M M Forgings
Buy
434
546
524
511
615
21.7
21.6
43.1
55.8
10.1
7.8
1.8
1.5
19.9
21.2
1.2
0.9
Banco Products (India) Neutral
143
-
1,021
1,208
1,353
11.0
12.3
10.8
14.5
13.2
9.9
1.5
1.4
11.9
14.5
0.8
0.7
Competent Automobiles Neutral
140
-
86
1,040
1,137
3.2
3.1
25.7
28.0
5.4
5.0
0.8
0.7
15.0
14.3
0.1
0.1
Nilkamal
Neutral
1,144
-
1,707
1,871
2,031
10.7
10.5
63.2
69.8
18.1
16.4
3.0
2.5
17.6
16.6
1.0
0.8
Visaka Industries
Accumulate
151
162
240
1,020
1,120
8.7
9.1
13.9
20.1
10.9
7.5
0.7
0.7
6.4
8.7
0.5
0.4
Transport Corporation of
Neutral
305
-
2,333
2,830
3,350
8.8
9.0
14.4
18.3
21.2
16.6
3.3
2.8
15.4
17.1
0.9
0.8
India
Elecon Engineering
Neutral
64
-
693
1,359
1,482
10.3
13.7
0.8
3.9
79.2
16.3
1.3
1.3
1.6
7.8
0.9
0.8
Surya Roshni
Buy
160
201
700
2,992
3,223
8.1
8.4
14.7
18.3
10.9
8.7
1.0
0.9
9.7
11.0
0.5
0.5
MT Educare
Neutral
170
-
677
286
366
18.3
17.7
7.7
9.4
22.0
18.2
4.6
4.1
20.2
21.1
2.3
1.7
Radico Khaitan
Buy
89
125
1,177
1,543
1,659
12.6
13.0
5.8
6.3
15.3
14.0
1.3
1.2
8.5
8.6
1.2
1.1
Garware Wall Ropes
Buy
343
460
751
828
898
11.2
10.3
28.3
29.0
12.1
11.8
2.0
1.8
16.8
14.9
0.8
0.8
Wonderla Holidays
Neutral
400
-
2,260
206
308
44.0
43.6
9.0
12.9
44.4
31.0
6.1
5.5
13.7
17.8
10.9
7.2
Linc Pen & Plastics
Neutral
234
-
346
344
382
9.1
9.1
12.4
13.1
18.9
17.9
3.4
3.0
18.0
16.7
1.1
1.0
The Byke Hospitality
Neutral
161
-
644
222
287
20.5
20.5
5.6
7.6
28.5
21.2
5.4
4.4
18.9
20.8
2.9
2.3
Interglobe Aviation
Neutral
1,013
-
36,520
17,022
21,122
20.7
14.5
63.9
53.7
15.9
18.9
23.8
19.5
149.9
103.2
2.2
1.7
Coffee Day Enterprises
Neutral
254
-
5,225
2,692
2,964
17.0
18.6
-
4.7
-
53.5
3.1
2.9
0.2
5.5
2.3
2.2
Ltd
Navneet Education
Neutral
94
-
2,227
998
1,062
24.1
24.0
5.8
6.1
16.3
15.4
3.6
3.2
22.0
20.6
2.3
2.2
Navkar Corporation
Buy
198
265
2,822
347
408
43.2
42.9
6.7
6.8
29.7
29.2
2.2
2.0
7.3
6.9
8.6
7.8
UFO Moviez
Neutral
525
-
1,449
558
619
32.0
33.2
22.5
30.0
23.3
17.5
2.8
2.4
12.0
13.8
2.5
2.1
VRL Logistics
Neutral
298
-
2,723
1,725
1,902
16.5
16.7
12.2
14.6
24.5
20.5
5.1
4.5
20.8
21.9
1.7
1.5
Stock Watch
June 20, 2016
Company Name
Reco
CMP
Target Mkt Cap
Sales ( Čcr )
OPM(%)
EPS (Č)
PER(x)
P/BV(x)
RoE(%)
EV/Sales(x)
(Č)
Price ( Č)
( Č cr )
FY16E FY17E FY16E FY17E FY16E FY17E FY16E FY17E FY16E FY17E FY16E FY17E FY16E FY17E
zOthers
Team Lease Serv.
Neutral
885
-
1,514
2,565
3,229
1.3
1.5
15.2
22.8
58.3
38.9
4.7
4.2
8.0
10.7
0.5
0.4
S H Kelkar & Co.
Neutral
212
-
3,065
928
1,036
15.3
15.1
4.9
6.1
42.9
34.7
4.0
3.7
9.4
10.7
3.2
2.8
Quick Heal
Neutral
274
-
1,919
339
408
27.8
27.3
7.1
7.7
38.8
35.4
3.3
3.3
8.5
9.3
4.6
3.8
Narayana Hrudaya
Neutral
316
-
6,458
1,603
1,873
10.9
11.5
1.0
2.6
331.7
119.5
8.0
7.3
2.4
6.1
4.2
3.5
Manpasand Bever.
Neutral
541
-
2,708
540
836
19.9
19.6
10.2
16.9
52.8
32.0
4.3
3.8
8.1
12.0
4.7
3.0
Source: Company, Angel Research; Note: *December year end; #September year end; &October year end; Price as on June 17, 2016
Market Outlook
June 20, 2016
Research Team Tel: 022 - 39357800
DISCLAIMER
Angel Broking Private Limited (hereinafter referred to as “Angel”) is a registered Member of National Stock Exchange of India Limited,
Bombay Stock Exchange Limited and Metropolitian Stock Exchange of India Limited. It is also registered as a Depository Participant with
CDSL and Portfolio Manager with SEBI. It also has registration with AMFI as a Mutual Fund Distributor. Angel Broking Private Limited is a
registered entity with SEBI for Research Analyst in terms of SEBI (Research Analyst) Regulations, 2014 vide registration number
INH000000164. Angel or its associates has not been debarred/ suspended by SEBI or any other regulatory authority for accessing
/dealing in securities Market. Angel or its associates including its relatives/analyst do not hold any financial interest/beneficial ownership
of more than 1% in the company covered by Analyst. Angel or its associates/analyst has not received any compensation / managed or co
-managed public offering of securities of the company covered by Analyst during the past twelve months. Angel/analyst has not served as
an officer, director or employee of company covered by Analyst and has not been engaged in market making activity of the company
covered by Analyst.
This document is solely for the personal information of the recipient, and must not be singularly used as the basis of any investment
decision. Nothing in this document should be construed as investment or financial advice. Each recipient of this document should make
such investigations as they deem necessary to arrive at an independent evaluation of an investment in the securities of the companies
referred to in this document (including the merits and risks involved), and should consult their own advisors to determine the merits and
risks of such an investment.
Reports based on technical and derivative analysis center on studying charts of a stock's price movement, outstanding positions and
trading volume, as opposed to focusing on a company's fundamentals and, as such, may not match with a report on a company's
fundamentals.
The information in this document has been printed on the basis of publicly available information, internal data and other reliable sources
believed to be true, but we do not represent that it is accurate or complete and it should not be relied on as such, as this document is for
general guidance only. Angel Broking Pvt. Limited or any of its affiliates/ group companies shall not be in any way responsible for any
loss or damage that may arise to any person from any inadvertent error in the information contained in this report. Angel Broking Pvt.
Limited has not independently verified all the information contained within this document. Accordingly, we cannot testify, nor make any
representation or warranty, express or implied, to the accuracy, contents or data contained within this document. While Angel Broking
Pvt. Limited endeavors to update on a reasonable basis the information discussed in this material, there may be regulatory, compliance,
or other reasons that prevent us from doing so.
This document is being supplied to you solely for your information, and its contents, information or data may not be reproduced,
redistributed or passed on, directly or indirectly.
Neither Angel Broking Pvt. Limited, nor its directors, employees or affiliates shall be liable for any loss or damage that may arise from or
in connection with the use of this information.
Note: Please refer to the important ‘Stock Holding Disclosure' report on the Angel website (Research Section). Also, please refer to the
latest update on respective stocks for the disclosure status in respect of those stocks. Angel Broking Pvt. Limited and its affiliates may have
investment positions in the stocks recommended in this report.