Market Outlook
May 20, 2016
Market Cues
Domestic Indices
Chg (%)
(Pts)
(Close)
BSE Sensex
(1.2)
(305)
25,400
Indian Markets are expected to open flat tracking SGX Nifty.
Nifty
(1.1)
(87)
7,783
After showing a substantial move to the downside in morning trading on Thursday,
Mid Cap
(1.1)
(125)
11,077
U.S markets regained some ground as the day progressed but still closed in the red.
Small Cap
(1.0)
(113)
11,056
The sell-off seen early in the session reflected renewed concerns about the outlook
for interest rates following yesterday's release of the minutes of the Federal Reserve's
Bankex
(1.2)
(229)
18,829
latest monetary policy meeting.
The European markets ended Thursday's session solidly in negative territory. Investor
Global Indices
Chg (%)
(Pts)
(Close)
concerns over the possibility of a June interest rate hike by the Federal Reserve.
Dow Jones
(0.5)
(91)
17,435
Indian markets fell for the second consecutive day on Thursday as market
Nasdaq
(0.6)
(27)
4,713
participants turned cautious over the possibility of an interest rate hike by the US
FTSE
(1.8)
(112)
6,053
Federal Reserve in June.
Nikkei
0.0
2
16,647
The SEBI has tightened the rules for P Notes holders. As per the new norm P -Notes
Hang Seng
(0.7)
(132)
19,694
holders will have to adhere to Indian Know your customer (KYC). In the near term
Shanghai Com
(0.0)
(1)
2,807
market could react negatively to this and foreign inflows could see some slow down.
News Analysis
Advances / Declines
BSE
NSE
SEBI tightens norms for P Notes issuance
Advances
903
436
Result Review: Lupin
Declines
1,655
1,105
Detailed analysis on Pg2
Unchanged
169
74
Investor’s Ready Reckoner
Volumes (` Cr)
Key Domestic & Global Indicators
BSE
5,195
Stock Watch: Latest investment recommendations on 150+ stocks
Refer Pg5 onwards
NSE
16,694
Top Picks
Net Inflows (` Cr)
Net
Mtd
Ytd
CMP
Target
Upside
Company
Sector
Rating
(`)
(`)
(%)
FII
(5)
1,471
13,261
Amara Raja
Auto & Auto Ancillary Accumulate
943
1,076
14.1
MFs
40
2,350
4,946
HCL Tech
IT
Buy
729
1,000
37.3
LIC Housing
Financials
Buy
455
592
30.1
Top Gainers
Price (`)
Chg (%)
Bharat Electronics
Capital Goods
Buy
1,118
1,414
26.5
Gati
125
6.2
Navkar Corporation Others
Buy
183
265
45.2
Edelweiss
64
5.0
More Top Picks on Pg4
Jklakshmi
360
4.9
Key Upcoming Events
Balkrisind
701
4.6
Previous
Consensus
Date
Region
Event Description
Reading
Expectations
Fsl
38
3.8
May 20 US
Existing home sales
5.33
5.40
May 23 Germany
PMI Services
54.10
-
Top Losers
Price (`)
Chg (%)
May 24 UK
GDP (YoY)
2.10
Suntv
371
(13.3)
May 26 US
New home sales
511
520
6.(
Torntpower
201
(11.4)
More Events on Pg5
Adaniports
172
(6.1)
Hathway
32
(5.7)
Sail
40
(5.3)
As on May 19, 2016
Market Outlook
May 20, 2016
SEBI tightens norms for P Notes issuance
The SEBI has tightened the rules for P Notes holders. As per the new norm P -
Notes holders will have to adhere to Indian Know your customer (KYC) or anti
money laundering (AML) norms. Further SEBI also has put curbs on the transfer-
ability of P -notes between two foreign investors. Further to tighten it has also
increased the frequency of reporting by P-notes issuers. The new set of rules is
likely to tighten the round tripping of money by Indian investors. This might see
some slow down in the incremental funds flow in to Indian markets. However,
foreign investors with a long term horizon in India should have no issues adhering
to the new set of norms.
Result Review
Lupin Ltd (CMP: `1656 / TP: / Upside :)
Lupin Ltd posted results above expectations. The sales came in at `4091cr V/s
`3665cr expected a yoy growth of 34.0%. The sales growth was driven by
Formulations (`3807.5cr), posting a yoy growth of 38.6%, while API (`283.8cr) a
dip of 7.7%. Formulation sales were driven by USA (`2187.1cr), a 58.7% yoy
growth. Europe (`125.4cr) posted a yoy growth of 40.7%. India (`761.5cr) posted
a 14.7% yoy growth, while Japan (`344.2cr) posted a 17.0% yoy growth. ROW
(`275.8cr), posted a 38.3% yoy growth. On operating front, the EBDITA came in
at 31.2% V/s 25.1% in 4QFY2015 and V/s 29.5% expected. The expansion in the
OPM was on back of the GPM expansion which came in at 73.8% V/s 68.7% in
4QFY2015, V/s 72.7% expected. This along with high other income (`115.2cr V/s
`41.3cr in 4QFY2015), lead the net profit to come in at `806.9cr V/s `547.2cr in
4QFY2015, V/s `828.7cr expected. We maintain our neutral stance on the stock.
Y/E
Sales OPM
PAT EPS ROE P/E P/BV EV/EBITDA EV/Sales
March
(` cr)
(%)
(` cr)
(`)
(%) (x) (x)
(x)
(x)
FY2016E
13,092 25.0
2,266 50.4 22.8 32.8
6.8
22.0
5.5
FY2017E
16,561 27.0
3,072 68.3 24.7 24.2
5.4
15.6
4.2
Economic and Political News
New BJP govt will help Assam grow industrially, say chambers of commerce
Moody's sees India growing at 7.5% in 2016, 2017
Mines Ministry, States reach consensus on early approvals for mining from
auctioned blocks
Corporate News
Sobha Q4 profits drop 41.3% to ` 36.1 crore
Tata Communications sells 74% in data centre to ST Telemedia
SpiceJet's Q4 net profit surges to `73 crore
Market Outlook
May 20, 2016
Quarterly Bloomberg Brokers Consensus Estimate
Britannia Industries Ltd. Consol - May 20, 2016
Particulars (` cr)
4QFY16E
4QFY15
y-o-y (%)
3QFY16
q-o-q (%)
Net sales
2,243
2032
10.4
2224
0.9
EBITDA
325
253
28.5
312
4.3
EBITDA margin (%)
14.5
12.5
14
Net profit
219
167
31.1
207
5.8
ITC Ltd. - May 20, 2016
Particulars (` cr)
4QFY16E
4QFY15
y-o-y (%)
3QFY16
q-o-q (%)
Net sales
9,811
9,188
6.8
9103
7.8
EBITDA
3,512
3,243
8.3
3605
(2.6)
EBITDA margin (%)
35.8
35.3
39.6
Net profit
2,504
2,361
6.1
2653
(5.6)
IDBI Bank Ltd. - May 20, 2016
Particulars (` cr)
4QFY16E
4QFY15
y-o-y (%)
3QFY16
q-o-q (%)
Net profit
(767)
546
0.0
(2184)
35.1
Bank of India Ltd. - May 20, 2016
Particulars (` cr)
4QFY16E
4QFY15
y-o-y (%)
3QFY16
q-o-q (%)
Net profit
(1,094)
(56)
0.0
(1506)
0.0
Tata Power Co. Ltd. Consol- May 23, 2016
Particulars (` cr)
4QFY16E
4QFY15
y-o-y (%)
3QFY16
q-o-q (%)
Net sales
9,250
8,167
13.3
9,230
0.2
EBITDA
2,009
1,962
2.4
2,472
(18.7)
EBITDA margin (%)
21.7
24.0
26.8
Net profit
280
159
75.8
212
32.5
Bharat Petroleum Corp. Ltd. - May 23, 2016
Particulars (` cr)
4QFY16E
4QFY15
y-o-y (%)
3QFY16
q-o-q (%)
Net sales
40,365
51,304
(21.3)
46613
(13.4)
EBITDA
2,970
4,496
(33.9)
2417
22.9
EBITDA margin (%)
7.4
8.8
5.2
Net profit
1,822
2,853
(36.1)
1489
22.4
Market Outlook
May 20, 2016
Top Picks
Large Cap
Market Cap
CMP
Target
Upside
Company
Rationale
(` Cr)
(`)
(`)
(%)
To outpace battery industry growth due to better technological
Amara Raja Batteries
16,112
943
1,076
14.1
products leading to market share gains in both the automotive
OEM and replacement segments.
Uptick in defense capex by government when coupled with
Bharat Electronics
26,827
1,118
1,414
26.5
BELs strong market positioning, indicate that good times are
ahead for BEL.
The stock is trading at attractive valuations and is factoring all
HCL Tech
1,02,759
729
1,000
37.3
the bad news.
Strong visibility for a robust 20% earnings trajectory, coupled
HDFC Bank
2,87,561
1,137
1,262
11.0
with high quality of earnings on account of high quality retail
business and strategic focus on highly rated corporates.
Back on the growth trend, expect a long term growth of 14%
Infosys
2,77,766
1,205
1,374
14.0
to be a US$20bn in FY2020.
LICHF continues to grow its retail loan book at a healthy pace
with improvement in asset quality. We expect the company to
LIC Housing Finance
22,947
455
592
30.1
post a healthy loan book which is likely to reflect in a strong
earnings growth.
Huge bid pipeline of re-development works at Delhi and other
NBCC
11,731
978
1,089
11.4
State Governments and opportunity from Smart City, positions
NBCC to report strong growth, going forward.
Source: Company, Angel Research
Mid Cap
Market Cap
CMP
Target
Upside
Company
Rationale
(` Cr)
(`)
(`)
(%)
Favorable outlook for the AC industry to augur well for
Cooling products business which is out pacing the market
Blue Star
3,836
426
481
12.8
growth. EMPPAC division's profitability to improve once
operating environment turns around.
With a focus on the low and medium income (LMI) consumer
Dewan Housing
5,605
192
270
40.6
segment, the company has increased its presence in tier-II &
III cities where the growth opportunity is immense.
Commencement of new projects, downtrend in the interest
IL&FS Transport
2,378
72
93
28.6
rate cycle, to lead to stock re-rating
Economic recovery to have favourable impact on advertising
& circulation revenue growth. Further, the acquisition of a
Jagran Prakashan
5,435
166
205
23.3
radio business (Radio City) would also boost the company's
revenue growth.
Speedier execution and speedier sales, strong revenue visibilty
Mahindra Lifespace
1,860
453
554
22.2
in short-to-long run, attractive valuations
Massive capacity expansion along with rail advantage at ICD
Navkar Corporation
2,603
183
265
45.2
as well CFS augurs well for the company
Earnings boost on back of stable material prices and
Radico Khaitan
1,170
88
125
42.1
favourable pricing environment. Valuation discount to peers
provides additional comfort
Strong brands and distribution network would boost growth
Siyaram Silk Mills
1,035
1,105
1,354
22.6
going ahead. Stock currently trades at an inexpensive
valuation.
Source: Company, Angel Research
Market Outlook
May 20, 2016
Key Upcoming Events
Result Calendar
Date
Company
Ramco Cements, Bank of India, IDBI Bank, ITC, Britannia, D B Corp, Siyaram Silk Mills, Sterling Tools, The Byke
May 20, 2016
Hospitality, Coffee Day Enterprises Ltd
May 23, 2016
BPCL, Jyothy Laboratories, HSIL, Heritage Foods, Tata Power Co., VRL Logistics, Team Lease Serv.
Tata Global, Amara Raja Batteries, J & K Bank, Power Fin.Corpn., Colgate, Tech Mahindra, MOIL, Prakash Industries,
May 24, 2016
Page Industries, Cipla
Bajaj Auto, Bosch India, Ashok Leyland, Cummins India, Thermax, LMW, Hindustan Media Ventures, Tata Steel, GAIL,
May 25, 2016
Abbott India, GSK Pharma
May 26, 2016
Tata Chemicals, India Cements, Mphasis, HT Media, Finolex Cables, Banco, GIPCL
BHEL, Crompton Greaves, St Bk of India, Canara Bank, Rural Elec.Corp., ONGC, IOC, HPCL, Cravatex, Indoco
May 27, 2016
Remedies, S H Kelkar & Co.
May 28, 2016
Coal India, Hindalco, NHPC
May 30, 2016
Tata Motors, M&M, Blue Star, SAIL, Bajaj Electrical, Hitachi, Sun Pharma, NTPC, Transport Corporation of India
Source: Bloomberg, Angel Research
Global economic events release calendar
Date
Time
Country
Event Description
Unit
Period
Bloomberg Data
Last Reported Estimated
May 20, 2016 7:30PM US
Existing home sales
Million
Apr
5.33
5.40
May 23, 2016 1:00PM Germany
PMI Services
Value
May P
54.50
54.60
7:30PM Euro Zone
Euro-Zone Consumer Confidence
Value
May A
(9.30)
(9.00)
1:00PM Germany
PMI Manufacturing
Value
May P
51.80
52.00
May 24, 2016 2:00PM UK
GDP (YoY)
% Change
1Q P
2.10
--
11:30AM Germany
GDP nsa (YoY)
% Change
1Q F
1.30
1.30
May 26, 2016 7:30PM US
New home sales
Thousands
Apr
511.00
520.00
May 27, 2016 6:00PM US
GDP Qoq (Annualised)
% Change
1Q S
0.50
0.80
May 31, 2016 1:25PM Germany
Unemployment change (000's)
Thousands
May
(16.00)
--
7:30PM US
Consumer Confidence
S.A./ 1985=100
May
94.20
--
Jun 1, 2016
2:00PM UK
PMI Manufacturing
Value
May
49.20
--
6:30AM China
PMI Manufacturing
Value
May
50.10
--
Jun 2, 2016
5:15PM Euro Zone
ECB announces interest rates
%
Jun 2
--
Jun 3, 2016
6:00PM US
Change in Nonfarm payrolls
Thousands
May
160.00
--
6:00PM US
Unnemployment rate
%
May
5.00
--
Jun 7, 2016
2:30PM Euro Zone
Euro-Zone GDP s.a. (QoQ)
% Change
1Q F
0.50
--
11:00AM India
RBI Repo rate
%
Jun 7
6.50
--
11:00AM India
RBI Reverse Repo rate
%
Jun 7
6.00
--
11:00AM India
RBI Cash Reserve ratio
%
Jun 7
4.00
--
Source: Bloomberg, Angel Research
Market Outlook
May 20, 2016
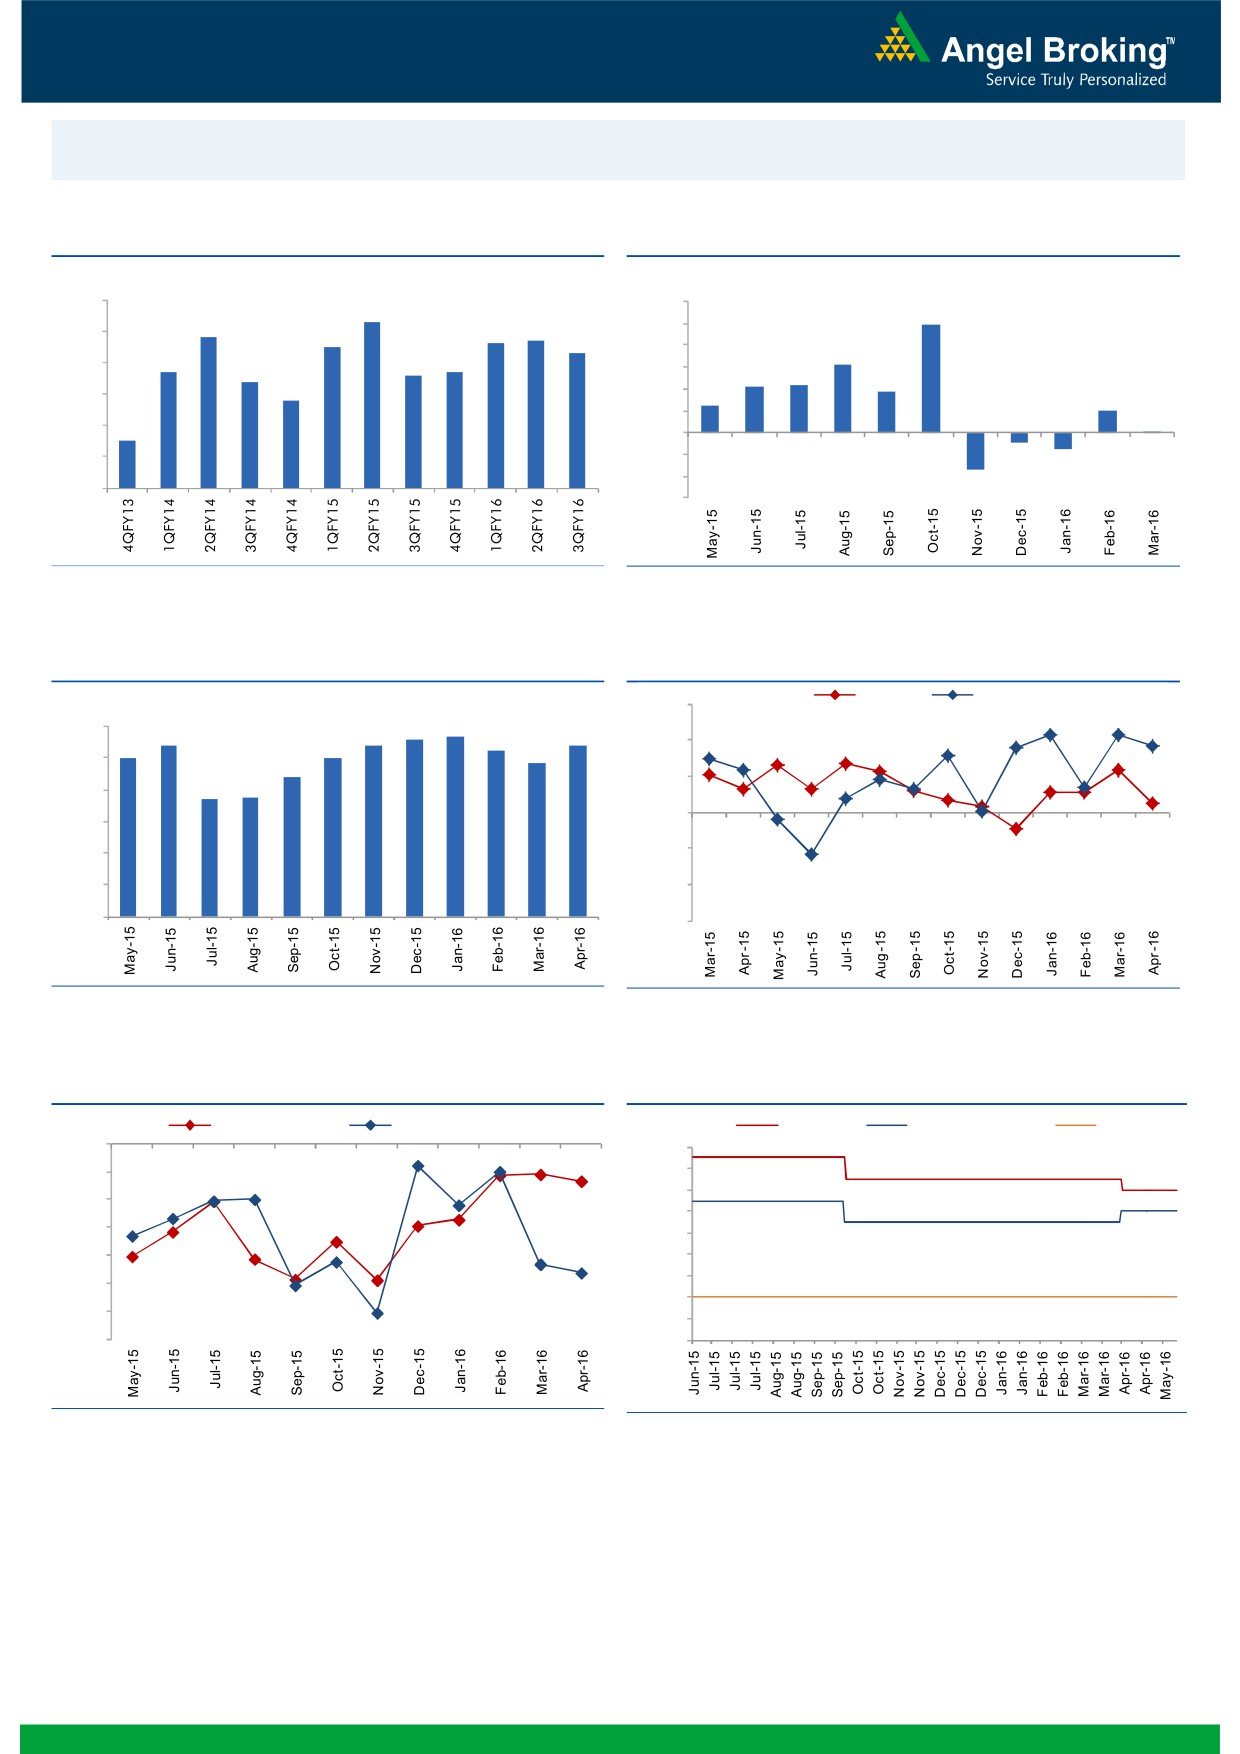
Macro watch
Exhibit 1: Quarterly GDP trends
Exhibit 2: IIP trends
(%)
(%)
9.0
8.3
12.0
9.9
7.8
7.7
8.0
7.5
7.6
10.0
7.3
8.0
6.3
6.7
6.6
6.7
7.0
6.4
6.0
4.2
4.3
3.7
5.8
4.0
2.5
6.0
2.0
2.0
0.1
5.0
4.5
-
4.0
(2.0)
(0.9)
(1.5)
(4.0)
3.0
(3.4)
(6.0)
Source: CSO, Angel Research
Source: MOSPI, Angel Research
Exhibit 3: Monthly CPI inflation trends
Exhibit 4: Manufacturing and services PMI
Mfg. PMI
Services PMI
(%)
56.0
5.6
5.7
6.0
5.4
5.4
5.4
5.3
5.0
5.0
54.0
4.8
5.0
4.4
52.0
3.7
3.7
4.0
50.0
3.0
48.0
2.0
1.0
46.0
-
44.0
Source: MOSPI, Angel Research
Source: Market, Angel Research; Note: Level above 50 indicates expansion
Exhibit 5: Exports and imports growth trends
Exhibit 6: Key policy rates
(%)
Exports yoy growth
Imports yoy growth
(%)
Repo rate
Reverse Repo rate
CRR
0.0
7.50
(5.0)
7.00
6.50
(10.0)
6.00
(15.0)
5.50
(20.0)
5.00
4.50
(25.0)
4.00
(30.0)
3.50
(35.0)
3.00
Source: Bloomberg, Angel Research
Source: RBI, Angel Research
Market Outlook
May 20, 2016
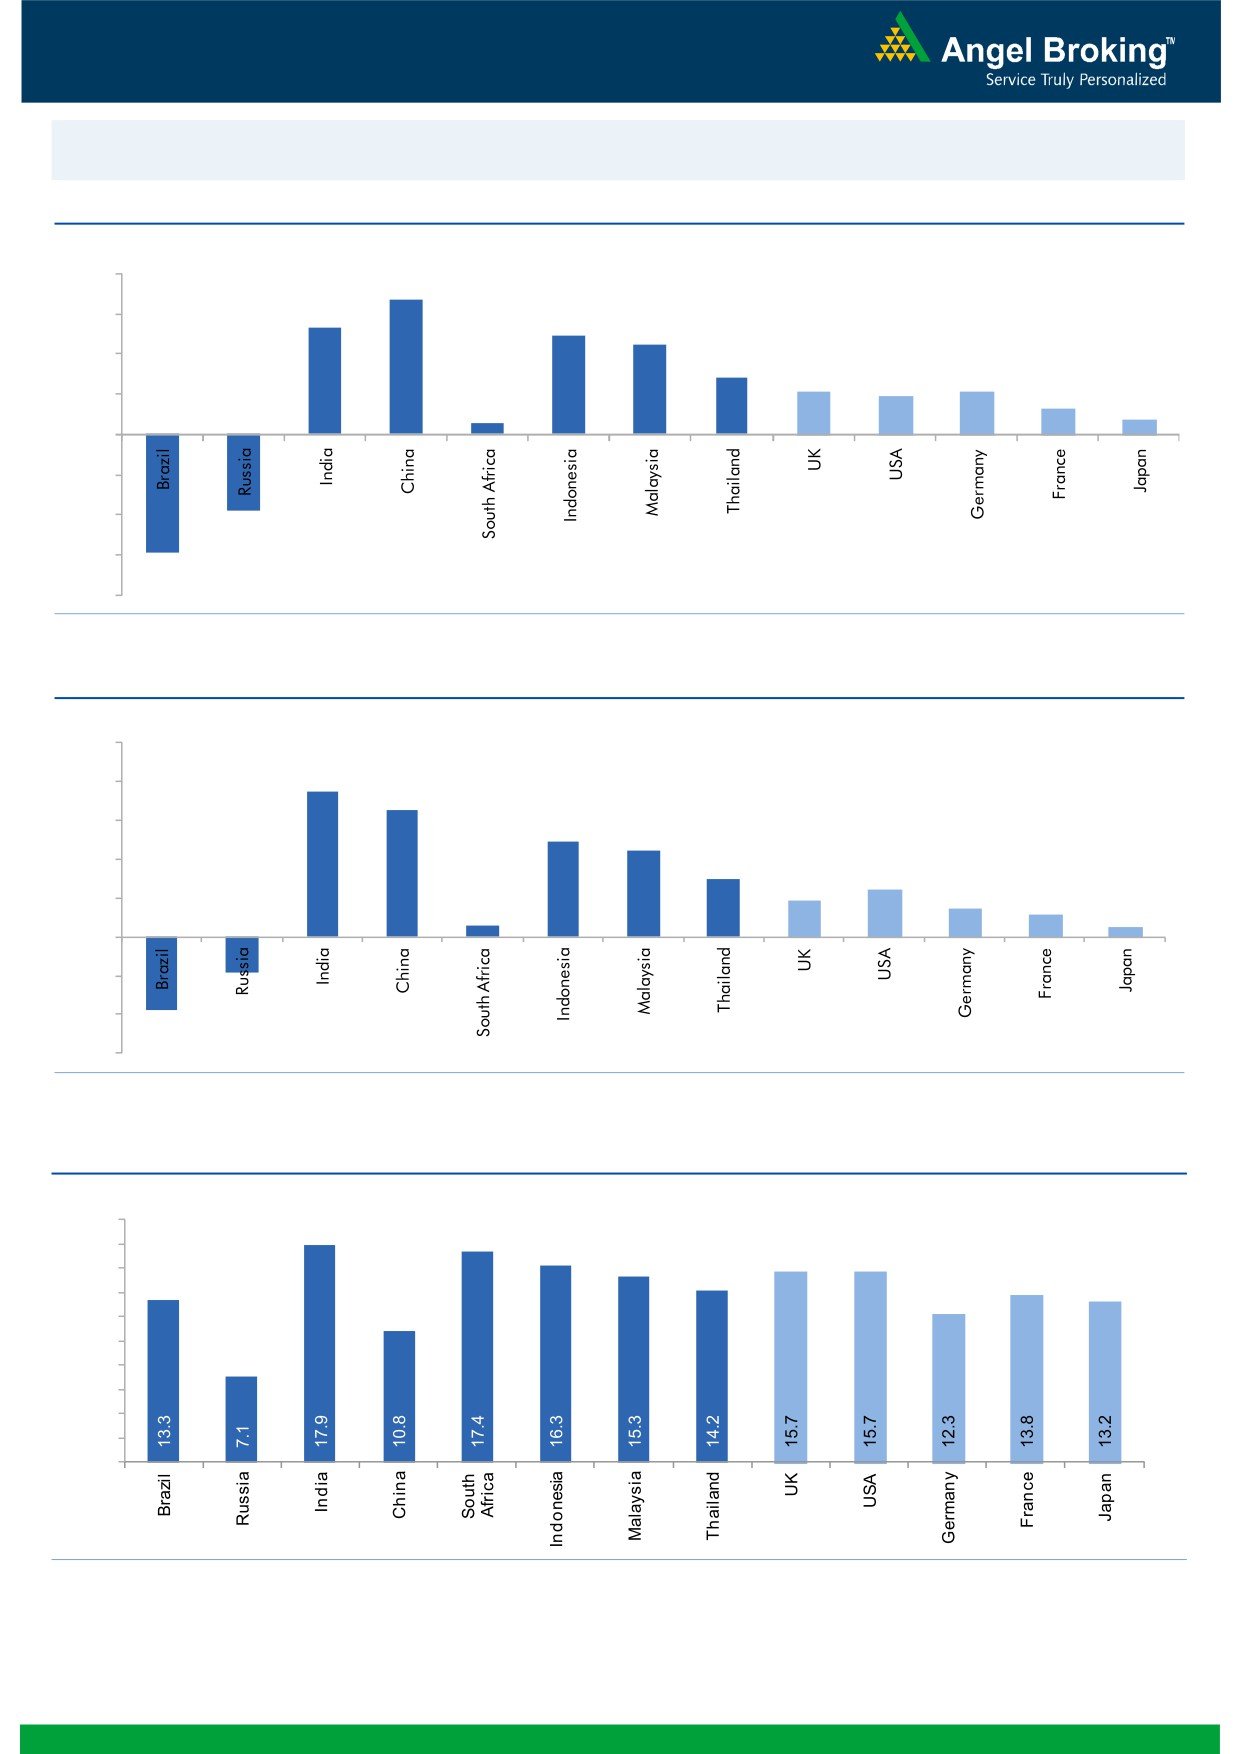
Global watch
Exhibit 1: Latest quarterly GDP Growth (%, yoy) across select developing and developed countries
(%)
8.0
6.7
6.0
5.3
4.9
4.5
4.0
2.8
2.1
1.9
2.1
1.3
2.0
0.6
0.7
-
(2.0)
(4.0)
(3.8)
(6.0)
(5.9)
(8.0)
Source: Bloomberg, Angel Research
Exhibit 2: 2016 GDP Growth projection by IMF (%, yoy) across select developing and developed countries
(%)
10.0
7.5
8.0
6.5
6.0
4.9
4.4
4.0
3.0
2.4
1.9
1.5
2.0
1.1
0.6
0.5
(3.8)
(1.8)
-
(2.0)
(4.0)
(6.0)
Source: IMF, Angel Research
Exhibit 3: One year forward P-E ratio across select developing and developed countries
(x)
20.0
18.0
16.0
14.0
12.0
10.0
8.0
6.0
4.0
2.0
-
Source: IMF, Angel Research
Market Outlook
May 20, 2016
Exhibit 4: Relative performance of indices across globe
Returns (%)
Country
Name of index
Closing price
1M
3M
1YR
Brazil
Bovespa
50,133
(5.2)
20.4
(11.1)
Russia
Micex
1,892
(1.3)
9.6
14.0
India
Nifty
7,783
(1.7)
11.6
(5.4)
China
Shanghai Composite
2,807
(8.1)
(2.3)
(36.1)
South Africa
Top 40
46,313
(1.0)
7.4
(3.8)
Mexico
Mexbol
45,051
(1.6)
4.5
(0.1)
Indonesia
LQ45
802
(5.2)
(3.7)
(10.9)
Malaysia
KLCI
1,634
(4.9)
(2.8)
(9.6)
Thailand
SET 50
884
1.8
7.6
(11.3)
USA
Dow Jones
17,435
(3.4)
6.2
(4.7)
UK
FTSE
6,053
(4.7)
3.3
(13.9)
Japan
Nikkei
16,647
1.6
11.3
(15.2)
Germany
DAX
9,796
(3.2)
7.2
(17.1)
France
CAC
4,283
(6.2)
1.2
(16.6)
Source: Bloomberg, Angel Research
Stock Watch
May 20, 2016
Company Name
Reco
CMP
Target
Mkt Cap
Sales ( Čcr )
OPM(%)
EPS (Č)
PER(x)
P/BV(x)
RoE(%)
EV/Sales(x)
(Č)
Price ( Č)
( Č cr )
FY16E FY17E
FY16E
FY17E
FY16E
FY17E
FY16E
FY17E
FY16E
FY17E
FY16E
FY17E
FY16E
FY17E
Agri / Agri Chemical
Rallis
Neutral
213
-
4,143
1,612
1,911
13.3
13.3
7.4
9.5
28.8
22.4
4.6
4.1
16.7
18.4
2.6
2.2
United Phosphorus
Buy
560
684
24,021
13,083
15,176
18.5
18.5
31.5
37.4
17.8
15.0
3.5
2.9
21.4
21.4
2.1
1.8
Auto & Auto Ancillary
Ashok Leyland
Accumulate
102
111
28,999
17,995
21,544
11.4
11.6
3.4
4.7
30.0
21.7
5.3
4.8
17.7
22.2
1.6
1.3
Bajaj Auto
Neutral
2,441
-
70,626
22,709
25,860
20.9
20.1
129.0
143.6
18.9
17.0
5.8
5.0
30.7
29.4
2.7
2.4
Bharat Forge
Buy
719
875
16,737
7,351
8,318
19.9
19.7
31.2
36.5
23.0
19.7
4.1
3.5
19.3
19.2
2.5
2.2
Eicher Motors
Accumulate
18,201
20,044
49,435
15,556
16,747
15.5
17.3
464.8
597.5
39.2
30.5
14.3
10.5
36.2
34.3
3.2
2.9
Gabriel India
Accumulate
91
101
1,304
1,415
1,544
8.7
9.0
4.6
5.4
19.7
16.8
3.6
3.2
18.1
18.9
0.9
0.8
Hero Motocorp
Neutral
2,890
-
57,716
28,244
30,532
15.5
15.9
156.7
168.5
18.4
17.2
7.4
6.3
39.9
36.4
1.9
1.7
Jamna Auto Industries Accumulate
143
160
1,143
1,281
1,473
11.2
11.5
7.6
9.2
18.8
15.6
4.8
3.9
25.4
25.2
1.0
0.8
L G Balakrishnan & Bros Neutral
480
-
753
1,254
1,394
11.6
11.8
35.9
41.7
13.4
11.5
1.8
1.6
13.5
13.8
0.7
0.6
Mahindra and Mahindra Neutral
1,309
-
81,323
38,416
42,904
13.7
13.9
54.8
63.4
23.9
20.7
3.7
3.3
15.4
15.8
1.8
1.6
Maruti
Neutral
3,927
-
118,622
57,865
68,104
16.4
16.7
176.3
225.5
22.3
17.4
4.3
3.7
19.4
21.2
1.8
1.5
Minda Industries
Neutral
1,083
-
1,719
2,523
2,890
8.7
9.0
55.0
65.4
19.7
16.6
3.8
3.1
19.3
18.7
0.8
0.7
Motherson Sumi
Accumulate
272
313
35,919
39,343
45,100
8.8
9.1
10.1
12.5
26.9
21.7
8.5
6.7
35.3
34.4
1.1
0.9
Rane Brake Lining
Buy
377
465
298
454
511
11.5
12.0
25.2
31.0
15.0
12.2
2.2
2.0
14.9
16.6
0.8
0.7
Setco Automotive
Neutral
32
-
422
594
741
12.7
13.7
1.7
3.2
18.6
9.9
2.0
1.7
10.4
16.9
1.2
1.0
Tata Motors
Neutral
388
-
111,937
259,686
273,957
13.0
13.4
25.9
29.5
15.0
13.1
2.0
1.7
8.0
9.0
0.6
0.6
TVS Motor
Accumulate
296
330
14,058
11,263
13,122
6.9
8.5
9.2
15.0
32.2
19.7
7.3
5.8
22.7
29.6
1.2
1.0
Amara Raja Batteries
Accumulate
943
1,076
16,112
4,892
5,871
17.4
17.6
28.8
37.1
32.8
25.4
7.6
6.1
23.4
24.1
3.3
2.7
Exide Industries
Accumulate
150
162
12,729
6,950
7,784
14.4
14.8
6.6
7.3
22.7
20.5
2.9
2.6
12.6
12.8
1.5
1.4
Apollo Tyres
Buy
151
183
7,668
12,056
12,714
17.2
16.4
23.0
20.3
6.6
7.4
1.2
1.0
17.7
13.6
0.7
0.7
Ceat
Accumulate
963
1,119
3,894
6,041
6,597
14.1
13.7
99.5
111.9
9.7
8.6
1.9
1.6
19.6
18.5
0.8
0.7
JK Tyres
Neutral
84
-
1,905
7,446
7,669
15.2
14.0
19.6
18.4
4.3
4.6
1.1
0.9
25.2
19.5
0.7
0.6
Swaraj Engines
Neutral
1,100
-
1,366
552
630
14.2
14.7
44.6
54.1
24.7
20.3
5.7
5.2
23.2
25.6
2.3
2.0
Subros
Neutral
105
-
630
1,293
1,527
11.8
11.9
4.2
6.7
25.0
15.7
1.9
1.7
7.7
11.5
0.8
0.6
Indag Rubber
Neutral
189
-
495
283
329
17.0
17.2
13.0
15.4
14.6
12.2
3.2
2.6
21.8
21.6
1.5
1.2
Capital Goods
ACE
Neutral
43
-
423
660
839
4.7
8.2
1.0
3.9
42.8
11.0
1.3
1.2
3.2
11.3
0.8
0.6
BEML
Buy
876
1,157
3,649
3,277
4,006
6.0
8.9
36.2
64.3
24.2
13.6
1.7
1.5
5.7
11.7
1.2
1.0
Bharat Electronics
Buy
1,118
1,414
26,827
7,737
8,634
16.8
17.2
54.0
61.5
20.7
18.2
3.0
2.6
39.3
45.6
2.6
2.2
Stock Watch
May 20, 2016
Company Name
Reco
CMP
Target
Mkt Cap
Sales ( Čcr )
OPM(%)
EPS (Č)
PER(x)
P/BV(x)
RoE(%)
EV/Sales(x)
(Č)
Price ( Č)
( Č cr )
FY16E
FY17E
FY16E
FY17E
FY16E
FY17E
FY16E
FY17E
FY16E
FY17E
FY16E
FY17E
FY16E
FY17E
Capital Goods
Voltas
Accumulate
324
353
10,716
5,363
5,963
8.0
9.1
11.0
13.8
29.4
23.5
4.5
4.0
16.2
17.9
2.0
1.8
BGR Energy
Neutral
109
-
787
3,615
3,181
9.5
9.4
16.7
12.4
6.5
8.8
0.6
0.6
10.0
7.0
0.6
0.8
BHEL
Neutral
119
-
29,175
33,722
35,272
10.8
11.7
10.5
14.2
11.4
8.4
0.8
0.8
7.0
9.0
1.0
0.9
Blue Star
Accumulate
426
481
3,836
3,548
3,977
6.3
6.9
13.7
17.2
31.1
24.9
7.8
5.1
26.1
25.4
1.2
1.0
Crompton Greaves
Neutral
61
-
3,807
13,484
14,687
4.9
6.2
4.5
7.1
13.5
8.6
1.0
0.9
7.2
10.8
0.4
0.4
Greaves Cotton
Neutral
139
-
3,390
1,655
1,755
16.6
16.8
7.4
7.8
18.8
17.8
3.8
3.6
21.1
20.6
2.0
1.9
Inox Wind
Buy
237
286
5,261
4,406
5,605
15.5
15.7
20.4
24.8
11.6
9.6
2.7
2.0
27.9
25.9
1.4
1.1
KEC International
Neutral
131
-
3,376
8,791
9,716
6.1
6.8
5.4
8.2
24.3
16.0
2.4
2.2
10.0
14.0
0.6
0.6
Thermax
Neutral
731
-
8,710
6,413
7,525
7.4
8.5
30.5
39.3
24.0
18.6
3.7
3.2
15.0
17.0
1.4
1.1
VATech Wabag
Neutral
579
-
3,156
2,722
3,336
7.9
8.1
19.5
24.6
29.7
23.5
3.1
2.8
11.1
12.4
1.3
1.0
Cement
ACC
Neutral
1,412
-
26,512
13,151
14,757
16.4
18.3
63.9
83.4
22.1
16.9
2.8
2.6
13.3
16.1
1.9
1.6
Ambuja Cements
Neutral
214
-
33,156
11,564
12,556
19.4
20.7
8.9
10.1
24.0
21.2
3.0
2.9
12.8
13.8
2.6
2.3
HeidelbergCement
Neutral
93
-
2,111
1,772
1,926
13.3
15.4
1.0
3.0
93.2
31.1
2.4
2.2
2.6
7.9
1.8
1.6
India Cements
Neutral
86
-
2,656
4,216
4,840
18.0
19.5
4.0
9.9
21.6
8.7
0.9
0.8
4.0
9.5
1.0
0.8
JK Cement
Neutral
584
-
4,084
3,661
4,742
10.1
15.8
7.5
28.5
77.9
20.5
2.3
2.1
7.5
22.9
1.6
1.2
J K Lakshmi Cement
Neutral
357
-
4,199
2,947
3,616
16.7
19.9
11.5
27.2
31.0
13.1
2.9
2.5
9.8
20.8
1.8
1.4
Mangalam Cements
Neutral
252
-
673
1,053
1,347
10.5
13.3
8.4
26.0
30.0
9.7
1.3
1.2
4.3
12.5
1.0
0.8
Orient Cement
Neutral
158
-
3,235
1,854
2,524
21.2
22.2
7.7
11.1
20.5
14.2
3.0
2.5
13.3
15.7
2.5
1.7
Ramco Cements
Neutral
491
-
11,678
4,036
4,545
20.8
21.3
15.1
18.8
32.5
26.1
4.0
3.5
12.9
14.3
3.4
2.9
Shree Cement^
Neutral
13,500
-
47,032
7,150
8,742
26.7
28.6
228.0
345.5
59.2
39.1
8.7
7.3
15.7
20.3
6.0
4.9
UltraTech Cement
Neutral
3,182
-
87,315
24,669
29,265
18.2
20.6
82.0
120.0
38.8
26.5
4.2
3.7
11.3
14.7
3.7
3.1
Construction
ITNL
Buy
72
93
2,378
7,360
8,825
34.0
35.9
7.0
9.0
10.3
8.0
0.4
0.3
3.2
3.7
3.7
3.6
KNR Constructions
Buy
526
603
1,479
937
1,470
14.3
14.0
44.2
38.6
11.9
13.6
2.4
2.1
15.4
15.4
1.6
1.1
Larsen & Toubro
Neutral
1,267
-
118,063
58,870
65,708
8.3
10.3
42.0
53.0
30.2
23.9
2.1
1.9
8.8
11.2
2.3
2.0
Gujarat Pipavav Port
Neutral
159
-
7,696
629
684
51.0
52.2
6.4
5.9
24.9
27.0
3.3
3.0
15.9
12.7
12.1
11.0
MBL Infrastructures
Buy
133
285
551
2,313
2,797
12.2
14.6
19.0
20.0
7.0
6.6
0.7
0.7
11.3
10.6
0.9
0.8
Nagarjuna Const.
Neutral
75
-
4,150
7,892
8,842
8.8
9.1
3.0
5.3
24.9
14.1
1.2
1.2
5.0
8.5
0.8
0.6
PNC Infratech
Neutral
565
-
2,900
1,873
2,288
13.2
13.5
24.0
32.0
23.6
17.7
2.3
2.0
12.1
12.3
1.6
1.3
Simplex Infra
Neutral
266
-
1,315
5,955
6,829
10.3
10.5
16.0
31.0
16.6
8.6
0.9
0.8
5.3
9.9
0.7
0.6
Stock Watch
May 20, 2016
Company Name
Reco
CMP
Target
Mkt Cap
Sales ( Čcr )
OPM(%)
EPS (Č)
PER(x)
P/BV(x)
RoE(%)
EV/Sales(x)
(Č)
Price ( Č)
( Č cr )
FY16E
FY17E
FY16E
FY17E
FY16E
FY17E
FY16E
FY17E
FY16E
FY17E
FY16E
FY17E
FY16E
FY17E
Construction
Power Mech Projects
Neutral
606
-
892
1,539
1,801
12.8
12.7
59.0
72.1
10.3
8.4
1.6
1.3
18.6
16.8
0.6
0.5
Sadbhav Engineering
Accumulate
255
298
4,379
3,186
3,598
10.2
10.3
8.0
9.0
31.9
28.4
3.0
2.6
9.4
9.9
1.8
1.6
NBCC
Accumulate
978
1,089
11,731
5,816
7,382
6.9
7.7
29.6
39.8
33.0
24.6
5.9
4.7
24.1
26.7
1.8
1.3
MEP Infra
Neutral
40
-
656
1,956
1,876
28.1
30.5
1.3
3.0
31.0
13.5
6.5
4.4
21.2
32.8
1.8
1.7
SIPL
Neutral
100
-
3,505
675
1,042
62.4
64.7
-
-
3.7
4.3
-
-
16.8
11.3
Engineers India
Neutral
181
-
6,090
1,667
1,725
13.5
16.0
9.7
11.4
18.6
15.9
2.2
2.1
11.7
13.4
2.5
2.5
Financials
Allahabad Bank
Neutral
52
-
3,164
8,569
9,392
2.8
2.9
16.3
27.5
3.2
1.9
0.3
0.2
7.6
11.9
-
-
Axis Bank
Neutral
490
-
116,923
26,204
29,738
3.6
3.5
34.5
35.4
14.2
13.8
2.2
2.0
16.8
14.9
-
-
Bank of Baroda
Neutral
137
-
31,579
18,802
21,088
2.0
2.2
(7.4)
13.0
10.5
1.1
0.9
(4.2)
7.3
-
-
Bank of India
Neutral
82
-
7,701
15,972
17,271
1.9
2.0
15.3
33.4
5.4
2.5
0.2
0.2
3.6
7.6
-
-
Canara Bank
Neutral
179
-
9,701
15,441
16,945
2.0
2.1
46.6
70.4
3.8
2.5
0.3
0.3
8.0
11.2
-
-
Dena Bank
Neutral
29
-
1,944
3,440
3,840
2.1
2.3
7.3
10.0
4.0
2.9
0.3
0.3
6.1
7.9
-
-
Dewan Housing Finance Buy
192
270
5,605
1,828
2,225
2.9
3.0
24.9
29.7
7.7
6.5
1.2
1.0
15.1
16.1
-
-
Federal Bank
Neutral
50
-
8,539
3,279
3,787
2.8
2.9
3.9
5.5
12.6
9.0
1.0
0.9
8.4
10.8
-
-
HDFC
Neutral
1,177
-
185,900
10,358
11,852
3.3
3.3
41.1
47.0
28.7
25.0
5.5
5.0
24.7
24.9
-
-
HDFC Bank
Accumulate
1,137
1,262
287,561
38,606
47,696
4.4
4.5
48.8
61.4
23.3
18.5
4.0
3.4
18.7
20.0
-
-
ICICI Bank
Accumulate
226
243
131,169
34,279
39,262
3.3
3.3
21.0
24.4
10.8
9.3
1.8
1.5
14.4
14.7
-
-
IDBI Bank
Neutral
64
-
13,259
9,625
10,455
1.8
1.8
8.5
14.2
7.6
4.5
0.5
0.4
5.9
9.3
-
-
Indian Bank
Neutral
90
-
4,339
6,160
6,858
2.5
2.5
24.5
29.8
3.7
3.0
0.3
0.3
7.7
8.6
-
-
LIC Housing Finance
Buy
455
592
22,947
3,179
3,758
2.6
2.6
32.9
40.6
13.8
11.2
2.6
2.2
19.6
20.7
-
-
Oriental Bank
Neutral
81
-
2,813
7,643
8,373
2.4
2.4
37.2
45.4
2.2
1.8
0.2
0.2
8.2
9.4
-
-
Punjab Natl.Bank
Neutral
74
-
14,540
23,122
26,022
2.8
2.8
7.0
21.6
10.6
3.4
0.5
0.5
3.4
10.0
-
-
South Ind.Bank
Neutral
18
-
2,437
1,965
2,185
2.5
2.5
2.5
3.3
7.2
5.5
0.7
0.7
9.5
11.7
-
-
St Bk of India
Neutral
173
-
134,218
79,958
86,061
2.6
2.6
13.4
20.7
12.9
8.4
1.1
1.0
11.5
12.8
-
-
Union Bank
Neutral
107
-
7,349
12,646
14,129
2.3
2.4
31.0
39.1
3.5
2.7
0.4
0.3
9.8
11.4
-
-
Vijaya Bank
Neutral
30
-
2,840
3,536
3,827
1.9
1.9
5.5
6.7
5.5
4.6
0.5
0.4
7.8
8.8
-
-
Yes Bank
Neutral
967
-
40,687
7,190
9,011
3.2
3.3
58.2
69.7
16.6
13.9
3.0
2.5
19.2
19.6
-
-
FMCG
Asian Paints
Neutral
957
-
91,790
16,553
19,160
16.0
16.2
17.7
21.5
54.1
44.5
14.4
12.9
29.4
31.2
5.5
4.7
Britannia
Neutral
2,995
-
35,930
8,481
9,795
14.0
14.1
65.5
78.3
45.7
38.3
21.6
17.8
38.3
41.2
4.2
3.6
Stock Watch
May 20, 2016
Company Name
Reco
CMP
Target
Mkt Cap
Sales ( Čcr )
OPM(%)
EPS (Č)
PER(x)
P/BV(x)
RoE(%)
EV/Sales(x)
(Č)
Price ( Č)
( Č cr )
FY16E FY17E
FY16E
FY17E
FY16E
FY17E
FY16E
FY17E
FY16E
FY17E
FY16E
FY17E
FY16E
FY17E
FMCG
Colgate
Neutral
821
-
22,319
4,136
4,632
22.5
23.3
22.2
25.3
37.0
32.4
22.5
20.0
68.6
67.5
5.3
4.7
Dabur India
Neutral
282
-
49,520
9,370
10,265
17.6
17.3
7.3
8.1
38.4
34.8
10.0
9.1
31.7
30.6
5.1
4.7
GlaxoSmith Con*
Neutral
5,821
-
24,479
4,519
5,142
19.6
19.8
164.3
191.2
35.4
30.4
9.8
8.4
30.8
29.9
5.1
4.4
Godrej Consumer
Neutral
1,362
-
46,396
9,003
10,335
18.1
18.7
34.1
41.8
40.0
32.6
8.6
7.4
23.9
24.8
5.4
4.7
HUL
Neutral
815
-
176,415
33,299
35,497
17.1
17.1
18.9
20.0
43.1
40.8
21.9
25.1
87.6
80.8
5.2
4.9
ITC
Accumulate
325
359
261,454
36,804
38,776
37.9
37.9
12.2
12.9
26.6
25.2
7.4
6.5
27.7
25.8
6.8
6.4
Marico
Neutral
248
-
32,016
6,151
6,966
17.2
17.3
5.4
6.4
46.0
38.8
14.4
11.4
33.2
32.4
5.1
4.5
Nestle*
Neutral
6,092
-
58,735
9,393
10,507
22.2
22.3
106.8
121.8
57.0
50.0
20.0
18.0
34.8
36.7
6.2
5.5
Tata Global
Accumulate
120
137
7,570
8,635
9,072
9.8
9.9
5.8
7.2
20.7
16.7
1.8
1.8
6.8
7.4
0.9
0.9
Procter & Gamble
Accumulate
6,429
7,369
20,869
2,588
2,939
23.3
23.2
130.2
146.2
49.4
44.0
98.5
94.4
27.6
25.3
7.7
6.7
Hygiene
IT
HCL Tech^
Buy
729
1,000
102,759
37,061
30,781
21.5
20.5
51.4
40.0
14.2
18.2
3.7
2.7
20.1
20.3
2.5
2.7
Infosys
Accumulate
1,205
1,374
277,766
62,441
70,558
27.5
27.5
59.0
65.3
20.4
18.5
4.1
3.7
22.2
22.4
3.9
3.4
TCS
Buy
2,556
3,004
503,553
108,646
122,770
28.3
28.3
123.7
141.0
20.7
18.1
6.8
6.3
33.1
34.6
4.2
3.6
Tech Mahindra
Accumulate
483
530
46,836
26,524
29,177
16.2
17.0
28.8
33.6
16.8
14.4
3.2
2.7
19.3
19.1
1.5
1.3
Wipro
Buy
543
680
134,086
50,808
56,189
23.7
23.8
37.3
40.7
14.6
13.3
2.8
2.5
19.2
17.7
2.1
1.7
Media
D B Corp
Accumulate
318
356
5,839
2,025
2,187
27.4
27.4
17.4
18.9
18.3
16.9
4.1
3.8
22.9
23.7
3.0
2.7
HT Media
Neutral
88
-
2,049
2,495
2,673
12.9
13.2
6.8
7.2
13.0
12.2
1.0
1.0
7.5
7.8
0.4
0.3
Jagran Prakashan
Buy
166
205
5,435
2,170
2,355
27.2
26.2
8.9
9.9
18.7
16.8
3.9
3.4
20.9
20.5
2.5
2.3
Sun TV Network
Neutral
371
-
14,617
2,510
2,763
71.8
71.5
21.9
24.8
16.9
15.0
4.0
3.6
22.8
24.3
6.2
5.7
Hindustan Media
Neutral
277
-
2,029
914
1,016
21.7
21.5
21.9
23.3
12.6
11.9
2.3
1.9
18.0
16.2
1.6
1.4
Ventures
Metals & Mining
Coal India
Buy
280
380
176,921
76,167
84,130
19.9
22.3
22.4
25.8
12.5
10.8
4.5
4.4
35.5
41.0
1.7
1.5
Hind. Zinc
Neutral
166
-
70,140
14,641
14,026
50.4
50.4
17.7
16.0
9.4
10.4
1.4
1.3
16.2
13.2
2.5
2.3
Hindalco
Neutral
87
-
17,976
104,356
111,186
8.7
9.5
6.7
11.1
13.0
7.9
0.5
0.5
3.5
5.9
0.7
0.6
JSW Steel
Neutral
1,320
-
31,913
42,308
45,147
16.4
20.7
(10.3)
49.5
26.7
1.5
1.4
(1.0)
5.6
1.8
1.7
NMDC
Neutral
90
-
35,663
8,237
10,893
46.6
44.5
10.0
11.7
9.0
7.7
1.0
0.9
12.5
13.0
4.1
3.1
SAIL
Neutral
40
-
16,520
45,915
53,954
7.2
10.5
1.5
4.4
26.6
9.1
0.4
0.4
2.3
4.1
1.0
0.9
Vedanta
Neutral
95
-
28,150
71,445
81,910
26.2
26.3
12.9
19.2
7.4
5.0
0.5
0.5
7.2
8.9
0.9
0.7
Tata Steel
Neutral
326
-
31,671
126,760
137,307
8.9
11.3
6.4
23.1
51.3
14.1
1.0
1.0
2.0
7.1
0.8
0.8
Oil & Gas
Cairn India
Neutral
135
-
25,367
11,323
12,490
49.4
51.0
20.7
20.7
6.5
6.6
0.4
0.4
6.4
6.1
1.4
0.8
Stock Watch
May 20, 2016
Company Name
Reco
CMP
Target
Mkt Cap
Sales ( Čcr )
OPM(%)
EPS (Č)
PER(x)
P/BV(x)
RoE(%)
EV/Sales(x)
(Č)
Price ( Č)
( Č cr )
FY16E FY17E
FY16E
FY17E
FY16E
FY17E
FY16E
FY17E
FY16E
FY17E
FY16E
FY17E
FY16E
FY17E
Oil & Gas
GAIL
Neutral
372
-
47,175
64,856
70,933
9.1
9.6
24.0
28.9
15.5
12.9
1.3
1.2
8.8
9.6
0.9
0.8
ONGC
Neutral
210
-
179,665
154,564
145,998
36.8
37.4
20.8
22.6
10.1
9.3
1.0
0.9
10.1
9.7
1.4
1.5
Petronet LNG
Neutral
267
-
20,036
29,691
31,188
5.8
6.2
12.8
13.4
20.9
19.9
3.1
2.8
15.8
14.8
0.8
0.7
Indian Oil Corp
Accumulate
412
455
100,020
359,607
402,760
5.9
6.1
42.5
48.7
9.7
8.5
1.3
1.2
14.1
14.4
0.4
0.3
Reliance Industries
Buy
951
1,150
308,100
304,775
344,392
12.6
13.4
91.3
102.6
10.4
9.3
1.2
1.1
11.8
12.0
1.0
0.8
Pharmaceuticals
Alembic Pharma
Neutral
556
-
10,481
3,274
3,802
26.9
19.4
35.0
28.7
15.9
19.4
7.0
5.3
55.6
31.2
3.3
2.7
Aurobindo Pharma
Accumulate
770
856
45,061
14,923
17,162
22.0
23.0
35.7
42.8
21.6
18.0
6.3
4.8
34.0
30.2
3.4
2.9
Aventis*
Accumulate
4,292
4,738
9,884
2,049
2,375
15.4
17.3
115.4
153.5
37.2
28.0
6.1
4.7
19.3
25.8
4.6
3.9
Cadila Healthcare
Accumulate
325
352
33,220
10,224
11,840
21.0
22.0
14.6
17.6
22.2
18.4
6.1
4.8
30.8
29.0
3.3
2.8
Cipla
Buy
513
605
41,181
13,979
16,447
20.2
18.6
25.7
27.5
20.0
18.6
3.3
2.8
17.6
16.1
3.0
2.5
Dr Reddy's
Buy
3,021
3,476
51,526
15,471
17,479
24.6
24.6
138.2
152.4
21.9
19.8
4.0
3.4
19.7
18.7
3.3
2.9
Dishman Pharma
Neutral
165
-
2,657
1,733
1,906
21.5
21.5
10.1
10.0
16.3
16.5
1.9
1.7
10.5
11.2
2.0
1.7
GSK Pharma*
Neutral
3,345
-
28,330
2,870
3,158
20.0
22.1
59.5
68.3
56.2
49.0
16.6
17.0
28.5
34.3
9.6
8.8
Indoco Remedies
Neutral
261
-
2,401
1,033
1,199
15.9
18.2
9.4
13.6
27.7
19.2
4.1
3.5
15.7
19.7
2.4
2.1
Ipca labs
Buy
448
750
5,654
3,363
3,909
12.9
18.6
13.4
28.0
33.4
16.0
2.4
2.1
7.4
14.0
2.0
1.7
Lupin
Neutral
1,656
-
74,626
13,092
16,561
25.0
27.0
50.4
68.3
32.9
24.2
6.8
5.4
22.8
24.7
5.3
4.0
Sun Pharma
Buy
792
950
190,706
28,163
32,610
25.8
30.7
17.4
26.9
45.5
29.5
4.3
3.7
13.0
16.6
6.3
5.2
Power
Tata Power
Neutral
68
-
18,500
35,923
37,402
22.6
22.8
4.1
5.2
16.9
13.3
1.3
1.2
7.5
9.3
1.5
1.4
NTPC
Accumulate
135
146
111,685
87,271
99,297
23.5
23.5
11.8
13.3
11.5
10.2
1.3
1.2
11.5
12.2
2.3
2.1
Power Grid
Buy
144
170
75,309
20,702
23,361
86.7
86.4
12.1
13.2
11.9
10.9
1.8
1.6
15.6
15.1
8.6
8.0
Real Estate
MLIFE
Buy
453
554
1,860
826
1,133
20.1
21.8
22.6
30.7
20.1
14.8
1.2
1.1
6.0
7.4
4.1
2.8
Telecom
Bharti Airtel
Neutral
345
-
137,870
101,748
109,191
32.1
31.7
12.0
12.5
28.7
27.6
2.0
1.9
6.9
6.7
2.0
1.8
Idea Cellular
Neutral
108
-
38,706
34,282
36,941
32.0
31.5
5.9
6.2
18.2
17.3
1.7
1.5
9.9
9.3
1.7
1.7
zOthers
Abbott India
Neutral
4,655
-
9,892
2,715
3,153
14.5
14.1
134.3
152.2
34.7
30.6
8.7
7.1
27.4
25.6
3.4
2.8
Bajaj Electricals
Neutral
229
-
2,311
4,719
5,287
5.2
5.8
8.6
12.7
26.8
18.1
3.1
2.7
11.4
14.8
0.5
0.5
Finolex Cables
Neutral
284
-
4,339
2,520
2,883
12.2
12.0
12.7
14.2
22.4
20.0
3.1
2.7
13.6
13.5
1.5
1.3
Goodyear India*
Accumulate
507
582
1,169
1,800
1,600
11.7
11.5
58.7
52.9
8.6
9.6
1.9
1.7
24.6
18.7
0.4
0.4
Hitachi
Neutral
1,377
-
3,743
1,779
2,081
7.8
8.8
21.8
33.4
63.2
41.2
10.2
8.2
17.4
22.1
2.2
1.8
Jyothy Laboratories
Neutral
310
-
5,613
1,620
1,847
11.5
11.5
7.3
8.5
42.5
36.6
5.5
5.1
13.3
14.4
3.4
2.9
Stock Watch
May 20, 2016
Company Name
Reco
CMP
Target
Mkt Cap
Sales ( Čcr )
OPM(%)
EPS (Č)
PER(x)
P/BV(x)
RoE(%)
EV/Sales(x)
(Č)
Price ( Č)
( Č cr )
FY16E
FY17E
FY16E
FY17E
FY16E
FY17E
FY16E
FY17E
FY16E
FY17E
FY16E
FY17E
FY16E
FY17E
zOthers
MRF
Buy
32,579
45,575
13,817
20,316
14,488
21.4
21.1
5,488.0
3,798.0
5.9
8.6
2.0
1.6
41.1
21.2
0.6
0.8
Page Industries
Neutral
13,268
-
14,798
1,929
2,450
19.8
20.1
229.9
299.0
57.7
44.4
25.5
17.7
52.1
47.1
7.7
6.0
Relaxo Footwears
Neutral
485
-
5,823
1,767
2,152
12.3
12.5
19.3
25.1
25.2
19.4
6.2
4.8
27.7
27.8
3.4
2.7
Siyaram Silk Mills
Buy
1,105
1,354
1,035
1,636
1,815
11.5
11.5
89.9
104.1
12.3
10.6
2.0
1.8
17.9
17.8
0.8
0.7
Styrolution ABS India* Neutral
620
-
1,090
1,271
1,440
8.6
9.2
32.0
41.1
19.4
15.1
2.0
1.8
10.7
12.4
0.8
0.7
TVS Srichakra
Buy
2,364
2,932
1,810
2,035
2,252
15.9
15.3
248.6
268.1
9.5
8.8
4.2
3.0
43.6
33.9
0.9
0.8
HSIL
Neutral
310
-
2,239
2,123
2,384
16.1
16.5
15.0
18.9
20.6
16.4
1.6
1.5
8.0
9.4
1.4
1.2
Kirloskar Engines India
Neutral
257
-
3,717
2,403
2,554
8.6
9.9
9.2
10.5
28.0
24.5
2.7
2.6
9.7
10.7
1.2
1.1
Ltd
M M Forgings
Buy
463
546
558
511
615
21.7
21.6
43.1
55.8
10.7
8.3
2.0
1.6
19.9
21.2
1.3
1.0
Banco Products (India) Neutral
126
-
904
1,208
1,353
11.0
12.3
10.8
14.5
11.7
8.7
1.3
1.2
11.9
14.5
0.7
0.6
Competent Automobiles Neutral
148
-
91
1,040
1,137
3.2
3.1
25.7
28.0
5.8
5.3
0.9
0.8
15.0
14.3
0.1
0.1
Nilkamal
Neutral
1,253
-
1,870
1,871
2,031
10.7
10.5
63.2
69.8
19.8
18.0
3.2
2.8
17.6
16.6
1.1
0.9
Visaka Industries
Accumulate
136
143
216
1,020
1,120
8.7
9.1
13.9
20.1
9.8
6.8
0.6
0.6
6.4
8.7
0.4
0.4
Transport Corporation of
Neutral
276
-
2,096
2,830
3,350
8.8
9.0
14.4
18.3
19.2
15.1
3.0
2.6
15.4
17.1
0.9
0.7
India
Elecon Engineering
Neutral
61
-
665
1,359
1,482
10.3
13.7
0.8
3.9
76.0
15.7
1.3
1.2
1.6
7.8
0.8
0.8
Surya Roshni
Buy
151
201
661
2,992
3,223
8.1
8.4
14.7
18.3
10.3
8.2
1.0
0.9
9.7
11.0
0.5
0.5
MT Educare
Neutral
176
-
702
286
366
18.3
17.7
7.7
9.4
22.8
18.8
4.8
4.2
20.2
21.1
2.4
1.8
Radico Khaitan
Buy
88
125
1,170
1,543
1,659
12.6
13.0
5.8
6.3
15.2
13.9
1.3
1.2
8.5
8.6
1.2
1.1
Garware Wall Ropes
Buy
350
473
766
862
974
11.2
11.2
24.9
29.6
14.1
11.8
2.1
1.8
15.1
15.4
0.9
0.8
Wonderla Holidays
Neutral
389
-
2,198
206
308
44.0
43.6
9.0
12.9
43.2
30.2
5.9
5.4
13.7
17.8
10.6
7.0
Linc Pen & Plastics
Neutral
190
-
280
340
371
8.3
8.9
10.8
13.2
17.6
14.4
2.8
2.5
16.0
17.1
0.9
0.8
The Byke Hospitality
Neutral
154
-
616
222
287
20.5
20.5
5.6
7.6
27.2
20.3
5.1
4.2
18.9
20.8
2.8
2.2
Interglobe Aviation
Neutral
1,008
-
36,338
17,022
21,122
20.7
14.5
63.9
53.7
15.8
18.8
23.7
19.4
149.9
103.2
2.2
1.7
Coffee Day Enterprises
Neutral
265
-
5,466
2,692
2,964
17.0
18.6
-
4.7
-
56.0
3.2
3.1
0.2
5.5
2.4
2.3
Ltd
Navneet Education
Neutral
89
-
2,120
998
1,062
24.1
24.0
5.8
6.1
15.5
14.6
3.4
3.0
22.0
20.6
2.2
2.1
Navkar Corporation
Buy
183
265
2,603
365
436
38.3
37.5
5.6
5.9
32.4
31.1
2.0
1.9
6.3
6.1
7.9
6.8
UFO Moviez
Neutral
512
-
1,413
558
619
32.0
33.2
22.5
30.0
22.7
17.1
2.7
2.4
12.0
13.8
2.4
2.0
VRL Logistics
Neutral
395
-
3,600
1,725
1,902
16.5
16.7
12.2
14.6
32.4
27.1
6.7
5.9
20.8
21.9
2.2
2.0
Team Lease Serv.
Neutral
918
-
1,569
2,565
3,229
1.3
1.5
15.2
22.8
60.5
40.3
4.8
4.3
8.0
10.7
0.5
0.4
Stock Watch
May 20, 2016
Company Name
Reco
CMP
Target Mkt Cap
Sales ( Čcr )
OPM(%)
EPS (Č)
PER(x)
P/BV(x)
RoE(%)
EV/Sales(x)
(Č)
Price ( Č)
( Č cr )
FY16E FY17E FY16E FY17E FY16E FY17E FY16E FY17E FY16E FY17E FY16E FY17E FY16E FY17E
zOthers
S H Kelkar & Co.
Neutral
228
-
3,293
928
1,036
15.3
15.1
4.9
6.1
46.1
37.3
4.3
4.0
9.4
10.7
3.5
3.1
Quick Heal
Neutral
248
-
1,737
339
408
27.8
27.3
7.1
7.7
35.1
32.1
3.0
3.0
8.5
9.3
4.2
3.5
Narayana Hrudaya
Neutral
329
-
6,721
1,603
1,873
10.9
11.5
1.0
2.6
345.3
124.4
8.3
7.6
2.4
6.1
4.2
3.6
Manpasand Bever.
Neutral
499
-
2,496
540
836
19.9
19.6
10.2
16.9
48.7
29.5
3.9
3.5
8.1
12.0
4.6
2.9
Source: Company, Angel Research; Note: *December year end; #September year end; &October year end; Price as on May 19, 2016
Market Outlook
May 20, 2016
Research Team Tel: 022 - 39357800
DISCLAIMER
Angel Broking Private Limited (hereinafter referred to as “Angel”) is a registered Member of National Stock Exchange of India Limited,
Bombay Stock Exchange Limited and Metropolitian Stock Exchange of India Limited. It is also registered as a Depository Participant with
CDSL and Portfolio Manager with SEBI. It also has registration with AMFI as a Mutual Fund Distributor. Angel Broking Private Limited is a
registered entity with SEBI for Research Analyst in terms of SEBI (Research Analyst) Regulations, 2014 vide registration number
INH000000164. Angel or its associates has not been debarred/ suspended by SEBI or any other regulatory authority for accessing
/dealing in securities Market. Angel or its associates including its relatives/analyst do not hold any financial interest/beneficial ownership
of more than 1% in the company covered by Analyst. Angel or its associates/analyst has not received any compensation / managed or co
-managed public offering of securities of the company covered by Analyst during the past twelve months. Angel/analyst has not served as
an officer, director or employee of company covered by Analyst and has not been engaged in market making activity of the company
covered by Analyst.
This document is solely for the personal information of the recipient, and must not be singularly used as the basis of any investment
decision. Nothing in this document should be construed as investment or financial advice. Each recipient of this document should make
such investigations as they deem necessary to arrive at an independent evaluation of an investment in the securities of the companies
referred to in this document (including the merits and risks involved), and should consult their own advisors to determine the merits and
risks of such an investment.
Reports based on technical and derivative analysis center on studying charts of a stock's price movement, outstanding positions and
trading volume, as opposed to focusing on a company's fundamentals and, as such, may not match with a report on a company's
fundamentals.
The information in this document has been printed on the basis of publicly available information, internal data and other reliable sources
believed to be true, but we do not represent that it is accurate or complete and it should not be relied on as such, as this document is for
general guidance only. Angel Broking Pvt. Limited or any of its affiliates/ group companies shall not be in any way responsible for any
loss or damage that may arise to any person from any inadvertent error in the information contained in this report. Angel Broking Pvt.
Limited has not independently verified all the information contained within this document. Accordingly, we cannot testify, nor make any
representation or warranty, express or implied, to the accuracy, contents or data contained within this document. While Angel Broking
Pvt. Limited endeavors to update on a reasonable basis the information discussed in this material, there may be regulatory, compliance,
or other reasons that prevent us from doing so.
This document is being supplied to you solely for your information, and its contents, information or data may not be reproduced,
redistributed or passed on, directly or indirectly.
Neither Angel Broking Pvt. Limited, nor its directors, employees or affiliates shall be liable for any loss or damage that may arise from or
in connection with the use of this information.
Note: Please refer to the important ‘Stock Holding Disclosure' report on the Angel website (Research Section). Also, please refer to the
latest update on respective stocks for the disclosure status in respect of those stocks. Angel Broking Pvt. Limited and its affiliates may have
investment positions in the stocks recommended in this report.