Market Outlook
October 19, 2015
Market Cues
Domestic Indices
Chg (%)
(Pts)
(Close)
Indian markets are expected to open negative tracking the SGX Nifty and most its
BSE Sensex
0.8
204
27,215
Asian peers.
Nifty
0.7
59
8,238
US Market showed a lack of direction throughout much of the trading day on Friday
Mid Cap
0.4
41
11,048
but managed to end the session moderately higher. The higher close on Wall Street
Small Cap
0.0
5
11,496
seemed to reflect the recent upward momentum for the markets, with stocks
continuing to recover from the sell-off seen in mid-August.
Bankex
1.3
262
20,460
The European markets ended Friday's session slightly to the upside. The strong rally
on Wall Street yesterday and the positive performance of the Asian markets
Global Indices
Chg (%)
(Pts)
(Close)
translated into early strength in Europe.
Dow Jones
0.4
74
17,216
The Indian markets closed notably higher on Friday as positive global cues
Nasdaq
0.3
17
4,887
outweighed disappointing exports data.
FTSE
0.6
39
6,378
Nikkei
1.1
195
18,292
News & Result Analysis
Hang Seng
0.8
179
23,067
NBCC bags `126.3cr project in Telangana
Shanghai Com
1.6
53
3,391
Bombay Dyeing's `230cr sale of textiles unit cancelled
Detailed analysis on Pg2
Advances / Declines
Bse
Nse
Investor’s Ready Reckoner
Advances
1,371
1,019
Key Domestic & Global Indicators
Declines
1,385
482
Stock Watch: Latest investment recommendations on 150+ stocks
Unchanged
155
68
Refer Pg4 onwards
Top Picks
Volumes (` Cr)
CMP
Target
Upside
Company
Sector
Rating
BSE
2,729
(`)
(`)
(%)
Axis Bank
Financials
Buy
505
701
38.9
NSE
15,372
ICICI Bank
Financials
Buy
290
370
27.6
Power Grid
Power
Buy
135
170
25.8
Net Inflows (` Cr)
Net
Mtd
Ytd
TCS
IT
Buy
2,476
3,165
27.8
FII
402
3,073
121,137
Aurobindo Pharma Pharmaceuticals Accumulate
803
872
8.6
MFs
126
934
79,938
More Top Picks on Pg3
Top Gainers
Price (`)
Chg (%)
Key Upcoming Events
Previous
Consensus
Niittech
493
7.3
Date
Region
Event Description
Reading
Expectations
Nestleind
6,580
6.1
Oct 19
China
Industrial production
6.1
6.0
Crompgreav
190
4.8
Oct 19
China
Real GDP
7.0
6.8
Jetairways
383
4.5
Oct 20
US
Housing Starts
1,126.00
1,147.00
Nmdc
105
4.4
Oct 20
US
Building permits
1,170.00
1,165.00
Top Losers
Price (`)
Chg (%)
Cyient
552
(11.8)
Hathway
43
(5.5)
Dlf
128
(4.8)
Srtransfin
958
(3.8)
Suzlon
24
(3.2)
As on October 16, 2015
Market Outlook
October 19, 2015
NBCC bags `126.3cr project in Telangana
NBCC has bagged `126.3cr project in Telangana for carrying out civil works at
different colleges of Acharya NG Ranga Agricultural University (ANGRAU) in the
state. The company had secured a total business of `276.96cr from various clients
last month.
ANGRAU, Hyderabad has entrusted the project of civil works at different colleges
of the university to NBCC for estimated amount of ~`126.33cr.
Earlier this year, National Buildings Construction Corporation Ltd (NBCC) signed
an agreement with Delhi Development Authority (DDA) to develop a 30-hectare
mega project that will also house the tallest tower in the capital.
This would be the first project based on 'Transit Oriented Development' (TOD)
norms with 'Smart City' features.
Bombay Dyeing's `230cr sale of textiles unit cancelled
Bombay Dyeing has announced that the proposed sale of its textiles processing
unit at Ranjangaon in Maharashtra for `230cr to Oasis Procon, stands cancelled
due to failure of the latter to make required payments on time.
The company's board in May this year approved selling of its textiles processing
unit at MIDC Industrial Area, Ranjangaon on a slump sale basis to New Delhi-
based Oasis Procon Pvt Ltd.
As per the terms and conditions reflected in the term sheet, Oasis Procon was
obliged to complete the proposed transaction not later than July 31,
2015,
Bombay Dyeing & Manufacturing said in a BSE filing.
The proposed purchaser failed to consummate the proposed transaction and
make the requisite payments and therefore the earnest money of `25 lakh was
forfeited by the company in accordance with the terms provided in the term sheet
and accordingly the term sheet stands automatically cancelled.
The company had planned to utilise the proceeds to repay existing loans and
reduce interest burden, among other business purposes.
Economic and Political News
Maharashtra govt declares drought in 14,708 villages
Govt to create 40K tons of buffer stock of pulses to check prices
India's Sept fuel demand rises at fastest pace in a decade
Corporate News
NBCC bags `126.33cr project in Telangana
Maruti launches updated Ertiga priced at `5.99 lakh
Crompton Greaves sells Mumbai land for `496cr
Market Outlook
October 19, 2015
Top Picks ★★★★★
Large Cap
Market Cap
CMP
Target
Upside
Company
Rationale
(` Cr)
(`)
(`)
(%)
Robust US sales along with the acquisations, will aid the growth
Aurobindo
46,895
803
872
8.6
and stable margins.
Healthy pace of branch expansion, backed by distribution
Axis Bank
1,20,046
505
701
38.9
network.
Robust franchise and capital adequacy position will help the
ICICI Bank
1,68,423
290
370
27.6
bank to outperform the industry average.
Back on the growth trend; expect a long term growth of 14% to
Infosys
2,51,228
1,094
1,306
19.4
be a US$20bn in FY2020.
Government thrust on Renewable sector and strong order book
Inox Wind
8,772
395
505
27.8
would drive future growth.
LICHF continues to grow its retail loan book at a healthy pace
LIC HFL
24,978
495
570
15.2
with improvement in asset quality.
Direct beneficiary of the huge investments lined up in the power
Power Grid
70,679
135
170
25.8
transmission sector.
Growth to pick up from 2HFY2017, attractive given the risk-
TCS
4,87,868
2,476
3,165
27.8
reward.
Tech Mahindra
52,524
546
646
18.4
Acquisitions, to drive growth, normalised valuations attractive.
An improving liability franchise, capital adequacy well above
Yes Bank
32,375
773
953
23.3
Basel III requirements and lowest NPA ratio in the industry.
Source: Company, Angel Research
Mid Cap
Market Cap
CMP
Target
Upside
Company
Rationale
(` Cr)
(`)
(`)
(%)
Bajaj Electricals
2,559
254
341
34.4
Visible turnaround in E&P business to drive the earnings.
Garware Wall Ropes
768
351
390
11.1
Higher exports & easing material prices to drive profitability.
Comfortable balance sheet to support strong growth; this
MBL Infrastructures
962
232
360
55.2
coupled with attractive valuation to lead to rerating.
New product introductions and increased sourcing by clients to
Minda Industries
807
508
652
28.2
enable outpace industry growth.
Strong brand & quality teaching with innovative technologies &
MT Educare
578
145
169
16.4
higher government educational spending to boost growth.
Earnings boost on back of stable material prices and favorable
Radico Khaitan
1,240
93
112
20.2
pricing environment. Valuation discount to peers provides
additional comfort.
Structural shift in the Lighting industry towards LED lighting will
Surya Roshni
610
139
183
31.4
drive growth.
Tree House
1,306
309
449
45.4
Robust expansion plan for pre-schools to drive growth.
Source: Company, Angel Research
Market Outlook
October 19, 2015
Quarterly Bloomberg Brokers Consensus Estimate
Ultratech Cement Ltd - October 19, 2015
Particulars (` cr)
2QFY16E
2QFY15
y-o-y (%)
1QFY16
q-o-q (%)
Net sales
5,550
5,382
3.1
6,038
(8.1)
EBITDA
949
877
8.2
1,152
(17.6)
EBITDA margin (%)
17.1
16.3
19.1
Net profit
424
410
3.3
591
(28.3)
HCL Technologies Ltd Consol - October 19, 2015
Particulars (` cr)
2QFY16E
2QFY15
y-o-y (%)
1QFY16
q-o-q (%)
Net sales
10,103
8,735
15.7
9,777
3.3
EBITDA
2,110
2,192
(3.7)
2,100
0.5
EBITDA margin (%)
20.9
25.1
21.5
Net profit
1,779
1,873
(5.0)
1,783
(0.2)
Hindustan Zinc Ltd - October 19, 2015
Particulars (` cr)
2QFY16E
2QFY15
y-o-y (%)
1QFY16
q-o-q (%)
Net sales
3,630
3,749
(3.2)
3,596
1.0
EBITDA
1,904
2,000
(4.8)
1,660
14.7
EBITDA margin (%)
52.4
53.3
46.2
Net profit
1,992
2,184
(8.8)
1,921
3.7
Hero MotoCorp Ltd - October 20, 2015
Particulars (` cr)
2QFY16E
2QFY15
y-o-y (%)
1QFY16
q-o-q (%)
Net sales
6,665
6,864
(2.9)
6,856
(2.8)
EBITDA
989
935
5.8
1,048
(5.6)
EBITDA margin (%)
14.8
13.6
15.3
Net profit
716
763
(6.2)
750
(4.5)
ACC Ltd - October 20, 2015
Particulars (` cr)
3QFY16E
3QFY15
y-o-y (%)
2QFY16
q-o-q (%)
Net sales
2,753
2,742
0.4
2,961
(7.0)
EBITDA
266
379
(29.8)
334
(20.3)
EBITDA margin (%)
9.7
13.8
11.3
Net profit
117
205
(42.7)
131
(10.7)
Federal Bank Ltd - October 20, 2015
Particulars (` cr)
2QFY16E
2QFY15
y-o-y (%)
1QFY16
q-o-q (%)
PAT
244
240
1.6
141
72.7
Mahindra & Mahindra Ltd - October 21, 2015
Particulars (` cr)
2QFY16E
2QFY15
y-o-y (%)
1QFY16
q-o-q (%)
Net sales
8,712
9,418
(7.5)
9,708
(10.3)
EBITDA
1,095
1,009
8.5
1,252
(12.5)
EBITDA margin (%)
12.6
10.7
12.9
Net profit
908
947
(4.0)
852
6.6
Market Outlook
October 19, 2015
Bajaj Auto Ltd - October 21, 2015
Particulars (` cr)
2QFY16E
2QFY15
y-o-y (%)
1QFY16
q-o-q (%)
Net sales
6,015
5,827
3.2
5,505
9.3
EBITDA
1,266
1,127
12.4
1,140
11.1
EBITDA margin (%)
21.1
19.3
20.7
Net profit
901
591
52.4
1,015
(11.3)
HDFC Bank Ltd - October 21, 2015
Particulars (` cr)
2QFY16E
2QFY15
y-o-y (%)
1QFY16
q-o-q (%)
PAT
2,883
2,381
21.1
2,696
7.0
Wipro Ltd Consol - October 21, 2015
Particulars (` cr)
2QFY16E
2QFY15
y-o-y (%)
1QFY16
q-o-q (%)
Net sales
12,826
11,684
9.8
12,238
4.8
EBITDA
2,719
2,481
9.6
2,606
4.3
EBITDA margin (%)
21.2
21.2
21.3
Net profit
2,230
2,085
7.0
2,188
1.9
JSW Steel Ltd Consol - October 21, 2015
Particulars (` cr)
2QFY16E
2QFY15
y-o-y (%)
1QFY16
q-o-q (%)
Net sales
11,034
13,692
(19.4)
11,382
(3.1)
EBITDA
1,572
2,791
(43.7)
1,627
(3.4)
EBITDA margin (%)
14.2
20.4
14.3
Net profit
(156)
749
0.0
(107)
0.0
Cairn India Ltd Consol - October 21, 2015
Particulars (` cr)
2QFY16E
2QFY15
y-o-y (%)
1QFY16
q-o-q (%)
Net sales
2,249
3,982
(43.5)
2,627
(14.4)
EBITDA
992
2,656
(62.7)
1,290
(23.2)
EBITDA margin (%)
44.1
66.7
49.1
Net profit
552
2,278
(75.8)
835
(33.9)
Market Outlook
October 19, 2015
Key Upcoming Events
Result Calendar
Date
Company
Oct 19, 2015
UltraTech Cement, HCL Tech, Hind. Zinc, Petronet LNG, Heritage Foods
Oct 20, 2015
Hero Motocorp, ACC, Federal Bank, Mphasis, Jyothy Laboratories, Aventis
Oct 21, 2015
M&M, Bajaj Auto, HDFC Bank, Wipro, KPIT Cummins, NIIT, JSW Steel , Cairn India
Oct 22, 2015
Cadila Healthcare
Oct 23, 2015
Rallis, Asian Paints
Oct 24, 2015
Godrej Consumer, Persistent
Oct 25, 2015
Oct 26, 2015
United Phosphorus, Blue Star, HDFC, Hindustan Media Ventures, Hitachi
Oct 27, 2015
Maruti, TVS Motor, CEAT, Thermax, Axis Bank, Sesa Goa, Lupin, Alembic Pharma
Exide Industries, Amara Raja Batteries, Ambuja Cements, Syndicate Bank, Dabur India, Sun TV Network, HT Media,
Oct 28, 2015
Kirloskar Engines India Ltd, Elecon Engineering, Transport Corporation of India
Bharat Forge, Crompton Greaves, Shriram Trans., Nestle, Colgate, MRF, L G Balakrishnan & Bros, Dr Reddy's,
Oct 29, 2015
Glenmark Pharma., Dishman Pharma
Oct 30, 2015
Apollo Tyres, Subros, ICICI Bank, Kotak Mah. Bank, Indoco Remedies
Source: Bloomberg, Angel Research
Global economic events release calendar
Date
Time
Country
Event Description
Unit
Period
Bloomberg Data
Last Reported Estimated
Oct 19, 2015 7:30AM China
Industrial Production (YoY)
% Change
Sep
6.10
6.00
7:30AM China
Real GDP (YoY)
% Change
3Q
7.00
6.80
Oct 20, 2015 6:00PM US
Housing Starts
Thousands
Sep
1,126.00
1,147.00
6:00PM US
Building permits
Thousands
Sep
1,170.00
1,165.00
Oct 22, 2015 6:00PM US
Initial Jobless claims
Thousands
Oct 17
255.00
265.00
7:30PM Euro Zone
Euro-Zone Consumer Confidence
Value
Oct A
(7.10)
(7.40)
7:30PM US
Existing home sales
Million
Sep
5.31
5.37
5:15PM Euro Zone
ECB announces interest rates
%
Oct 22
0.05
0.05
Oct 23, 2015 1:00PM Germany
PMI Services
Value
Oct P
54.10
53.90
1:00PM Germany
PMI Manufacturing
Value
Oct P
52.30
51.70
Oct 26, 2015 7:30PM US
New home sales
Thousands
Sep
552.00
549.00
Oct 27, 2015 3:00PM UK
GDP (YoY)
% Change
3Q A
2.40
--
7:30PM US
Consumer Confidence
S.A./ 1985=100
Oct
103.04
101.00
Oct 28, 2015 11:30PM US
FOMC rate decision
%
Oct 28
0.25
0.25
Oct 29, 2015 2:25PM Germany
Unemployment change (000's)
Thousands
Oct
2.00
--
6:00PM US
GDP Qoq (Annualised)
% Change
3Q A
3.90
1.90
Nov 1, 2015
6:30AM China
PMI Manufacturing
Value
Oct
49.80
--
Nov 2, 2015
3:00PM UK
PMI Manufacturing
Value
Oct
51.50
--
Nov 5, 2015
5:30PM UK
BOE Announces rates
% Ratio
Nov 5
0.50
0.50
Source: Bloomberg, Angel Research
Market Outlook
October 19, 2015
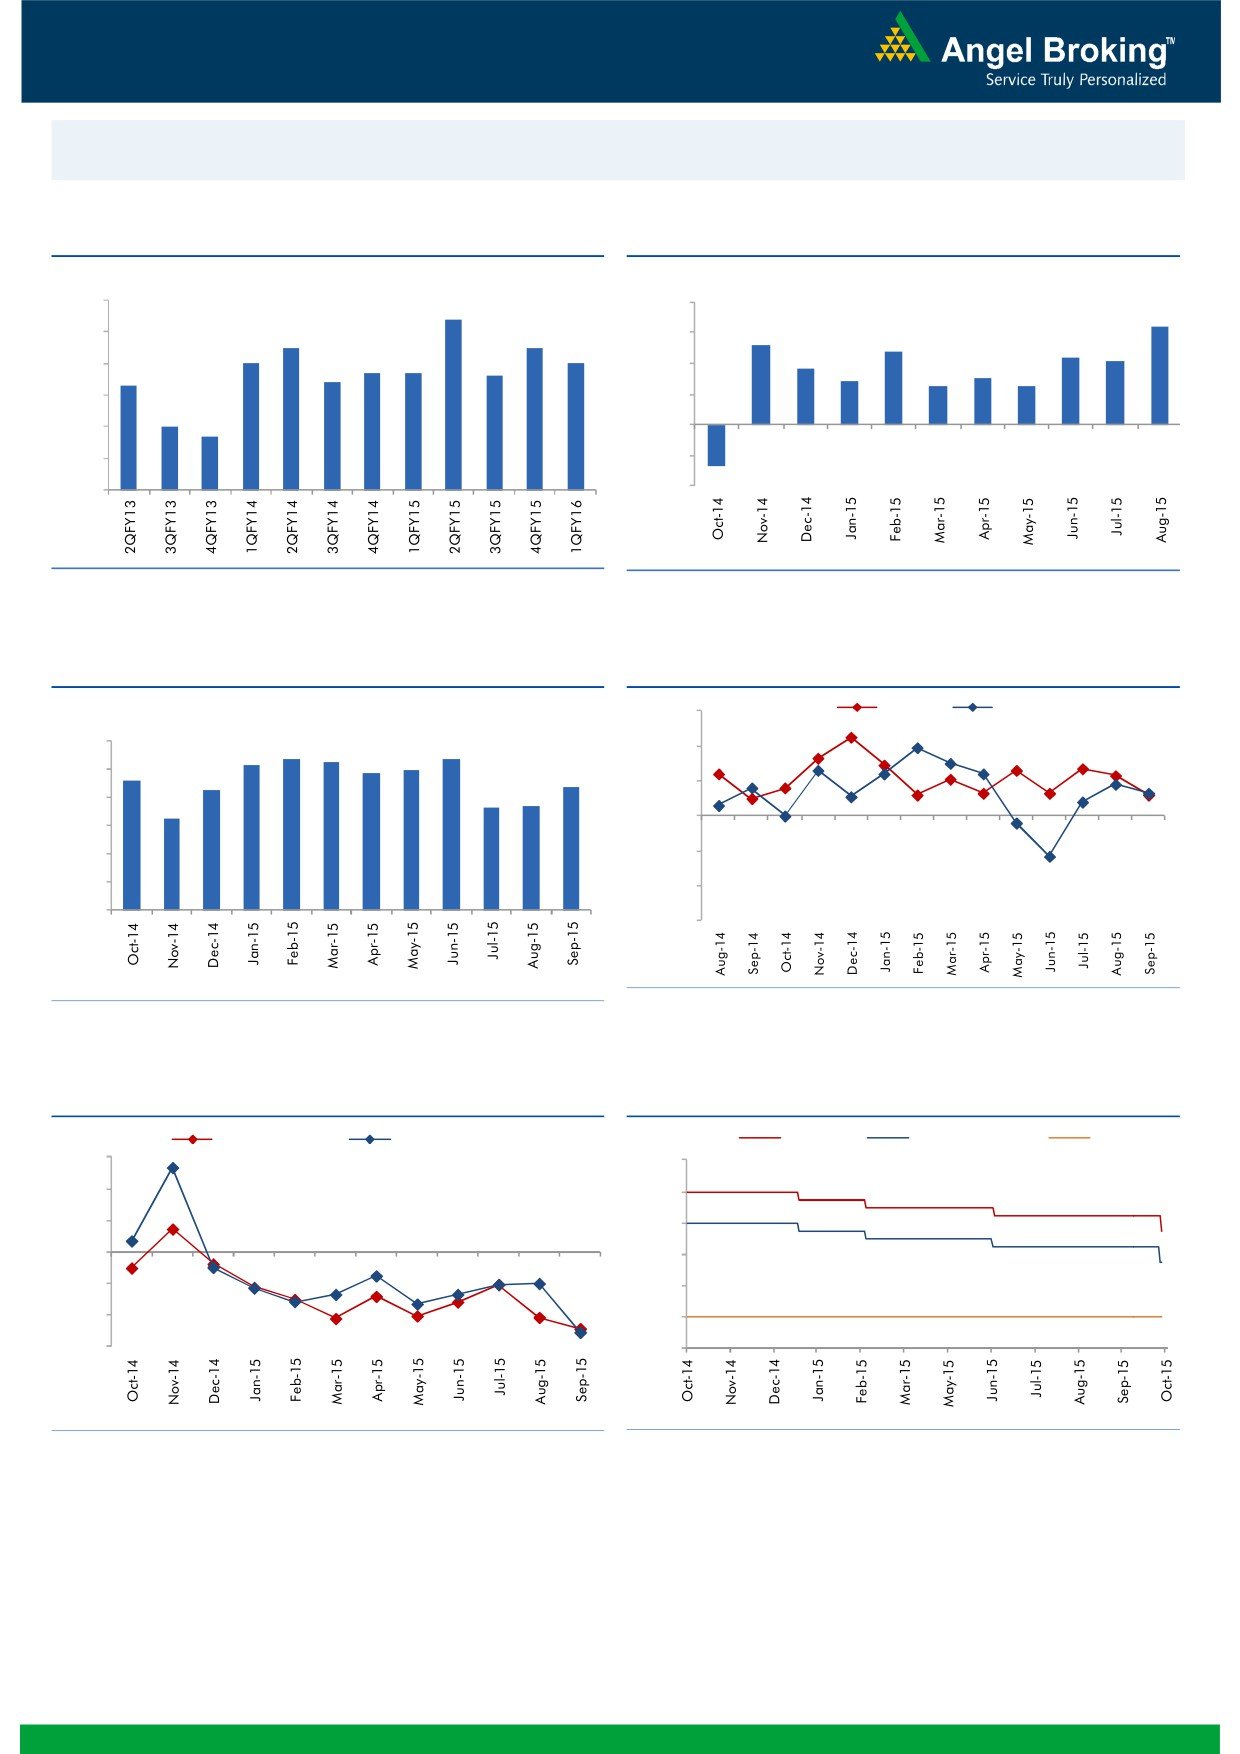
Macro watch
Exhibit 1: Quarterly GDP trends
Exhibit 2: IIP trends
(%)
(%)
9.0
8.4
8.0
6.4
7.5
7.5
5.2
8.0
6.0
4.8
7.0
7.0
4.4
4.1
6.7
6.7
6.6
3.6
7.0
6.4
4.0
2.8
3.0
6.3
2.5
2.5
6.0
2.0
5.0
4.7
5.0
-
4.0
(2.0)
3.0
(4.0)
(2.7)
Source: CSO, Angel Research
Source: MOSPI, Angel Research
Exhibit 3: Monthly CPI inflation trends
Exhibit 4: Manufacturing and services PMI
(%)
56.0
Mfg. PMI
Services PMI
6.0
5.4
5.3
5.4
54.0
5.2
5.0
4.9
4.6
5.0
4.3
4.4
52.0
3.7
3.7
4.0
3.3
50.0
3.0
2.0
48.0
1.0
46.0
-
44.0
Source: Market, Angel Research; Note: Level above 50 indicates expansion
Source: MOSPI, Angel Research
Exhibit 5: Exports and imports growth trends
Exhibit 6: Key policy rates
(%)
Exports yoy growth
Imports yoy growth
(%)
Repo rate
Reverse Repo rate
CRR
30.0
9.00
20.0
8.00
10.0
7.00
0.0
6.00
(10.0)
5.00
(20.0)
4.00
(30.0)
3.00
Source: Bloomberg, Angel Research
Source: RBI, Angel Research
Market Outlook
October 19, 2015
Global watch
Exhibit 1: Latest quarterly GDP Growth (%, yoy) across select developing and developed countries
(%)
8.0
7.0
6.0
5.3
4.9
4.7
4.0
2.8
2.7
2.4
1.6
2.0
1.2
1.1
0.8
-
(2.0)
(2.6)
(4.0)
(4.6)
(6.0)
Source: Bloomberg, Angel Research
Exhibit 2: 2015 GDP Growth projection by IMF (%, yoy) across select developing and developed countries
(%)
10.0
7.5
8.0
6.8
5.2
6.0
4.8
3.7
3.1
4.0
2.7
2.0
1.6
1.2
1.0
2.0
-
(2.0)
(4.0)
(1.0)
(3.8)
(6.0)
Source: IMF, Angel Research
Exhibit 3: One year forward P-E ratio across select developing and developed countries
(x)
20.0
18.0
16.0
14.0
12.0
10.0
8.0
6.0
4.0
2.0
-
Source: IMF, Angel Research
Market Outlook
October 19, 2015
Exhibit 4: Relative performance of indices across globe
Returns (%)
Country
Name of index
Closing price
1M
3M
1YR
Brazil
Bovespa
47,236
(0.3)
(11.0)
(14.6)
Russia
Micex
1,717
(0.9)
5.5
24.7
India
Nifty
8,238
5.8
(3.4)
4.8
China
Shanghai Composite
3,391
4.6
(8.6)
43.5
South Africa
Top 40
47,460
7.9
0.5
14.2
Mexico
Mexbol
44,364
2.5
(2.1)
3.4
Indonesia
LQ45
772
3.9
(6.4)
(7.8)
Malaysia
KLCI
1,717
7.1
0.0
(5.1)
Thailand
SET 50
920
2.4
(5.6)
(10.8)
USA
Dow Jones
17,216
2.8
(4.8)
5.1
UK
FTSE
6,378
2.4
(5.9)
1.8
Japan
Nikkei
18,292
(0.0)
(8.9)
15.1
Germany
DAX
10,104
(1.2)
(13.9)
14.2
France
CAC
4,703
1.2
(8.6)
14.6
Source: Bloomberg, Angel Research
Stock Watch
October 19, 2015
Company Name
Reco
CMP
Target
Mkt Cap
Sales ( Čcr )
OPM(%)
EPS (Č)
PER(x)
P/BV(x)
RoE(%)
EV/Sales(x)
(Č)
Price ( Č)
( Č cr )
FY16E FY17E
FY16E
FY17E
FY16E
FY17E
FY16E
FY17E
FY16E
FY17E
FY16E
FY17E
FY16E
FY17E
Agri / Agri Chemical
Rallis
Neutral
215
-
4,183
2,075
2,394
14.4
14.4
9.5
11.0
22.6
19.6
4.5
3.9
21.1
21.3
2.1
1.8
United Phosphorus
Accumulate
477
510
20,455
13,698
15,752
17.6
17.6
32.1
38.5
14.9
12.4
2.9
2.4
21.4
21.3
1.6
1.3
Auto & Auto Ancillary
Ashok Leyland
Accumulate
96
102
27,306
18,763
22,357
11.1
11.2
3.6
4.8
26.7
20.0
4.9
4.5
18.7
22.6
1.4
1.2
Bajaj Auto
Neutral
2,458
-
71,139
23,544
27,245
19.8
19.8
127.0
143.4
19.4
17.1
5.9
5.0
30.3
29.4
2.6
2.2
Eicher Motors
Buy
18,287
22,859
49,634
11,681
15,550
15.3
16.9
358.5
564.3
51.0
32.4
15.3
11.4
29.8
34.9
4.1
3.1
Hero Motocorp
Neutral
2,587
-
51,656
28,500
32,764
14.1
14.3
146.9
167.0
17.6
15.5
6.7
5.7
37.8
36.5
1.6
1.4
L G Balakrishnan & Bros Neutral
477
-
749
1,254
1,394
11.6
11.8
35.9
41.7
13.3
11.5
1.8
1.6
13.5
13.8
0.7
0.6
Mahindra and Mahindra Accumulate
1,289
1,357
80,068
37,986
42,660
12.8
13.2
51.6
61.9
25.0
20.8
3.7
3.3
14.6
15.6
1.8
1.5
Maruti
Accumulate
4,450
4,960
134,423
58,102
68,587
16.7
16.9
182.0
225.5
24.5
19.7
4.9
4.2
19.9
21.0
2.1
1.7
Minda Industries
Buy
508
652
807
2,567
2,965
7.3
8.0
38.8
54.3
13.1
9.4
1.9
1.6
14.4
16.8
0.4
0.3
Rane Brake Lining
Buy
311
366
246
454
511
11.1
11.4
23.8
28.1
13.1
11.1
1.9
1.7
14.2
15.3
0.7
0.6
Setco Automotive
Neutral
226
-
604
594
741
12.7
13.7
8.4
15.8
26.9
14.3
2.8
2.4
10.4
16.9
1.5
1.2
Tata Motors
Accumulate
386
424
111,504
264,038
297,882
13.8
13.9
34.5
38.9
11.2
9.9
1.9
1.6
17.6
16.8
0.6
0.6
TVS Motor
Neutral
248
-
11,761
11,702
13,713
6.8
7.7
10.1
14.5
24.5
17.1
6.0
4.8
24.5
28.3
1.0
0.8
Amara Raja Batteries
Neutral
995
-
16,992
5,101
6,224
17.8
17.6
31.1
39.2
32.0
25.4
7.9
6.3
24.8
24.8
3.3
2.6
Exide Industries
Neutral
152
-
12,941
7,363
8,247
13.7
14.5
6.6
7.7
23.1
19.8
2.9
2.6
12.6
13.3
1.5
1.3
Apollo Tyres
Neutral
191
-
9,730
12,576
12,978
16.8
16.1
22.3
19.9
8.6
9.6
1.5
1.3
17.2
13.4
0.8
0.9
Ceat
Neutral
1,258
-
5,088
6,041
6,597
14.3
14.2
101.5
116.6
12.4
10.8
2.5
2.1
20.0
19.1
1.0
0.9
JK Tyres
Neutral
106
-
2,393
7,446
7,669
15.2
14.0
19.6
18.4
5.4
5.7
1.4
1.1
25.2
19.5
0.7
0.6
Swaraj Engines
Neutral
873
-
1,084
593
677
14.5
14.8
51.2
60.8
17.0
14.4
4.0
3.6
23.3
24.8
1.7
1.4
Subros
Neutral
88
-
526
1,268
1,488
11.6
11.9
3.7
6.6
23.7
13.3
1.6
1.5
6.8
11.4
0.7
0.6
Indag Rubber
Neutral
183
-
480
283
329
17.0
17.2
13.0
15.4
14.1
11.8
3.1
2.6
21.8
21.6
1.4
1.2
Capital Goods
ACE
Neutral
46
-
454
660
839
4.7
8.2
1.0
3.9
45.9
11.8
1.4
1.3
3.2
11.3
0.8
0.7
BEML
Neutral
1,225
-
5,101
3,277
4,006
6.0
8.9
29.2
64.3
42.0
19.1
2.3
2.1
5.7
11.7
1.6
1.3
BGR Energy
Neutral
119
-
858
3,615
3,181
9.5
9.4
16.7
12.4
7.1
9.6
0.7
0.7
10.0
7.0
0.7
0.8
BHEL
Neutral
213
-
52,232
33,722
35,272
10.8
11.7
10.5
14.2
20.3
15.0
1.5
1.4
7.0
9.0
1.6
1.6
Blue Star
Accumulate
354
387
3,181
3,649
4,209
5.0
5.9
9.2
14.7
38.7
24.0
7.0
6.6
9.1
17.5
1.0
0.8
Crompton Greaves
Accumulate
190
204
11,880
13,484
14,687
4.9
6.2
4.5
7.1
42.1
26.7
3.0
2.8
7.2
10.8
1.0
0.9
Inox Wind
Buy
395
505
8,772
4,980
5,943
17.0
17.5
26.6
31.6
14.9
12.5
4.4
3.3
35.0
30.0
1.9
1.6
Stock Watch
October 19, 2015
Company Name
Reco
CMP
Target
Mkt Cap
Sales ( Čcr )
OPM(%)
EPS (Č)
PER(x)
P/BV(x)
RoE(%)
EV/Sales(x)
(Č)
Price ( Č)
( Č cr )
FY16E
FY17E
FY16E
FY17E
FY16E
FY17E
FY16E
FY17E
FY16E
FY17E
FY16E
FY17E
FY16E
FY17E
Capital Goods
KEC International
Neutral
145
-
3,724
8,791
9,716
6.1
6.8
5.4
8.2
26.8
17.7
2.7
2.5
10.0
14.0
0.6
0.6
Thermax
Neutral
839
-
9,997
6,413
7,525
7.4
8.5
30.5
39.3
27.5
21.4
4.2
3.7
15.0
17.0
1.5
1.3
Cement
ACC
Accumulate
1,394
1,548
26,163
11,856
14,092
14.5
17.8
47.6
76.1
29.3
18.3
3.0
2.8
10.6
15.7
2.1
1.7
Ambuja Cements
Accumulate
213
233
32,978
10,569
12,022
20.7
22.2
8.7
10.7
24.4
19.9
3.1
2.9
13.0
15.2
2.7
2.4
India Cements
Buy
83
112
2,560
4,716
5,133
15.9
16.9
3.7
7.5
22.5
11.1
0.8
0.8
3.8
7.3
0.8
0.7
JK Cement
Buy
664
767
4,640
4,056
4,748
14.5
17.0
22.6
41.1
29.4
16.2
2.6
2.3
9.3
15.3
1.6
1.3
J K Lakshmi Cement
Buy
372
430
4,381
2,947
3,616
16.7
19.9
11.5
27.2
32.4
13.7
3.1
2.7
9.8
20.8
1.9
1.5
Mangalam Cements
Neutral
223
-
596
1,053
1,347
10.5
13.3
8.4
26.0
26.6
8.6
1.1
1.0
4.3
12.5
0.9
0.7
Orient Cement
Neutral
175
-
3,586
1,854
2,524
21.2
22.2
7.7
11.1
22.7
15.8
3.3
2.8
13.3
15.7
2.7
1.9
Ramco Cements
Neutral
334
-
7,962
4,036
4,545
20.8
21.3
15.1
18.8
22.2
17.8
2.7
2.4
12.9
14.3
2.5
2.1
Shree Cement^
Neutral
11,860
-
41,316
7,150
8,742
26.7
28.6
228.0
345.5
52.0
34.3
7.7
6.4
15.7
20.3
5.5
4.4
UltraTech Cement
Accumulate
2,955
3,282
81,092
27,562
31,548
20.4
22.3
111.9
143.3
26.4
20.6
3.8
3.2
15.2
16.8
3.0
2.6
Construction
ITNL
Neutral
94
-
3,082
7,360
8,825
34.0
35.9
1.0
5.0
93.7
18.7
0.4
0.4
0.3
1.4
3.9
3.7
KNR Constructions
Neutral
603
-
1,696
915
1,479
14.3
13.9
20.3
37.2
29.7
16.2
2.7
2.4
9.6
15.6
2.0
1.2
Larsen & Toubro
Buy
1,605
2,013
149,334
68,920
82,446
10.9
11.5
57.0
73.0
28.2
22.0
2.6
2.4
13.6
15.5
2.4
2.0
Gujarat Pipavav Port
Neutral
190
-
9,193
721
784
53.1
53.6
8.2
9.1
23.1
20.9
3.7
3.0
20.0
18.3
12.3
10.9
MBL Infrastructures
Buy
232
360
962
2,313
2,797
12.2
14.6
19.0
20.0
12.2
11.6
1.3
1.2
11.3
10.6
1.1
1.0
Nagarjuna Const.
Neutral
81
-
4,525
7,892
8,842
8.3
9.1
2.4
5.3
33.9
15.4
1.4
1.3
4.2
8.6
0.8
0.7
PNC Infratech
Neutral
518
-
2,659
1,798
2,132
13.2
13.5
22.0
30.0
23.6
17.3
2.1
1.9
11.5
11.4
1.6
1.3
Simplex Infra
Neutral
359
-
1,778
6,241
7,008
10.4
10.7
20.0
36.0
18.0
10.0
1.5
1.3
6.8
11.1
0.8
0.7
Financials
Allahabad Bank
Neutral
79
-
4,723
8,438
9,521
2.8
2.8
21.9
27.0
3.6
2.9
0.4
0.3
10.2
11.5
-
-
Axis Bank
Buy
505
701
120,046
26,941
32,298
3.5
3.6
37.4
46.4
13.5
10.9
2.7
2.4
18.7
20.0
-
-
Bank of Baroda
Neutral
178
-
40,968
19,027
21,737
1.9
2.0
16.9
24.5
10.5
7.3
1.0
0.9
9.1
12.1
-
-
Bank of India
Neutral
143
-
11,312
16,438
18,706
1.9
2.0
19.2
40.9
7.4
3.5
0.4
0.4
4.5
9.1
-
-
Canara Bank
Neutral
301
-
16,339
15,491
17,269
2.0
2.0
61.6
70.9
4.9
4.2
0.6
0.5
10.5
11.1
-
-
Dena Bank
Neutral
42
-
2,376
3,498
3,977
2.1
2.3
7.8
10.7
5.4
4.0
0.4
0.4
6.5
8.4
-
-
Federal Bank
Neutral
65
-
11,071
3,527
4,135
3.0
3.1
5.2
6.7
12.4
9.6
1.3
1.2
10.8
12.7
-
-
HDFC
Neutral
1,312
-
207,007
10,883
12,799
3.5
3.4
43.0
50.6
30.6
25.9
6.1
5.5
25.9
26.7
-
-
HDFC Bank
Accumulate
1,100
1,255
276,938
38,059
46,851
4.4
4.5
50.0
62.7
22.0
17.5
3.8
3.3
18.8
20.2
-
-
Stock Watch
October 19, 2015
Company Name
Reco
CMP
Target
Mkt Cap
Sales ( Čcr )
OPM(%)
EPS (Č)
PER(x)
P/BV(x)
RoE(%)
EV/Sales(x)
(Č)
Price ( Č)
( Č cr )
FY16E
FY17E
FY16E
FY17E
FY16E
FY17E
FY16E
FY17E
FY16E
FY17E
FY16E
FY17E
FY16E
FY17E
Financials
ICICI Bank
Buy
290
370
168,423
35,810
41,871
3.4
3.5
22.0
26.2
13.2
11.1
2.3
1.9
15.0
15.6
-
-
IDBI Bank
Neutral
80
-
12,808
9,860
10,978
1.8
1.9
9.3
15.6
8.6
5.1
0.6
0.5
6.4
10.1
-
-
Indian Bank
Neutral
139
-
6,671
6,267
7,171
2.4
2.5
25.4
32.1
5.5
4.3
0.5
0.4
8.0
9.3
-
-
LIC Housing Finance
Buy
495
570
24,978
2,934
3,511
2.3
2.3
30.9
36.8
16.0
13.5
2.6
2.2
16.8
17.5
-
-
Oriental Bank
Neutral
144
-
4,324
7,730
8,595
2.4
2.5
38.8
47.4
3.7
3.0
0.3
0.3
8.6
9.8
-
-
Punjab Natl.Bank
Neutral
138
-
27,157
23,446
26,624
2.8
2.9
17.8
27.5
7.8
5.0
0.8
0.6
8.5
12.1
-
-
South Ind.Bank
Neutral
23
-
3,058
1,930
2,215
2.4
2.4
2.6
3.6
8.7
6.3
0.9
0.8
9.9
12.5
-
-
St Bk of India
Buy
255
307
197,873
83,847
96,307
2.8
2.8
20.1
25.1
12.7
10.2
1.4
1.2
11.5
13.1
-
-
Union Bank
Neutral
176
-
12,075
12,755
14,439
2.3
2.4
31.5
39.9
5.6
4.4
0.6
0.5
9.9
11.6
-
-
Vijaya Bank
Neutral
38
-
3,286
3,594
3,969
1.8
1.9
5.8
7.1
6.6
5.4
0.6
0.5
8.2
9.3
-
-
Yes Bank
Buy
773
953
32,375
7,204
9,078
3.2
3.2
57.8
69.5
13.4
11.1
2.4
2.0
19.6
22.6
-
-
FMCG
Asian Paints
Neutral
882
-
84,620
16,553
19,160
16.0
16.2
17.7
21.5
49.9
41.0
13.3
11.9
29.4
31.2
4.9
4.3
Britannia
Neutral
3,227
-
38,716
8,065
9,395
9.6
10.2
47.2
65.5
68.4
49.3
22.7
21.5
38.3
41.2
4.7
4.0
Colgate
Neutral
905
-
24,624
4,836
5,490
19.5
19.7
48.5
53.2
18.7
17.0
13.7
11.9
99.8
97.5
5.0
4.4
Dabur India
Neutral
273
-
47,882
9,370
10,265
17.1
17.2
7.3
8.1
37.2
33.7
11.2
9.1
33.7
30.6
5.0
4.6
GlaxoSmith Con*
Neutral
6,014
-
25,292
4,919
5,742
17.2
17.4
168.3
191.2
35.7
31.5
10.1
8.6
28.8
28.9
4.7
4.0
Godrej Consumer
Neutral
1,207
-
41,116
10,168
12,886
16.1
16.1
32.1
38.4
37.6
31.4
7.7
7.1
19.7
21.0
4.1
3.3
HUL
Neutral
785
-
169,788
34,940
38,957
17.5
17.7
20.8
24.7
37.7
31.8
42.0
33.5
110.5
114.2
4.7
4.2
ITC
Buy
349
409
280,004
41,068
45,068
37.8
37.4
13.9
15.9
25.1
21.9
8.4
7.4
34.1
33.8
6.4
5.8
Marico
Neutral
400
-
25,800
6,551
7,766
15.7
16.0
10.4
12.5
38.5
32.0
11.2
9.3
33.2
32.4
3.9
3.3
Nestle*
Neutral
6,580
-
63,443
11,291
12,847
22.2
22.3
158.9
184.6
41.4
35.7
21.7
19.5
55.0
57.3
5.5
4.8
Tata Global
Accumulate
134
144
8,450
8,635
9,072
9.8
9.9
6.5
7.6
20.6
17.6
2.1
2.0
6.8
7.4
0.9
0.9
IT
HCL Tech^
Buy
841
1,132
118,312
42,038
47,503
23.5
23.5
56.4
62.9
14.9
13.4
3.5
2.7
23.2
19.8
2.4
1.9
Infosys
Buy
1,094
1,306
251,228
60,250
66,999
28.0
28.0
58.3
63.7
18.8
17.2
3.9
3.4
20.9
19.7
3.5
3.0
TCS
Buy
2,476
3,165
487,868
111,274
126,852
28.4
28.7
125.4
143.9
19.7
17.2
7.8
7.2
39.9
42.2
4.0
3.5
Tech Mahindra
Buy
546
646
52,524
25,566
28,890
16.0
17.0
26.3
31.9
20.8
17.1
3.7
3.2
17.9
18.6
1.8
1.5
Wipro
Buy
577
719
142,525
52,414
58,704
23.7
23.8
38.4
42.3
15.0
13.6
2.9
2.6
19.5
18.0
2.3
1.9
Media
D B Corp
Buy
307
356
5,643
2,241
2,495
27.8
27.9
21.8
25.6
14.1
12.0
3.7
3.3
26.7
28.5
2.5
2.2
HT Media
Neutral
94
-
2,188
2,495
2,603
11.2
11.2
7.3
8.6
12.9
10.9
1.0
0.9
7.4
8.1
0.4
0.4
Stock Watch
October 19, 2015
Company Name
Reco
CMP
Target
Mkt Cap
Sales ( Čcr )
OPM(%)
EPS (Č)
PER(x)
P/BV(x)
RoE(%)
EV/Sales(x)
(Č)
Price ( Č)
( Č cr )
FY16E FY17E
FY16E
FY17E
FY16E
FY17E
FY16E
FY17E
FY16E
FY17E
FY16E
FY17E
FY16E
FY17E
Media
Jagran Prakashan
Accumulate
145
156
4,742
1,939
2,122
26.0
26.0
8.3
9.2
17.5
15.8
3.0
2.7
17.5
17.1
2.4
2.2
Sun TV Network
Neutral
368
-
14,498
2,779
3,196
70.2
70.5
22.8
27.3
16.1
13.5
4.0
3.6
26.7
28.3
5.0
4.3
Hindustan Media
Accumulate
278
292
2,039
920
1,031
20.0
20.0
19.2
20.9
14.5
13.3
2.4
2.0
16.4
15.3
1.8
1.5
Ventures
Metals & Mining
Coal India
Buy
338
400
213,777
72,015
78,415
21.2
21.5
21.7
25.3
15.6
13.4
5.3
5.2
33.1
39.1
2.2
2.0
Hind. Zinc
Neutral
154
-
64,943
15,258
16,495
44.2
45.6
17.6
19.2
8.7
8.0
1.4
1.2
15.9
15.3
2.0
1.5
Hindalco
Neutral
88
-
18,089
104,356
111,186
8.7
9.5
6.7
11.1
13.0
7.9
0.5
0.5
3.5
5.9
0.7
0.6
JSW Steel
Neutral
900
-
21,744
48,125
53,595
18.8
21.0
46.9
97.5
19.2
9.2
0.9
0.9
4.4
9.5
1.3
1.1
NMDC
Neutral
105
-
41,550
8,237
10,893
46.6
44.5
10.0
11.7
10.5
9.0
1.2
1.0
12.5
13.0
4.8
3.7
SAIL
Neutral
56
-
23,046
45,915
53,954
7.2
10.5
1.5
4.4
37.1
12.8
0.5
0.5
2.3
4.1
1.1
1.0
Vedanta
Neutral
109
-
32,197
71,445
81,910
26.2
26.3
12.9
19.2
8.4
5.7
0.6
0.5
7.2
8.9
0.9
0.7
Tata Steel
Neutral
253
-
24,538
136,805
149,228
11.3
11.9
26.4
36.8
9.6
6.9
0.8
0.7
6.0
8.0
0.7
0.7
Oil & Gas
Cairn India
Neutral
160
-
30,007
11,323
12,490
49.4
51.0
20.7
20.7
7.7
7.8
0.5
0.5
6.4
6.1
1.7
1.0
GAIL
Neutral
325
-
41,206
64,856
70,933
9.1
9.6
24.0
28.9
13.6
11.3
1.2
1.1
8.8
9.6
0.8
0.7
ONGC
Neutral
264
-
226,164
154,564
167,321
36.8
37.4
28.6
32.5
9.2
8.1
1.2
1.1
12.7
13.5
1.7
1.6
Petronet LNG
Accumulate
190
210
14,220
39,007
40,785
3.8
4.2
9.2
11.0
20.7
17.3
2.3
2.1
11.6
12.7
0.4
0.4
Indian Oil Corp
Accumulate
406
455
98,466
359,607
402,760
5.9
6.1
42.5
48.7
9.6
8.3
1.3
1.1
14.1
14.4
0.4
0.3
Reliance Industries
Neutral
912
-
295,409
313,085
362,904
13.1
13.8
78.4
92.9
11.6
9.8
1.2
1.1
10.8
11.6
1.4
1.2
Pharmaceuticals
Alembic Pharma
Neutral
717
-
13,519
2,601
3,115
21.2
20.2
20.8
23.9
34.5
30.0
11.1
8.4
37.2
31.8
5.2
4.3
Aurobindo Pharma
Accumulate
803
872
46,895
14,923
17,162
23.0
23.0
38.2
43.6
21.0
18.4
6.5
4.9
36.0
30.2
3.5
3.0
Aventis*
Neutral
3,939
-
9,071
2,156
2,455
15.1
16.8
109.7
133.9
35.9
29.4
4.9
4.0
18.4
22.5
3.9
3.3
Cadila Healthcare
Neutral
419
-
42,854
10,224
11,840
20.0
21.0
71.0
85.6
5.9
4.9
1.6
1.3
30.1
28.5
4.3
3.6
Cipla
Neutral
679
-
54,539
14,359
16,884
21.3
19.7
28.4
30.5
23.9
22.3
4.2
3.6
19.3
17.5
3.8
3.1
Dr Reddy's
Neutral
4,264
-
72,708
18,213
21,214
22.6
22.7
163.0
192.5
26.2
22.2
5.4
4.4
22.5
20.0
4.0
3.3
Dishman Pharma
Neutral
363
-
2,931
1,716
1,888
20.2
20.2
16.3
21.6
22.3
16.8
2.1
1.9
9.7
11.7
1.9
1.6
GSK Pharma*
Neutral
3,316
-
28,087
2,870
3,158
20.0
22.1
59.5
68.3
55.7
48.6
16.4
16.9
28.5
34.3
9.3
8.5
Indoco Remedies
Neutral
326
-
3,008
1,088
1,262
18.2
18.2
13.1
15.5
24.9
21.1
4.9
4.1
21.2
21.1
2.8
2.4
Ipca labs
Neutral
770
-
9,718
3,507
4,078
17.6
18.6
25.8
32.0
29.9
24.1
3.9
3.3
13.8
14.9
3.0
2.6
Lupin
Neutral
2,055
-
92,515
14,864
17,244
26.9
26.9
62.1
71.1
33.1
28.9
8.0
6.4
27.4
24.6
6.0
5.0
Sun Pharma
Accumulate
889
950
213,980
28,163
32,610
25.8
30.7
17.4
26.9
51.1
33.1
4.9
4.2
13.0
16.6
7.1
5.9
Stock Watch
October 19, 2015
Company Name
Reco
CMP
Target
Mkt Cap
Sales ( Čcr )
OPM(%)
EPS (Č)
PER(x)
P/BV(x)
RoE(%)
EV/Sales(x)
(Č)
Price ( Č)
( Č cr )
FY16E FY17E
FY16E
FY17E
FY16E
FY17E
FY16E
FY17E
FY16E
FY17E
FY16E
FY17E
FY16E
FY17E
Power
Tata Power
Neutral
70
-
18,838
35,923
37,402
22.6
22.8
4.1
5.2
17.2
13.5
1.3
1.2
7.5
9.3
1.5
1.4
NTPC
Buy
127
157
104,388
87,064
98,846
23.5
23.5
11.7
13.2
10.8
9.6
1.2
1.1
11.4
12.1
2.2
2.0
Power Grid
Buy
135
170
70,679
20,702
23,361
86.7
86.4
12.1
13.2
11.2
10.2
1.6
1.5
15.6
15.1
8.3
7.8
Telecom
Bharti Airtel
Neutral
350
-
139,849
101,748
109,191
32.1
31.7
12.0
12.5
29.2
28.0
2.0
1.9
6.9
6.7
2.0
1.8
Idea Cellular
Neutral
150
-
54,138
34,282
36,941
32.0
31.5
5.9
6.2
25.5
24.3
2.3
2.1
9.9
9.3
2.2
2.0
zOthers
Abbott India
Neutral
5,588
-
11,875
2,715
3,153
14.5
14.1
134.3
152.2
41.6
36.7
10.4
8.6
27.4
25.6
4.1
3.5
Bajaj Electricals
Buy
254
341
2,559
4,719
5,287
5.2
5.8
8.6
12.7
29.6
20.0
3.4
3.0
11.4
14.8
0.5
0.5
Finolex Cables
Neutral
251
-
3,836
2,728
3,036
10.8
11.0
14.4
16.8
17.4
15.0
2.7
2.3
15.2
15.3
1.2
1.0
Goodyear India*
Buy
568
655
1,309
1,953
1,766
12.4
12.0
67.4
59.6
8.4
9.5
2.1
1.8
27.7
20.2
0.5
0.4
Hitachi
Neutral
1,477
-
4,016
1,806
2,112
9.0
9.2
28.6
29.1
51.7
50.8
12.8
10.4
28.1
22.6
2.3
2.0
Jyothy Laboratories
Neutral
311
-
5,631
1,620
1,847
11.5
11.5
7.3
8.5
42.7
36.7
5.5
5.1
13.3
14.4
3.3
2.9
MRF
Neutral
41,828
-
17,740
20,727
14,841
19.3
18.6
4,905.8
3,351.9
8.5
12.5
2.7
2.2
37.6
19.6
0.8
1.1
Page Industries
Neutral
14,163
-
15,797
1,929
2,450
19.8
20.1
229.9
299.0
61.6
47.4
27.2
18.9
52.1
47.1
8.2
6.5
Relaxo Footwears
Neutral
536
-
6,438
1,767
2,152
12.3
12.5
19.3
25.1
27.9
21.4
6.8
5.3
27.7
27.8
3.7
3.0
Siyaram Silk Mills
Buy
954
1,221
894
1,653
1,873
11.7
12.2
99.3
122.1
9.6
7.8
1.7
1.5
19.5
20.2
0.7
0.6
Styrolution ABS India*
Neutral
814
-
1,432
1,271
1,440
8.6
9.2
32.0
41.1
25.4
19.8
2.6
2.3
10.7
12.4
1.1
1.0
Tree House
Buy
309
449
1,306
259
324
56.8
56.8
17.0
21.7
18.1
14.2
1.8
1.6
10.1
11.5
5.0
4.1
TVS Srichakra
Neutral
3,060
-
2,343
2,127
2,388
15.2
14.9
237.7
267.5
12.9
11.4
5.5
3.9
51.7
39.8
1.2
1.0
HSIL
Neutral
307
-
2,216
2,182
2,404
16.3
16.5
15.8
18.9
19.4
16.2
1.6
1.5
8.4
9.4
1.4
1.2
Kirloskar Engines India
Accumulate
280
297
4,043
2,634
3,252
10.1
12.0
10.9
17.4
25.6
16.0
2.9
2.6
11.4
16.8
1.2
0.9
Ltd
M M Forgings
Buy
549
797
662
563
671
22.1
22.9
51.0
66.5
10.8
8.3
2.2
1.8
23.1
24.1
1.3
1.1
Banco Products (India)
Neutral
140
-
1,001
1,208
1,353
11.0
12.3
10.8
14.5
13.0
9.7
1.5
1.3
11.9
14.5
0.8
0.7
Competent Automobiles Neutral
146
-
90
1,007
1,114
3.1
3.1
23.7
28.2
6.2
5.2
0.9
0.8
13.9
14.6
0.1
0.1
Nilkamal
Neutral
1,000
-
1,492
1,948
2,147
10.6
10.3
60.0
67.0
16.7
14.9
2.6
2.2
16.8
16.1
0.8
0.7
Visaka Industries
Accumulate
148
166
235
1,158
1,272
8.6
9.5
23.7
32.7
6.3
4.5
0.6
0.6
10.1
12.5
0.4
0.3
Transport Corporation of
Neutral
303
-
2,301
2,830
3,350
8.8
9.0
14.4
18.3
21.1
16.5
3.2
2.8
15.4
17.1
0.9
0.8
India
Elecon Engineering
Buy
74
87
810
1,452
1,596
14.0
14.7
4.4
6.2
16.8
11.9
1.4
1.3
8.6
11.2
0.9
0.7
Surya Roshni
Buy
139
183
610
2,992
3,223
8.3
8.5
14.7
18.3
9.5
7.6
0.9
0.8
9.8
11.0
0.5
0.5
MT Educare
Buy
145
169
578
286
366
18.3
17.7
7.7
9.4
18.8
15.5
4.0
3.5
20.2
21.1
1.9
1.5
Stock Watch
October 19, 2015
Company Name
Reco
CMP
Target Mkt Cap
Sales ( Čcr )
OPM(%)
EPS (Č)
PER(x)
P/BV(x)
RoE(%)
EV/Sales(x)
(Č)
Price ( Č)
( Č cr )
FY16E FY17E FY16E FY17E FY16E FY17E FY16E FY17E FY16E FY17E FY16E FY17E FY16E FY17E
zOthers
Radico Khaitan
Buy
93
112
1,240
1,565
1,687
11.9
12.4
5.4
6.6
17.2
14.2
1.4
1.3
8.0
9.0
1.3
1.2
Garware Wall Ropes
Accumulate
351
390
768
875
983
10.4
10.6
23.1
27.8
15.2
12.6
2.2
1.9
14.1
14.8
0.9
0.8
Wonderla Holidays
Accumulate
306
322
1,727
206
308
44.0
43.6
9.0
12.9
34.0
23.7
4.6
4.2
13.7
17.8
8.3
5.5
Linc Pen & Plastics
Accumulate
164
185
243
340
371
8.3
8.9
10.8
13.2
15.2
12.4
2.4
2.1
16.0
17.1
0.8
0.7
The Byke Hospitality
Accumulate
161
181
647
222
287
20.5
20.5
5.6
7.6
28.6
21.4
5.4
4.4
18.9
20.8
3.0
2.3
Source: Company, Angel Research; Note: *December year end; #September year end; &October year end; Price as on October 16, 2015
Market Outlook
October 19, 2015
Research Team Tel: 022 - 39357800
DISCLAIMER
Angel Broking Private Limited (hereinafter referred to as “Angel”) is a registered Member of National Stock Exchange of India Limited,
Bombay Stock Exchange Limited and Metropolitian Stock Exchange of India Limited. It is also registered as a Depository Participant with
CDSL and Portfolio Manager with SEBI. It also has registration with AMFI as a Mutual Fund Distributor. Angel Broking Private Limited is a
registered entity with SEBI for Research Analyst in terms of SEBI (Research Analyst) Regulations, 2014 vide registration number
INH000000164. Angel or its associates has not been debarred/ suspended by SEBI or any other regulatory authority for accessing
/dealing in securities Market. Angel or its associates including its relatives/analyst do not hold any financial interest/beneficial ownership
of more than 1% in the company covered by Analyst. Angel or its associates/analyst has not received any compensation / managed or co
-managed public offering of securities of the company covered by Analyst during the past twelve months. Angel/analyst has not served as
an officer, director or employee of company covered by Analyst and has not been engaged in market making activity of the company
covered by Analyst.
This document is solely for the personal information of the recipient, and must not be singularly used as the basis of any investment
decision. Nothing in this document should be construed as investment or financial advice. Each recipient of this document should make
such investigations as they deem necessary to arrive at an independent evaluation of an investment in the securities of the companies
referred to in this document (including the merits and risks involved), and should consult their own advisors to determine the merits and
risks of such an investment.
Reports based on technical and derivative analysis center on studying charts of a stock's price movement, outstanding positions and
trading volume, as opposed to focusing on a company's fundamentals and, as such, may not match with a report on a company's
fundamentals.
The information in this document has been printed on the basis of publicly available information, internal data and other reliable sources
believed to be true, but we do not represent that it is accurate or complete and it should not be relied on as such, as this document is for
general guidance only. Angel Broking Pvt. Limited or any of its affiliates/ group companies shall not be in any way responsible for any
loss or damage that may arise to any person from any inadvertent error in the information contained in this report. Angel Broking Pvt.
Limited has not independently verified all the information contained within this document. Accordingly, we cannot testify, nor make any
representation or warranty, express or implied, to the accuracy, contents or data contained within this document. While Angel Broking
Pvt. Limited endeavors to update on a reasonable basis the information discussed in this material, there may be regulatory, compliance,
or other reasons that prevent us from doing so.
This document is being supplied to you solely for your information, and its contents, information or data may not be reproduced,
redistributed or passed on, directly or indirectly.
Neither Angel Broking Pvt. Limited, nor its directors, employees or affiliates shall be liable for any loss or damage that may arise from or
in connection with the use of this information.
Note: Please refer to the important ‘Stock Holding Disclosure' report on the Angel website (Research Section). Also, please refer to the
latest update on respective stocks for the disclosure status in respect of those stocks. Angel Broking Pvt. Limited and its affiliates may have
investment positions in the stocks recommended in this report.