Market Outlook
August 19, 2015
Dealer’s Diary
Domestic Indices
Chg (%)
(Pts)
(Close)
BSE Sensex
(0.2)
(47)
27,832
Indian markets are expected to open on a flat note tracking the SGX Nifty.
Nifty
(0.1)
(11)
8,467
US markets fell breaking a three day gaining streak; led by decline in consumer and
MID CAP
0.5
54
11,542
energy stocks.
SMALL CAP
0.9
100
11,892
BSE HC
(0.6)
(102)
17,898
European markets fell led by a decline in commodity stocks.
BSE PSU
(0.5)
(35)
7,462
Indian markets ended marginally in the red led by weakness in PSU and oil
BANKEX
(0.2)
(42)
21,555
exploration and production stocks.
AUTO
0.6
117
19,454
METAL
(1.9)
(152)
7,756
News & Result Analysis
OIL & GAS
(0.0)
(1)
9,415
Moody’s cuts 2015 GDP growth forecast to 7%
Refer detailed news & result analysis on the following page
BSE IT
1.6
187
11,771
Global Indices
Chg (%)
(Pts)
(Close)
Markets Today
Dow Jones
(0.2)
(34)
17,511
The trend deciding level for the day is 27,873 / 8,475 levels. If NIFTY trades above
NASDAQ
(0.6)
(32)
5,059
this level during the first half-an-hour of trade then we may witness a further rally up
FTSE
(0.4)
(24)
6,526
to 27,999 - 28,167 / 8,517 - 8,567 levels. However, if NIFTY trades below
27,873 / 8,475 levels for the first half-an-hour of trade then it may correct towards
Nikkei
(0.3)
(66)
20,554
27,706 - 27,580 / 8,425 - 8,383 levels.
Hang Sang
(1.4)
(340)
23,475
Straits Times
(0.6)
(18)
3,050
Indices
S2
S1
PIVOT
R1
R2
Shanghai Com
(6.1)
(246)
3,748
SENSEX
27,580
27,706
27,873
27,999
28,167
NIFTY
8,383
8,425
8,475
8,517
8,567
Indian ADR
Chg (%)
(Pts)
(Close)
Net Inflows (August 14, 2015)
INFY
0.6
0.1
$18.0
` cr
Purch
Sales
Net
MTD
YTD
WIT
0.4
0.1
$12.5
FII
4,445
3,984
461
(489)
140,481
IBN
0.4
0.0
$9.8
MFs
919
708
211
732
58,681
HDB
(1.4)
(0.9)
$62.0
FII Derivatives (August 18, 2015)
Advances / Declines
BSE
NSE
` cr
Purch
Sales
Net
Open Interest
Advances
1,626
884
Index Futures
1,299
1,280
19
14,172
Declines
1,256
631
Stock Futures
3,381
2,973
408
53,115
Unchanged
114
58
Gainers / Losers
Volumes (` cr)
Gainer
Loser
BSE
3,155
Company
Price (`)
chg (%)
Company
Price (`)
chg (%)
NSE
17,015
TATAELXSI
2,132
19.7
INDIANB
154
(4.9)
JPINFRATEC
15
10.9
KAILASH
4
(4.9)
ESCORTS
169
9.5
SUNTV
348
(4.5)
JKTYRE
119
8.5
GAIL
330
(4.4)
GPPL
209
8.5
COALINDIA
364
(4.2)
Market Outlook
August 19, 2015
Moody’s cuts 2015 GDP growth forecast to 7%
Moody’s Investors Service cut its forecast for India’s GDP growth to around 7% in
2015 from 7.5% on account of lower-than-expected rainfall in the ongoing
monsoon season. The monsoon rainfall has remained 10% below normal as on
17-Aug-2015. In addition to weak monsoon, subdued global growth conditions
and uncertain global financial environment have led the agency to revise its
growth forecasts downwards. The rating agency has maintained its forecast for
2016 GDP growth at 7.5% as it expects the domestic consumption growth to
continue to be supported by moderation in inflation and favourable
demographics. It has however pointed towards risks ahead that include delays in
the government’s reform plan which could dent growth momentum.
Economic and Political News
India's domestic air traffic rises 29.3% in July
Modi to bet $1.5 billion on palm oil plan as imports surge
Moody's cuts India's 2015 growth forecast to 7% on deficient monsoon
Corporate News
FSSAI says reviewing court order, no decision on approaching SC yet
Aurobindo: Strong growth visibility led by US approvals
Rajesh Exports bags `1,170-cr order from UAE
Market Outlook
August 19, 2015
Top Picks
Large Cap
Market
CMP
Target
Upside
Company
Sector
Rating
Cap (` Cr)
(`)
(`)
(%)
Axis Bank
Financials
133,297
Buy
561
716
27.6
ICICI Bank
Financials
174,708
Buy
301
370
22.9
Inox Wind
Capital Goods
8,836
Buy
398
505
26.8
LIC Housing
Financials
25,168
Buy
499
590
18.3
Finance
Power Grid
Power
71,751
Buy
137
170
24.0
TCS
IT
535,634
Buy
2,735
3,168
15.9
Yes Bank
Financials
32,882
Buy
786
989
25.8
Infosys
IT
267,318 Accumulate
1,164
1,306
12.2
Tech Mahindra IT
54,071 Accumulate
562
646
14.9
Source: Angel Research, Bloomberg
Mid Cap
Market
CMP
Target
Upside
Company
Sector
Rating
Cap (` Cr)
(`)
(`)
(%)
Bajaj Electricals
Others
2,654
Buy
263
341
29.5
Hindustan Media Ven. Media
1,735
Buy
236
292
23.5
JK Tyre
Auto Ancillary
2,689
Buy
119
147
24.0
MBL Infrastructures
Construction
1,096
Buy
265
395
49.1
Radico Khaitan
Others
1,229
Buy
92
112
21.3
Surya Roshni
Others
616
Buy
141
183
30.1
Garware Wall Ropes Others
751 Accumulate
343
390
13.6
Minda Industries
Auto Ancillary
933 Accumulate
588
652
10.8
MT Educare
Others
511 Accumulate
128
141
9.9
Source: Angel Research, Bloomberg
Market Outlook
August 18, 2015
Global economic events release calendar
Date
Time
Country Event Description
Unit
Period
Bloomberg Data
Last Reported Estimated
August 18, 2015
6:00PM
US
Building permits
Thousands
Jul
1,337.00
1,230.00
6:00PM
US
Housing Starts
Thousands
Jul
1,174.00
1,186.00
2:00PM
UK
CPI (YoY)
% Change
Jul
--
August 19, 2015
6:00PM
US
Consumer price index (mom)
% Change
Jul
0.30
0.20
August 20, 2015
6:00PM
US
Initial Jobless claims
Thousands
Aug 15
274.00
272.00
7:30PM
US
Existing home sales
Million
Jul
5.49
5.43
August 21, 2015
7:30PM
Euro Zone Euro-Zone Consumer Confidence
Value
Aug A
(7.10)
(6.90)
1:00PM
Germany PMI Services
Value
Aug P
53.80
53.60
1:00PM
Germany PMI Manufacturing
Value
Aug P
51.80
51.60
August 25, 2015
11:30AM
Germany GDP nsa (YoY)
% Change
2Q F
1.60
--
7:30PM
US
New home sales
Thousands
Jul
482.00
510.00
7:30PM
US
Consumer Confidence
S.A./ 1985=100
Aug
90.91
93.00
August 27, 2015
6:00PM
US
GDP Qoq (Annualised)
% Change
2Q S
2.30
3.40
August 28, 2015
2:00PM
UK
GDP (YoY)
% Change
2Q P
2.60
--
September 1, 2015
1:25PM
Germany Unemployment change (000's)
Thousands
Aug
9.00
--
6:30AM
China
PMI Manufacturing
Value
Aug
50.00
--
2:00PM
UK
PMI Manufacturing
Value
Aug
51.90
--
September 3, 2015
5:15PM
Euro Zone ECB announces interest rates
%
Sep 3
0.05
--
September 4, 2015
2:30PM
Euro Zone Euro-Zone GDP s.a. (QoQ)
% Change
2Q P
0.30
--
6:00PM
US
Change in Nonfarm payrolls
Thousands
Aug
215.00
--
6:00PM
US
Unnemployment rate
%
Aug
5.30
--
September 8, 2015
China
Exports YoY%
% Change
Aug
(8.30)
--
September 9, 2015
7:00AM
China
Consumer Price Index (YoY)
% Change
Aug
1.60
--
2:00PM
UK
Industrial Production (YoY)
% Change
Jul
1.50
--
Source: Bloomberg, Angel Research
Market Outlook
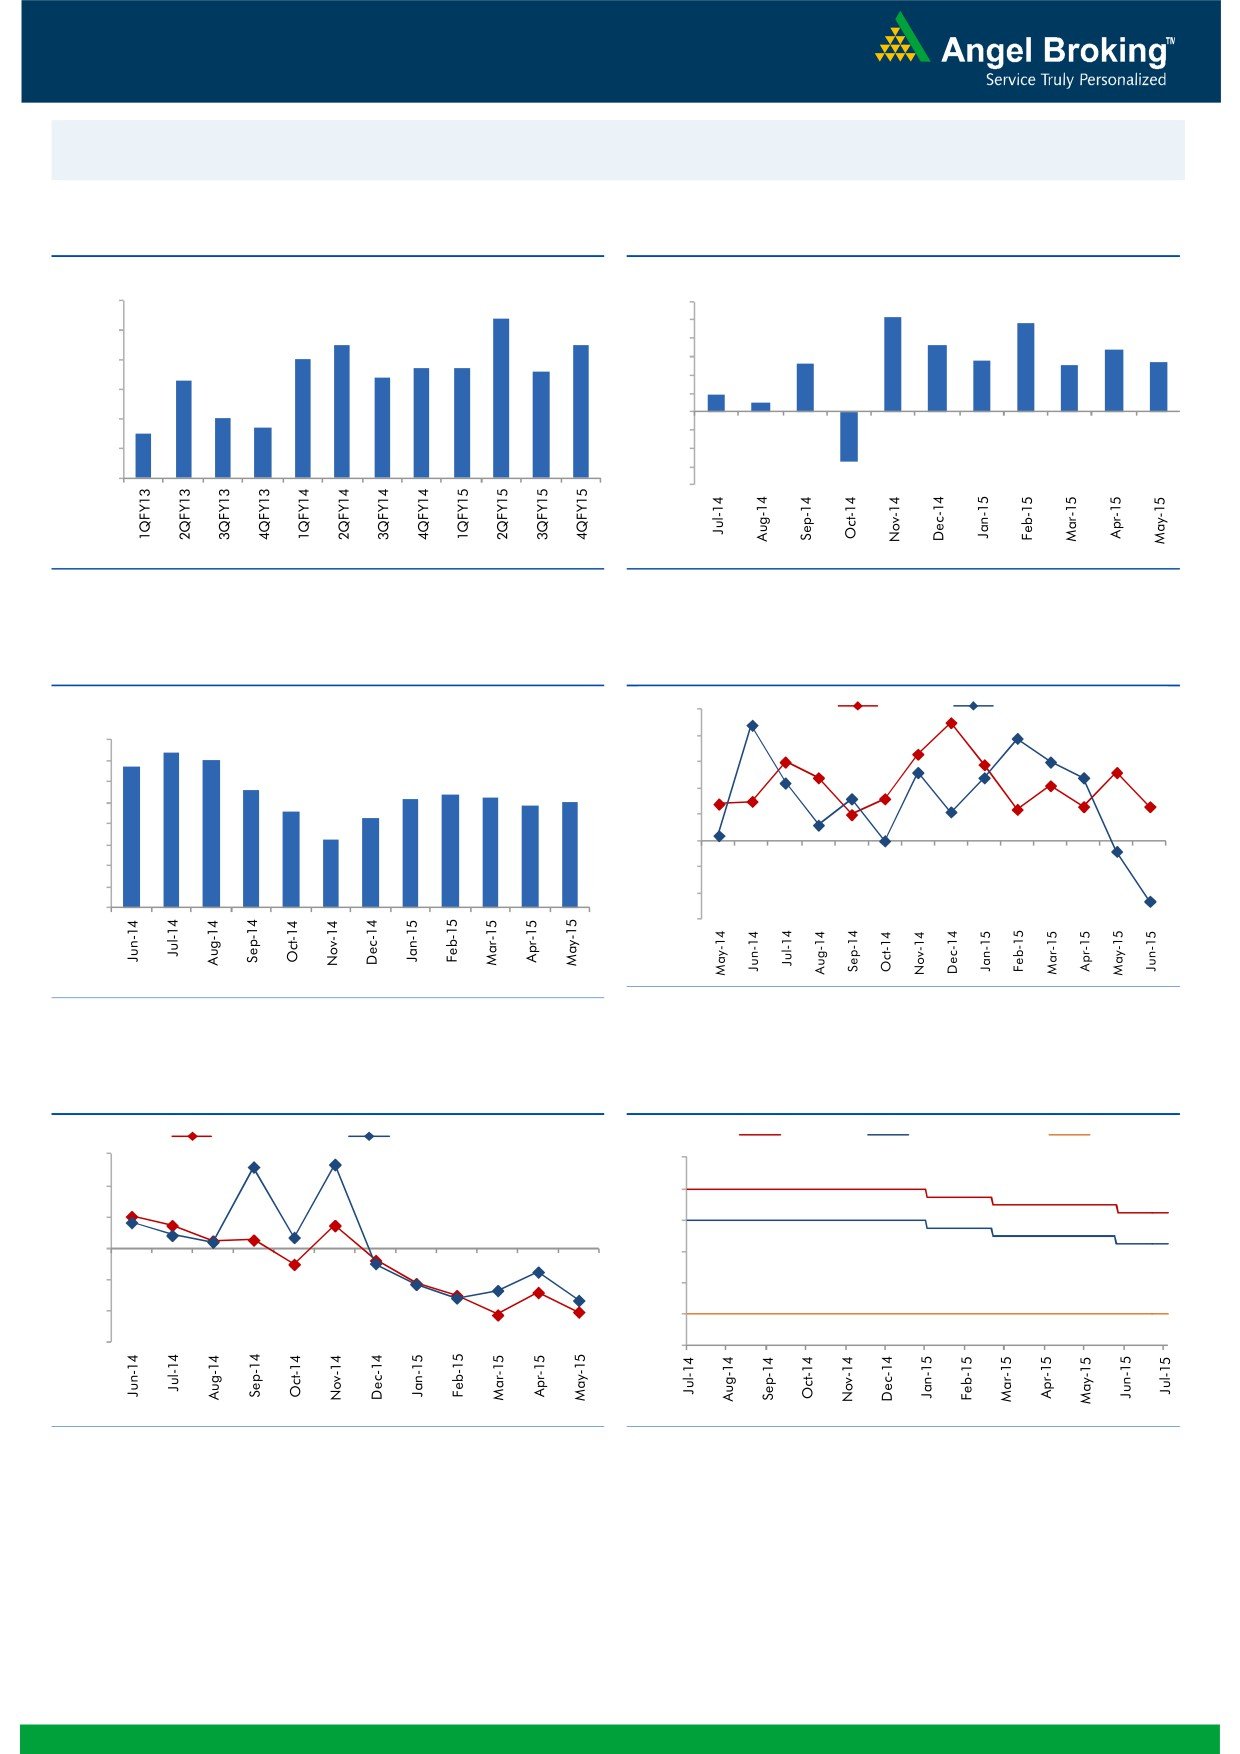
August 19, 2015
Macro watch
Exhibit 1: Quarterly GDP trends
Exhibit 2: IIP trends
(%)
(%)
9.0
8.4
6.0
5.2
4.8
5.0
8.0
7.5
7.5
3.6
4.0
3.4
7.0
2.8
2.7
6.7
6.7
6.6
2.6
2.5
7.0
6.3
6.4
3.0
2.0
0.9
6.0
0.5
1.0
5.0
4.7
-
5.0
4.5
(1.0)
4.0
(2.0)
(3.0)
3.0
(2.7)
(4.0)
Source: CSO, Angel Research
Source: MOSPI, Angel Research
Exhibit 3: Monthly CPI inflation trends
Exhibit 4: Manufacturing and services PMI
(%)
55.0
Mfg. PMI
Services PMI
8.0
7.4
54.0
7.0
6.8
7.0
53.0
5.6
5.2
5.4
5.3
6.0
4.9
5.0
52.0
4.6
5.0
4.3
51.0
4.0
3.3
3.0
50.0
2.0
49.0
1.0
48.0
-
47.0
Source: Market, Angel Research; Note: Level above 50 indicates expansion
Source: MOSPI, Angel Research
Exhibit 5: Exports and imports growth trends
Exhibit 6: Key policy rates
(%)
Exports yoy growth
Imports yoy growth
(%)
Repo rate
Reverse Repo rate
CRR
30.0
9.00
20.0
8.00
10.0
7.00
0.0
6.00
(10.0)
5.00
(20.0)
4.00
(30.0)
3.00
Source: Bloomberg, Angel Research
Source: RBI, Angel Research
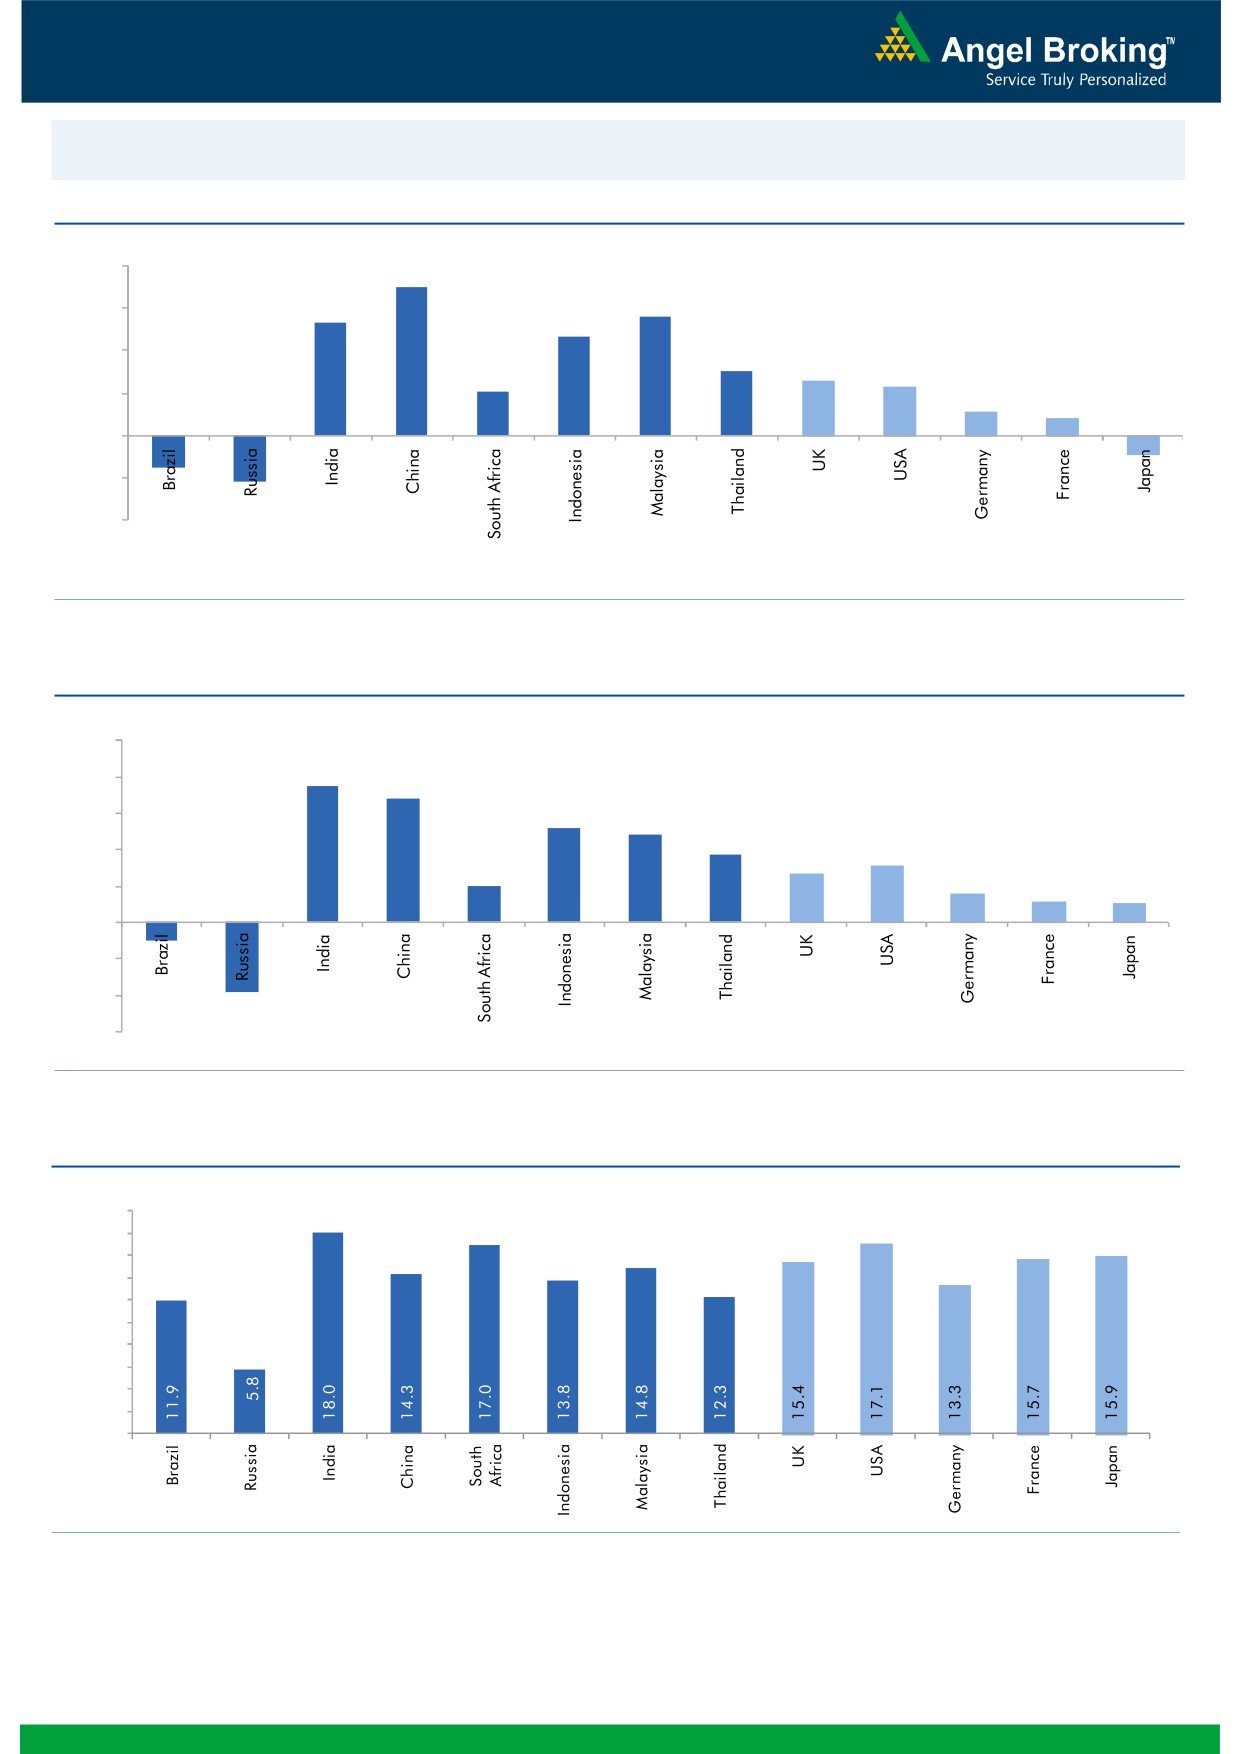
Market Outlook
August 19, 2015
Global watch
Exhibit 1: Latest quarterly GDP Growth (%, yoy) across select developing and developed countries
(%)
8.0
7.0
5.6
6.0
5.3
4.7
4.0
3.0
2.6
2.1
2.3
2.0
1.1
0.8
(1.6)
(2.2)
(0.9)
-
(2.0)
(4.0)
Source: Bloomberg, Angel Research
Exhibit 2: 2015 GDP Growth projection by IMF (%, yoy) across select developing and developed countries
(%)
10.0
7.5
8.0
6.8
6.0
5.2
4.8
3.7
4.0
3.1
2.7
2.0
1.6
2.0
1.2
1.0
(1.0)
(3.8)
-
(2.0)
(4.0)
(6.0)
Source: IMF, Angel Research
Exhibit 3: One year forward P-E ratio across select developing and developed countries
(x)
20.0
18.0
16.0
14.0
12.0
10.0
8.0
6.0
4.0
2.0
-
Source: Bloomberg, Angel Research
Market Outlook
August 19, 2015
Exhibit 4: Relative performance of indices across globe
Returns (%)
Country
Name of index
Closing price
1M
3M
1YR
Brazil
Bovespa
47,451
(9.3)
(15.6)
(14.9)
Russia
Micex
1,691
2.5
1.9
19.3
India
Nifty
8,467
(1.7)
0.5
11.9
China
Shanghai Composite
3,748
(6.9)
(16.4)
67.0
South Africa
Top 40
45,467
(3.7)
(5.8)
(1.4)
Mexico
Mexbol
43,872
(3.2)
(3.1)
(2.2)
Indonesia
LQ45
762
(8.7)
(15.2)
(13.7)
Malaysia
KLCI
1,580
(7.9)
(12.3)
(14.7)
Thailand
SET 50
894
(8.4)
(9.9)
(12.3)
USA
Dow Jones
17,511
(3.2)
(4.3)
3.5
UK
FTSE
6,526
(3.7)
(6.7)
(3.4)
Japan
Nikkei
20,554
(1.0)
1.2
35.1
Germany
DAX
10,916
(6.5)
(7.9)
18.1
France
CAC
4,971
(3.0)
(3.2)
16.9
Source: Bloomberg, Angel Research
Market Outlook
August 19, 2015
Stock Watch
Company Name
Reco
CMP
Target
Mkt Cap
Sales ( Čcr )
OPM(%)
EPS (Č)
PER(x)
P/BV(x)
RoE(%)
EV/Sales(x)
(Č)
Price ( Č)
( Č cr )
FY16E FY17E
FY16E
FY17E
FY16E
FY17E
FY16E
FY17E
FY16E
FY17E
FY16E
FY17E
FY16E
FY17E
Agri / Agri Chemical
Rallis
Neutral
226
-
4,385
2,075
2,394
14.4
14.4
9.5
11.0
23.7
20.5
4.7
4.1
21.1
21.3
2.2
1.9
United Phosphorus
Neutral
559
-
23,972
13,698
15,752
17.6
17.6
32.1
38.5
17.4
14.5
3.4
2.8
21.4
21.3
1.9
1.5
Auto & Auto Ancillary
Ashok Leyland
Neutral
97
-
27,676
17,850
20,852
10.6
11.1
3.2
4.3
30.4
22.6
5.0
4.7
16.4
20.8
1.5
1.3
Bajaj Auto
Neutral
2,522
-
72,978
23,842
27,264
19.8
19.6
128.4
144.4
19.6
17.5
6.0
5.2
30.5
29.5
2.6
2.3
Eicher Motors
Neutral
20,945
-
56,849
11,681
15,550
15.3
16.9
358.5
564.3
58.4
37.1
17.6
13.1
29.8
34.9
4.8
3.5
Hero Motocorp
Neutral
2,642
-
52,754
28,500
33,028
13.8
14.1
144.2
166.3
18.3
15.9
6.7
5.7
36.7
36.0
1.7
1.4
L G Balakrishnan & Bros Neutral
479
-
752
1,254
1,394
11.6
11.8
35.9
41.7
13.4
11.5
1.8
1.6
13.5
13.8
0.7
0.6
Mahindra and Mahindra Accumulate
1,366
1,493
84,857
40,088
45,176
13.8
14.0
59.6
70.4
22.9
19.4
3.8
3.3
16.6
17.2
1.8
1.5
Maruti
Neutral
4,635
-
140,001
58,102
68,587
16.7
16.9
182.0
225.5
25.5
20.6
5.1
4.3
19.9
21.0
2.2
1.8
Minda Industries
Accumulate
588
652
933
2,567
2,965
7.3
8.0
38.8
54.3
15.2
10.8
2.2
1.8
14.4
16.8
0.5
0.4
Rane Brake Lining
Accumulate
337
366
266
454
511
11.1
11.4
23.8
28.1
14.1
12.0
2.0
1.8
14.2
15.3
0.7
0.7
Setco Automotive
Neutral
227
-
607
594
741
12.7
13.7
8.4
15.8
27.0
14.4
2.8
2.4
10.4
16.9
1.5
1.2
Tata Motors
Buy
350
455
100,966
267,464
311,225
13.7
13.7
34.6
41.8
10.1
8.4
1.3
1.1
13.2
13.9
0.6
0.5
TVS Motor
Accumulate
230
255
10,939
11,839
13,985
7.0
8.0
10.8
15.9
21.3
14.5
5.4
4.3
25.5
29.7
0.9
0.7
Amara Raja Batteries
Neutral
1,038
-
17,738
5,101
6,326
17.7
17.5
30.8
37.8
33.7
27.5
8.3
6.6
24.6
24.2
3.4
2.7
Exide Industries
Neutral
165
-
13,987
7,363
8,247
13.7
14.5
6.6
7.7
24.9
21.4
3.2
2.9
12.6
13.3
1.6
1.5
Apollo Tyres
Neutral
202
-
10,275
12,428
13,262
16.8
16.4
21.9
21.1
9.2
9.6
1.6
1.4
17.0
14.1
0.9
0.9
Ceat
Neutral
1,108
-
4,483
6,041
6,770
14.3
13.9
101.5
117.7
10.9
9.4
2.2
1.8
20.0
19.2
0.9
0.7
JK Tyres
Buy
119
147
2,689
7,446
7,942
15.2
14.7
19.6
21.0
6.1
5.7
1.5
1.2
25.2
21.7
0.8
0.7
Swaraj Engines
Neutral
937
-
1,163
593
677
14.5
14.8
51.2
60.8
18.3
15.4
4.3
3.8
23.3
24.8
1.8
1.5
Subros
Neutral
96
-
577
1,268
1,488
11.6
11.9
3.7
6.6
26.0
14.6
1.7
1.6
6.8
11.4
0.8
0.6
Indag Rubber
Neutral
203
-
533
283
329
17.0
17.2
13.0
15.4
15.7
13.2
3.4
2.8
21.8
21.6
1.6
1.3
Capital Goods
ACE
Neutral
46
-
457
660
839
4.7
8.2
1.0
3.9
46.2
11.8
1.4
1.3
3.2
11.3
0.8
0.7
BEML
Neutral
1,365
-
5,685
3,277
4,006
6.0
8.9
29.2
64.3
46.8
21.2
2.6
2.4
5.7
11.7
1.8
1.4
BGR Energy
Neutral
134
-
968
3,615
3,181
9.5
9.4
16.7
12.4
8.0
10.8
0.8
0.7
10.0
7.0
0.7
0.8
BHEL
Neutral
261
-
63,944
33,722
35,272
10.8
11.7
10.5
14.2
24.9
18.4
1.8
1.7
7.0
9.0
2.0
1.9
Blue Star
Accumulate
355
387
3,192
3,649
4,209
5.0
5.9
9.2
14.7
38.8
24.1
7.0
6.6
9.1
17.5
1.0
0.8
Crompton Greaves
Accumulate
187
204
11,730
13,484
14,687
4.9
6.2
4.5
7.1
41.6
26.4
2.9
2.7
7.2
10.8
1.0
0.9
Inox Wind
Buy
398
505
8,836
4,980
5,943
17.0
17.5
26.6
31.6
15.0
12.6
4.5
3.3
35.0
30.0
1.9
1.6
Market Outlook
August 19, 2015
Stock Watch
Company Name
Reco
CMP
Target
Mkt Cap
Sales ( Čcr )
OPM(%)
EPS (Č)
PER(x)
P/BV(x)
RoE(%)
EV/Sales(x)
(Č)
Price ( Č)
( Č cr )
FY16E
FY17E
FY16E
FY17E
FY16E
FY17E
FY16E
FY17E
FY16E
FY17E
FY16E
FY17E
FY16E
FY17E
Capital Goods
KEC International
Neutral
143
-
3,667
8,791
9,716
6.1
6.8
5.4
8.2
26.4
17.4
2.6
2.4
10.0
14.0
0.6
0.6
Thermax
Neutral
1,041
-
12,402
6,413
7,525
7.4
8.5
30.5
39.3
34.1
26.5
5.3
4.6
15.0
17.0
1.9
1.6
Cement
ACC
Accumulate
1,389
1,548
26,079
11,856
14,092
14.5
17.8
47.6
76.1
29.2
18.3
3.0
2.8
10.6
15.7
2.1
1.7
Ambuja Cements
Neutral
227
-
35,182
10,569
12,022
20.7
22.2
8.7
10.7
26.1
21.2
3.3
3.1
13.0
15.2
2.9
2.6
India Cements
Buy
84
112
2,574
4,716
5,133
15.9
16.9
3.7
7.5
22.7
11.2
0.8
0.8
3.8
7.3
0.9
0.7
JK Cement
Buy
640
767
4,477
4,056
4,748
14.5
17.0
22.6
41.1
28.3
15.6
2.5
2.3
9.3
15.3
1.5
1.3
J K Lakshmi Cement
Buy
363
430
4,268
2,947
3,616
16.7
19.9
11.5
27.2
31.5
13.3
3.0
2.6
9.8
20.8
1.9
1.5
Mangalam Cements
Neutral
232
-
619
1,053
1,347
10.5
13.3
8.4
26.0
27.6
8.9
1.2
1.1
4.3
12.5
1.0
0.7
Orient Cement
Accumulate
170
183
3,485
1,854
2,524
21.2
22.2
7.7
11.1
22.1
15.3
3.2
2.7
13.3
15.7
2.6
1.8
Ramco Cements
Neutral
349
-
8,303
4,036
4,545
20.8
21.3
15.1
18.8
23.1
18.6
2.8
2.5
12.9
14.3
2.6
2.2
Shree Cement^
Neutral
11,000
-
38,320
7,150
8,742
26.7
28.6
228.0
345.5
48.2
31.8
7.1
6.0
15.7
20.3
5.1
4.1
UltraTech Cement
Neutral
3,133
-
85,977
27,562
31,548
20.4
22.3
111.9
143.3
28.0
21.9
4.0
3.4
15.2
16.8
3.2
2.7
Construction
ITNL
Accumulate
118
130
2,917
7,360
8,825
34.0
35.9
1.0
5.0
118.3
23.7
0.5
0.5
0.3
1.4
3.8
3.7
KNR Constructions
Neutral
562
-
1,626
915
1,479
14.3
13.9
20.3
37.2
27.7
15.1
2.5
2.2
9.6
15.6
1.9
1.2
Larsen & Toubro
Accumulate
1,798
2,013
167,298
68,920
82,446
10.9
11.5
57.0
73.0
31.5
24.6
2.9
2.7
13.6
15.5
2.7
2.2
Gujarat Pipavav Port
Neutral
209
-
10,099
740
843
53.1
53.6
8.0
10.0
26.1
20.9
4.1
3.3
20.4
19.4
13.2
11.2
MBL Infrastructures
Buy
265
395
1,096
2,507
2,986
12.4
14.4
21.5
20.5
12.3
12.9
1.5
1.3
12.6
12.7
1.2
1.1
PNC Infratech
Neutral
526
-
2,699
1,798
2,132
13.2
13.5
22.0
30.0
23.9
17.5
2.2
1.9
11.5
11.4
1.6
1.4
Financials
Allahabad Bank
Neutral
98
-
5,600
8,859
9,817
3.0
3.0
23.7
30.1
4.1
3.3
0.5
0.4
10.6
12.3
-
-
Axis Bank
Buy
561
716
133,297
26,522
31,625
3.6
3.6
36.2
45.4
15.5
12.4
3.0
2.6
18.2
19.6
-
-
Bank of Baroda
Neutral
213
-
47,050
18,934
21,374
2.0
2.0
13.2
15.1
16.1
14.1
1.2
1.1
7.1
7.7
-
-
Bank of India
Neutral
179
-
11,922
17,402
20,003
2.0
2.1
40.3
50.7
4.5
3.5
0.4
0.4
9.0
10.4
-
-
Canara Bank
Neutral
349
-
17,980
15,805
17,745
2.0
2.2
64.3
73.5
5.4
4.8
0.6
0.5
10.8
11.3
-
-
Dena Bank
Neutral
46
-
2,604
3,580
4,040
2.1
2.2
8.4
10.9
5.6
4.3
0.5
0.4
6.8
8.4
-
-
Federal Bank
Neutral
67
-
11,550
3,522
4,045
3.2
3.2
12.2
14.1
5.5
4.8
0.7
0.6
12.9
13.4
-
-
HDFC
Accumulate
1,267
1,343
199,696
11,198
13,321
3.5
3.5
45.1
53.7
28.1
23.6
5.8
5.2
27.2
28.2
-
-
HDFC Bank
Buy
1,087
1,255
273,132
38,629
47,500
4.5
4.7
52.6
66.4
20.7
16.4
3.8
3.2
19.6
21.2
-
-
ICICI Bank
Buy
301
370
174,708
36,037
41,647
3.5
3.6
22.9
26.7
13.1
11.3
2.2
1.9
15.7
15.9
-
-
IDBI Bank
Neutral
70
-
11,244
9,806
11,371
1.7
1.9
10.0
16.3
7.1
4.3
0.5
0.5
6.8
10.4
-
-
Market Outlook
August 19, 2015
Stock Watch
Company Name
Reco
CMP
Target
Mkt Cap
Sales ( Čcr )
OPM(%)
EPS (Č)
PER(x)
P/BV(x)
RoE(%)
EV/Sales(x)
(Č)
Price ( Č)
( Č cr )
FY16E FY17E
FY16E
FY17E
FY16E
FY17E
FY16E
FY17E
FY16E
FY17E
FY16E
FY17E
FY16E
FY17E
Financials
Indian Bank
Neutral
154
-
7,382
6,454
7,321
2.5
2.6
26.4
33.3
5.8
4.6
0.5
0.4
8.1
9.6
-
-
LIC Housing Finance
Buy
499
590
25,168
2,934
3,511
2.3
2.3
30.9
36.8
16.1
13.6
2.6
2.3
16.8
17.5
-
-
Oriental Bank
Neutral
178
-
5,327
7,930
8,852
2.5
2.5
51.8
57.1
3.4
3.1
0.4
0.3
9.3
9.5
-
-
Punjab Natl.Bank
Neutral
171
-
31,620
24,160
27,777
2.9
3.0
18.5
24.6
9.2
6.9
0.9
0.8
8.8
10.8
-
-
South Ind.Bank
Neutral
23
-
3,092
1,999
2,249
2.4
2.4
3.5
4.0
6.6
5.7
0.8
0.7
12.6
13.1
-
-
St Bk of India
Neutral
284
-
214,843
86,900
100,550
3.1
3.1
22.1
27.7
12.9
10.3
1.6
1.4
12.7
14.3
-
-
Union Bank
Neutral
218
-
13,876
12,995
14,782
2.4
2.4
32.3
40.9
6.8
5.3
0.8
0.7
10.7
12.3
-
-
Vijaya Bank
Neutral
40
-
3,458
3,474
3,932
1.8
1.9
5.9
7.2
6.9
5.6
0.6
0.5
8.1
9.3
-
-
Yes Bank
Buy
786
989
32,882
7,006
8,825
3.1
3.3
61.4
77.1
12.8
10.2
2.4
2.0
20.1
21.3
-
-
FMCG
Asian Paints
Neutral
901
-
86,448
16,553
19,160
16.0
16.2
17.7
21.5
51.0
41.9
13.5
12.2
29.4
31.2
5.1
4.4
Britannia
Neutral
3,314
-
39,763
8,065
9,395
9.6
10.2
47.2
65.5
70.2
50.6
23.3
22.1
38.3
41.2
4.8
4.1
Colgate
Neutral
1,988
-
27,036
4,836
5,490
19.5
19.7
48.5
53.2
41.0
37.4
30.0
26.2
99.8
97.5
5.5
4.8
Dabur India
Neutral
303
-
53,240
9,370
10,265
17.1
17.2
7.3
8.1
41.3
37.4
12.5
10.1
33.7
30.6
5.6
5.1
GlaxoSmith Con*
Neutral
6,244
-
26,259
4,919
5,742
17.2
17.4
168.3
191.2
37.1
32.7
10.5
9.0
28.8
28.9
4.9
4.2
Godrej Consumer
Neutral
1,305
-
44,450
10,168
12,886
16.1
16.1
32.1
38.4
40.7
34.0
8.3
7.6
19.7
21.0
4.5
3.5
HUL
Neutral
871
-
188,533
34,940
38,957
17.5
17.7
20.8
24.7
41.9
35.3
46.6
37.2
110.5
114.2
5.2
4.6
ITC
Buy
315
409
252,499
41,068
45,068
37.8
37.4
13.9
15.9
22.6
19.8
7.6
6.7
34.1
33.8
5.8
5.2
Marico
Neutral
430
-
27,732
6,551
7,766
15.7
16.0
10.4
12.5
41.4
34.4
12.0
10.0
33.2
32.4
4.2
3.5
Nestle*
Accumulate
6,168
6,646
59,465
11,291
12,847
22.2
22.3
158.9
184.6
38.8
33.4
20.3
18.3
55.0
57.3
5.1
4.5
Tata Global
Accumulate
134
152
8,460
8,635
9,072
9.8
9.9
6.5
7.6
20.6
17.7
2.1
2.0
6.8
7.4
0.9
0.9
IT
HCL Tech^
Buy
969
1,132
136,253
42,038
47,503
23.5
23.5
56.4
62.9
17.2
15.4
4.0
3.1
23.2
19.8
2.8
2.3
Infosys
Accumulate
1,164
1,306
267,318
60,250
66,999
28.0
28.0
58.3
63.7
20.0
18.3
4.2
3.6
20.9
19.7
3.8
3.2
TCS
Buy
2,735
3,168
535,634
108,420
123,559
28.8
28.7
127.2
143.9
21.5
19.0
8.6
8.0
39.9
41.8
4.5
3.9
Tech Mahindra
Accumulate
562
646
54,071
25,566
28,890
16.0
17.0
26.3
31.9
21.4
17.6
3.8
3.3
17.9
18.6
1.9
1.6
Wipro
Buy
571
719
141,088
52,414
58,704
23.7
23.8
38.4
42.3
14.9
13.5
2.9
2.6
19.5
18.0
2.3
1.9
Media
D B Corp
Accumulate
321
356
5,898
2,241
2,495
27.8
27.9
21.8
25.6
14.8
12.5
3.9
3.4
26.7
28.5
2.6
2.3
HT Media
Neutral
86
-
2,011
2,495
2,603
11.2
11.2
7.3
8.6
11.8
10.1
0.9
0.9
7.4
8.1
0.3
0.3
Jagran Prakashan
Accumulate
142
156
4,626
1,939
2,122
26.0
26.0
8.3
9.2
17.1
15.4
2.9
2.6
17.5
17.1
2.3
2.1
Sun TV Network
Neutral
348
-
13,708
2,779
3,196
70.2
70.5
22.8
27.3
15.3
12.7
3.8
3.4
26.7
28.3
4.7
4.1
Market Outlook
August 19, 2015
Stock Watch
Company Name
Reco
CMP
Target
Mkt Cap
Sales ( Čcr )
OPM(%)
EPS (Č)
PER(x)
P/BV(x)
RoE(%)
EV/Sales(x)
(Č)
Price ( Č)
( Č cr )
FY16E FY17E
FY16E
FY17E
FY16E
FY17E
FY16E
FY17E
FY16E
FY17E
FY16E
FY17E
FY16E
FY17E
Media
Hindustan Media
Buy
236
292
1,735
920
1,031
20.0
20.0
19.2
20.9
12.3
11.3
2.0
1.7
16.4
15.3
1.4
1.3
Ventures
Metals & Mining
Coal India
Buy
364
450
229,947
77,595
89,628
22.9
24.4
27.6
30.0
13.2
12.1
5.7
5.7
33.9
33.2
2.2
2.0
Hind. Zinc
Neutral
147
-
62,239
15,546
16,821
47.5
49.0
19.7
20.3
7.5
7.3
1.3
1.1
17.2
16.6
1.8
1.3
Hindalco
Neutral
89
-
18,399
112,328
119,817
7.7
7.9
16.3
20.1
5.5
4.4
0.4
0.4
8.0
8.5
0.6
0.5
JSW Steel
Neutral
988
-
23,883
48,125
53,595
18.8
21.0
46.9
97.5
21.1
10.1
1.0
0.9
4.4
9.5
1.3
1.2
NMDC
Neutral
95
-
37,843
12,544
13,330
59.5
59.7
16.3
16.5
5.9
5.8
1.0
1.0
5.1
9.9
1.8
1.7
SAIL
Neutral
57
-
23,624
56,365
63,383
6.9
8.0
7.1
8.2
8.0
7.0
0.5
0.5
7.0
7.1
1.0
0.9
Vedanta
Neutral
103
-
30,492
81,842
88,430
30.6
32.8
20.2
25.7
5.1
4.0
0.4
0.3
7.5
8.5
0.7
0.5
Tata Steel
Neutral
252
-
24,441
136,805
149,228
11.3
11.9
26.4
36.8
9.5
6.8
0.8
0.7
6.0
8.0
0.7
0.7
Oil & Gas
Cairn India
Neutral
150
-
28,170
12,617
14,513
33.7
40.0
25.5
27.7
5.9
5.4
0.4
0.4
7.4
7.7
0.9
0.7
GAIL
Neutral
330
-
41,885
75,595
85,554
8.6
8.0
31.8
36.1
10.4
9.1
1.1
1.1
10.7
11.4
0.7
0.6
ONGC
Neutral
261
-
223,170
174,773
192,517
22.7
24.8
34.6
38.2
7.5
6.8
1.1
1.0
14.2
14.9
1.4
1.2
Petronet LNG
Accumulate
187
210
13,988
39,007
40,785
3.8
4.2
9.2
11.0
20.4
17.0
2.3
2.1
11.6
12.7
0.4
0.4
Reliance Industries
Accumulate
944
1,050
305,794
339,083
384,014
7.8
9.5
75.7
94.5
12.5
10.0
1.2
1.2
10.7
12.2
1.2
1.1
Pharmaceuticals
Alembic Pharma
Neutral
734
-
13,841
2,601
3,115
21.2
20.2
20.8
23.9
35.3
30.7
11.3
8.6
37.2
31.8
5.3
4.4
Aurobindo Pharma
Neutral
791
-
46,180
14,435
16,600
22.6
22.6
36.1
41.2
21.9
19.2
6.5
5.0
34.5
29.3
3.5
3.0
Aventis*
Neutral
4,085
-
9,408
2,156
2,455
15.1
16.8
109.7
133.9
37.2
30.5
5.1
4.2
18.4
22.5
4.1
3.4
Cadila Healthcare
Neutral
1,984
-
40,617
10,224
11,840
20.0
21.0
71.0
85.6
27.9
23.2
7.5
5.9
30.1
28.5
4.0
3.4
Cipla
Neutral
684
-
54,904
14,051
16,515
20.4
18.7
26.6
28.4
25.7
24.1
4.3
3.7
18.2
16.5
3.9
3.3
Dr Reddy's
Neutral
4,188
-
71,401
17,903
20,842
22.7
22.8
160.5
189.5
26.1
22.1
5.3
4.4
22.2
21.7
3.9
3.3
Dishman Pharma
Buy
223
312
1,801
1,716
1,888
20.2
20.2
16.3
21.6
13.7
10.3
1.3
1.2
9.7
11.7
1.2
1.0
GSK Pharma*
Neutral
3,649
-
30,905
2,870
3,158
20.0
22.1
59.5
68.3
61.3
53.4
18.1
18.6
28.5
34.3
10.3
9.4
Indoco Remedies
Neutral
361
-
3,327
1,088
1,262
18.2
18.2
13.1
15.5
27.6
23.3
5.4
4.5
21.2
21.1
3.1
2.7
Ipca labs
Neutral
815
-
10,287
3,507
4,078
17.6
18.6
25.8
32.0
31.6
25.5
4.1
3.5
13.8
14.9
3.2
2.7
Lupin
Neutral
1,755
-
78,974
14,864
17,244
26.9
26.9
62.1
71.1
28.3
24.7
6.9
5.4
27.4
24.6
5.0
4.2
Sun Pharma
Accumulate
889
950
213,896
28,163
32,610
25.8
30.7
17.4
26.9
51.1
33.0
4.8
4.2
13.0
16.6
7.1
5.9
Power
Tata Power
Neutral
68
-
18,419
38,302
38,404
14.1
13.1
5.1
6.0
13.3
11.4
1.3
1.2
9.2
10.3
1.4
1.3
NTPC
Buy
127
157
104,965
87,064
98,846
23.5
23.5
11.7
13.2
10.9
9.6
1.2
1.1
11.4
12.1
2.2
2.0
Power Grid
Buy
137
170
71,751
20,702
23,361
86.7
86.4
12.1
13.2
11.4
10.4
1.7
1.5
15.6
15.1
8.4
7.8
Market Outlook
August 19, 2015
Stock Watch
Company Name
Reco
CMP
Target
Mkt Cap
Sales ( Čcr )
OPM(%)
EPS (Č)
PER(x)
P/BV(x)
RoE(%)
EV/Sales(x)
(Č)
Price ( Č)
( Č cr )
FY16E FY17E
FY16E
FY17E
FY16E
FY17E
FY16E
FY17E
FY16E
FY17E
FY16E
FY17E
FY16E
FY17E
Telecom
Bharti Airtel
Neutral
385
-
154,040
101,748
109,191
32.1
31.7
12.0
12.5
32.1
30.8
2.2
2.1
6.9
6.7
2.2
1.9
Idea Cellular
Accumulate
160
171
57,543
34,282
36,941
32.0
31.5
5.9
6.2
27.1
25.8
2.5
2.3
9.9
9.3
2.3
2.1
zOthers
Abbott India
Neutral
4,718
-
10,025
2,715
3,153
14.5
14.1
134.3
152.2
35.1
31.0
8.8
7.2
27.4
25.6
3.4
2.9
Bajaj Electricals
Buy
263
341
2,654
4,719
5,287
5.2
5.8
8.6
12.7
30.8
20.8
3.5
3.1
11.4
14.8
0.6
0.5
Finolex Cables
Neutral
248
-
3,791
2,728
3,036
10.8
11.0
14.4
16.8
17.2
14.8
2.6
2.3
15.2
15.3
1.1
1.0
Goodyear India*
Neutral
627
-
1,445
1,953
1,766
12.4
12.0
67.4
59.6
9.3
10.5
2.3
2.0
27.7
20.2
0.5
0.5
Hitachi
Neutral
1,367
-
3,716
1,806
2,112
9.0
9.2
28.6
29.1
47.8
47.0
11.9
9.6
28.1
22.6
2.1
1.8
Jyothy Laboratories
Neutral
322
-
5,824
1,620
1,847
11.5
11.5
7.3
8.5
44.1
38.0
5.7
5.3
13.3
14.4
3.5
3.0
MRF
Neutral
44,162
-
18,730
20,727
14,841
19.3
18.6
4,905.8
3,351.9
9.0
13.2
2.9
2.4
37.6
19.6
0.9
1.2
Page Industries
Neutral
14,559
-
16,239
1,929
2,450
19.8
20.1
229.9
299.0
63.3
48.7
27.9
19.4
52.1
47.1
8.4
6.6
Relaxo Footwears
Neutral
560
-
6,714
1,767
2,152
12.3
12.5
19.3
25.1
29.1
22.3
7.1
5.5
27.7
27.8
3.9
3.1
Siyaram Silk Mills
Accumulate
1,105
1,221
1,035
1,653
1,873
11.7
12.2
99.3
122.1
11.1
9.1
2.0
1.7
19.5
20.2
0.8
0.7
Styrolution ABS India*
Neutral
840
-
1,477
1,271
1,440
8.6
9.2
32.0
41.1
26.2
20.5
2.7
2.4
10.7
12.4
1.1
1.0
Tree House
Accumulate
403
433
1,704
259
324
56.8
56.8
17.0
21.7
23.7
18.6
2.4
2.1
10.1
11.5
6.5
5.4
TVS Srichakra
Neutral
3,137
-
2,402
2,127
2,388
15.2
14.9
237.7
267.5
13.2
11.7
5.6
4.0
51.7
39.8
1.2
1.0
HSIL
Buy
299
434
2,159
2,085
2,436
18.5
18.6
21.7
28.9
13.8
10.3
1.4
1.3
10.0
12.1
1.2
0.9
Kirloskar Engines India
Accumulate
274
297
3,962
2,634
3,252
10.1
12.0
10.9
17.4
25.1
15.7
2.8
2.5
11.4
16.8
1.1
0.9
Ltd
M M Forgings
Buy
674
797
814
563
671
22.1
22.9
51.0
66.5
13.2
10.1
2.8
2.2
23.1
24.1
1.6
1.3
Banco Products (India)
Neutral
141
-
1,010
1,208
1,353
11.0
12.3
10.8
14.5
13.1
9.8
1.5
1.3
11.9
14.5
0.8
0.7
Competent Automobiles Neutral
172
-
106
1,007
1,114
3.1
3.1
23.7
28.2
7.3
6.1
1.0
0.9
13.9
14.6
0.1
0.1
Nilkamal
Neutral
1,054
-
1,573
1,948
2,147
10.6
10.3
60.0
67.0
17.6
15.7
2.7
2.4
16.8
16.1
0.9
0.7
Visaka Industries
Neutral
166
-
264
1,158
1,272
8.6
9.5
23.7
32.7
7.0
5.1
0.7
0.6
10.1
12.5
0.4
0.3
Transport Corporation of
Neutral
306
-
2,331
2,830
3,350
8.8
9.0
14.4
18.3
21.3
16.7
3.3
2.9
15.4
17.1
0.9
0.8
India
Elecon Engineering
Accumulate
83
87
901
1,452
1,596
14.0
14.7
4.4
6.2
18.7
13.3
1.6
1.4
8.6
11.2
0.9
0.8
Surya Roshni
Buy
141
183
616
2,992
3,223
8.3
8.5
14.7
18.3
9.6
7.7
0.9
0.8
9.8
11.0
0.5
0.5
MT Educare
Accumulate
128
141
511
275
355
18.3
17.3
7.4
8.8
17.4
14.5
3.5
3.1
20.2
21.1
1.8
1.3
Radico Khaitan
Buy
92
112
1,229
1,565
1,687
11.9
12.4
5.4
6.6
17.1
14.0
1.4
1.3
8.0
9.0
1.3
1.2
Garware Wall Ropes
Accumulate
298
390
652
875
983
10.4
10.6
23.1
27.8
12.9
10.7
1.8
1.6
14.1
14.8
0.9
0.7
Source: Company, Angel Research; Note: *December year end; #September year end; &October year end; Price as on August 18, 2015
Market Outlook
August 19, 2015
Research Team Tel: 022 - 39357800
DISCLAIMER
Angel Broking Private Limited (hereinafter referred to as “Angel”) is a registered Member of National Stock Exchange of India Limited,
Bombay Stock Exchange Limited and MCX Stock Exchange Limited. It is also registered as a Depository Participant with CDSL and
Portfolio Manager with SEBI. It also has registration with AMFI as a Mutual Fund Distributor. Angel Broking Private Limited is a registered
entity with SEBI for Research Analyst in terms of SEBI (Research Analyst) Regulations, 2014 vide registration number INH000000164.
Angel or its associates has not been debarred/ suspended by SEBI or any other regulatory authority for accessing /dealing in securities
Market. Angel or its associates including its relatives/analyst do not hold any financial interest/beneficial ownership of more than 1% in
the company covered by Analyst. Angel or its associates/analyst has not received any compensation / managed or co-managed public
offering of securities of the company covered by Analyst during the past twelve months. Angel/analyst has not served as an officer,
director or employee of company covered by Analyst and has not been engaged in market making activity of the company covered by
Analyst.
This document is solely for the personal information of the recipient, and must not be singularly used as the basis of any investment
decision. Nothing in this document should be construed as investment or financial advice. Each recipient of this document should make
such investigations as they deem necessary to arrive at an independent evaluation of an investment in the securities of the companies
referred to in this document (including the merits and risks involved), and should consult their own advisors to determine the merits and
risks of such an investment.
Reports based on technical and derivative analysis center on studying charts of a stock's price movement, outstanding positions and
trading volume, as opposed to focusing on a company's fundamentals and, as such, may not match with a report on a company's
fundamentals.
The information in this document has been printed on the basis of publicly available information, internal data and other reliable sources
believed to be true, but we do not represent that it is accurate or complete and it should not be relied on as such, as this document is for
general guidance only. Angel Broking Pvt. Limited or any of its affiliates/ group companies shall not be in any way responsible for any
loss or damage that may arise to any person from any inadvertent error in the information contained in this report. Angel Broking Pvt.
Limited has not independently verified all the information contained within this document. Accordingly, we cannot testify, nor make any
representation or warranty, express or implied, to the accuracy, contents or data contained within this document. While Angel Broking
Pvt. Limited endeavors to update on a reasonable basis the information discussed in this material, there may be regulatory, compliance,
or other reasons that prevent us from doing so.
This document is being supplied to you solely for your information, and its contents, information or data may not be reproduced,
redistributed or passed on, directly or indirectly.
Neither Angel Broking Pvt. Limited, nor its directors, employees or affiliates shall be liable for any loss or damage that may arise from or
in connection with the use of this information.
Note: Please refer to the important ‘Stock Holding Disclosure' report on the Angel website (Research Section). Also, please refer to the
latest update on respective stocks for the disclosure status in respect of those stocks. Angel Broking Pvt. Limited and its affiliates may have
investment positions in the stocks recommended in this report.