Market Outlook
May 19, 2016
Market Cues
Domestic Indices
Chg (%)
(Pts)
(Close)
BSE Sensex
(0.3)
(69)
25,705
Indian markets are expected to open in negative tracking SGX Nifty and Asian
Nifty
(0.3)
(21)
7,870
indices.
Mid Cap
(0.0)
(1)
11,203
U.S markets erased gains to close off session highs on Wednesday after the Federal
Small Cap
0.2
24
11,169
Reserve's April meeting minutes revealed "most" members are ready for a rate hike
as early as June. While the Nasdaq and S&P 500 closed higher, the Dow Jones
Bankex
(0.1)
(19)
19,059
ended slightly lower
The European markets closed mostly higher on Wednesday as investors reacted to
Global Indices
Chg (%)
(Pts)
(Close)
volatile oil markets and awaited the minutes of the latest Federal Reserve meeting.
Dow Jones
(0.0)
(3)
17,527
Indian markets fell on Wednesday, mirroring weak global cues as a string of
Nasdaq
0.5
23
4,739
optimistic data prints out of the U.S. and hawkish comments from three Federal
FTSE
(0.0)
(2)
6,166
Reserve officials brought the issue of interest rate rises in the U.S. back into focus.
Nikkei
(0.0)
(8)
16,645
News Analysis
Hang Seng
(1.5)
(292)
19,826
Result Review: Kirloskar Oil Engines
Shanghai Com
(1.3)
(36)
2,808
Detailed analysis on Pg2
Advances / Declines
BSE
NSE
Investor’s Ready Reckoner
Advances
1,229
734
Key Domestic & Global Indicators
Declines
1,341
779
Stock Watch: Latest investment recommendations on 150+ stocks
Unchanged
178
101
Refer Pg5 onwards
Top Picks
Volumes (` Cr)
CMP
Target
Upside
Company
Sector
Rating
BSE
2,614
(`)
(`)
(%)
Amara Raja
Auto & Auto Ancillary Accumulate
950
1,076
13.3
NSE
15,653
HCL Tech
IT
Buy
742
1,000
34.7
LIC Housing
Financials
Buy
461
592
28.3
Net Inflows (` Cr)
Net
Mtd
Ytd
Bharat Electronics
Capital Goods
Buy
1,150
1,414
23.0
FII
132
1,475
13,265
Navkar Corporation Others
Buy
185
265
43.3
MFs
(141)
2,016
4,612
More Top Picks on Pg4
Key Upcoming Events
Top Gainers
Price (`)
Chg (%)
Previous
Consensus
Date
Region
Event Description
Polaris
209
9.5
Reading
Expectations
Abirlanuvo
1,016
5.4
May 19 UK
Jobless claims change
6.70
4.50
May 20 US
Existing home sales
5.33
5.40
Pel
1,404
5.1
May 23 Germany
PMI Services
54.10
-
Ibrealest
93
5.0
May 24 US
New home sales
511
-
Prestige
177
4.7
6.(
More Events on Pg5
Top Losers
Price (`)
Chg (%)
Hathway
34
(5.8)
Monsanto
2,329
(5.2)
Mothersumi
276
(4.9)
Gskcons
5,850
(3.9)
Unitdspr
2,541
(3.2)
As on May 18, 2016
Market Outlook
May 19, 2016
Result Review
Kirloskar Oil Engines - NEUTRAL
For 4QFY2016, Kirloskar Oil Engines (KOEL) reported an excellent set of numbers.
The top-line for the quarter witnessed 8.9% YoY to INR 684cr against our estimate
of INR 631cr. The surge in top-line is on account of higher other operating income
(INR 21cr v/s INR 11cr in 4QFY2015) and, as per our reckoning increase in
revenue from the telecom segment and higher tiller sales as the company had
guided in the past quarter that it was awaiting subsidy disbursement by four state
governments. On the operating front, the EBITDA margin expanded by 499bp YoY
to 13.2% against our estimate of 9.0% on account of lower raw material and
employee expenses. Apart from higher other operating income, we estimate the
margins may have improved owing to higher mix of spare sales. There was an
exceptional item during the quarter for stamp duty payable on previous scheme of
arrangement and as a result, the company has made provision of ~INR 15cr.
Also, the tax expense was lower owing to company utilizing MAT credit of INR
22cr. Adjusting for exceptional item the net profit grew by 118.3% YoY to INR
58cr. We currently have a NEUTRAL rating on the stock and may update our
rating post 4QFY2016 earnings concall.
Economic and Political News
Sugar industry makes a turnaround on back of strong policy and rise in
demand for ethanol
Govt allows bulk export of rice bran oil
Good monsoon positive for economy, inflation: CEA Arvind Subramanian
Corporate News
Force Motors to invest `300 cr for expansion in FY17
Maruti launches updated Alto 800 with enhanced fuel efficiency
Dr Reddy's recalls 50,000 bottles of Ondansetron tabs in US
Quarterly Bloomberg Brokers Consensus Estimate
Lupin Ltd. Consol - May 19, 2016
Particulars (` cr)
4QFY16E
4QFY15
y-o-y (%)
3QFY16
q-o-q (%)
Net sales
3,808
3,054
24.7
3,358
13.4
EBITDA
1,053
789
33.4
877
20.1
EBITDA margin (%)
27.6
25.8
26.1
Net profit
679
547
24.1
530
28.1
Market Outlook
May 19, 2016
Britannia Industries Ltd. Consol - May 20, 2016
Particulars (` cr)
4QFY16E
4QFY15
y-o-y (%)
3QFY16
q-o-q (%)
Net sales
2,243
2032
10.4
2224
0.9
EBITDA
325
253
28.5
312
4.3
EBITDA margin (%)
14.5
12.5
14
Net profit
219
167
31.1
207
5.8
ITC Ltd. - May 20, 2016
Particulars (` cr)
4QFY16E
4QFY15
y-o-y (%)
3QFY16
q-o-q (%)
Net sales
9,811
9,188
6.8
9103
7.8
EBITDA
3,512
3,243
8.3
3605
(2.6)
EBITDA margin (%)
35.8
35.3
39.6
Net profit
2,504
2,361
6.1
2653
(5.6)
IDBI Bank Ltd. - May 20, 2016
Particulars (` cr)
4QFY16E
4QFY15
y-o-y (%)
3QFY16
q-o-q (%)
Net profit
(767)
546
0.0
(2184)
35.1
Tata Power Co. Ltd. Consol- May 23, 2016
Particulars (` cr)
4QFY16E
4QFY15
y-o-y (%)
3QFY16
q-o-q (%)
Net sales
9,250
8,167
13.3
9,230
0.2
EBITDA
2,009
1,962
2.4
2,472
(18.7)
EBITDA margin (%)
21.7
24.0
26.8
Net profit
280
159
75.8
212
32.5
Bharat Petroleum Corp. Ltd. - May 23, 2016
Particulars (` cr)
4QFY16E
4QFY15
y-o-y (%)
3QFY16
q-o-q (%)
Net sales
40,365
51,304
(21.3)
46613
(13.4)
EBITDA
2,970
4,496
(33.9)
2417
22.9
EBITDA margin (%)
7.4
8.8
5.2
Net profit
1,822
2,853
(36.1)
1489
22.4
Market Outlook
May 19, 2016
Top Picks
Large Cap
Market Cap
CMP
Target
Upside
Company
Rationale
(` Cr)
(`)
(`)
(%)
To outpace battery industry growth due to better technological
Amara Raja Batteries
16,220
950
1,076
13.3
products leading to market share gains in both the automotive
OEM and replacement segments.
Uptick in defense capex by government when coupled with
Bharat Electronics
27,596
1,150
1,414
23.0
BELs strong market positioning, indicate that good times are
ahead for BEL.
The stock is trading at attractive valuations and is factoring all
HCL Tech
1,04,699
742
1,000
34.7
the bad news.
Strong visibility for a robust 20% earnings trajectory, coupled
HDFC Bank
2,88,560
1,141
1,262
10.6
with high quality of earnings on account of high quality retail
business and strategic focus on highly rated corporates.
Back on the growth trend, expect a long term growth of 14%
Infosys
2,78,780
1,210
1,374
13.6
to be a US$20bn in FY2020.
LICHF continues to grow its retail loan book at a healthy pace
with improvement in asset quality. We expect the company to
LIC Housing Finance
23,278
461
592
28.3
post a healthy loan book which is likely to reflect in a strong
earnings growth.
Huge bid pipeline of re-development works at Delhi and other
NBCC
11,804
984
1,089
10.7
State Governments and opportunity from Smart City, positions
NBCC to report strong growth, going forward.
Source: Company, Angel Research
Mid Cap
Market Cap
CMP
Target
Upside
Company
Rationale
(` Cr)
(`)
(`)
(%)
Favorable outlook for the AC industry to augur well for
Cooling products business which is out pacing the market
Blue Star
3,934
437
481
10.0
growth. EMPPAC division's profitability to improve once
operating environment turns around.
With a focus on the low and medium income (LMI) consumer
Dewan Housing
5,896
202
270
33.6
segment, the company has increased its presence in tier-II &
III cities where the growth opportunity is immense.
Commencement of new projects, downtrend in the interest
IL&FS Transport
2,423
74
93
26.3
rate cycle, to lead to stock re-rating
Economic recovery to have favourable impact on advertising
& circulation revenue growth. Further, the acquisition of a
Jagran Prakashan
5,525
169
205
21.3
radio business (Radio City) would also boost the company's
revenue growth.
Speedier execution and speedier sales, strong revenue visibilty
Mahindra Lifespace
1,823
444
554
24.7
in short-to-long run, attractive valuations
Massive capacity expansion along with rail advantage at ICD
Navkar Corporation
2,637
185
265
43.3
as well CFS augurs well for the company
Earnings boost on back of stable material prices and
Radico Khaitan
1,193
90
125
39.4
favourable pricing environment. Valuation discount to peers
provides additional comfort
Strong brands and distribution network would boost growth
Siyaram Silk Mills
1,010
1,078
1,354
25.7
going ahead. Stock currently trades at an inexpensive
valuation.
Source: Company, Angel Research
Market Outlook
May 19, 2016
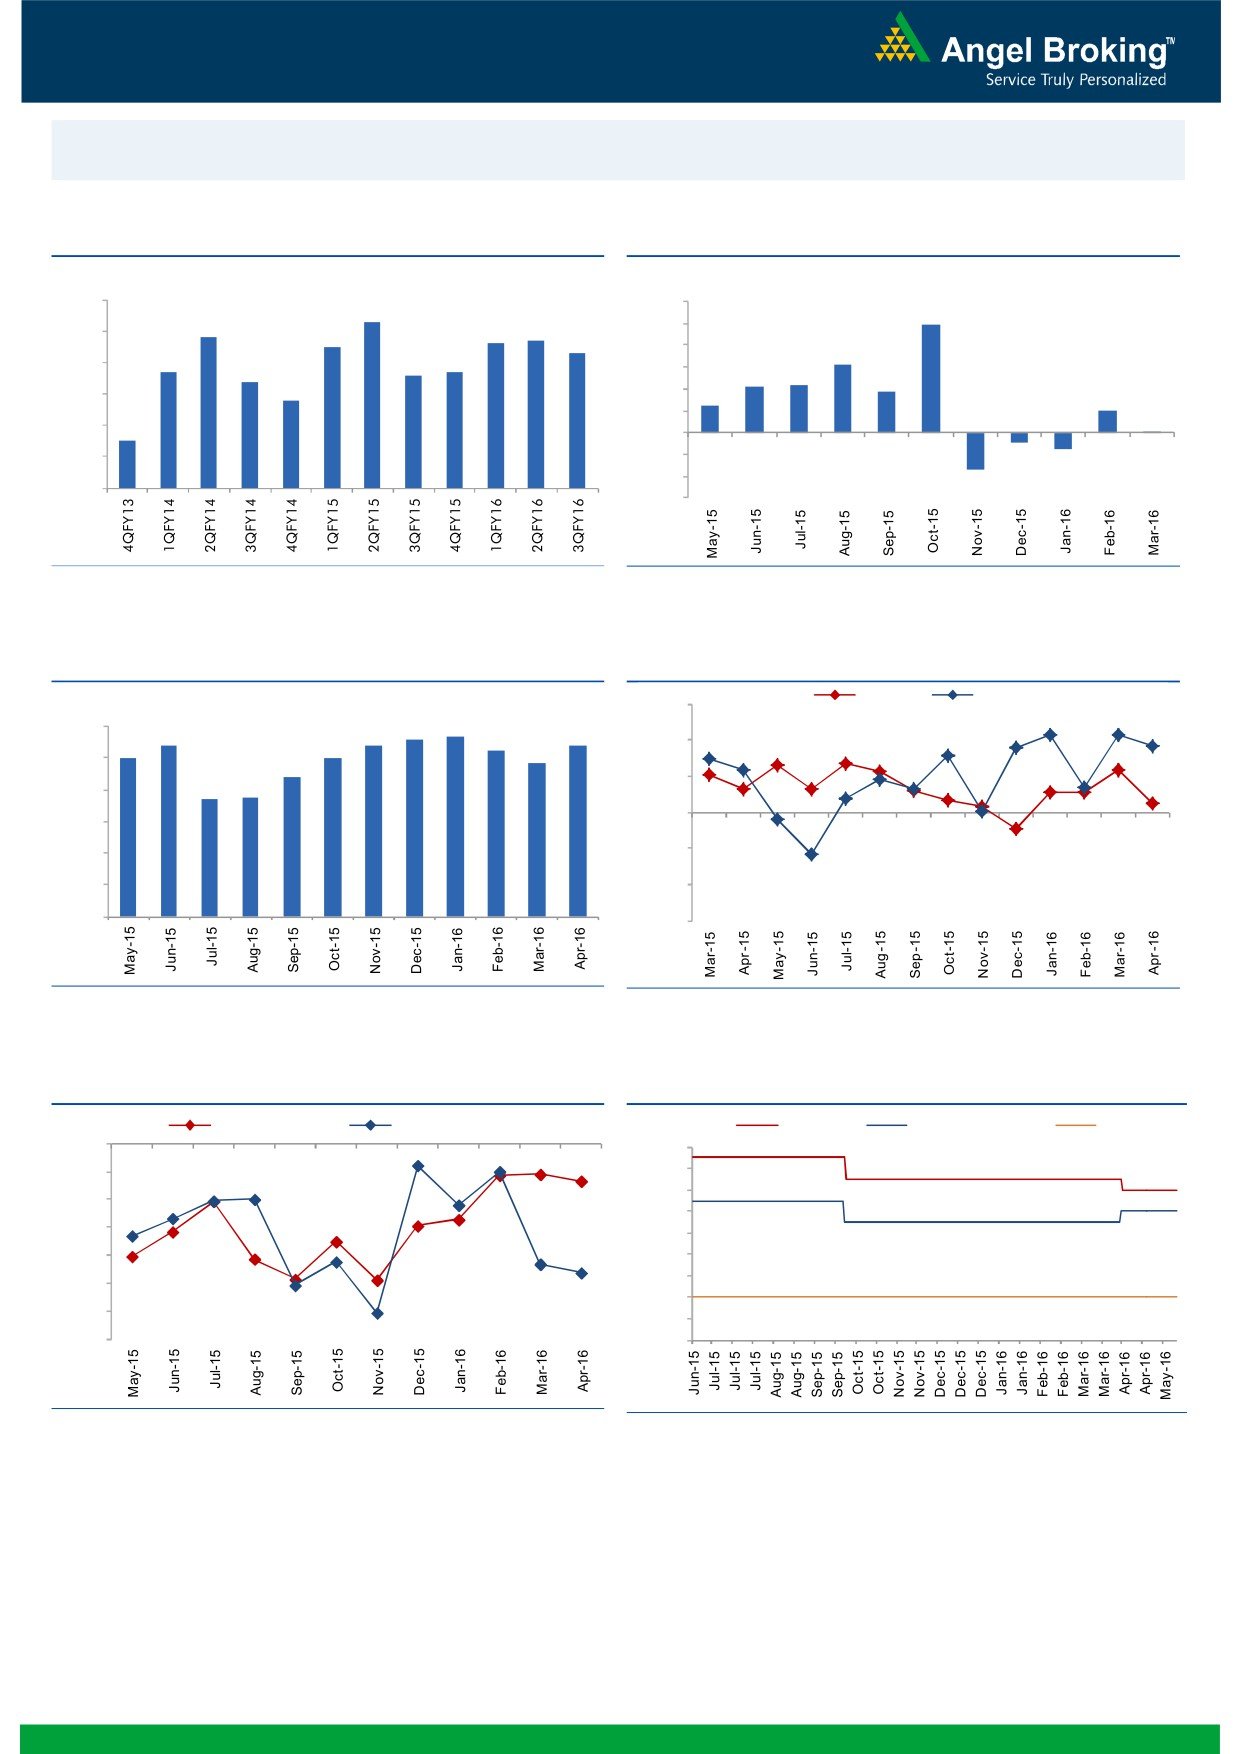
Macro watch
Exhibit 1: Quarterly GDP trends
Exhibit 2: IIP trends
(%)
(%)
9.0
8.3
12.0
9.9
7.8
7.7
8.0
7.5
7.6
10.0
7.3
8.0
6.3
6.7
6.6
6.7
7.0
6.4
6.0
4.2
4.3
3.7
5.8
4.0
2.5
6.0
2.0
2.0
0.1
5.0
4.5
-
4.0
(2.0)
(0.9)
(1.5)
(4.0)
3.0
(3.4)
(6.0)
Source: CSO, Angel Research
Source: MOSPI, Angel Research
Exhibit 3: Monthly CPI inflation trends
Exhibit 4: Manufacturing and services PMI
Mfg. PMI
Services PMI
(%)
56.0
5.6
5.7
6.0
5.4
5.4
5.4
5.3
5.0
5.0
54.0
4.8
5.0
4.4
52.0
3.7
3.7
4.0
50.0
3.0
48.0
2.0
1.0
46.0
-
44.0
Source: MOSPI, Angel Research
Source: Market, Angel Research; Note: Level above 50 indicates expansion
Exhibit 5: Exports and imports growth trends
Exhibit 6: Key policy rates
(%)
Exports yoy growth
Imports yoy growth
(%)
Repo rate
Reverse Repo rate
CRR
0.0
7.50
(5.0)
7.00
6.50
(10.0)
6.00
(15.0)
5.50
(20.0)
5.00
4.50
(25.0)
4.00
(30.0)
3.50
(35.0)
3.00
Source: Bloomberg, Angel Research
Source: RBI, Angel Research
Market Outlook
May 19, 2016
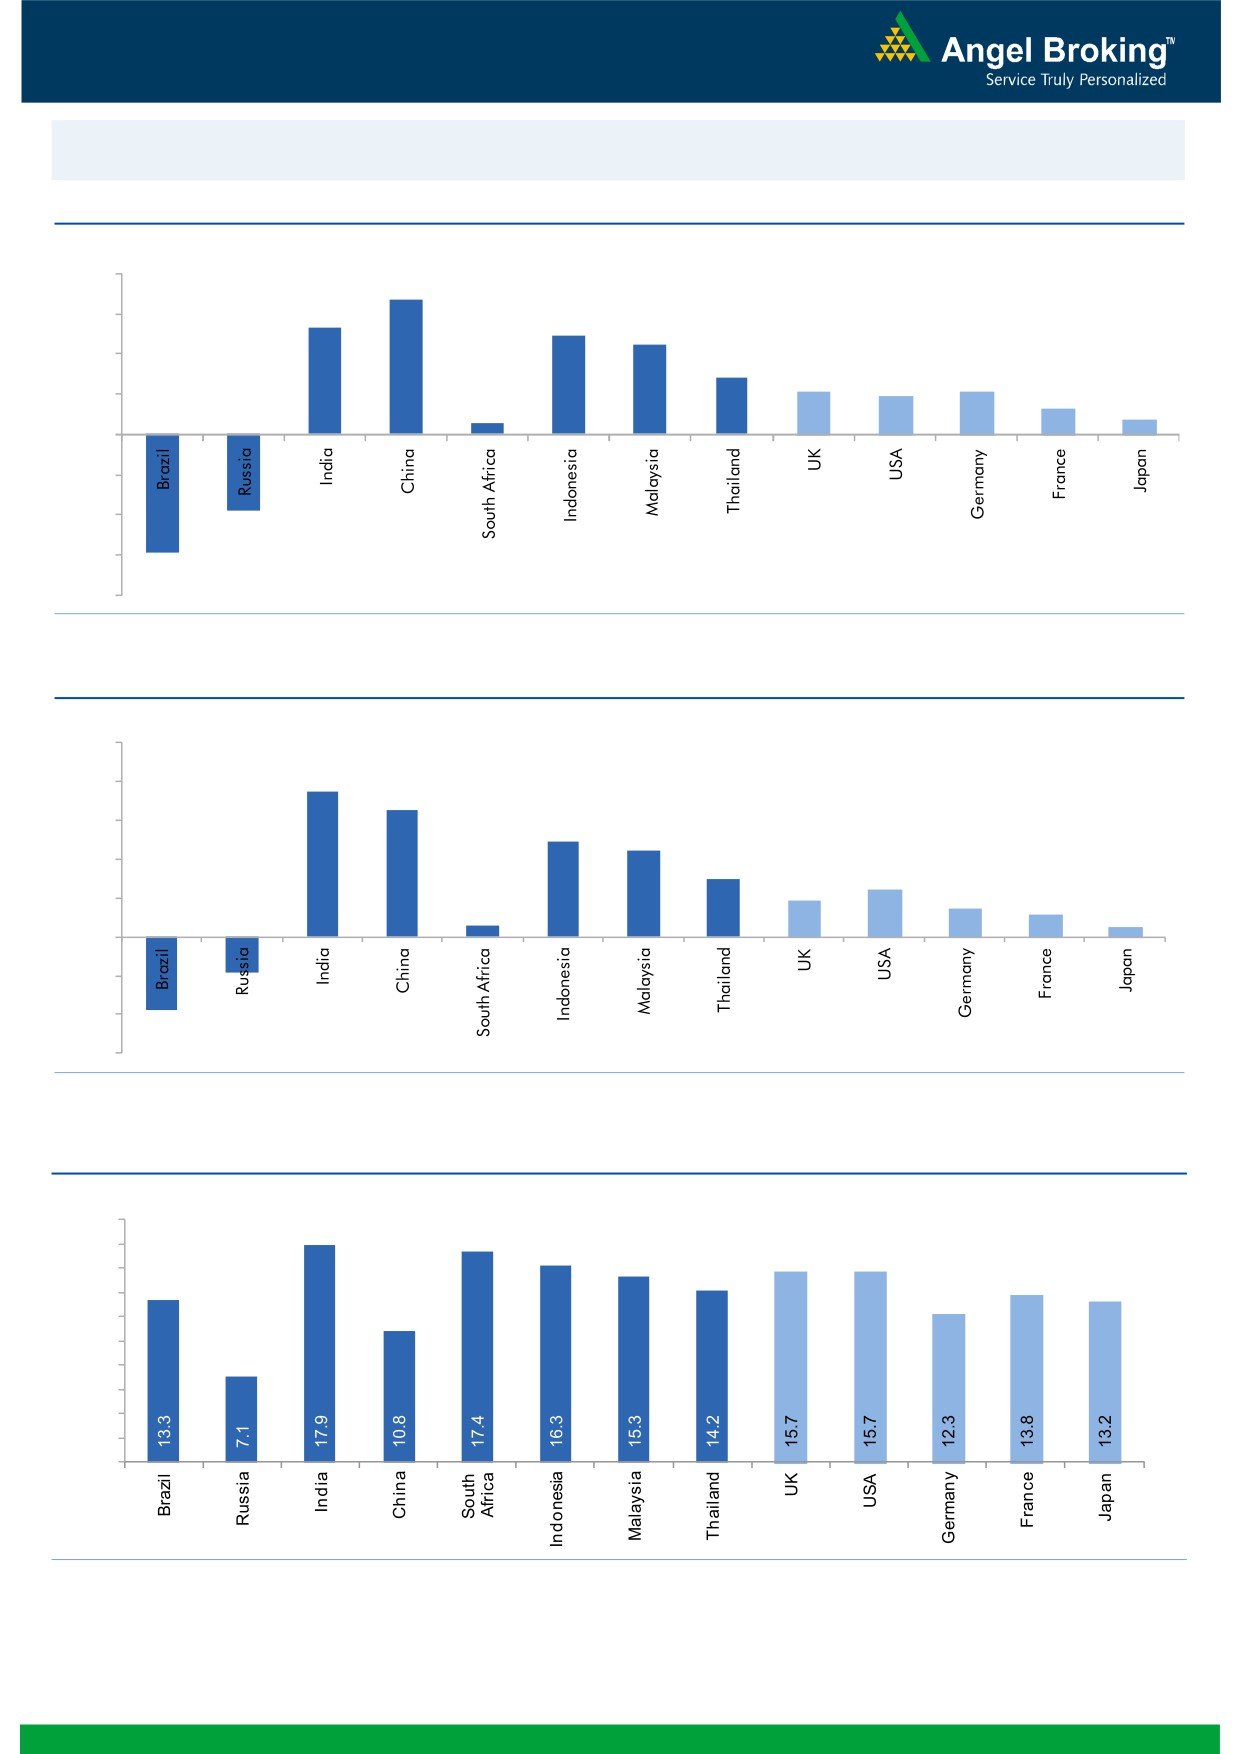
Global watch
Exhibit 1: Latest quarterly GDP Growth (%, yoy) across select developing and developed countries
(%)
8.0
6.7
6.0
5.3
4.9
4.5
4.0
2.8
2.1
1.9
2.1
1.3
2.0
0.6
0.7
-
(2.0)
(4.0)
(3.8)
(6.0)
(5.9)
(8.0)
Source: Bloomberg, Angel Research
Exhibit 2: 2016 GDP Growth projection by IMF (%, yoy) across select developing and developed countries
(%)
10.0
7.5
8.0
6.5
6.0
4.9
4.4
4.0
3.0
2.4
1.9
1.5
2.0
1.1
0.6
0.5
(3.8)
(1.8)
-
(2.0)
(4.0)
(6.0)
Source: IMF, Angel Research
Exhibit 3: One year forward P-E ratio across select developing and developed countries
(x)
20.0
18.0
16.0
14.0
12.0
10.0
8.0
6.0
4.0
2.0
-
Source: IMF, Angel Research
Market Outlook
May 19, 2016
Exhibit 4: Relative performance of indices across globe
Returns (%)
Country
Name of index
Closing price
1M
3M
1YR
Brazil
Bovespa
50,562
(5.0)
23.5
(11.0)
Russia
Micex
1,917
(0.8)
12.0
14.2
India
Nifty
7,870
0.3
9.1
(4.4)
China
Shanghai Composite
2,808
(7.2)
(1.8)
(36.0)
South Africa
Top 40
46,636
0.2
10.9
(3.4)
Mexico
Mexbol
45,551
1.2
5.4
0.6
Indonesia
LQ45
810
(3.0)
(2.6)
(9.0)
Malaysia
KLCI
1,636
(5.3)
(1.7)
(9.3)
Thailand
SET 50
895
2.8
8.4
(10.6)
USA
Dow Jones
17,527
(2.7)
6.5
(4.1)
UK
FTSE
6,166
(2.8)
5.9
(12.1)
Japan
Nikkei
16,645
4.5
5.9
(14.1)
Germany
DAX
9,943
(1.1)
8.0
(16.2)
France
CAC
4,319
(4.2)
5.1
(16.7)
Source: Bloomberg, Angel Research
Stock Watch
May 19, 2016
Company Name
Reco
CMP
Target
Mkt Cap
Sales ( Čcr )
OPM(%)
EPS (Č)
PER(x)
P/BV(x)
RoE(%)
EV/Sales(x)
(Č)
Price ( Č)
( Č cr )
FY16E FY17E
FY16E
FY17E
FY16E
FY17E
FY16E
FY17E
FY16E
FY17E
FY16E
FY17E
FY16E
FY17E
Agri / Agri Chemical
Rallis
Neutral
211
-
4,096
1,612
1,911
13.3
13.3
7.4
9.5
28.5
22.2
4.6
4.1
16.7
18.4
2.6
2.2
United Phosphorus
Accumulate
571
684
24,452
13,083
15,176
18.5
18.5
31.5
37.4
18.1
15.3
3.6
3.0
21.4
21.4
2.1
1.8
Auto & Auto Ancillary
Ashok Leyland
Accumulate
102
111
29,085
17,995
21,544
11.4
11.6
3.4
4.7
30.1
21.7
5.3
4.8
17.7
22.2
1.6
1.3
Bajaj Auto
Neutral
2,466
-
71,371
22,709
25,860
20.9
20.1
129.0
143.6
19.1
17.2
5.9
5.1
30.7
29.4
2.8
2.4
Bharat Forge
Accumulate
736
875
17,122
7,351
8,318
19.9
19.7
31.2
36.5
23.6
20.2
4.2
3.6
19.3
19.2
2.6
2.3
Eicher Motors
Neutral
18,720
-
50,846
15,556
16,747
15.5
17.3
464.8
597.5
40.3
31.3
14.7
10.8
36.2
34.3
3.4
3.1
Gabriel India
Accumulate
93
101
1,335
1,415
1,544
8.7
9.0
4.6
5.4
20.2
17.2
3.7
3.3
18.1
18.9
0.9
0.8
Hero Motocorp
Neutral
2,885
-
57,607
28,244
30,532
15.5
15.9
156.7
168.5
18.4
17.1
7.4
6.2
39.9
36.4
1.9
1.7
Jamna Auto Industries Accumulate
146
160
1,163
1,281
1,473
11.2
11.5
7.6
9.2
19.2
15.8
4.8
4.0
25.4
25.2
1.0
0.8
L G Balakrishnan & Bros Neutral
475
-
745
1,254
1,394
11.6
11.8
35.9
41.7
13.2
11.4
1.8
1.6
13.5
13.8
0.7
0.6
Mahindra and Mahindra Neutral
1,320
-
81,990
38,416
42,904
13.7
13.9
54.8
63.4
24.1
20.8
3.7
3.3
15.4
15.8
1.8
1.6
Maruti
Neutral
3,914
-
118,240
57,865
68,104
16.4
16.7
176.3
225.5
22.2
17.4
4.3
3.7
19.4
21.2
1.8
1.5
Minda Industries
Neutral
1,102
-
1,748
2,523
2,890
8.7
9.0
55.0
65.4
20.0
16.9
3.9
3.1
19.3
18.7
0.8
0.7
Motherson Sumi
Buy
276
313
36,534
39,343
45,100
8.8
9.1
10.1
12.5
27.4
22.1
8.7
6.8
35.3
34.4
1.0
0.9
Rane Brake Lining
Buy
383
465
303
454
511
11.5
12.0
25.2
31.0
15.2
12.4
2.3
2.1
14.9
16.6
0.8
0.7
Setco Automotive
Neutral
32
-
428
594
741
12.7
13.7
1.7
3.2
18.8
10.0
2.0
1.7
10.4
16.9
1.1
0.9
Tata Motors
Neutral
385
-
111,157
259,686
273,957
13.0
13.4
25.9
29.5
14.9
13.1
2.0
1.7
8.0
9.0
0.6
0.6
TVS Motor
Accumulate
297
330
14,091
11,263
13,122
6.9
8.5
9.2
15.0
32.2
19.8
7.4
5.9
22.7
29.6
1.2
1.0
Amara Raja Batteries
Accumulate
950
1,076
16,220
4,892
5,871
17.4
17.6
28.8
37.1
33.0
25.6
7.7
6.2
23.4
24.1
3.3
2.7
Exide Industries
Accumulate
151
162
12,827
6,950
7,784
14.4
14.8
6.6
7.3
22.9
20.7
2.9
2.6
12.6
12.8
1.5
1.4
Apollo Tyres
Buy
153
183
7,780
12,056
12,714
17.2
16.4
23.0
20.3
6.7
7.5
1.2
1.0
17.7
13.6
0.7
0.7
Ceat
Accumulate
1,003
1,119
4,059
6,041
6,597
14.1
13.7
99.5
111.9
10.1
9.0
2.0
1.7
19.6
18.5
0.8
0.7
JK Tyres
Neutral
85
-
1,919
7,446
7,669
15.2
14.0
19.6
18.4
4.3
4.6
1.1
0.9
25.2
19.5
0.7
0.6
Swaraj Engines
Neutral
1,122
-
1,394
552
630
14.2
14.7
44.6
54.1
25.2
20.7
5.9
5.3
23.2
25.6
2.3
2.0
Subros
Neutral
115
-
687
1,293
1,527
11.8
11.9
4.2
6.7
27.3
17.1
2.1
1.9
7.7
11.5
0.7
0.6
Indag Rubber
Neutral
187
-
492
283
329
17.0
17.2
13.0
15.4
14.5
12.2
3.2
2.6
21.8
21.6
1.4
1.2
Capital Goods
ACE
Neutral
44
-
436
660
839
4.7
8.2
1.0
3.9
44.1
11.3
1.4
1.2
3.2
11.3
0.8
0.6
BEML
Buy
898
1,157
3,739
3,277
4,006
6.0
8.9
36.2
64.3
24.8
14.0
1.7
1.6
5.7
11.7
1.3
1.0
Bharat Electronics
Buy
1,150
1,414
27,596
7,737
8,634
16.8
17.2
54.0
61.5
21.3
18.7
3.0
2.7
39.3
45.6
2.7
2.3
Stock Watch
May 19, 2016
Company Name
Reco
CMP
Target
Mkt Cap
Sales ( Čcr )
OPM(%)
EPS (Č)
PER(x)
P/BV(x)
RoE(%)
EV/Sales(x)
(Č)
Price ( Č)
( Č cr )
FY16E
FY17E
FY16E
FY17E
FY16E
FY17E
FY16E
FY17E
FY16E
FY17E
FY16E
FY17E
FY16E
FY17E
Capital Goods
Voltas
Accumulate
331
353
10,952
5,363
5,963
8.0
9.1
11.0
13.8
30.1
24.0
4.6
4.1
16.2
17.9
2.0
1.7
BGR Energy
Neutral
113
-
818
3,615
3,181
9.5
9.4
16.7
12.4
6.8
9.1
0.6
0.6
10.0
7.0
0.6
0.8
BHEL
Neutral
120
-
29,322
33,722
35,272
10.8
11.7
10.5
14.2
11.4
8.4
0.8
0.8
7.0
9.0
1.0
0.9
Blue Star
Accumulate
437
481
3,934
3,548
3,977
6.3
6.9
13.7
17.2
31.9
25.5
8.0
5.2
26.1
25.4
1.2
1.0
Crompton Greaves
Neutral
61
-
3,798
13,484
14,687
4.9
6.2
4.5
7.1
13.5
8.5
1.0
0.9
7.2
10.8
0.4
0.4
Greaves Cotton
Neutral
140
-
3,412
1,655
1,755
16.6
16.8
7.4
7.8
18.9
17.9
3.8
3.6
21.1
20.6
2.1
2.0
Inox Wind
Buy
240
286
5,316
4,406
5,605
15.5
15.7
20.4
24.8
11.7
9.7
2.7
2.0
27.9
25.9
1.4
1.1
KEC International
Neutral
133
-
3,412
8,791
9,716
6.1
6.8
5.4
8.2
24.6
16.2
2.5
2.3
10.0
14.0
0.6
0.6
Thermax
Neutral
730
-
8,698
6,413
7,525
7.4
8.5
30.5
39.3
23.9
18.6
3.7
3.2
15.0
17.0
1.4
1.1
VATech Wabag
Neutral
588
-
3,206
2,722
3,336
7.9
8.1
19.5
24.6
30.2
23.9
3.2
2.8
11.1
12.4
1.3
1.0
Cement
ACC
Neutral
1,437
-
26,985
13,151
14,757
16.4
18.3
63.9
83.4
22.5
17.2
2.9
2.7
13.3
16.1
1.9
1.6
Ambuja Cements
Neutral
216
-
33,583
11,564
12,556
19.4
20.7
8.9
10.1
24.3
21.4
3.0
2.9
12.8
13.8
2.6
2.4
HeidelbergCement
Neutral
96
-
2,168
1,772
1,926
13.3
15.4
1.0
3.0
95.7
31.9
2.4
2.2
2.6
7.9
1.8
1.6
India Cements
Neutral
89
-
2,729
4,216
4,840
18.0
19.5
4.0
9.9
22.2
9.0
0.9
0.8
4.0
9.5
1.0
0.8
JK Cement
Neutral
589
-
4,116
3,661
4,742
10.1
15.8
7.5
28.5
78.5
20.7
2.4
2.1
7.5
22.9
1.6
1.2
J K Lakshmi Cement
Neutral
343
-
4,037
2,947
3,616
16.7
19.9
11.5
27.2
29.8
12.6
2.8
2.4
9.8
20.8
1.8
1.4
Mangalam Cements
Neutral
261
-
696
1,053
1,347
10.5
13.3
8.4
26.0
31.0
10.0
1.3
1.2
4.3
12.5
1.0
0.8
Orient Cement
Neutral
158
-
3,235
1,854
2,524
21.2
22.2
7.7
11.1
20.5
14.2
3.0
2.5
13.3
15.7
2.5
1.7
Ramco Cements
Neutral
489
-
11,630
4,036
4,545
20.8
21.3
15.1
18.8
32.4
26.0
4.0
3.5
12.9
14.3
3.4
2.9
Shree Cement^
Neutral
13,242
-
46,133
7,150
8,742
26.7
28.6
228.0
345.5
58.1
38.3
8.6
7.2
15.7
20.3
6.3
5.1
UltraTech Cement
Neutral
3,217
-
88,290
24,669
29,265
18.2
20.6
82.0
120.0
39.2
26.8
4.2
3.7
11.3
14.7
3.6
3.1
Construction
ITNL
Buy
74
93
2,423
7,360
8,825
34.0
35.9
7.0
9.0
10.5
8.2
0.4
0.3
3.2
3.7
3.7
3.6
KNR Constructions
Buy
525
603
1,476
937
1,470
14.3
14.0
44.2
38.6
11.9
13.6
2.4
2.1
15.4
15.4
1.6
1.1
Larsen & Toubro
Neutral
1,309
-
122,014
58,870
65,708
8.3
10.3
42.0
53.0
31.2
24.7
2.2
2.0
8.8
11.2
2.3
2.1
Gujarat Pipavav Port
Neutral
162
-
7,841
629
684
51.0
52.2
6.4
5.9
25.3
27.5
3.3
3.1
15.9
12.7
11.9
10.8
MBL Infrastructures
Buy
130
285
541
2,313
2,797
12.2
14.6
19.0
20.0
6.9
6.5
0.7
0.7
11.3
10.6
0.9
0.8
Nagarjuna Const.
Neutral
75
-
4,169
7,892
8,842
8.8
9.1
3.0
5.3
25.0
14.2
1.3
1.2
5.0
8.5
0.8
0.7
PNC Infratech
Neutral
560
-
2,873
1,873
2,288
13.2
13.5
24.0
32.0
23.3
17.5
2.3
2.0
12.1
12.3
1.6
1.3
Simplex Infra
Neutral
269
-
1,331
5,955
6,829
10.3
10.5
16.0
31.0
16.8
8.7
0.9
0.8
5.3
9.9
0.7
0.6
Stock Watch
May 19, 2016
Company Name
Reco
CMP
Target
Mkt Cap
Sales ( Čcr )
OPM(%)
EPS (Č)
PER(x)
P/BV(x)
RoE(%)
EV/Sales(x)
(Č)
Price ( Č)
( Č cr )
FY16E
FY17E
FY16E
FY17E
FY16E
FY17E
FY16E
FY17E
FY16E
FY17E
FY16E
FY17E
FY16E
FY17E
Construction
Power Mech Projects
Neutral
590
-
868
1,539
1,801
12.8
12.7
59.0
72.1
10.0
8.2
1.5
1.3
18.6
16.8
0.6
0.5
Sadbhav Engineering
Accumulate
264
298
4,531
3,186
3,598
10.2
10.3
8.0
9.0
33.0
29.4
3.1
2.7
9.4
9.9
1.8
1.6
NBCC
Accumulate
984
1,089
11,804
5,816
7,382
6.9
7.7
29.6
39.8
33.2
24.7
6.0
4.7
24.1
26.7
1.8
1.3
MEP Infra
Neutral
40
-
652
1,956
1,876
28.1
30.5
1.3
3.0
30.9
13.4
6.5
4.4
21.2
32.8
1.8
1.7
SIPL
Neutral
101
-
3,543
675
1,042
62.4
64.7
-
-
3.8
4.3
-
-
16.8
11.4
Engineers India
Neutral
182
-
6,134
1,667
1,725
13.5
16.0
9.7
11.4
18.8
16.0
2.2
2.1
11.7
13.4
2.6
2.6
Financials
Allahabad Bank
Neutral
53
-
3,265
8,569
9,392
2.8
2.9
16.3
27.5
3.3
1.9
0.3
0.2
7.6
11.9
-
-
Axis Bank
Neutral
501
-
119,558
26,204
29,738
3.6
3.5
34.5
35.4
14.5
14.2
2.3
2.0
16.8
14.9
-
-
Bank of Baroda
Neutral
143
-
32,869
18,802
21,088
2.0
2.2
(7.4)
13.0
11.0
1.1
0.9
(4.2)
7.3
-
-
Bank of India
Neutral
85
-
7,963
15,972
17,271
1.9
2.0
15.3
33.4
5.6
2.6
0.3
0.2
3.6
7.6
-
-
Canara Bank
Neutral
185
-
10,034
15,441
16,945
2.0
2.1
46.6
70.4
4.0
2.6
0.4
0.3
8.0
11.2
-
-
Dena Bank
Neutral
30
-
2,004
3,440
3,840
2.1
2.3
7.3
10.0
4.2
3.0
0.3
0.3
6.1
7.9
-
-
Dewan Housing Finance Buy
202
270
5,896
1,828
2,225
2.9
3.0
24.9
29.7
8.1
6.8
1.3
1.1
15.1
16.1
-
-
Federal Bank
Neutral
50
-
8,650
3,279
3,787
2.8
2.9
3.9
5.5
12.8
9.1
1.0
1.0
8.4
10.8
-
-
HDFC
Neutral
1,208
-
190,876
10,358
11,852
3.3
3.3
41.1
47.0
29.4
25.7
5.6
5.1
24.7
24.9
-
-
HDFC Bank
Accumulate
1,141
1,262
288,560
38,606
47,696
4.4
4.5
48.8
61.4
23.4
18.6
4.0
3.5
18.7
20.0
-
-
ICICI Bank
Neutral
226
-
131,576
34,279
39,262
3.3
3.3
21.0
24.4
10.8
9.3
1.8
1.5
14.4
14.7
-
-
IDBI Bank
Neutral
66
-
13,516
9,625
10,455
1.8
1.8
8.5
14.2
7.7
4.6
0.5
0.4
5.9
9.3
-
-
Indian Bank
Neutral
92
-
4,407
6,160
6,858
2.5
2.5
24.5
29.8
3.8
3.1
0.3
0.3
7.7
8.6
-
-
LIC Housing Finance
Buy
461
592
23,278
3,179
3,758
2.6
2.6
32.9
40.6
14.0
11.4
2.6
2.2
19.6
20.7
-
-
Oriental Bank
Neutral
85
-
2,930
7,643
8,373
2.4
2.4
37.2
45.4
2.3
1.9
0.2
0.2
8.2
9.4
-
-
Punjab Natl.Bank
Neutral
76
-
14,963
23,122
26,022
2.8
2.8
7.0
21.6
10.9
3.5
0.6
0.5
3.4
10.0
-
-
South Ind.Bank
Neutral
18
-
2,464
1,965
2,185
2.5
2.5
2.5
3.3
7.3
5.5
0.7
0.7
9.5
11.7
-
-
St Bk of India
Neutral
180
-
139,885
79,958
86,061
2.6
2.6
13.4
20.7
13.5
8.7
1.1
1.0
11.5
12.8
-
-
Union Bank
Neutral
111
-
7,600
12,646
14,129
2.3
2.4
31.0
39.1
3.6
2.8
0.4
0.3
9.8
11.4
-
-
Vijaya Bank
Neutral
31
-
2,886
3,536
3,827
1.9
1.9
5.5
6.7
5.6
4.7
0.5
0.4
7.8
8.8
-
-
Yes Bank
Neutral
971
-
40,866
7,190
9,011
3.2
3.3
58.2
69.7
16.7
13.9
3.0
2.5
19.2
19.6
-
-
FMCG
Asian Paints
Neutral
964
-
92,467
16,553
19,160
16.0
16.2
17.7
21.5
54.5
44.8
14.5
13.0
29.4
31.2
5.2
4.5
Britannia
Neutral
2,972
-
35,660
8,481
9,795
14.0
14.1
65.5
78.3
45.4
38.0
21.5
17.6
38.3
41.2
4.1
3.5
Stock Watch
May 19, 2016
Company Name
Reco
CMP
Target
Mkt Cap
Sales ( Čcr )
OPM(%)
EPS (Č)
PER(x)
P/BV(x)
RoE(%)
EV/Sales(x)
(Č)
Price ( Č)
( Č cr )
FY16E FY17E
FY16E
FY17E
FY16E
FY17E
FY16E
FY17E
FY16E
FY17E
FY16E
FY17E
FY16E
FY17E
FMCG
Colgate
Neutral
828
-
22,527
4,136
4,632
22.5
23.3
22.2
25.3
37.3
32.7
22.7
20.2
68.6
67.5
5.4
4.8
Dabur India
Neutral
286
-
50,391
9,370
10,265
17.6
17.3
7.3
8.1
39.1
35.4
10.1
9.3
31.7
30.6
5.3
4.8
GlaxoSmith Con*
Neutral
5,850
-
24,603
4,519
5,142
19.6
19.8
164.3
191.2
35.6
30.6
9.9
8.4
30.8
29.9
5.1
4.4
Godrej Consumer
Neutral
1,385
-
47,154
9,003
10,335
18.1
18.7
34.1
41.8
40.6
33.1
8.8
7.5
23.9
24.8
5.6
4.9
HUL
Neutral
825
-
178,557
33,299
35,497
17.1
17.1
18.9
20.0
43.7
41.3
22.1
25.4
87.6
80.8
5.4
5.0
ITC
Accumulate
333
359
267,851
36,804
38,776
37.9
37.9
12.2
12.9
27.3
25.8
7.6
6.7
27.7
25.8
6.5
6.2
Marico
Neutral
251
-
32,383
6,151
6,966
17.2
17.3
5.4
6.4
46.5
39.2
14.6
11.5
33.2
32.4
5.2
4.6
Nestle*
Neutral
6,193
-
59,711
9,393
10,507
22.2
22.3
106.8
121.8
58.0
50.9
20.4
18.3
34.8
36.7
5.7
5.0
Tata Global
Buy
121
137
7,634
8,635
9,072
9.8
9.9
5.8
7.2
20.9
16.8
1.9
1.8
6.8
7.4
0.9
0.9
Procter & Gamble
Accumulate
6,438
7,369
20,899
2,588
2,939
23.3
23.2
130.2
146.2
49.4
44.1
98.6
94.5
27.6
25.3
7.7
6.7
Hygiene
IT
HCL Tech^
Buy
742
1,038
104,699
42,038
47,503
21.2
21.5
51.5
57.7
14.4
12.9
3.1
2.4
21.5
18.8
2.0
1.6
Infosys
Accumulate
1,210
1,374
278,780
62,441
70,558
27.5
27.5
59.0
65.3
20.5
18.5
4.1
3.8
22.2
22.4
3.9
3.4
TCS
Buy
2,550
3,004
502,548
108,646
122,770
28.3
28.3
123.7
141.0
20.6
18.1
6.8
6.3
33.1
34.6
4.2
3.6
Tech Mahindra
Accumulate
484
530
46,919
26,524
29,177
16.2
17.0
28.8
33.6
16.8
14.4
3.2
2.8
19.3
19.1
1.5
1.3
Wipro
Buy
539
680
133,159
50,808
56,189
23.7
23.8
37.3
40.7
14.5
13.2
2.8
2.5
19.2
17.7
2.1
1.7
Media
D B Corp
Accumulate
331
356
6,082
2,025
2,187
27.4
27.4
17.4
18.9
19.0
17.6
4.3
3.9
22.9
23.7
3.0
2.7
HT Media
Neutral
89
-
2,077
2,495
2,673
12.9
13.2
6.8
7.2
13.1
12.4
1.0
1.0
7.5
7.8
0.4
0.3
Jagran Prakashan
Buy
169
205
5,525
2,170
2,355
27.2
26.2
8.9
9.9
19.0
17.1
4.0
3.5
20.9
20.5
2.5
2.3
Sun TV Network
Neutral
428
-
16,849
2,510
2,763
71.8
71.5
21.9
24.8
19.5
17.2
4.6
4.2
22.8
24.3
5.4
4.9
Hindustan Media
Neutral
281
-
2,062
914
1,016
21.7
21.5
21.9
23.3
12.8
12.1
2.3
2.0
18.0
16.2
1.6
1.4
Ventures
Metals & Mining
Coal India
Buy
284
380
179,448
76,167
84,130
19.9
22.3
22.4
25.8
12.7
11.0
4.6
4.5
35.5
41.0
1.7
1.5
Hind. Zinc
Neutral
168
-
70,774
14,641
14,026
50.4
50.4
17.7
16.0
9.5
10.5
1.5
1.3
16.2
13.2
2.5
2.3
Hindalco
Neutral
89
-
18,399
104,356
111,186
8.7
9.5
6.7
11.1
13.3
8.1
0.5
0.5
3.5
5.9
0.7
0.6
JSW Steel
Neutral
1,310
-
31,674
42,308
45,147
16.4
20.7
(10.3)
49.5
26.5
1.5
1.4
(1.0)
5.6
1.8
1.7
NMDC
Neutral
93
-
36,674
8,237
10,893
46.6
44.5
10.0
11.7
9.3
7.9
1.0
0.9
12.5
13.0
4.2
3.2
SAIL
Neutral
42
-
17,450
45,915
53,954
7.2
10.5
1.5
4.4
28.1
9.7
0.4
0.4
2.3
4.1
1.0
0.9
Vedanta
Neutral
99
-
29,425
71,445
81,910
26.2
26.3
12.9
19.2
7.7
5.2
0.5
0.5
7.2
8.9
0.9
0.7
Tata Steel
Neutral
329
-
31,943
126,760
137,307
8.9
11.3
6.4
23.1
51.7
14.3
1.0
1.0
2.0
7.1
0.8
0.8
Oil & Gas
Cairn India
Neutral
139
-
26,089
11,323
12,490
49.4
51.0
20.7
20.7
6.7
6.7
0.4
0.4
6.4
6.1
1.3
0.7
Stock Watch
May 19, 2016
Company Name
Reco
CMP
Target
Mkt Cap
Sales ( Čcr )
OPM(%)
EPS (Č)
PER(x)
P/BV(x)
RoE(%)
EV/Sales(x)
(Č)
Price ( Č)
( Č cr )
FY16E FY17E
FY16E
FY17E
FY16E
FY17E
FY16E
FY17E
FY16E
FY17E
FY16E
FY17E
FY16E
FY17E
Oil & Gas
GAIL
Neutral
381
-
48,386
64,856
70,933
9.1
9.6
24.0
28.9
15.9
13.2
1.4
1.3
8.8
9.6
0.9
0.8
ONGC
Neutral
214
-
183,259
154,564
145,998
36.8
37.4
20.8
22.6
10.3
9.5
1.0
0.9
10.1
9.7
1.4
1.5
Petronet LNG
Neutral
275
-
20,610
29,691
31,188
5.8
6.2
12.8
13.4
21.5
20.5
3.2
2.9
15.8
14.8
0.8
0.7
Indian Oil Corp
Accumulate
407
455
98,721
359,607
402,760
5.9
6.1
42.5
48.7
9.6
8.3
1.3
1.1
14.1
14.4
0.4
0.3
Reliance Industries
Buy
970
1,150
314,453
304,775
344,392
12.6
13.4
91.3
102.6
10.6
9.5
1.2
1.1
11.8
12.0
1.0
0.8
Pharmaceuticals
Alembic Pharma
Neutral
569
-
10,732
3,274
3,802
26.9
19.4
35.0
28.7
16.3
19.8
7.2
5.4
55.6
31.2
3.3
2.8
Aurobindo Pharma
Accumulate
783
856
45,819
14,923
17,162
22.0
23.0
35.7
42.8
21.9
18.3
6.4
4.9
34.0
30.2
3.5
3.0
Aventis*
Accumulate
4,300
4,738
9,904
2,049
2,375
15.4
17.3
115.4
153.5
37.3
28.0
6.1
4.8
19.3
25.8
4.6
3.9
Cadila Healthcare
Accumulate
320
352
32,744
10,224
11,840
21.0
22.0
14.6
17.6
21.9
18.2
6.0
4.7
30.8
29.0
3.4
2.9
Cipla
Accumulate
524
605
42,121
13,979
16,447
20.2
18.6
25.7
27.5
20.4
19.1
3.3
2.9
17.6
16.1
3.1
2.5
Dr Reddy's
Buy
3,029
3,933
51,651
16,838
19,575
25.0
23.1
167.5
178.8
18.1
16.9
3.8
3.2
23.1
20.4
2.9
2.5
Dishman Pharma
Neutral
161
-
2,597
1,733
1,906
21.5
21.5
10.1
10.0
15.9
16.1
1.9
1.7
10.5
11.2
2.1
1.8
GSK Pharma*
Neutral
3,396
-
28,765
2,870
3,158
20.0
22.1
59.5
68.3
57.1
49.7
16.8
17.3
28.5
34.3
9.7
8.9
Indoco Remedies
Neutral
262
-
2,414
1,033
1,199
15.9
18.2
9.4
13.6
27.9
19.3
4.1
3.5
15.7
19.7
2.4
2.1
Ipca labs
Buy
452
750
5,702
3,363
3,909
12.9
18.6
13.4
28.0
33.7
16.1
2.4
2.1
7.4
14.0
2.1
1.8
Lupin
Neutral
1,632
-
73,574
13,092
16,561
25.0
27.0
50.4
68.3
32.4
23.9
6.7
5.3
22.8
24.7
5.3
4.0
Sun Pharma
Buy
795
950
191,380
28,163
32,610
25.8
30.7
17.4
26.9
45.7
29.6
4.3
3.8
13.0
16.6
6.3
5.3
Power
Tata Power
Neutral
70
-
18,932
35,923
37,402
22.6
22.8
4.1
5.2
17.3
13.6
1.3
1.2
7.5
9.3
1.5
1.4
NTPC
Neutral
136
-
112,386
87,271
99,297
23.5
23.5
11.8
13.3
11.6
10.3
1.3
1.2
11.5
12.2
2.4
2.1
Power Grid
Buy
143
170
74,812
20,702
23,361
86.7
86.4
12.1
13.2
11.8
10.8
1.7
1.6
15.6
15.1
8.6
8.0
Real Estate
MLIFE
Buy
444
554
1,823
826
1,133
20.1
21.8
22.6
30.7
19.7
14.5
1.2
1.1
6.0
7.4
4.2
2.9
Telecom
Bharti Airtel
Neutral
351
-
140,369
101,748
109,191
32.1
31.7
12.0
12.5
29.3
28.1
2.0
1.9
6.9
6.7
2.1
1.9
Idea Cellular
Neutral
111
-
39,786
34,282
36,941
32.0
31.5
5.9
6.2
18.7
17.8
1.7
1.6
9.9
9.3
1.8
1.7
zOthers
Abbott India
Neutral
4,667
-
9,916
2,715
3,153
14.5
14.1
134.3
152.2
34.8
30.7
8.7
7.2
27.4
25.6
3.4
2.9
Bajaj Electricals
Neutral
235
-
2,372
4,719
5,287
5.2
5.8
8.6
12.7
27.5
18.6
3.1
2.8
11.4
14.8
0.5
0.4
Finolex Cables
Neutral
285
-
4,357
2,520
2,883
12.2
12.0
12.7
14.2
22.5
20.1
3.1
2.7
13.6
13.5
1.5
1.3
Goodyear India*
Accumulate
504
582
1,163
1,800
1,600
11.7
11.5
58.7
52.9
8.6
9.5
1.9
1.7
24.6
18.7
0.4
0.4
Hitachi
Neutral
1,390
-
3,779
1,779
2,081
7.8
8.8
21.8
33.4
63.8
41.6
10.3
8.3
17.4
22.1
2.2
1.9
Jyothy Laboratories
Neutral
319
-
5,770
1,620
1,847
11.5
11.5
7.3
8.5
43.7
37.6
5.7
5.2
13.3
14.4
3.4
2.9
Stock Watch
May 19, 2016
Company Name
Reco
CMP
Target
Mkt Cap
Sales ( Čcr )
OPM(%)
EPS (Č)
PER(x)
P/BV(x)
RoE(%)
EV/Sales(x)
(Č)
Price ( Č)
( Č cr )
FY16E
FY17E
FY16E
FY17E
FY16E
FY17E
FY16E
FY17E
FY16E
FY17E
FY16E
FY17E
FY16E
FY17E
zOthers
MRF
Buy
32,881
45,575
13,945
20,316
14,488
21.4
21.1
5,488.0
3,798.0
6.0
8.7
2.0
1.7
41.1
21.2
0.6
0.9
Page Industries
Neutral
13,241
-
14,769
1,929
2,450
19.8
20.1
229.9
299.0
57.6
44.3
25.4
17.7
52.1
47.1
7.5
5.9
Relaxo Footwears
Neutral
486
-
5,839
1,767
2,152
12.3
12.5
19.3
25.1
25.3
19.4
6.2
4.8
27.7
27.8
3.5
2.9
Siyaram Silk Mills
Buy
1,078
1,354
1,010
1,636
1,815
11.5
11.5
89.9
104.1
12.0
10.4
2.0
1.7
17.9
17.8
0.8
0.7
Styrolution ABS India* Neutral
630
-
1,108
1,271
1,440
8.6
9.2
32.0
41.1
19.7
15.4
2.0
1.8
10.7
12.4
0.8
0.7
TVS Srichakra
Buy
2,368
3,217
1,813
2,035
2,252
15.9
15.3
248.6
268.1
9.5
8.8
4.2
3.0
43.6
33.9
1.0
0.8
HSIL
Neutral
310
-
2,238
2,123
2,384
16.1
16.5
15.0
18.9
20.6
16.4
1.6
1.5
8.0
9.4
1.4
1.2
Kirloskar Engines India
Neutral
269
-
3,885
2,403
2,554
8.6
9.9
9.2
10.5
29.2
25.6
2.8
2.7
9.7
10.7
1.1
1.0
Ltd
M M Forgings
Buy
453
546
547
511
615
21.7
21.6
43.1
55.8
10.5
8.1
1.9
1.6
19.9
21.2
1.3
1.0
Banco Products (India) Neutral
127
-
911
1,208
1,353
11.0
12.3
10.8
14.5
11.8
8.8
1.4
1.2
11.9
14.5
0.7
0.6
Competent Automobiles Neutral
146
-
90
1,040
1,137
3.2
3.1
25.7
28.0
5.7
5.2
0.9
0.7
15.0
14.3
0.1
0.1
Nilkamal
Neutral
1,265
-
1,888
1,871
2,031
10.7
10.5
63.2
69.8
20.0
18.1
3.3
2.8
17.6
16.6
1.1
0.9
Visaka Industries
Accumulate
141
143
224
1,020
1,120
8.7
9.1
13.9
20.1
10.1
7.0
0.7
0.6
6.4
8.7
0.4
0.4
Transport Corporation of
Neutral
276
-
2,101
2,830
3,350
8.8
9.0
14.4
18.3
19.2
15.1
3.0
2.6
15.4
17.1
0.8
0.7
India
Elecon Engineering
Neutral
61
-
668
1,359
1,482
10.3
13.7
0.8
3.9
76.3
15.8
1.3
1.2
1.6
7.8
0.9
0.8
Surya Roshni
Buy
153
201
671
2,992
3,223
8.1
8.4
14.7
18.3
10.4
8.4
1.0
0.9
9.7
11.0
0.5
0.5
MT Educare
Neutral
189
-
753
286
366
18.3
17.7
7.7
9.4
24.5
20.2
5.2
4.5
20.2
21.1
2.5
1.9
Radico Khaitan
Buy
90
125
1,193
1,543
1,659
12.6
13.0
5.8
6.3
15.5
14.2
1.3
1.2
8.5
8.6
1.3
1.2
Garware Wall Ropes
Buy
352
473
770
862
974
11.2
11.2
24.9
29.6
14.2
11.9
2.1
1.8
15.1
15.4
0.9
0.8
Wonderla Holidays
Neutral
384
-
2,170
206
308
44.0
43.6
9.0
12.9
42.7
29.8
5.8
5.3
13.7
17.8
10.3
6.9
Linc Pen & Plastics
Neutral
191
-
282
340
371
8.3
8.9
10.8
13.2
17.7
14.5
2.8
2.5
16.0
17.1
0.9
0.8
The Byke Hospitality
Neutral
153
-
612
222
287
20.5
20.5
5.6
7.6
27.1
20.2
5.1
4.2
18.9
20.8
2.9
2.2
Interglobe Aviation
Neutral
1,026
-
36,958
17,022
21,122
20.7
14.5
63.9
53.7
16.1
19.1
24.1
19.7
149.9
103.2
2.2
1.8
Coffee Day Enterprises
Neutral
265
-
5,452
2,692
2,964
17.0
18.6
-
4.7
-
55.9
3.2
3.1
0.2
5.5
2.4
2.2
Ltd
Navneet Education
Neutral
90
-
2,150
998
1,062
24.1
24.0
5.8
6.1
15.7
14.8
3.5
3.0
22.0
20.6
2.2
2.1
Navkar Corporation
Buy
185
265
2,637
365
436
38.3
37.5
5.6
5.9
32.8
31.5
2.1
1.9
6.3
6.1
7.7
6.6
UFO Moviez
Neutral
521
-
1,439
558
619
32.0
33.2
22.5
30.0
23.2
17.4
2.8
2.4
12.0
13.8
2.5
2.1
VRL Logistics
Neutral
392
-
3,577
1,725
1,902
16.5
16.7
12.2
14.6
32.2
26.9
6.7
5.9
20.8
21.9
2.3
2.0
Team Lease Serv.
Neutral
938
-
1,604
2,565
3,229
1.3
1.5
15.2
22.8
61.8
41.2
4.9
4.4
8.0
10.7
0.5
0.4
Stock Watch
May 19, 2016
Company Name
Reco
CMP
Target Mkt Cap
Sales ( Čcr )
OPM(%)
EPS (Č)
PER(x)
P/BV(x)
RoE(%)
EV/Sales(x)
(Č)
Price ( Č)
( Č cr )
FY16E FY17E FY16E FY17E FY16E FY17E FY16E FY17E FY16E FY17E FY16E FY17E FY16E FY17E
zOthers
S H Kelkar & Co.
Neutral
227
-
3,288
928
1,036
15.3
15.1
4.9
6.1
46.1
37.2
4.3
4.0
9.4
10.7
3.4
3.0
Quick Heal
Neutral
258
-
1,803
339
408
27.8
27.3
7.1
7.7
36.4
33.3
3.1
3.1
8.5
9.3
4.2
3.5
Narayana Hrudaya
Neutral
325
-
6,643
1,603
1,873
10.9
11.5
1.0
2.6
341.2
122.9
8.2
7.5
2.4
6.1
4.0
3.5
Manpasand Bever.
Neutral
538
-
2,693
540
836
19.9
19.6
10.2
16.9
52.5
31.8
4.3
3.8
8.1
12.0
4.7
3.0
Source: Company, Angel Research; Note: *December year end; #September year end; &October year end; Price as on May 18, 2016
Market Outlook
May 19, 2016
Research Team Tel: 022 - 39357800
DISCLAIMER
Angel Broking Private Limited (hereinafter referred to as “Angel”) is a registered Member of National Stock Exchange of India Limited,
Bombay Stock Exchange Limited and Metropolitian Stock Exchange of India Limited. It is also registered as a Depository Participant with
CDSL and Portfolio Manager with SEBI. It also has registration with AMFI as a Mutual Fund Distributor. Angel Broking Private Limited is a
registered entity with SEBI for Research Analyst in terms of SEBI (Research Analyst) Regulations, 2014 vide registration number
INH000000164. Angel or its associates has not been debarred/ suspended by SEBI or any other regulatory authority for accessing
/dealing in securities Market. Angel or its associates including its relatives/analyst do not hold any financial interest/beneficial ownership
of more than 1% in the company covered by Analyst. Angel or its associates/analyst has not received any compensation / managed or co
-managed public offering of securities of the company covered by Analyst during the past twelve months. Angel/analyst has not served as
an officer, director or employee of company covered by Analyst and has not been engaged in market making activity of the company
covered by Analyst.
This document is solely for the personal information of the recipient, and must not be singularly used as the basis of any investment
decision. Nothing in this document should be construed as investment or financial advice. Each recipient of this document should make
such investigations as they deem necessary to arrive at an independent evaluation of an investment in the securities of the companies
referred to in this document (including the merits and risks involved), and should consult their own advisors to determine the merits and
risks of such an investment.
Reports based on technical and derivative analysis center on studying charts of a stock's price movement, outstanding positions and
trading volume, as opposed to focusing on a company's fundamentals and, as such, may not match with a report on a company's
fundamentals.
The information in this document has been printed on the basis of publicly available information, internal data and other reliable sources
believed to be true, but we do not represent that it is accurate or complete and it should not be relied on as such, as this document is for
general guidance only. Angel Broking Pvt. Limited or any of its affiliates/ group companies shall not be in any way responsible for any
loss or damage that may arise to any person from any inadvertent error in the information contained in this report. Angel Broking Pvt.
Limited has not independently verified all the information contained within this document. Accordingly, we cannot testify, nor make any
representation or warranty, express or implied, to the accuracy, contents or data contained within this document. While Angel Broking
Pvt. Limited endeavors to update on a reasonable basis the information discussed in this material, there may be regulatory, compliance,
or other reasons that prevent us from doing so.
This document is being supplied to you solely for your information, and its contents, information or data may not be reproduced,
redistributed or passed on, directly or indirectly.
Neither Angel Broking Pvt. Limited, nor its directors, employees or affiliates shall be liable for any loss or damage that may arise from or
in connection with the use of this information.
Note: Please refer to the important ‘Stock Holding Disclosure' report on the Angel website (Research Section). Also, please refer to the
latest update on respective stocks for the disclosure status in respect of those stocks. Angel Broking Pvt. Limited and its affiliates may have
investment positions in the stocks recommended in this report.