Market Outlook
January 19, 2016
Market Cues
Domestic Indices
Chg (%)
(Pts)
(Close)
Indian markets are expected to open flat tracking the SGX Nifty and Asian markets.
BSE Sensex
(1.1)
(267)
24,188
US markets were shut on Monday on account of Martin Luther King Jr. Day.
Nifty
(1.2)
(87)
7,351
European markets closed flat after witnessing choppy trade swinging between
Mid Cap
(2.7)
(281)
10,062
positive and negative territory as investors remained nervous ahead of the Chinese
Small Cap
(4.1)
(437)
10,346
GDP data and a further fall in crude prices.
Bankex
(1.2)
(200)
17,038
Indian markets once again saw a sharp cut in the last hour of trade after trading
choppy earlier in the day. Energy stocks took a beating led by fall in crude prices
Global Indices
Chg (%)
(Pts)
(Close)
with the index bellwether Reliance Industries taking a sharp cut.
Dow Jones
(2.4)
(391)
15,988
News & Result Analysis
Nasdaq
(2.7)
(127)
4,488
Result Review: Wipro, Rallis India
FTSE
(0.4)
(24)
5,780
Result Preview: HCL Tech
Nikkei
(1.1)
(192)
16,956
Detailed analysis on Pg2
Hang Seng
(1.5)
(283)
19,237
Investor’s Ready Reckoner
Shanghai Com
0.4
13
2,914
Key Domestic & Global Indicators
Advances / Declines
BSE
NSE
Stock Watch: Latest investment recommendations on 150+ stocks
Refer P5 onwards
Advances
305
152
Declines
2,424
1,440
Top Picks
Unchanged
138
46
CMP
Target
Upside
Company
Sector
Rating
(`)
(`)
(%)
Amara Raja Batteries Auto & Auto Ancillary
Buy
782
1,040
32.9
Volumes (` Cr)
HCL Tech
IT
Buy
843
1,132
34.3
BSE
3,192
Larsen & Toubro
Construction
Buy
1,083
1,646
52.0
NSE
18,381
LIC Housing Finance Financials
Buy
463
592
27.7
Navkar Corporation Others
Buy
184
265
43.9
Net Inflows (` Cr)
Net
Mtd
Ytd
More Top Picks on Pg5
FII
(1,034)
(5,623)
14,736
Key Upcoming Events
MFs
278
1,640
70,135
Previous
Consensus
Date
Region
Event Description
Reading
Expectations
Jan 19
China
Industrial Production (YoY)
6.20
6.00
Top Gainers
Price (`)
Chg (%)
China
Real GDP (YoY)
6.90
6.90
Bhel
142
4.3
Jan 20
USA
Jobless claims change (%)
3.90
2.75
Ktkbank
99
4.1
USA
Housing Starts
1,173
1,200
Tatasteel
236
2.8
Carerating
1,139
2.2
Jswsteel
992
1.8
Top Losers
Price (`)
Chg (%)
Jubilant
288
(15.4)
Pipavavdoc
69
(12.9)
Sci
76
(12.4)
Torntpower
194
(11.8)
Jetairways
634
(10.5)
As on January 15, 2015
Market Outlook
January 19, 2016
Result Review
Wipro (CMP: `547/ TP: Under Review: Buy / Upside: )
During 3QFY2016, the company posted numbers lower than expected on all
fronts. The IT services posted a 0.3% sequential growth in USD revenues to
US$1,838mn V/s US$1,841mn expected. On, the constant currency terms, (CC)
the IT services posted a 1.4% QoQ growth. The revenues came in at the middle
end of the band of US$1,821-1,858mn at the actual currency realized. In rupee
terms, overall consolidated revenues are expected to come in at `12,861cr V/s
`12,739cr expected a growth of 2.8% QoQ.
In terms, of geography, the USA posted a 0.3% QoQ CC growth, Europe posted a
1.4% QoQ CC growth, India & Middle East Business, posted a 5.4% QoQ CC
growth and APAC and Other Emerging Markets posted a 3.1% QoQ CC growth.
In terms of the vertical Global Media & Telecom posted a 2.7% QoQ CC growth ,
Finance Solutions posted a -0.7% QoQ CC, Manufacturing & Hitech posted a -
0.6% QoQ CC growth , Healthcare Life Sciences & Services posted a 6.0% QoQ
CC, Retail, Consumer Goods & Transportation posted a QoQ CC 4.6% and
Energy, Natural Resources & Utilities posted no growth during the period.
On operating front, the EBITDA margins came in at 20.6% V/s 21.5% a downtick
of 121bp QoQ Consequently, PAT came in at `2,243cr V/s `2,318cr expected a
growth of 0.4% QoQ. Other operating matrix, the gross utilization levels dropped
to 66.4% V/s 69.5% in 2QFY2016. Net utilization (excl support) dropped to 73.8%
V/s 77.2% in 2QFY2016. In terms of client addition, it added one client
US$50mn+ and major ones in the small order sizes. Overall 39 clients were
added during the quarter.
For 4QFY2016, the company has guided for revenues of US$1,875-1,912mn, a
QoQ growth of 2.0-4.0%. We maintain our buy on the stock with price target
under review.
Y/E
Sales OPM
PAT
EPS ROE P/E P/BV EV/EBITDA EV/Sales
March
(` cr)
(%)
(` cr)
(`)
(%)
(x)
(x)
(x)
(x)
FY2016E
50,808
23.7
9,233
37.3
19.0
14.6
2.8
9.4
2.1
FY2017E
58,713
23.8
10,450
42.3
17.9
12.9
2.5
7.4
1.7
Rallis India (CMP: `158 / Rating: Neutral)
For 3QFY2016, the company posted net sales and profit of `306cr and `20cr.
This was against the sales and net profit of `386cr and `25cr during the last
corresponding period. The OPMs came to around 6% V/s 9% during the last
corresponding period. The dip in sales was the real reason behind the dip in
operating margins. We remain NEUTRAL on the stock.
Y/E
Sales OPM
PAT
EPS ROE P/E P/BV EV/EBITDA EV/Sales
March
(` cr)
(%)
(` cr)
(`)
(%)
(x)
(x)
(x)
(x)
FY2016E
2,097
14.4
185
9.5
21.1
16.6
3.3
10.4
1.5
FY2017E
2,415
14.4
214
11.0
21.3
14.4
2.9
9.0
1.3
Market Outlook
January 19, 2016
Result Preview
HCL Tech (CMP: `843 / TP `1,132 : Buy / Upside: 34.3%)
During 2QFY2016, we expect the company to post a 1.5% QoQ growth in USD
revenues to US$1,568mn. In rupee terms, revenues are expected to come in at
`10,331cr, a growth of 2.3% QoQ. On operating front, the EBITDA margins are
expected to come in at 20.5% V/s 20.9% a downtick of 43bp QoQ. Consequently,
PAT is expected to come in at `1,739cr, growth of 0.5% QoQ. We maintain our
buy on the stock with a price target of `1,132.
Y/E
Sales OPM
PAT
EPS ROE P/E P/BV EV/EBITDA EV/Sales
March
(` cr)
(%)
(` cr)
(`)
(%)
(x)
(x)
(x)
(x)
FY2016E
42,038
23.2
7,869
55.8
23.0
15.1
3.5
10.1
2.3
FY2017E
47,503
23.5
8,879
62.9
19.8
13.4
2.7
7.9
1.9
Quarterly Bloomberg Brokers Consensus Estimate
HCL tech Ltd. - January 19, 2016
Particulars (` cr)
2QFY16E
2QFY15
y-o-y (%)
1QFY16
q-o-q (%)
Net sales
10,281
9,283
10.8
10,130
1.5
EBITDA
2,223
2,319
(4.1)
2,211
0.5
EBITDA margin (%)
21.6
25.0
21.8
Net profit
1,805
1,915
(5.7)
1,828
(1.3)
Reliance Ltd. - January 19, 2016
Particulars (` cr)
3QFY16E
3QFY15
y-o-y (%)
2QFY16
q-o-q (%)
Net sales
60,686
93,528
(35.1)
70,901
(14.4)
EBITDA
11,431
8,689
31.6
10,704
6.8
EBITDA margin (%)
18.8
9.3
15.1
Net profit
7,100
5,256
35.1
6,720
5.7
Economic and Political News
Exports contract for 13th consecutive month; dip 15% in December
RBI to buy back `10,000cr worth of government bonds
Government looks to cap trading margin on drugs at 35%
Corporate News
Reliance Jio to raise `15,000cr via rights issue
Sundram Fasteners to raise `300cr through NCDs
NALCO revives $2 billion Iran smelter plan as sanctions end
Tata Steel to axe 1,050 jobs in UK
Market Outlook
January 19, 2016
Top Picks HHHHH
Large Cap
Market Cap
CMP
Target
Upside
Company
Rationale
(` Cr)
(`)
(`)
(%)
To outpace battery industry growth due to better technological
Amara Raja Batteries
13,363
782
1,040
32.9
products leading to market share gains in both the automotive
OEM and replacement segments.
Earnings to grow strongly given the MHCV cyclical upturn.
Ashok Leyland
23,663
83
111
33.5
Focus on exports and LCV's provides additional growth
avenue.
The stock is trading at attractive valuations and is factoring all
HCL Tech
1,18,855
843
1,132
34.3
the bad news.
Strong visibility for a robust 20% earnings trajectory, coupled
HDFC Bank
2,59,869
1,029
1,262
22.6
with high quality of earnings on account of high quality retail
business and strategic focus on highly rated corporates.
Back on the growth trend, expect a long term growth of 14%
Infosys
2,60,003
1,132
1,306
15.4
to be a US$20bn in FY2020.
Well positioned to benefit from such expected gradual
recovery in the overall domestic capex cycle, given its presence
Larsen & Toubro
1,00,841
1,083
1,646
52.0
across various infrastructure segments, its execution
capabilities, and its strong balance sheet.
LICHF continues to grow its retail loan book at a healthy pace
with improvement in asset quality. We expect the company to
LIC Housing Finance
23,375
463
592
27.7
post a healthy loan book which is likely to reflect in a strong
earnings growth.
Source: Company, Angel Research
Mid Cap
Market Cap
CMP
Target
Upside
Company
Rationale
(` Cr)
(`)
(`)
(%)
Favourable outlook for the AC industry to augur well for
Cooling products business which is out pacing the market
Blue Star
3,086
343
439
28.0
growth. EMPPAC division's profitability to improve once
operating environment turns around.
Change in business focus towards high-margin chronic &
Garware Wall Ropes
743
340
473
39.3
lifestyle segments and increasing penetration in Europe and
US
Economic recovery to have favourable impact on advertising &
circulation revenue growth. Further, the acquisition of a radio
Jagran Prakashan
4,967
152
189
24.4
business (Radio City) would also boost the company's revenue
growth.
Massive capacity expansion along with rail advantage at ICD
Navkar Corporation
2,627
184
265
43.9
as well CFS augurs well for the company
Earnings boost on back of stable material prices and
Radico Khaitan
1,393
105
156
49.0
favourable pricing environment. Valuation discount to peers
provides additional comfort
Strong brands and distribution network would boost growth
Siyaram Silk Mills
1,021
1,089
1,354
24.3
going ahead. Stock currently trades at an inexpensive
valuation.
Structural shift in the Lighting industry towards LED lighting will
Surya Roshni
582
133
201
51.5
drive growth.
Source: Company, Angel Research
Market Outlook
January 19, 2016
Key Upcoming Events
Result Calendar
Date
Company
Jan 19, 2016
HCL Tech, Reliance Industries, Reliance Power
Jan 20, 2016
UltraTech Cement, Axis Bank, South Ind.Bank, KPIT Cummins, NIIT, Reliance Infra.
Jan 21, 2016
Exide Industries, Reliance Capital, Hind. Zinc, Heritage Foods, Alembic Pharma, Interglobe Aviation
Jan 22, 2016
ITC, D B Corp, Cairn India
Jan 23, 2016
Persistent, Siyaram Silk Mills
Jan 25, 2016
Subros, HDFC Bank, Hindustan Media Ventures
Jan 27, 2016
Colgate, Godrej Consumer, HT Media, Kirloskar Engines India Ltd, L G Balakrishnan & Bros
Jan 28, 2016
ICICI Bank, Dabur India, Jyothy Laboratories, Tide Water Oil India
Jan 29, 2016
TVS Motor, Thermax, Blue Star, Yes Bank, JSW Steel , Elecon Engineering, Indoco Remedies
Jan 30, 2016
IDFC
Source: Bloomberg, Angel Research
Global economic events release calendar
Date
Time
Country
Event Description
Unit
Period
Bloomberg Data
Last Reported Estimated
Jan 19, 2016
3:00PM UK
CPI (YoY)
% Change
Dec
0.10
0.20
7:30AM China
Industrial Production (YoY)
% Change
Dec
6.20
6.00
7:30AM China
Real GDP (YoY)
% Change
4Q
6.90
6.90
3:30PM Euro Zone
Euro-Zone CPI (YoY)
%
Dec F
0.20
0.20
Jan 20, 2016
7:00PM US
Housing Starts
Thousands
Dec
1,173.00
1,200.00
7:00PM US
Building permits
Thousands
Dec
1,282.00
1,200.00
3:00PM UK
Jobless claims change
% Change
Dec
3.90
2.75
7:00PM US
Consumer price index (mom)
% Change
Dec
--
--
Jan 21, 2016
7:00PM US
Initial Jobless claims
Thousands
Jan 16
284.00
280.00
8:30PM Euro Zone
Euro-Zone Consumer Confidence
Value
Jan A
(5.70)
(5.70)
6:15PM Euro Zone
ECB announces interest rates
%
Jan 21
0.05
0.05
Jan 22, 2016
2:00PM Germany
PMI Services
Value
Jan P
56.00
55.50
2:00PM Germany
PMI Manufacturing
Value
Jan P
53.20
53.00
8:30PM US
Existing home sales
Million
Dec
4.76
5.20
Jan 26, 2016
8:30PM US
Consumer Confidence
S.A./ 1985=100
Jan
96.50
96.75
Jan 27, 2016
8:30PM US
New home sales
Thousands
Dec
490.00
505.00
Jan 28, 2016
3:00PM UK
GDP (YoY)
% Change
4Q A
2.10
--
12:30AM US
FOMC rate decision
%
Jan 27
0.50
0.50
Jan 29, 2016
7:00PM US
GDP Qoq (Annualised)
% Change
4Q A
2.00
0.50
Source: Bloomberg, Angel Research
Market Outlook
January 19, 2016
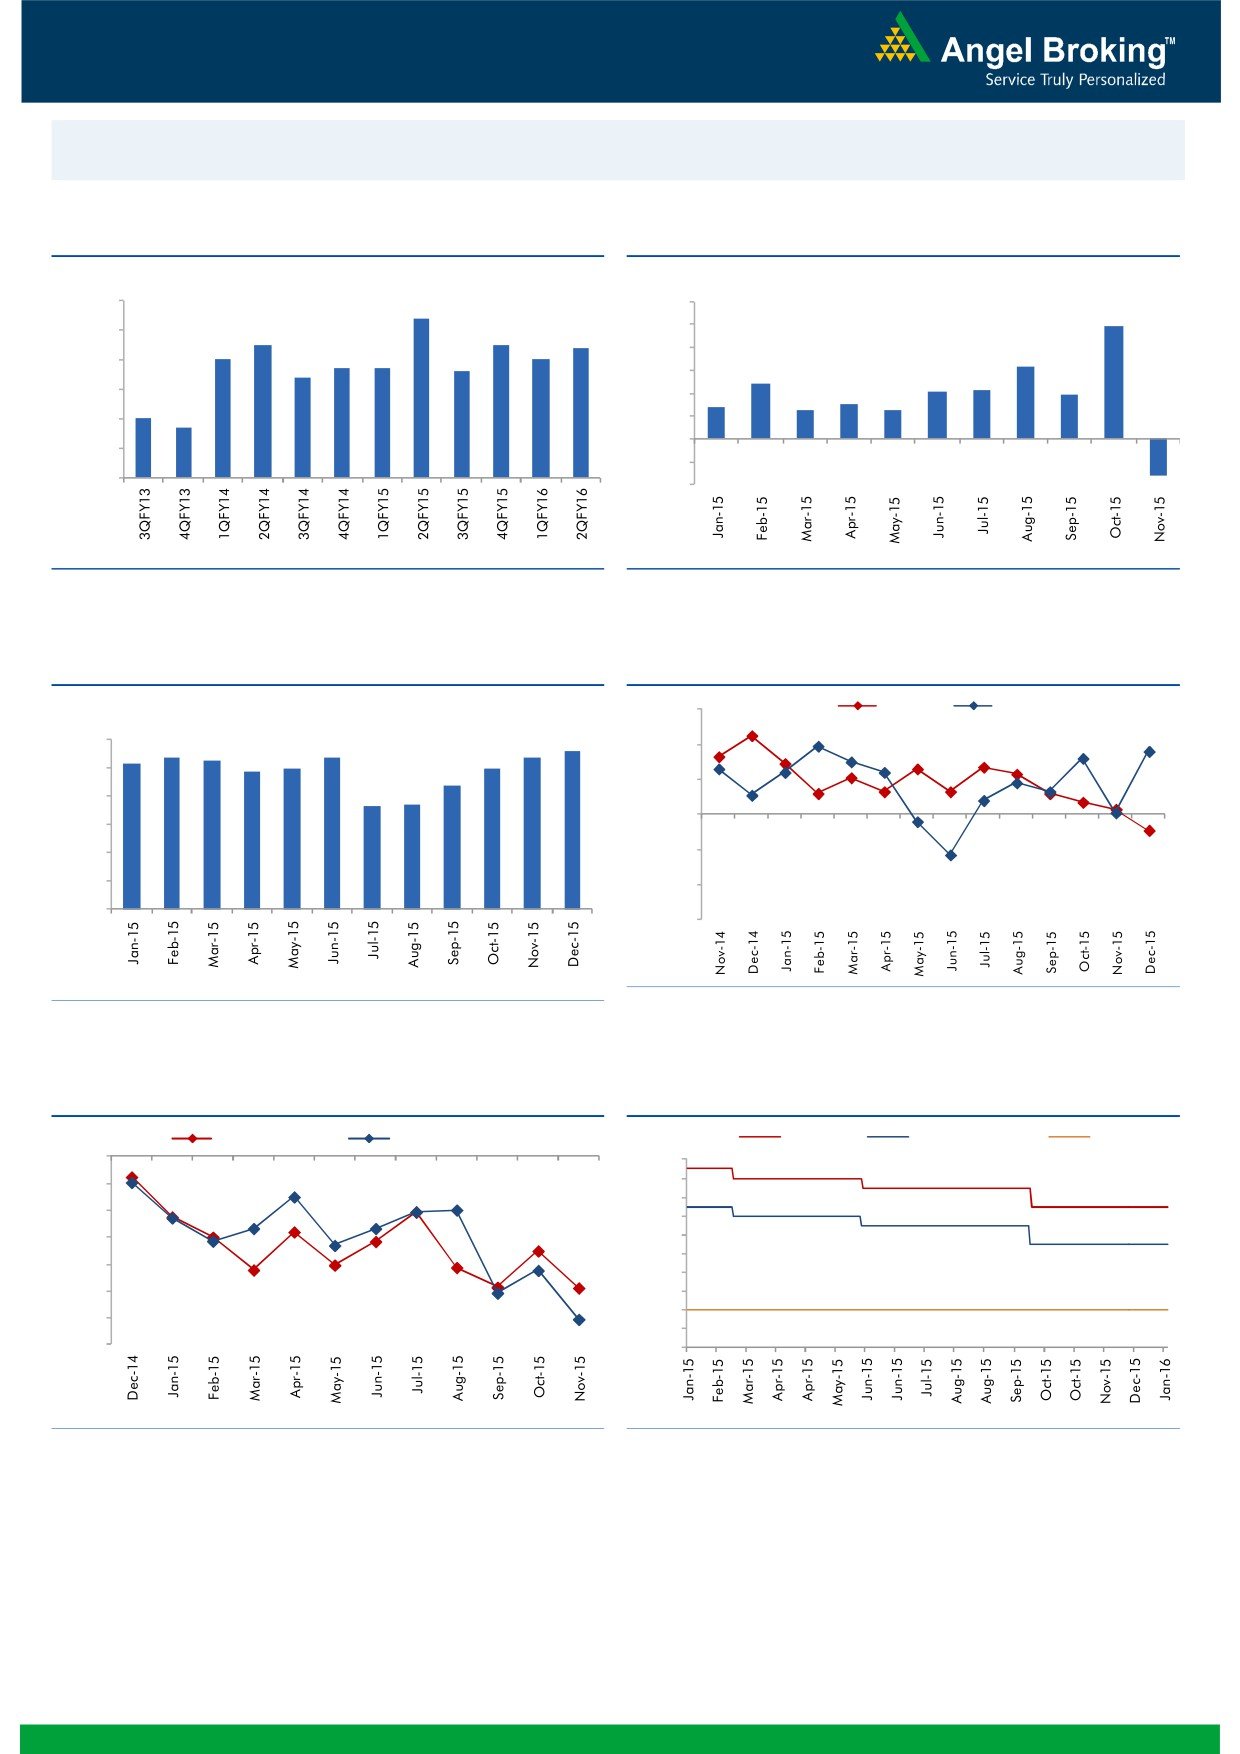
Macro watch
Exhibit 1: Quarterly GDP trends
Exhibit 2: IIP trends
(%)
(%)
9.0
8.4
12.0
9.9
7.5
7.5
10.0
8.0
7.4
7.0
7.0
6.7
6.7
8.0
6.3
6.6
7.0
6.4
6.0
4.8
4.3
4.2
3.8
6.0
2.8
3.0
4.0
2.5
2.5
5.0
4.7
5.0
2.0
-
4.0
(2.0)
3.0
(4.0)
(3.2)
Source: CSO, Angel Research
Source: MOSPI, Angel Research
Exhibit 3: Monthly CPI inflation trends
Exhibit 4: Manufacturing and services PMI
(%)
56.0
Mfg. PMI
Services PMI
5.6
6.0
5.4
5.3
5.4
5.4
54.0
5.2
5.0
5.0
4.9
5.0
4.4
52.0
3.7
3.7
4.0
50.0
3.0
2.0
48.0
1.0
46.0
-
44.0
Source: Market, Angel Research; Note: Level above 50 indicates expansion
Source: MOSPI, Angel Research
Exhibit 5: Exports and imports growth trends
Exhibit 6: Key policy rates
(%)
Exports yoy growth
Imports yoy growth
(%)
Repo rate
Reverse Repo rate
CRR
0.0
8.00
(5.0)
7.50
7.00
(10.0)
6.50
(15.0)
6.00
5.50
(20.0)
5.00
(25.0)
4.50
4.00
(30.0)
3.50
(35.0)
3.00
Source: Bloomberg, Angel Research
Source: RBI, Angel Research
Market Outlook
January 19, 2016
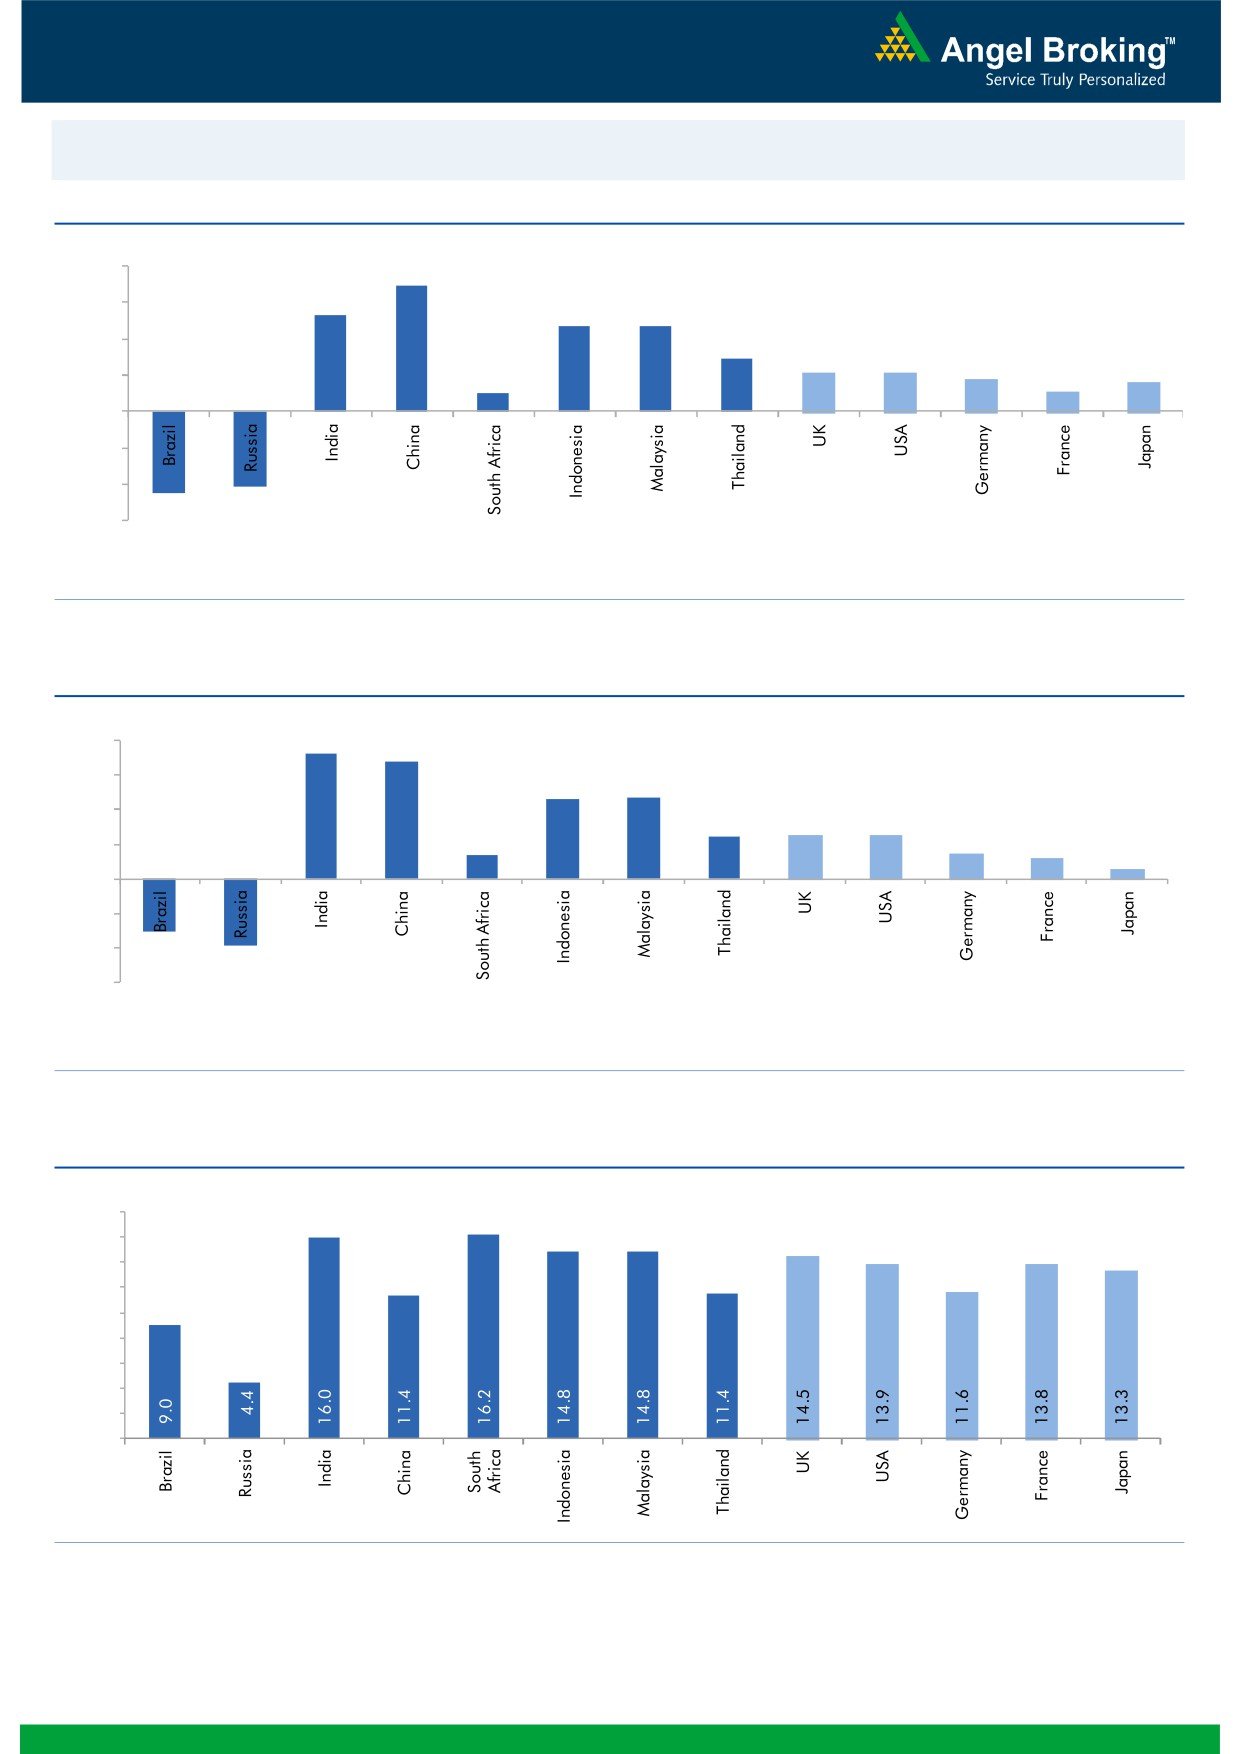
Global watch
Exhibit 1: Latest quarterly GDP Growth (%, yoy) across select developing and developed countries
(%)
8.0
6.9
6.0
5.3
4.7
4.7
4.0
2.9
2.1
2.1
1.8
2.0
1.0
1.1
1.6
-
(2.0)
(4.0)
(4.1)
(4.5)
(6.0)
Source: Bloomberg, Angel Research
Exhibit 2: 2015 GDP Growth projection by IMF (%, yoy) across select developing and developed countries
(%)
7.3
8.0
6.8
6.0
4.7
4.7
4.0
2.5
2.5
2.6
1.4
1.5
2.0
1.2
0.6
-
(2.0)
(4.0)
(3.0)
(3.8)
(6.0)
Source: IMF, Angel Research
Exhibit 3: One year forward P-E ratio across select developing and developed countries
(x)
18.0
16.0
14.0
12.0
10.0
8.0
6.0
4.0
2.0
-
Source: IMF, Angel Research
Stock Watch
January 19, 2016
Company Name
Reco
CMP
Target
Mkt Cap
Sales ( Čcr )
OPM(%)
EPS (Č)
PER(x)
P/BV(x)
RoE(%)
EV/Sales(x)
(Č)
Price ( Č)
( Č cr )
FY16E FY17E
FY16E
FY17E
FY16E
FY17E
FY16E
FY17E
FY16E
FY17E
FY16E
FY17E
FY16E
FY17E
Agri / Agri Chemical
Rallis
Neutral
158
-
3,070
2,097
2,415
14.4
14.4
9.5
11.0
16.6
14.4
3.3
2.9
21.1
21.3
1.5
1.3
United Phosphorus
Buy
388
510
16,647
13,698
15,752
17.6
17.6
32.1
38.5
12.1
10.1
2.4
2.0
21.4
21.3
1.3
1.1
Auto & Auto Ancillary
Ashok Leyland
Buy
83
111
23,663
17,995
21,544
11.4
11.6
3.4
4.7
24.5
17.7
4.3
3.9
17.7
22.2
1.3
1.0
Bajaj Auto
Buy
2,250
2,728
65,097
23,695
27,298
21.3
20.4
134.6
151.5
16.7
14.9
5.3
4.5
31.8
30.6
2.3
2.0
Bharat Forge
Buy
776
943
18,071
7,867
8,881
20.0
20.3
34.4
41.0
22.6
18.9
4.4
3.6
21.1
20.9
2.4
2.1
Eicher Motors
Buy
15,454
19,036
41,964
15,379
16,498
15.6
16.6
473.2
574.8
32.7
26.9
12.1
9.0
36.7
33.2
2.7
2.4
Gabriel India
Buy
85
101
1,216
1,415
1,544
8.7
9.0
4.6
5.4
18.4
15.7
3.3
3.0
18.1
18.9
0.8
0.7
Hero Motocorp
Accumulate
2,431
2,774
48,551
28,561
31,559
14.7
14.7
151.1
163.2
16.1
14.9
6.2
5.3
38.7
35.6
1.5
1.4
Jamna Auto Industries Neutral
130
-
1,029
1,292
1,486
9.3
9.8
6.0
7.5
21.6
17.3
4.5
3.8
20.7
21.8
0.9
0.8
L G Balakrishnan & Bros Neutral
450
-
706
1,254
1,394
11.6
11.8
35.9
41.7
12.6
10.8
1.7
1.5
13.5
13.8
0.7
0.6
Mahindra and Mahindra Buy
1,167
1,449
72,481
39,031
44,440
13.8
13.9
57.9
67.6
20.2
17.3
3.3
2.9
16.1
16.6
1.5
1.3
Maruti
Neutral
4,228
-
127,707
57,865
68,104
16.4
16.7
176.3
225.5
24.0
18.8
4.7
4.0
19.4
21.2
2.0
1.6
Minda Industries
Buy
736
867
1,168
2,567
2,965
8.0
8.3
46.1
57.8
16.0
12.7
2.7
2.2
16.7
17.3
0.6
0.5
Motherson Sumi
Buy
242
313
32,007
39,343
45,100
8.8
9.1
10.1
12.5
24.0
19.4
7.6
5.9
35.3
34.4
0.9
0.8
Rane Brake Lining
Buy
300
366
238
454
511
11.1
11.4
23.8
28.1
12.6
10.7
1.8
1.6
14.2
15.3
0.6
0.6
Setco Automotive
Neutral
36
-
477
594
741
12.7
13.7
1.7
3.2
21.0
11.2
2.2
1.9
10.4
16.9
1.3
1.0
Tata Motors
Buy
341
409
111,601
266,022
312,667
12.8
13.1
26.3
38.3
13.0
8.9
1.7
1.4
8.4
12.1
0.6
0.5
TVS Motor
Buy
274
338
13,018
11,569
13,648
7.3
8.7
10.3
16.1
26.6
17.0
6.6
5.2
24.8
30.5
1.1
0.9
Amara Raja Batteries
Buy
782
1,040
13,363
4,892
5,871
17.4
17.6
28.8
37.1
27.2
21.1
6.3
5.1
23.4
24.1
2.7
2.2
Exide Industries
Buy
130
162
11,033
6,950
7,784
14.4
14.8
6.6
7.3
19.7
17.8
2.5
2.3
12.6
12.8
1.3
1.2
Apollo Tyres
Buy
134
171
6,826
12,146
12,689
16.8
16.0
21.2
19.0
6.3
7.1
1.0
0.9
16.5
13.0
0.6
0.7
Ceat
Buy
917
1,119
3,711
6,041
6,597
14.1
13.7
99.5
111.9
9.2
8.2
1.8
1.5
19.6
18.5
0.8
0.7
JK Tyres
Neutral
87
-
1,979
7,446
7,669
15.2
14.0
19.6
18.4
4.5
4.7
1.1
0.9
25.2
19.5
0.7
0.6
Swaraj Engines
Neutral
891
-
1,107
552
630
14.2
14.7
44.6
54.1
20.0
16.5
4.6
4.2
23.2
25.6
1.9
1.6
Subros
Neutral
83
-
496
1,268
1,488
11.6
11.9
3.7
6.6
22.4
12.5
1.5
1.4
6.8
11.4
0.7
0.6
Indag Rubber
Neutral
174
-
457
283
329
17.0
17.2
13.0
15.4
13.5
11.3
2.9
2.4
21.8
21.6
1.3
1.1
Capital Goods
ACE
Neutral
37
-
370
660
839
4.7
8.2
1.0
3.9
37.4
9.6
1.2
1.0
3.2
11.3
0.7
0.6
BEML
Neutral
1,113
-
4,633
3,277
4,006
6.0
8.9
29.2
64.3
38.1
17.3
2.1
1.9
5.7
11.7
1.5
1.2
Bharat Electronics
Accumulate
1,239
1,414
29,746
7,737
8,634
16.8
17.2
54.0
61.0
23.0
20.3
3.3
2.9
39.3
45.6
3.0
2.5
Stock Watch
January 19, 2016
Company Name
Reco
CMP
Target
Mkt Cap
Sales ( Čcr )
OPM(%)
EPS (Č)
PER(x)
P/BV(x)
RoE(%)
EV/Sales(x)
(Č)
Price ( Č)
( Č cr )
FY16E
FY17E
FY16E
FY17E
FY16E
FY17E
FY16E
FY17E
FY16E
FY17E
FY16E
FY17E
FY16E
FY17E
Capital Goods
Voltas
Buy
272
353
9,004
5,363
5,963
8.0
9.1
11.0
13.8
24.7
19.7
3.8
3.3
16.2
17.9
1.6
1.4
BGR Energy
Neutral
105
-
760
3,615
3,181
9.5
9.4
16.7
12.4
6.3
8.5
0.6
0.6
10.0
7.0
0.6
0.8
BHEL
Neutral
142
-
34,842
33,722
35,272
10.8
11.7
10.5
14.2
13.6
10.0
1.0
0.9
7.0
9.0
1.1
1.1
Blue Star
Buy
343
439
3,086
3,548
3,977
6.3
6.9
13.7
17.2
25.1
20.0
6.3
4.1
26.1
25.4
1.0
0.8
Crompton Greaves
Buy
175
204
10,940
13,484
14,687
4.9
6.2
4.5
7.1
38.8
24.6
2.7
2.6
7.2
10.8
0.9
0.9
Inox Wind
Buy
312
458
6,927
4,980
5,943
17.0
17.5
26.6
31.6
11.7
9.9
3.5
2.6
35.0
30.0
1.5
1.2
KEC International
Neutral
120
-
3,081
8,791
9,716
6.1
6.8
5.4
8.2
22.2
14.6
2.2
2.0
10.0
14.0
0.6
0.5
Thermax
Neutral
835
-
9,951
6,413
7,525
7.4
8.5
30.5
39.3
27.4
21.3
4.2
3.7
15.0
17.0
1.5
1.3
Cement
ACC
Buy
1,228
1,630
23,050
13,151
14,757
16.4
18.3
63.9
83.4
19.2
14.7
2.5
2.3
13.3
16.1
1.6
1.3
Ambuja Cements
Buy
191
233
29,649
11,564
12,556
19.4
20.7
8.9
10.1
21.5
18.9
2.7
2.6
12.8
13.8
2.2
2.0
HeidelbergCement
Neutral
67
-
1,529
1,772
1,926
13.3
15.4
1.0
3.0
67.5
22.5
1.7
1.6
2.6
7.9
1.4
1.2
India Cements
Buy
81
112
2,499
4,216
4,840
18.0
19.5
4.0
9.9
20.3
8.2
0.8
0.8
4.0
9.5
0.9
0.7
JK Cement
Buy
467
744
3,267
3,661
4,742
10.1
15.8
18.0
61.0
26.0
7.7
1.9
1.7
7.5
22.9
1.4
1.0
J K Lakshmi Cement
Buy
273
430
3,208
2,947
3,616
16.7
19.9
11.5
27.2
23.7
10.0
2.3
1.9
9.8
20.8
1.5
1.2
Mangalam Cements
Neutral
169
-
451
1,053
1,347
10.5
13.3
8.4
26.0
20.1
6.5
0.9
0.8
4.3
12.5
0.8
0.6
Orient Cement
Buy
143
183
2,924
1,854
2,524
21.2
22.2
7.7
11.1
18.5
12.9
2.7
2.3
13.3
15.7
2.3
1.6
Ramco Cements
Neutral
362
-
8,614
4,036
4,545
20.8
21.3
15.1
18.8
24.0
19.2
2.9
2.6
12.9
14.3
2.6
2.3
Shree Cement^
Neutral
9,689
-
33,757
7,150
8,742
26.7
28.6
228.0
345.5
42.5
28.1
6.3
5.3
15.7
20.3
4.5
3.6
UltraTech Cement
Buy
2,639
3,282
72,413
25,021
30,023
19.1
21.6
89.0
132.0
29.7
20.0
3.4
3.0
12.2
15.9
3.0
2.5
Construction
ITNL
Neutral
77
-
2,520
7,360
8,825
34.0
35.9
7.0
9.0
10.9
8.5
0.4
0.4
3.2
3.7
3.7
3.6
KNR Constructions
Buy
477
673
1,341
937
1,470
14.3
14.0
33.5
38.6
14.2
12.4
2.2
1.9
15.4
15.4
1.5
1.0
Larsen & Toubro
Buy
1,083
1,646
100,841
65,065
77,009
11.5
11.7
61.5
65.6
17.6
16.5
1.8
1.6
13.4
14.0
1.7
1.5
Gujarat Pipavav Port
Neutral
142
-
6,858
629
684
51.0
52.2
6.4
5.9
22.2
24.0
2.9
2.7
15.9
12.7
10.6
9.5
MBL Infrastructures
Buy
164
285
679
2,313
2,797
12.2
14.6
19.0
20.0
8.6
8.2
0.9
0.8
11.3
10.6
1.0
0.9
Nagarjuna Const.
Neutral
60
-
3,355
7,892
8,842
8.8
9.1
3.0
5.3
20.1
11.4
1.0
0.9
5.0
8.5
0.7
0.6
PNC Infratech
Buy
470
558
2,410
1,873
2,288
13.2
13.5
24.0
32.0
19.6
14.7
1.9
1.7
12.1
12.3
1.4
1.2
Simplex Infra
Neutral
277
-
1,371
5,955
6,829
10.3
10.5
16.0
31.0
17.3
8.9
0.9
0.8
5.3
9.9
0.7
0.6
Power Mech Projects
Neutral
581
-
855
1,539
1,801
12.8
12.7
59.0
72.1
9.9
8.1
1.5
1.3
18.6
16.8
0.6
0.5
Sadbhav Engineering
Neutral
281
-
4,818
3,481
4,219
10.7
10.8
8.0
12.0
35.1
23.4
3.3
2.9
10.3
13.5
1.7
1.4
Stock Watch
January 19, 2016
Company Name
Reco
CMP
Target
Mkt Cap
Sales ( Čcr )
OPM(%)
EPS (Č)
PER(x)
P/BV(x)
RoE(%)
EV/Sales(x)
(Č)
Price ( Č)
( Č cr )
FY16E
FY17E
FY16E
FY17E
FY16E
FY17E
FY16E
FY17E
FY16E
FY17E
FY16E
FY17E
FY16E
FY17E
Construction
NBCC
Buy
905
1,089
10,855
7,382
9,506
7.7
8.6
39.8
54.4
22.7
16.6
5.5
4.3
26.7
29.1
1.2
0.9
MEP Infra
Neutral
42
-
680
1,956
1,876
28.1
30.5
1.3
3.0
32.2
13.9
6.7
4.5
21.2
32.8
1.8
1.7
SIPL
Neutral
85
-
2,987
675
1,042
62.4
64.7
-
-
3.2
3.6
-
-
16.1
10.9
Financials
Allahabad Bank
Neutral
52
-
3,150
8,569
9,392
2.8
2.9
16.3
27.5
3.2
1.9
0.3
0.2
7.6
11.9
-
-
Axis Bank
Buy
374
531
88,876
26,473
31,527
3.5
3.6
35.7
43.5
10.5
8.6
2.0
1.8
17.9
18.9
-
-
Bank of Baroda
Neutral
127
-
29,148
18,485
21,025
1.9
2.0
13.5
21.1
9.4
6.0
0.7
0.7
7.3
10.6
-
-
Bank of India
Neutral
93
-
7,526
15,972
17,271
1.9
2.0
15.3
33.4
6.1
2.8
0.3
0.2
3.6
7.6
-
-
Canara Bank
Neutral
178
-
9,641
15,441
16,945
2.0
2.1
46.6
70.4
3.8
2.5
0.3
0.3
8.0
11.2
-
-
Dena Bank
Neutral
35
-
2,284
3,440
3,840
2.1
2.3
7.3
10.0
4.9
3.5
0.4
0.3
6.1
7.9
-
-
Federal Bank
Neutral
48
-
8,267
3,477
3,999
3.0
3.0
5.0
6.2
9.6
7.7
1.0
0.9
10.6
11.9
-
-
HDFC
Neutral
1,134
-
179,005
10,358
11,852
3.3
3.3
41.1
47.0
27.6
24.1
5.3
4.8
24.7
24.9
-
-
HDFC Bank
Buy
1,029
1,262
259,869
38,309
47,302
4.3
4.3
49.3
61.1
20.9
16.9
3.6
3.1
18.5
19.7
-
-
ICICI Bank
Buy
223
304
129,439
34,279
39,262
3.3
3.3
21.0
24.4
10.6
9.1
1.8
1.5
14.4
14.7
-
-
IDBI Bank
Neutral
55
-
10,526
9,625
10,455
1.8
1.8
8.5
14.2
6.5
3.9
0.4
0.4
5.9
9.3
-
-
Indian Bank
Neutral
90
-
4,318
6,160
6,858
2.5
2.5
24.5
29.8
3.7
3.0
0.3
0.3
7.7
8.6
-
-
LIC Housing Finance
Buy
463
592
23,375
3,101
3,745
2.5
2.5
33.0
40.2
14.1
11.5
2.6
2.2
19.7
20.5
-
-
Oriental Bank
Neutral
105
-
3,154
7,643
8,373
2.4
2.4
37.2
45.4
2.8
2.3
0.3
0.2
8.2
9.4
-
-
Punjab Natl.Bank
Neutral
91
-
17,937
23,638
26,557
2.8
2.8
17.9
27.2
5.1
3.4
0.5
0.4
8.5
12.0
-
-
South Ind.Bank
Neutral
18
-
2,437
1,965
2,185
2.5
2.5
2.5
3.3
7.2
5.5
0.7
0.7
9.5
11.7
-
-
St Bk of India
Buy
181
237
140,584
82,520
93,299
2.7
2.8
20.0
24.5
9.0
7.4
1.0
0.9
11.5
12.8
-
-
Union Bank
Neutral
112
-
7,723
12,646
14,129
2.3
2.4
31.0
39.1
3.6
2.9
0.4
0.3
9.8
11.4
-
-
Vijaya Bank
Neutral
30
-
2,564
3,536
3,827
1.9
1.9
5.5
6.7
5.4
4.5
0.4
0.4
7.8
8.8
-
-
Yes Bank
Buy
656
825
27,529
7,190
9,011
3.2
3.3
58.2
69.7
11.3
9.4
2.0
1.7
19.2
19.6
-
-
FMCG
Asian Paints
Neutral
851
-
81,590
16,553
19,160
16.0
16.2
17.7
21.5
48.1
39.6
12.8
11.5
29.4
31.2
4.8
4.1
Britannia
Neutral
2,763
-
33,145
8,065
9,395
9.6
10.2
47.2
65.5
58.5
42.2
19.5
18.4
38.3
41.2
4.0
3.4
Colgate
Neutral
912
-
24,816
4,836
5,490
19.5
19.7
48.5
53.2
18.8
17.2
13.8
12.0
99.8
97.5
5.0
4.4
Dabur India
Accumulate
247
267
43,468
9,370
10,265
17.1
17.2
7.3
8.1
33.7
30.5
10.2
8.3
33.7
30.6
4.5
4.1
GlaxoSmith Con*
Neutral
5,887
-
24,762
4,919
5,742
17.2
17.4
168.3
191.2
35.0
30.8
9.9
8.5
28.8
28.9
4.6
3.9
Godrej Consumer
Neutral
1,212
-
41,256
10,168
12,886
16.1
16.1
32.1
38.4
37.8
31.6
7.7
7.1
19.7
21.0
4.2
3.3
Stock Watch
January 19, 2016
Company Name
Reco
CMP
Target
Mkt Cap
Sales ( Čcr )
OPM(%)
EPS (Č)
PER(x)
P/BV(x)
RoE(%)
EV/Sales(x)
(Č)
Price ( Č)
( Č cr )
FY16E FY17E
FY16E
FY17E
FY16E
FY17E
FY16E
FY17E
FY16E
FY17E
FY16E
FY17E
FY16E
FY17E
FMCG
HUL
Neutral
811
-
175,403
34,940
38,957
17.5
17.7
20.8
24.7
39.0
32.8
43.4
34.6
110.5
114.2
4.8
4.3
ITC
Buy
316
382
253,558
41,068
45,068
37.8
37.4
13.9
15.9
22.7
19.8
7.6
6.7
34.1
33.8
5.8
5.3
Marico
Neutral
219
-
28,268
6,551
7,766
15.7
16.0
10.4
12.5
21.1
17.5
6.1
5.1
33.2
32.4
4.2
3.6
Nestle*
Buy
5,448
6,646
52,530
11,291
12,847
22.2
22.3
158.9
184.6
34.3
29.5
17.9
16.1
55.0
57.3
4.5
3.9
Tata Global
Buy
122
144
7,693
8,635
9,072
9.8
9.9
6.5
7.6
18.8
16.0
1.9
1.8
6.8
7.4
0.8
0.8
IT
HCL Tech^
Buy
843
1,132
118,855
42,038
47,503
23.2
23.5
55.8
62.9
15.1
13.4
3.5
2.7
23.0
19.8
2.4
1.9
Infosys
Buy
1,132
1,306
260,003
60,250
66,999
27.0
28.0
56.4
63.7
20.1
17.8
4.1
3.5
20.4
19.8
3.6
3.1
TCS
Buy
2,282
2,854
447,063
108,487
122,590
28.3
28.5
122.8
138.4
18.6
16.5
7.1
6.4
38.0
38.9
3.7
3.2
Tech Mahindra
Buy
518
646
50,063
25,566
28,890
16.0
17.0
26.3
31.9
19.7
16.2
3.5
3.0
17.9
18.6
1.7
1.5
Wipro
Buy
547
719
135,217
50,808
58,713
23.7
23.8
37.3
42.3
14.7
12.9
2.8
2.5
19.0
17.9
2.2
1.8
Media
D B Corp
Buy
308
356
5,660
2,241
2,495
27.8
27.9
21.8
25.6
14.2
12.0
3.7
3.3
26.7
28.5
2.5
2.2
HT Media
Neutral
82
-
1,897
2,495
2,603
11.2
11.2
7.3
8.6
11.2
9.5
0.9
0.8
7.4
8.1
0.3
0.2
Jagran Prakashan
Buy
152
189
4,967
2,170
2,355
27.2
26.2
8.9
9.9
17.1
15.4
3.6
3.1
20.9
20.5
2.2
2.0
Sun TV Network
Neutral
365
-
14,382
2,779
3,196
70.2
70.5
22.8
27.3
16.0
13.4
4.0
3.6
26.7
28.3
4.9
4.3
Hindustan Media
Neutral
273
-
2,004
920
1,031
20.0
20.0
19.2
20.9
14.2
13.1
2.3
2.0
16.4
15.3
1.7
1.5
Ventures
Metals & Mining
Coal India
Buy
311
380
196,723
76,167
84,130
19.9
22.3
22.4
25.8
13.9
12.1
5.0
4.9
35.5
41.0
1.9
1.7
Hind. Zinc
Buy
139
175
58,605
14,641
14,026
50.4
50.4
17.7
16.0
7.9
8.7
1.2
1.1
16.2
13.2
1.6
1.4
Hindalco
Neutral
71
-
14,703
104,356
111,186
8.7
9.5
6.7
11.1
10.6
6.4
0.4
0.4
3.5
5.9
0.7
0.6
JSW Steel
Neutral
992
-
23,990
42,308
45,147
16.4
20.7
(10.3)
49.5
20.1
1.1
1.1
(1.0)
5.6
1.6
1.5
NMDC
Neutral
85
-
33,541
8,237
10,893
46.6
44.5
10.0
11.7
8.5
7.3
1.0
0.8
12.5
13.0
3.9
2.9
SAIL
Neutral
42
-
17,348
45,915
53,954
7.2
10.5
1.5
4.4
27.9
9.6
0.4
0.4
2.3
4.1
1.0
0.9
Vedanta
Neutral
69
-
20,412
71,445
81,910
26.2
26.3
12.9
19.2
5.4
3.6
0.4
0.3
7.2
8.9
0.7
0.5
Tata Steel
Neutral
236
-
22,945
126,760
137,307
8.9
11.3
6.4
23.1
37.1
10.2
0.7
0.7
2.0
7.1
0.8
0.7
Oil & Gas
Cairn India
Neutral
111
-
20,820
11,323
12,490
49.4
51.0
20.7
20.7
5.4
5.4
0.3
0.3
6.4
6.1
0.9
0.3
GAIL
Neutral
338
-
42,932
64,856
70,933
9.1
9.6
24.0
28.9
14.1
11.7
1.2
1.1
8.8
9.6
0.8
0.8
ONGC
Neutral
215
-
183,857
154,564
167,321
36.8
37.4
28.6
32.5
7.5
6.6
1.0
0.9
12.7
13.5
1.4
1.3
Petronet LNG
Neutral
248
-
18,611
29,691
31,188
5.8
6.2
12.8
13.4
19.4
18.5
2.9
2.6
15.8
14.8
0.7
0.7
Indian Oil Corp
Accumulate
417
455
101,233
359,607
402,760
5.9
6.1
42.5
48.7
9.8
8.6
1.3
1.2
14.1
14.4
0.4
0.3
Reliance Industries
Accumulate
1,018
1,150
329,771
304,775
344,392
12.6
13.4
91.3
102.6
11.2
9.9
1.3
1.1
11.8
12.0
1.0
0.8
Stock Watch
January 19, 2016
Company Name
Reco
CMP
Target
Mkt Cap
Sales ( Čcr )
OPM(%)
EPS (Č)
PER(x)
P/BV(x)
RoE(%)
EV/Sales(x)
(Č)
Price ( Č)
( Č cr )
FY16E FY17E
FY16E
FY17E
FY16E
FY17E
FY16E
FY17E
FY16E
FY17E
FY16E
FY17E
FY16E
FY17E
Pharmaceuticals
Alembic Pharma
Neutral
598
-
11,264
2,658
3,112
24.1
20.2
24.6
23.9
24.3
25.0
8.7
6.7
42.5
30.2
4.2
3.6
Aurobindo Pharma
Accumulate
800
856
46,720
14,923
17,162
22.0
23.0
35.7
42.8
22.4
18.7
6.6
5.0
34.0
30.2
3.5
3.0
Aventis*
Neutral
4,054
-
9,336
2,082
2,371
17.4
20.8
118.2
151.5
34.3
26.8
5.0
4.0
19.9
25.5
4.2
3.4
Cadila Healthcare
Buy
300
352
30,717
10,224
11,840
21.0
22.0
14.6
17.6
20.6
17.1
5.6
4.4
30.8
29.0
3.1
2.6
Cipla
Accumulate
591
636
47,459
14,211
16,611
20.6
19.0
27.0
28.9
21.9
20.4
3.7
3.2
18.4
16.8
3.3
2.8
Dr Reddy's
Buy
2,877
3,933
49,082
16,838
19,575
25.0
23.1
167.5
178.8
17.2
16.1
3.6
3.0
23.1
20.4
2.8
2.4
Dishman Pharma
Neutral
292
-
2,352
1,733
1,906
21.5
21.5
17.0
19.9
17.2
14.7
1.7
1.6
10.5
11.2
1.9
1.6
GSK Pharma*
Neutral
3,168
-
26,829
2,870
3,158
20.0
22.1
59.5
68.3
53.2
46.4
15.7
16.1
28.5
34.3
8.8
8.1
Indoco Remedies
Neutral
303
-
2,794
1,033
1,199
15.9
18.2
9.4
13.6
32.3
22.3
4.8
4.1
15.7
19.7
2.8
2.4
Ipca labs
Buy
617
900
7,787
3,363
3,909
12.9
18.6
13.4
28.0
46.1
22.0
3.3
2.9
7.4
14.0
2.6
2.2
Lupin
Neutral
1,703
-
76,711
13,092
16,561
25.0
27.0
50.4
68.3
33.8
24.9
7.0
5.5
22.8
24.7
5.6
4.3
Sun Pharma
Buy
786
950
189,212
28,163
32,610
25.8
30.7
17.4
26.9
45.2
29.2
4.3
3.7
13.0
16.6
6.2
5.1
Power
Tata Power
Neutral
62
-
16,674
35,923
37,402
22.6
22.8
4.1
5.2
15.2
12.0
1.2
1.1
7.5
9.3
1.4
1.3
NTPC
Buy
135
157
111,025
87,064
98,846
23.5
23.5
11.7
13.2
11.5
10.2
1.3
1.2
11.4
12.1
2.3
2.1
Power Grid
Buy
138
170
72,274
20,702
23,361
86.7
86.4
12.1
13.2
11.4
10.5
1.7
1.5
15.6
15.1
8.4
7.8
Telecom
Bharti Airtel
Neutral
300
-
120,062
101,748
109,191
32.1
31.7
12.0
12.5
25.0
24.0
1.7
1.6
6.9
6.7
1.8
1.6
Idea Cellular
Neutral
111
-
40,054
34,282
36,941
32.0
31.5
5.9
6.2
18.9
17.9
1.7
1.6
9.9
9.3
1.7
1.7
zOthers
Abbott India
Neutral
5,195
-
11,040
2,715
3,153
14.5
14.1
134.3
152.2
38.7
34.1
9.7
8.0
27.4
25.6
3.8
3.2
Bajaj Electricals
Buy
172
290
1,739
4,719
5,287
5.2
5.8
8.6
12.7
20.1
13.6
2.3
2.0
11.4
14.8
0.4
0.3
Finolex Cables
Neutral
221
-
3,379
2,520
2,883
12.2
12.0
12.7
14.2
17.4
15.6
2.4
2.1
13.6
13.5
1.1
0.9
Goodyear India*
Buy
473
622
1,092
1,888
1,680
12.1
11.9
62.2
56.6
7.6
8.4
1.8
1.5
25.9
19.7
0.4
0.3
Hitachi
Neutral
1,033
-
2,809
1,779
2,081
7.8
8.8
21.8
33.4
47.4
30.9
7.7
6.2
17.4
22.1
1.6
1.4
Jyothy Laboratories
Neutral
277
-
5,019
1,620
1,847
11.5
11.5
7.3
8.5
38.0
32.7
4.9
4.6
13.3
14.4
3.0
2.5
MRF
Buy
36,248
45,575
15,369
20,316
14,488
21.4
21.1
5,488.0
3,798.0
6.6
9.5
2.3
1.8
41.1
21.2
0.7
0.9
Page Industries
Neutral
12,497
-
13,934
1,929
2,450
19.8
20.1
229.9
299.0
54.4
41.8
24.0
16.7
52.1
47.1
7.3
5.7
Relaxo Footwears
Neutral
420
-
5,039
1,767
2,152
12.3
12.5
19.3
25.1
21.8
16.8
5.4
4.1
27.7
27.8
2.9
2.4
Siyaram Silk Mills
Buy
1,089
1,354
1,021
1,636
1,815
11.5
11.5
89.9
104.1
12.1
10.5
2.0
1.7
17.9
17.8
0.8
0.7
Styrolution ABS India*
Accumulate
651
698
1,145
1,271
1,440
8.6
9.2
32.0
41.1
20.3
15.9
2.1
1.9
10.7
12.4
0.9
0.8
TVS Srichakra
Buy
2,462
3,240
1,886
2,101
2,338
15.7
15.0
248.6
270.0
9.9
9.1
4.3
3.1
43.6
34.0
0.9
0.8
Stock Watch
January 19, 2016
Company Name
Reco
CMP
Target
Mkt Cap
Sales ( Čcr )
OPM(%)
EPS (Č)
PER(x)
P/BV(x)
RoE(%)
EV/Sales(x)
(Č)
Price ( Č)
( Č cr )
FY16E
FY17E
FY16E
FY17E
FY16E
FY17E
FY16E
FY17E
FY16E
FY17E
FY16E
FY17E
FY16E
FY17E
zOthers
HSIL
Accumulate
270
302
1,954
2,123
2,384
16.1
16.5
15.0
18.9
18.0
14.3
1.4
1.3
8.0
9.4
1.3
1.1
Kirloskar Engines India
Neutral
238
-
3,443
2,471
2,826
8.8
10.4
9.1
13.3
26.1
17.9
2.5
2.3
9.7
13.4
1.0
0.9
Ltd
M M Forgings
Buy
483
614
582
511
615
21.7
21.6
43.1
55.8
11.2
8.7
2.0
1.7
19.9
21.2
1.3
1.0
Banco Products (India) Neutral
120
-
858
1,208
1,353
11.0
12.3
10.8
14.5
11.1
8.3
1.3
1.1
11.9
14.5
0.7
0.6
Competent Automobiles Neutral
128
-
79
1,040
1,137
3.2
3.1
25.7
28.0
5.0
4.6
0.8
0.7
15.0
14.3
0.1
0.1
Nilkamal
Neutral
1,107
-
1,651
1,910
2,083
10.5
10.3
63.3
69.2
17.5
16.0
2.9
2.5
17.6
16.5
0.9
0.8
Visaka Industries
Buy
100
144
159
1,086
1,197
9.9
10.3
21.5
28.8
4.7
3.5
0.5
0.4
9.6
11.6
0.4
0.3
Transport Corporation of
Neutral
252
-
1,917
2,830
3,350
8.8
9.0
14.4
18.3
17.5
13.8
2.7
2.4
15.4
17.1
0.8
0.7
India
Elecon Engineering
Buy
65
85
704
1,369
1,533
13.7
14.9
3.3
6.1
19.5
10.7
1.3
1.2
6.6
11.4
0.9
0.8
Surya Roshni
Buy
133
201
582
2,992
3,223
8.1
8.4
14.7
18.3
9.0
7.2
0.8
0.8
9.7
11.0
0.5
0.4
MT Educare
Neutral
144
-
575
286
366
18.3
17.7
7.7
9.4
18.7
15.4
3.9
3.5
20.2
21.1
1.9
1.4
Radico Khaitan
Buy
105
156
1,393
1,565
1,687
12.2
13.0
5.7
7.1
18.4
14.8
1.5
1.4
8.3
9.6
1.4
1.2
Garware Wall Ropes
Buy
340
473
743
862
974
11.2
11.2
24.9
29.6
13.7
11.5
2.1
1.8
15.1
15.4
0.9
0.7
Wonderla Holidays
Neutral
353
-
1,993
206
308
44.0
43.6
9.0
12.9
39.2
27.3
5.4
4.9
13.7
17.8
9.6
6.4
Linc Pen & Plastics
Neutral
200
-
295
340
371
8.3
8.9
10.8
13.2
18.5
15.1
3.0
2.6
16.0
17.1
0.9
0.8
The Byke Hospitality
Neutral
149
-
597
222
287
20.5
20.5
5.6
7.6
26.4
19.7
5.0
4.1
18.9
20.8
2.7
2.1
Interglobe Aviation
Neutral
1,130
-
40,729
17,022
21,122
20.7
14.5
63.9
53.7
17.7
21.1
26.5
21.7
149.9
103.2
2.4
1.9
Coffee Day Enterprises
Neutral
244
-
5,026
2,692
2,964
17.0
18.6
-
4.7
-
51.5
3.0
2.8
0.2
5.5
2.3
2.1
Ltd
Navneet Education
Neutral
83
-
1,978
998
1,062
24.1
24.0
5.8
6.1
14.4
13.6
3.2
2.8
22.0
20.6
2.1
1.9
Navkar Corporation
Buy
184
265
2,627
365
436
38.3
37.5
5.6
5.9
32.7
31.3
2.1
1.9
6.3
6.1
8.0
6.9
Source: Company, Angel Research; Note: *December year end; #September year end; &October year end; Price as on January 18, 2016
Market Outlook
January 19, 2016
Research Team Tel: 022 - 39357800
DISCLAIMER
Angel Broking Private Limited (hereinafter referred to as “Angel”) is a registered Member of National Stock Exchange of India Limited,
Bombay Stock Exchange Limited and Metropolitian Stock Exchange of India Limited. It is also registered as a Depository Participant with
CDSL and Portfolio Manager with SEBI. It also has registration with AMFI as a Mutual Fund Distributor. Angel Broking Private Limited is a
registered entity with SEBI for Research Analyst in terms of SEBI (Research Analyst) Regulations, 2014 vide registration number
INH000000164. Angel or its associates has not been debarred/ suspended by SEBI or any other regulatory authority for accessing
/dealing in securities Market. Angel or its associates including its relatives/analyst do not hold any financial interest/beneficial ownership
of more than 1% in the company covered by Analyst. Angel or its associates/analyst has not received any compensation / managed or co
-managed public offering of securities of the company covered by Analyst during the past twelve months. Angel/analyst has not served as
an officer, director or employee of company covered by Analyst and has not been engaged in market making activity of the company
covered by Analyst.
This document is solely for the personal information of the recipient, and must not be singularly used as the basis of any investment
decision. Nothing in this document should be construed as investment or financial advice. Each recipient of this document should make
such investigations as they deem necessary to arrive at an independent evaluation of an investment in the securities of the companies
referred to in this document (including the merits and risks involved), and should consult their own advisors to determine the merits and
risks of such an investment.
Reports based on technical and derivative analysis center on studying charts of a stock's price movement, outstanding positions and
trading volume, as opposed to focusing on a company's fundamentals and, as such, may not match with a report on a company's
fundamentals.
The information in this document has been printed on the basis of publicly available information, internal data and other reliable sources
believed to be true, but we do not represent that it is accurate or complete and it should not be relied on as such, as this document is for
general guidance only. Angel Broking Pvt. Limited or any of its affiliates/ group companies shall not be in any way responsible for any
loss or damage that may arise to any person from any inadvertent error in the information contained in this report. Angel Broking Pvt.
Limited has not independently verified all the information contained within this document. Accordingly, we cannot testify, nor make any
representation or warranty, express or implied, to the accuracy, contents or data contained within this document. While Angel Broking
Pvt. Limited endeavors to update on a reasonable basis the information discussed in this material, there may be regulatory, compliance,
or other reasons that prevent us from doing so.
This document is being supplied to you solely for your information, and its contents, information or data may not be reproduced,
redistributed or passed on, directly or indirectly.
Neither Angel Broking Pvt. Limited, nor its directors, employees or affiliates shall be liable for any loss or damage that may arise from or
in connection with the use of this information.
Note: Please refer to the important ‘Stock Holding Disclosure' report on the Angel website (Research Section). Also, please refer to the
latest update on respective stocks for the disclosure status in respect of those stocks. Angel Broking Pvt. Limited and its affiliates may have
investment positions in the stocks recommended in this report.