Market Outlook
September 18, 2015
Dealer’s Diary
Domestic Indices
Chg (%)
(Pts)
(Close)
BSE Sensex
1.0
258
25,964
Indian markets are expected to open on a Positive note tracking the SGX Nifty and
Nifty
0.9
70
7,899
most global markets.
MID CAP
(0.2)
(18)
10,553
The US markets were volatile and closed Thursday’s trading session on mixed note
SMALL CAP
(0.4)
(48)
10,686
after the upward move seen in two prior sessions. The US Federal Reserve’s decision
BSE HC
0.7
115
17,234
to keep policy interest rate unchanged amidst market turmoil, rising international
BSE PSU
0.2
10
6,689
risks and slow inflation at home resulted in markets closing in the unchanged zone.
BANKEX
1.4
271
19,435
The majority of the European markets ended Thursday's session in the green. The
AUTO
0.5
80
17,496
investors remained cautious ahead of upcoming announcement from the Federal
METAL
0.3
25
7,245
Reserve.
OIL & GAS
(0.6)
(52)
8,670
Indian shares opened higher and traded in the positive zone throughout
BSE IT
0.5
50
11,151
Wednesday, in-line with gains seen in global markets as traders awaited Federal
Global Indices
Chg (%)
(Pts)
(Close)
Reserve decision on interest rates.
Dow Jones
(0.4)
(65)
16,675
NASDAQ
0.1
5
4,894
News & Result Analysis
FTSE
(0.7)
(42)
6,187
UltraTech Cement gets green nod for expansion of Maharashtra plant
Nikkei
(1.5)
(276)
18,156
Govt mulls raising FDI limit in private banks to 100%
Hang Seng
0.5
105
21,960
ENIL wins 17 FM channels; HT Media bags Delhi for `169cr
Refer detailed news analysis on the following page
Straits Times
0.0
1
2,897
Shanghai Com
(2.1)
(66)
3,086
Markets Today
The trend deciding level for the day is 25,929 / 7,889 levels. If NIFTY trades above
this level during the first half-an-hour of trade then we may witness a further rally up
Indian ADR
Chg (%)
(Pts)
(Close)
to 26,042 - 26,119 / 7,924 - 7,949 levels. However, if NIFTY trades below
INFY
(0.7)
(0.1)
$17.8
25,929 / 7,889 levels for the first half-an-hour of trade then it may correct towards
WIT
0.2
0.0
$12.1
25,851 - 25,739 / 7,864 - 7,828 levels.
IBN
1.4
0.1
$8.8
Indices
S2
S1
PIVOT
R1
R2
HDB
1.3
0.8
$59.1
SENSEX
25,739
25,851
25,929
26,042
26,119
Advances / Declines
BSE
NSE
NIFTY
7,828
7,864
7,889
7,924
7,949
Advances
1,313
717
Declines
1,375
779
Net Inflows (September 15, 2015)
` cr
Purch
Sales
Net
MTD
YTD
Unchanged
108
73
FII
6,839
3,715
3,124
(2,790)
120,970
Volumes (` cr)
MFs
696
325
371
4,682
75,330
BSE
2,353
FII Derivatives (September 16, 2015)
NSE
13,889
` cr
Purch
Sales
Net
Open Interest
Index Futures
1,543
1,593
1,593
22,651
Stock Futures
2,763
1,724
1,724
46,964
Gainers / Losers
Gainer
Loser
Company
Price (`)
chg (%)
Company
Price (`)
chg (%)
CADILAHC
1,912
6.8
RAJESHEXPO
388
(9.5)
DISHTV
116
6.4
CONCOR
1,389
(5.3)
OBEROIRLTY
251
4.2
AMTEKAUTO
50
(5.2)
YESBANK
758
4.0
EMAMILTD
1,159
(5.0)
NIITTECH
452
3.2
SUNASIAN
121
(5.0)
Market Outlook
September 18, 2015
UltraTech Cement gets green nod for expansion of Maharashtra
plant
Aditya Birla Group flagship UltraTech Cement has got Environment Ministry's
clearance to expand capacity at its Awarpur plant in Maharasthra, which would
entail an investment of `248cr. The company has proposed to raise production of
clinker, a raw material for cement manufacture, to 4.5 million tonnes per annum
(MTPA) from the existing 3.30 MTPA, and increase cement output to 6 MTPA from
4.48 MTPA. The additional power required for the proposed expansion will be 5.1
MW. We expect this capacity to be added in FY2017 which will take its total
capacity in India to 73 MTPA. This expansion will be in line with company’s long
term goal to increase capacity to 100 MTPA by FY2020. We maintain our positive
view on the stock and currently have an Accumulate rating with a target price of
`3,282.
Govt mulls raising FDI limit in private banks to 100%
To increase foreign funds inflows into the country, the government is considering to
relax investment norms by increasing foreign direct investment (FDI) limit to 100%
for private banks from existing 74%. One of the options being considered is
allowing an additional 26% increase through the approval route. This will benefit
Private sector banks in our Universe as this will entail further FII investment in
Private sector banks and enhance their capital base. The current investment in
HDFC Bank and ICICI Bank are already near the current limit and should aid
further investments in the Banks.
ENIL wins 17 FM channels; HT Media bags Delhi for `169cr
Entertainment Network India Ltd (ENIL) appears to be the largest gainer in the first
stage of the FM Radio Phase III e-auctions declared on 16 September 2015 with
17 channels in its kitty. HT Media was the bidder for the sole channel in Delhi,
which it picked up for a whopping sum of `169.16cr. HT Media also bagged one
of the two channels in Mumbai. The other went to Digital Radio (Mumbai)
Broadcasting Pvt Ltd, which an affiliate of Sun TV Network.
On the other hand, ENIL bagged the sole channel in Bengaluru along with two
channels in Hyderabad, with one other channel in Hyderabad going to HT Media.
ENIL also bagged the sole channel in Guwahati and one of the two in Jammu, the
other going to Rajasthan Patrika. Rajasthan Patrika successfully bid for
14
channels, while Reliance Broadcast Network has got 14 channels and DB Corp Ltd
has got 14 channels. Meanwhile, Music Broadcast Pvt Ltd has got 11 channels and
HT Media has 10 channels. The others, who have successful bid are Digital Radio
(Mumbai) Broadcasting, Abhijeet Realtors and Infraventures Pvt Ltd, Renderlive
Films and Entertainment Pvt Ltd, Sarthak Films Pvt Ltd, Abir Buildcon Pvt Ltd,
Mathrubhumi Printing and Publishing Co Pvt Ltd and Odisha Television Ltd.
Bhubaneswar - the city, which got the maximum number of bids, has been bagged
by Sarthak Films Pvt Ltd. The auction was stopped on the 33rd day after just one
round, with 97 channels in 56 cities became provisional winning channels with
cumulative provisional winning price of about `1156.9cr against their aggregate
reserve price of about `459.8cr. The results of 91 channels in 54 cities were
declared 16 September 2015 by the Information and Broadcasting Ministry. These
results do not include the results of the bids by M/s Sun TV, South Asia FM and
Kal Radio in compliance with the orders of the Madras High Court.
Market Outlook
September 18, 2015
The I&B ministry said the Centre had decided to file a special leave to appeal in
the Supreme Court against the order of 26 July of the Delhi High Court in the
petitions by Digital Radio (Mumbai) Broadcasting Ltd. & Digital Radio (Delhi)
Broadcasting Ltd. respectively.
Economic and Political News
Govt may allow state pension funds to invest more in equities
Govt will 'put to sleep' pending tax disputes: FM
Corporate News
Fortis Healthcare to add 300-500 beds per year in near future
L&T gets `1,700cr job order to build Bangladesh power plant
Power Grid gets shareholders nod to raise `14,000cr in FY17
RBI grants approval to 10 entities for small finance banks
Market Outlook
September 18, 2015
Top Picks
Large Cap
Market Cap
CMP
Target
Upside
Company
Sector
Rating
(` Cr)
(`)
(`)
(%)
Aurobindo
Pharma
40,539
Buy
694
872
25.6
Axis Bank
Financials
1,17,467
Buy
494
701
41.9
ICICI Bank
Financials
1,58,478
Buy
273
370
35.6
Infosys
IT
2,53,008
Buy
1,102
1,306
18.6
Capital
Inox Wind
8,344
Buy
376
505
34.3
Goods
LIC HFL
Financials
22,268
Buy
441
570
29.2
Power Grid
Power
68,560
Buy
131
170
29.7
TCS
IT
4,99,701
Buy
2,551
3,168
24.2
Tech Mahindra IT
52,257
Buy
543
646
18.9
Yes Bank
Financials
31,748
Buy
758
953
25.7
Sun Pharma
Pharma
2,13,535 Accumulate
887
950
7.1
Source: Angel Research, Bloomberg
Mid Cap
Market Cap (`
CMP
Target
Upside
Company
Sector
Rating
Cr)
(`)
(`)
(%)
Bajaj Electricals
Others
2,522
Buy
250
341
36.4
Garware Wall RopesOthers
633 Buy
289
390
34.9
MBL Infrastructures Construction
1,036
Buy
250
360
44.1
Minda Industries
Auto Ancillary
797 Buy
501
652
30.1
MT Educare
Others
502 Buy
126
169
34.0
Radico Khaitan
Others
1,119
Buy
84
112
33.2
Surya Roshni
Others
522 Buy
119
183
53.5
Tree House
Others
1,543
Buy
365
449
23.1
Source: Angel Research, Bloomberg
Market Outlook
September 18, 2015
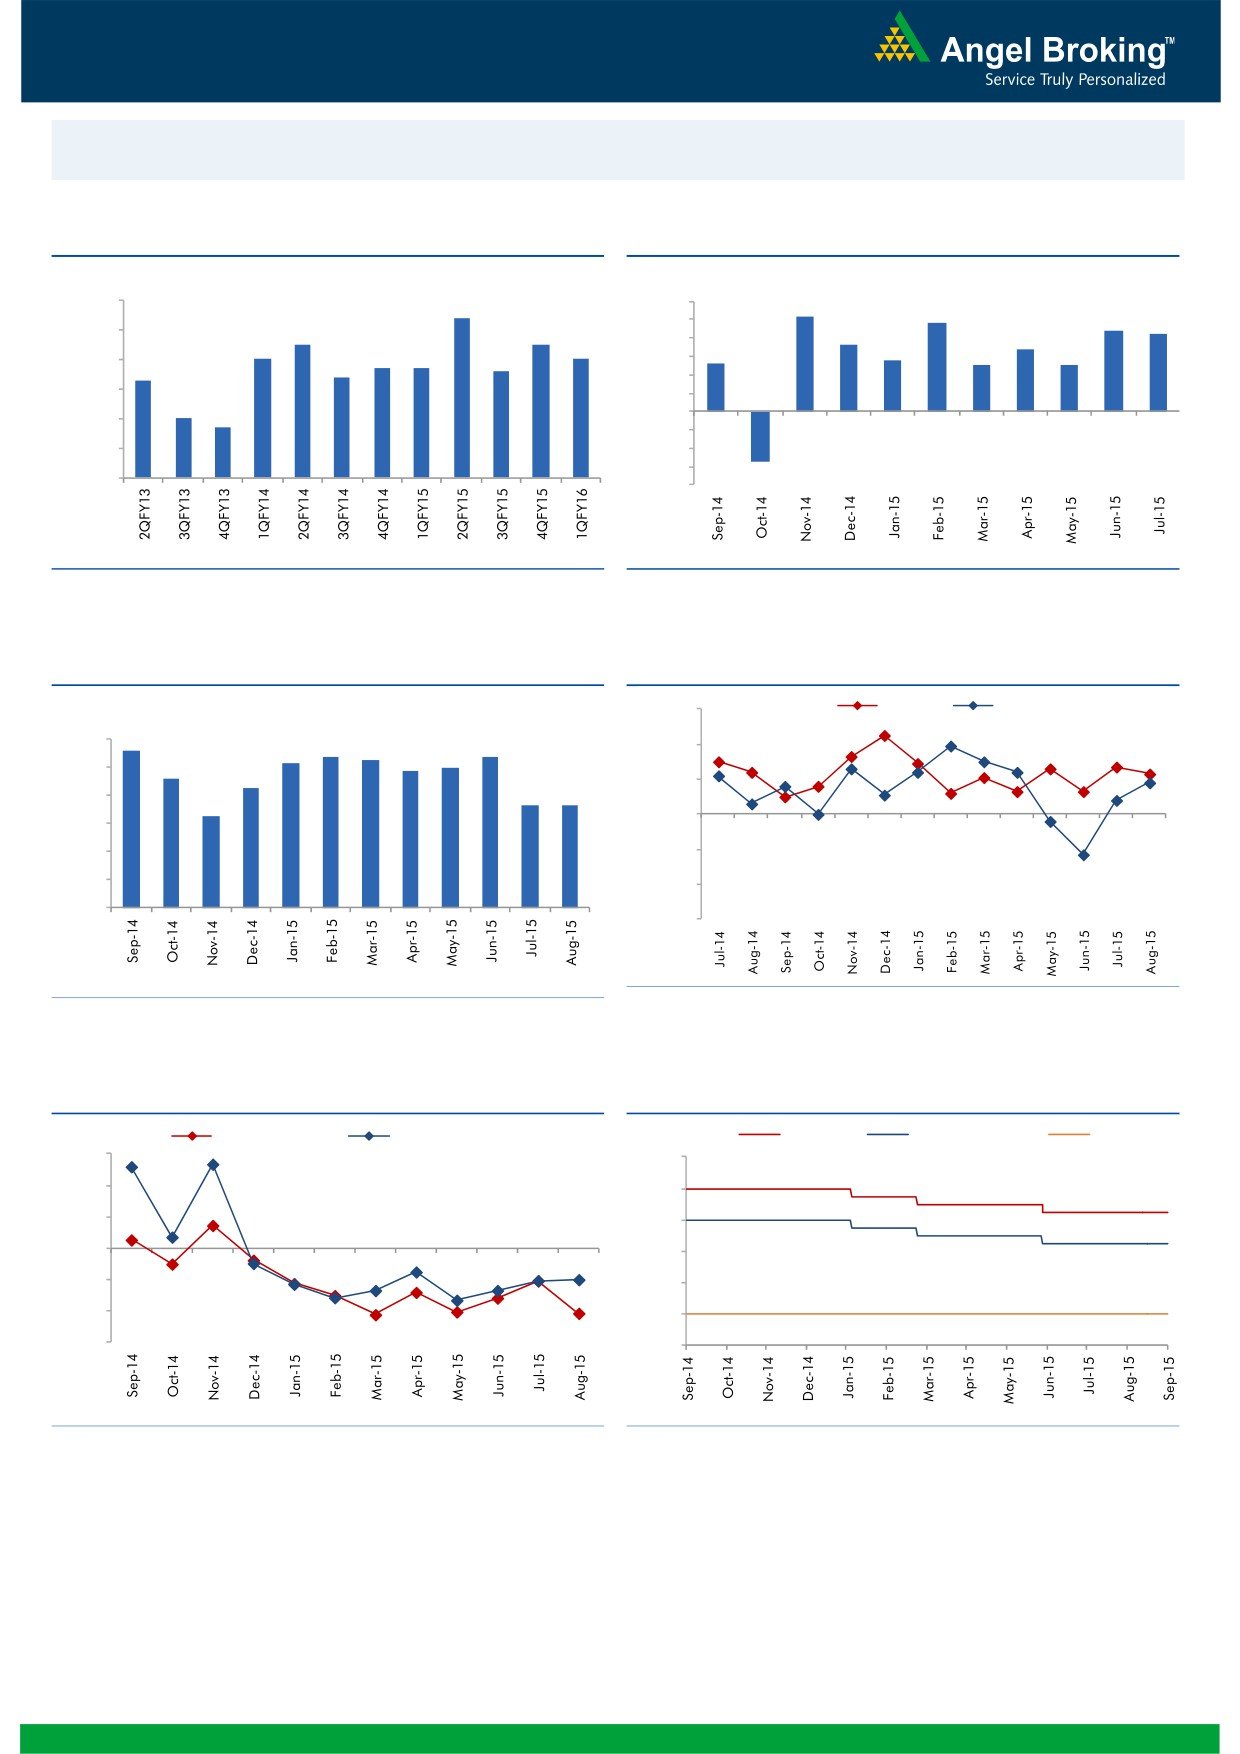
Macro watch
Exhibit 1: Quarterly GDP trends
Exhibit 2: IIP trends
(%)
(%)
9.0
8.4
6.0
5.2
4.8
4.4
4.2
5.0
8.0
7.5
7.5
3.6
3.4
7.0
7.0
4.0
2.6
2.8
2.5
2.5
6.7
6.7
6.6
3.0
7.0
6.3
6.4
2.0
6.0
1.0
5.0
4.7
-
5.0
(1.0)
4.0
(2.0)
(3.0)
3.0
(2.7)
(4.0)
Source: CSO, Angel Research
Source: MOSPI, Angel Research
Exhibit 3: Monthly CPI inflation trends
Exhibit 4: Manufacturing and services PMI
(%)
56.0
Mfg. PMI
Services PMI
5.6
6.0
5.4
5.3
5.4
54.0
5.2
5.0
4.9
4.6
5.0
4.3
52.0
3.7
3.7
4.0
3.3
50.0
3.0
2.0
48.0
1.0
46.0
-
44.0
Source: Market, Angel Research; Note: Level above 50 indicates expansion
Source: MOSPI, Angel Research
Exhibit 5: Exports and imports growth trends
Exhibit 6: Key policy rates
(%)
Exports yoy growth
Imports yoy growth
(%)
Repo rate
Reverse Repo rate
CRR
30.0
9.00
20.0
8.00
10.0
7.00
0.0
6.00
(10.0)
5.00
(20.0)
4.00
(30.0)
3.00
Source: Bloomberg, Angel Research
Source: RBI, Angel Research
Market Outlook
September 18, 2015
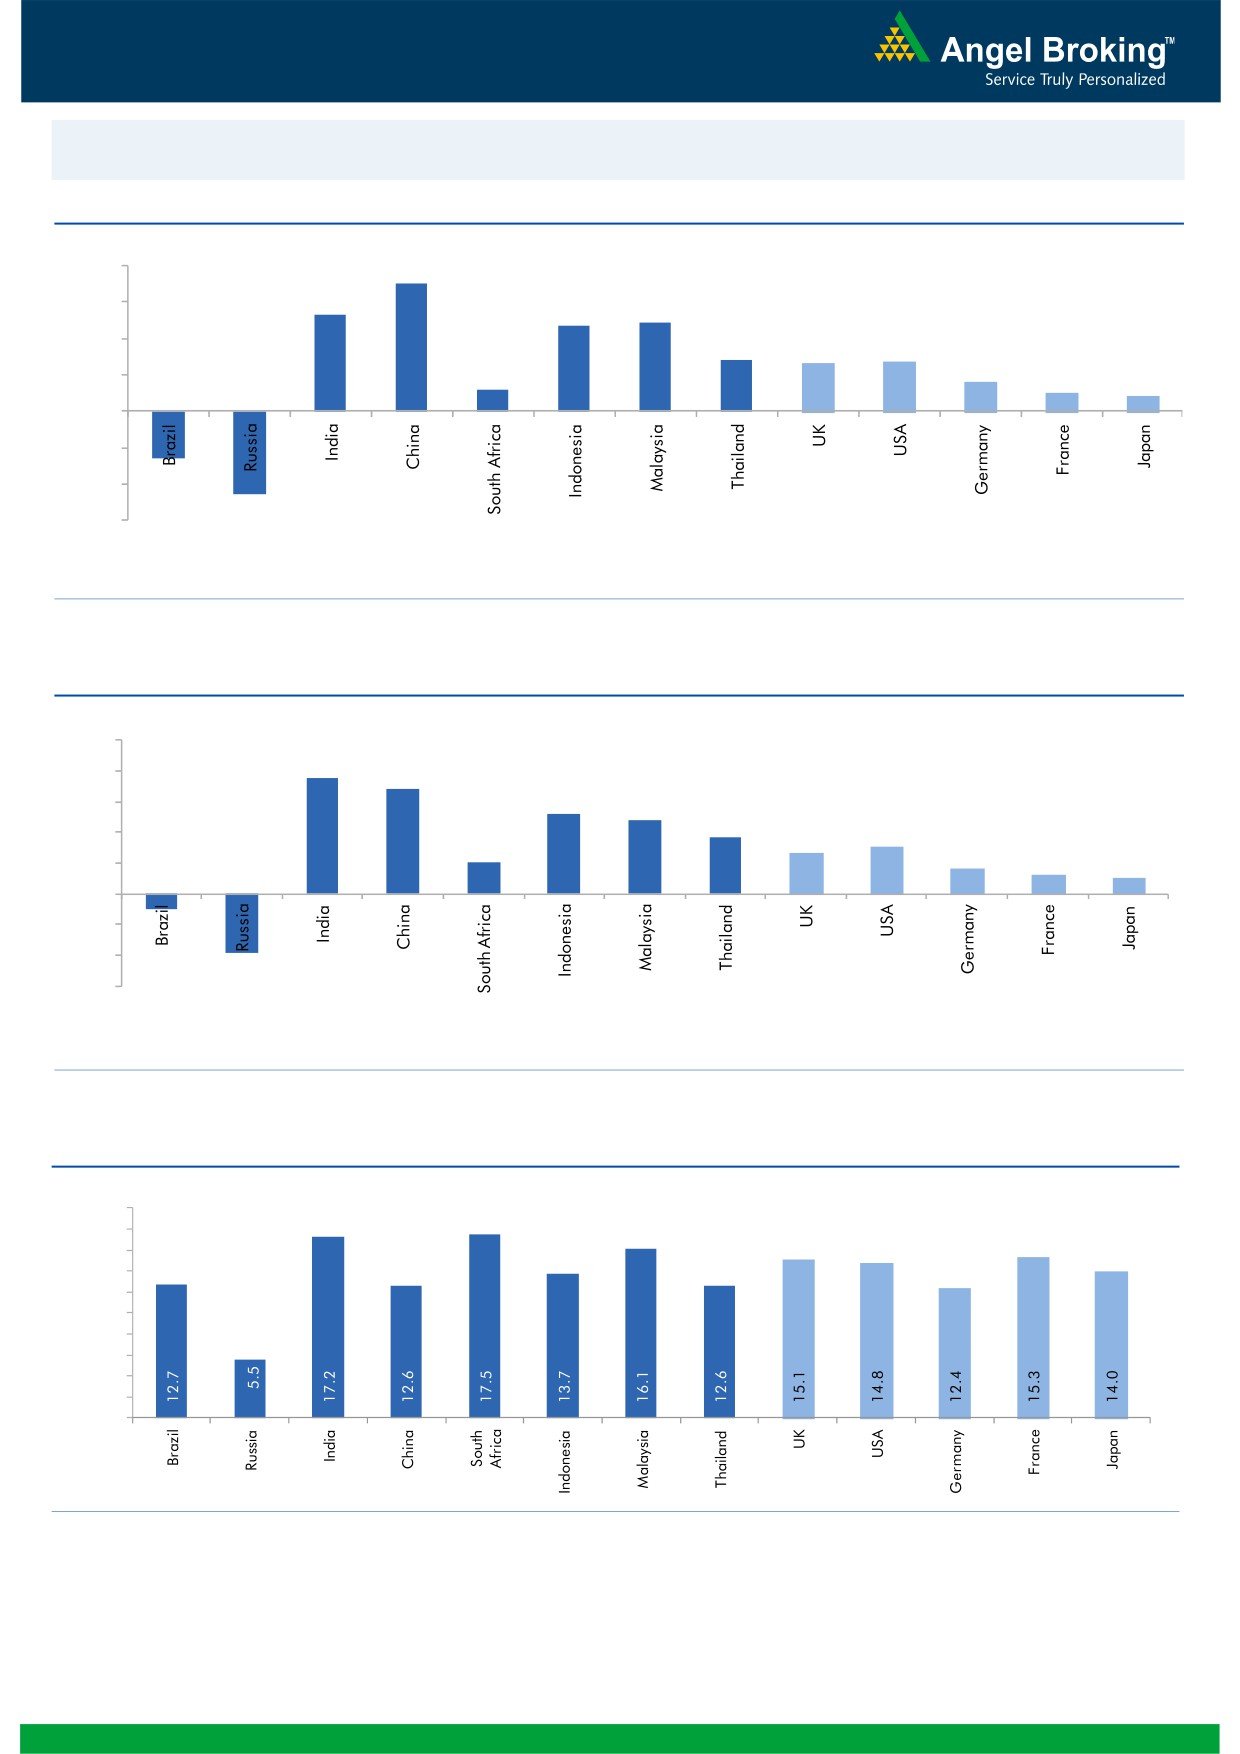
Global watch
Exhibit 1: Latest quarterly GDP Growth (%, yoy) across select developing and developed countries
(%)
8.0
7.0
5.3
6.0
4.9
4.7
4.0
2.8
2.6
2.7
1.6
2.0
1.2
1.0
0.8
(4.6)
(2.6)
-
(2.0)
(4.0)
(6.0)
Source: Bloomberg, Angel Research
Exhibit 2: 2015 GDP Growth projection by IMF (%, yoy) across select developing and developed countries
(%)
10.0
7.5
8.0
6.8
5.2
6.0
4.8
3.7
3.1
4.0
2.7
2.0
1.6
1.2
2.0
1.0
(3.8)
(1.0)
-
(2.0)
(4.0)
(6.0)
Source: IMF, Angel Research
Exhibit 3: One year forward P-E ratio across select developing and developed countries
(x)
20.0
18.0
16.0
14.0
12.0
10.0
8.0
6.0
4.0
2.0
-
Source: Bloomberg, Angel Research
Market Outlook
September 18, 2015
Exhibit 4: Relative performance of indices across globe
Returns (%)
Country
Name of index
Closing price
1M
3M
1YR
Brazil
Bovespa
48,551
2.8
(8.8)
(14.7)
Russia
Micex
1,729
2.2
4.0
17.1
India
Nifty
7,899
(6.8)
(3.4)
(2.4)
China
Shanghai Composite
3,086
(22.4)
(37.6)
33.3
South Africa
Top 40
46,138
1.5
(0.2)
0.6
Mexico
Mexbol
43,791
(0.4)
(2.9)
(4.9)
Indonesia
LQ45
741
(2.7)
(12.4)
(14.7)
Malaysia
KLCI
1,682
5.3
(2.4)
(9.9)
Thailand
SET 50
905
1.1
(8.4)
(14.6)
USA
Dow Jones
16,675
(5.0)
(7.0)
(3.4)
UK
FTSE
6,187
(5.5)
(7.8)
(9.5)
Japan
Nikkei
18,432
(10.3)
(7.8)
17.0
Germany
DAX
10,230
(6.3)
(7.3)
5.9
France
CAC
4,655
(6.4)
(3.3)
6.8
Source: Bloomberg, Angel Research
Market Outlook
September 18, 2015
Stock Watch
Company Name
Reco
CMP
Target
Mkt Cap
Sales ( Čcr )
OPM(%)
EPS (Č)
PER(x)
P/BV(x)
RoE(%)
EV/Sales(x)
(Č)
Price ( Č)
( Č cr )
FY16E FY17E
FY16E
FY17E
FY16E
FY17E
FY16E
FY17E
FY16E
FY17E
FY16E
FY17E
FY16E
FY17E
Agri / Agri Chemical
Rallis
Neutral
218
-
4,237
2,075
2,394
14.4
14.4
9.5
11.0
22.9
19.8
4.6
3.9
21.1
21.3
2.1
1.8
United Phosphorus
Accumulate
478
510
20,477
13,698
15,752
17.6
17.6
32.1
38.5
14.9
12.4
2.9
2.4
21.4
21.3
1.6
1.3
Auto & Auto Ancillary
Ashok Leyland
Accumulate
87
97
24,802
18,186
21,529
10.8
11.2
3.3
4.5
26.4
19.4
4.5
4.2
17.3
21.6
1.3
1.1
Bajaj Auto
Neutral
2,346
-
67,875
23,544
27,245
19.8
19.8
127.0
143.4
18.5
16.4
5.6
4.8
30.3
29.4
2.4
2.1
Eicher Motors
Buy
17,937
22,859
48,685
11,681
15,550
15.3
16.9
358.5
564.3
50.0
31.8
15.0
11.2
29.8
34.9
4.1
3.0
Hero Motocorp
Accumulate
2,363
2,672
47,186
28,500
32,764
14.1
14.3
146.9
167.0
16.1
14.2
6.1
5.2
37.8
36.5
1.5
1.3
L G Balakrishnan & Bros Neutral
445
-
698
1,254
1,394
11.6
11.8
35.9
41.7
12.4
10.7
1.7
1.5
13.5
13.8
0.7
0.6
Mahindra and Mahindra Buy
1,166
1,383
72,395
38,337
43,069
13.0
13.4
52.9
63.5
22.0
18.4
3.3
2.9
15.0
15.9
1.5
1.3
Maruti
Accumulate
4,356
4,735
131,597
58,102
68,587
16.7
16.9
182.0
225.5
23.9
19.3
4.8
4.1
19.9
21.0
2.0
1.7
Minda Industries
Buy
501
652
795
2,567
2,965
7.3
8.0
38.8
54.3
12.9
9.2
1.9
1.6
14.4
16.8
0.4
0.3
Rane Brake Lining
Buy
278
366
220
454
511
11.1
11.4
23.8
28.1
11.7
9.9
1.7
1.5
14.2
15.3
0.6
0.6
Setco Automotive
Neutral
226
-
603
594
741
12.7
13.7
8.4
15.8
26.9
14.3
2.8
2.4
10.4
16.9
1.5
1.2
Tata Motors
Buy
338
391
97,559
264,038
297,882
13.8
13.9
34.5
38.9
9.8
8.7
1.7
1.4
17.6
16.8
0.5
0.5
TVS Motor
Neutral
233
-
11,048
11,702
13,713
6.8
7.7
10.1
14.5
23.0
16.0
5.6
4.6
24.5
28.3
0.9
0.8
Amara Raja Batteries
Neutral
957
-
16,345
5,101
6,224
17.8
17.6
31.1
39.2
30.8
24.4
7.6
6.1
24.8
24.8
3.2
2.5
Exide Industries
Accumulate
149
159
12,640
7,363
8,247
13.7
14.5
6.6
7.7
22.5
19.3
2.8
2.6
12.6
13.3
1.5
1.3
Apollo Tyres
Neutral
185
-
9,392
12,576
12,978
16.8
16.1
22.3
19.9
8.3
9.3
1.4
1.2
17.2
13.4
0.8
0.9
Ceat
Neutral
1,192
-
4,820
6,041
6,597
14.3
14.2
101.5
116.6
11.7
10.2
2.3
2.0
20.0
19.1
0.9
0.8
JK Tyres
Neutral
101
-
2,283
7,446
7,669
15.2
14.0
19.6
18.4
5.1
5.5
1.3
1.1
25.2
19.5
0.7
0.6
Swaraj Engines
Neutral
872
-
1,083
593
677
14.5
14.8
51.2
60.8
17.0
14.3
4.0
3.6
23.3
24.8
1.7
1.4
Subros
Neutral
77
-
460
1,268
1,488
11.6
11.9
3.7
6.6
20.7
11.6
1.4
1.3
6.8
11.4
0.7
0.6
Indag Rubber
Neutral
177
-
464
283
329
17.0
17.2
13.0
15.4
13.6
11.5
3.0
2.5
21.8
21.6
1.4
1.1
Capital Goods
ACE
Neutral
39
-
385
660
839
4.7
8.2
1.0
3.9
39.0
10.0
1.2
1.1
3.2
11.3
0.7
0.6
BEML
Neutral
1,148
-
4,780
3,277
4,006
6.0
8.9
29.2
64.3
39.3
17.9
2.2
2.0
5.7
11.7
1.5
1.2
BGR Energy
Neutral
106
-
763
3,615
3,181
9.5
9.4
16.7
12.4
6.3
8.5
0.6
0.6
10.0
7.0
0.6
0.8
BHEL
Neutral
210
-
51,473
33,722
35,272
10.8
11.7
10.5
14.2
20.0
14.8
1.5
1.4
7.0
9.0
1.6
1.5
Blue Star
Accumulate
337
387
3,031
3,649
4,209
5.0
5.9
9.2
14.7
36.9
22.9
6.7
6.3
9.1
17.5
0.9
0.8
Crompton Greaves
Buy
177
204
11,078
13,484
14,687
4.9
6.2
4.5
7.1
39.3
24.9
2.8
2.6
7.2
10.8
1.0
0.9
Inox Wind
Buy
376
505
8,344
4,980
5,943
17.0
17.5
26.6
31.6
14.1
11.9
4.2
3.1
35.0
30.0
1.8
1.5
Market Outlook
September 18, 2015
Stock Watch
Company Name
Reco
CMP
Target
Mkt Cap
Sales ( Čcr )
OPM(%)
EPS (Č)
PER(x)
P/BV(x)
RoE(%)
EV/Sales(x)
(Č)
Price ( Č)
( Č cr )
FY16E
FY17E
FY16E
FY17E
FY16E
FY17E
FY16E
FY17E
FY16E
FY17E
FY16E
FY17E
FY16E
FY17E
Capital Goods
KEC International
Neutral
144
-
3,710
8,791
9,716
6.1
6.8
5.4
8.2
26.7
17.6
2.7
2.5
10.0
14.0
0.6
0.6
Thermax
Neutral
924
-
11,005
6,413
7,525
7.4
8.5
30.5
39.3
30.3
23.5
4.7
4.1
15.0
17.0
1.7
1.4
Cement
ACC
Accumulate
1,377
1,548
25,850
11,856
14,092
14.5
17.8
47.6
76.1
28.9
18.1
3.0
2.7
10.6
15.7
2.0
1.7
Ambuja Cements
Accumulate
210
233
32,613
10,569
12,022
20.7
22.2
8.7
10.7
24.2
19.6
3.1
2.9
13.0
15.2
2.7
2.4
India Cements
Buy
72
112
2,213
4,716
5,133
15.9
16.9
3.7
7.5
19.5
9.6
0.7
0.7
3.8
7.3
0.8
0.7
JK Cement
Buy
623
767
4,356
4,056
4,748
14.5
17.0
22.6
41.1
27.6
15.2
2.5
2.2
9.3
15.3
1.5
1.3
J K Lakshmi Cement
Buy
371
430
4,361
2,947
3,616
16.7
19.9
11.5
27.2
32.2
13.6
3.1
2.6
9.8
20.8
1.9
1.5
Mangalam Cements
Neutral
237
-
632
1,053
1,347
10.5
13.3
8.4
26.0
28.2
9.1
1.2
1.1
4.3
12.5
1.0
0.7
Orient Cement
Buy
158
183
3,239
1,854
2,524
21.2
22.2
7.7
11.1
20.5
14.2
3.0
2.5
13.3
15.7
2.5
1.7
Ramco Cements
Accumulate
321
350
7,639
4,036
4,545
20.8
21.3
15.1
18.8
21.3
17.1
2.6
2.3
12.9
14.3
2.4
2.1
Shree Cement^
Neutral
11,485
-
40,010
7,150
8,742
26.7
28.6
228.0
345.5
50.4
33.2
7.4
6.2
15.7
20.3
5.3
4.3
UltraTech Cement
Accumulate
2,940
3,282
80,688
27,562
31,548
20.4
22.3
111.9
143.3
26.3
20.5
3.7
3.2
15.2
16.8
3.0
2.6
Construction
ITNL
Neutral
98
-
2,413
7,360
8,825
34.0
35.9
1.0
5.0
97.8
19.6
0.4
0.4
0.3
1.4
3.8
3.7
KNR Constructions
Neutral
519
-
1,459
915
1,479
14.3
13.9
20.3
37.2
25.6
13.9
2.4
2.0
9.6
15.6
1.7
1.1
Larsen & Toubro
Buy
1,548
2,013
144,053
68,920
82,446
10.9
11.5
57.0
73.0
27.2
21.2
2.5
2.3
13.6
15.5
2.3
1.9
Gujarat Pipavav Port
Neutral
172
-
8,310
721
784
53.1
53.6
8.2
9.1
20.9
18.9
3.4
2.7
20.0
18.3
11.1
9.8
MBL Infrastructures
Buy
250
360
1,036
2,313
2,797
12.2
14.6
19.0
20.0
13.2
12.5
1.4
1.3
11.3
10.6
1.2
1.0
Nagarjuna Const.
Neutral
64
-
3,550
7,892
8,842
8.3
9.1
2.4
5.3
26.6
12.1
1.1
1.0
4.2
8.6
0.7
0.6
PNC Infratech
Neutral
460
-
2,362
1,798
2,132
13.2
13.5
22.0
30.0
20.9
15.3
1.9
1.7
11.5
11.4
1.4
1.2
Simplex Infra
Neutral
279
-
1,382
6,241
7,008
10.4
10.7
20.0
36.0
14.0
7.8
1.1
1.0
6.8
11.1
0.7
0.6
Financials
Allahabad Bank
Neutral
76
-
4,317
8,438
9,521
2.8
2.8
21.9
27.0
3.5
2.8
0.4
0.3
10.2
11.5
-
-
Axis Bank
Buy
494
701
117,467
26,941
32,298
3.5
3.6
37.4
46.4
13.2
10.7
2.7
2.3
18.7
20.0
-
-
Bank of Baroda
Neutral
183
-
40,371
19,027
21,737
1.9
2.0
16.9
24.5
10.8
7.5
1.0
0.9
9.1
12.1
-
-
Bank of India
Neutral
139
-
9,212
16,438
18,706
1.9
2.0
19.2
40.9
7.2
3.4
0.4
0.4
4.5
9.1
-
-
Canara Bank
Neutral
267
-
13,763
15,491
17,269
2.0
2.0
61.6
70.9
4.3
3.8
0.5
0.4
10.5
11.1
-
-
Dena Bank
Neutral
39
-
2,194
3,498
3,977
2.1
2.3
7.8
10.7
5.0
3.7
0.4
0.3
6.5
8.4
-
-
Federal Bank
Neutral
60
-
10,370
3,527
4,135
3.0
3.1
5.2
6.7
11.6
9.0
1.2
1.1
10.8
12.7
-
-
HDFC
Neutral
1,196
-
188,598
10,883
12,799
3.5
3.4
43.0
50.6
27.9
23.6
5.5
5.0
25.9
26.7
-
-
HDFC Bank
Buy
1,024
1,255
257,847
38,059
46,851
4.4
4.5
50.0
62.7
20.5
16.3
3.6
3.1
18.8
20.2
-
-
Market Outlook
September 18, 2015
Stock Watch
Company Name
Reco
CMP
Target
Mkt Cap
Sales ( Čcr )
OPM(%)
EPS (Č)
PER(x)
P/BV(x)
RoE(%)
EV/Sales(x)
(Č)
Price ( Č)
( Č cr )
FY16E
FY17E
FY16E
FY17E
FY16E
FY17E
FY16E
FY17E
FY16E
FY17E
FY16E
FY17E
FY16E
FY17E
Financials
ICICI Bank
Buy
273
370
158,478
35,810
41,871
3.4
3.5
22.0
26.2
12.4
10.4
2.2
1.8
15.0
15.6
-
-
IDBI Bank
Neutral
57
-
9,127
9,860
10,978
1.8
1.9
9.3
15.6
6.1
3.7
0.4
0.4
6.4
10.1
-
-
Indian Bank
Neutral
125
-
6,011
6,267
7,171
2.4
2.5
25.4
32.1
4.9
3.9
0.4
0.4
8.0
9.3
-
-
LIC Housing Finance
Buy
441
570
22,268
2,934
3,511
2.3
2.3
30.9
36.8
14.3
12.0
2.3
2.0
16.8
17.5
-
-
Oriental Bank
Neutral
129
-
3,874
7,730
8,595
2.4
2.5
38.8
47.4
3.3
2.7
0.3
0.3
8.6
9.8
-
-
Punjab Natl.Bank
Neutral
136
-
25,287
23,446
26,624
2.8
2.9
17.8
27.5
7.7
5.0
0.8
0.6
8.5
12.1
-
-
South Ind.Bank
Neutral
20
-
2,721
1,930
2,215
2.4
2.4
2.6
3.6
7.8
5.6
0.8
0.7
9.9
12.5
-
-
St Bk of India
Buy
237
307
179,055
83,847
96,307
2.8
2.8
20.1
25.1
11.8
9.4
1.3
1.1
11.5
13.1
-
-
Union Bank
Neutral
171
-
10,897
12,755
14,439
2.3
2.4
31.5
39.9
5.5
4.3
0.6
0.5
9.9
11.6
-
-
Vijaya Bank
Neutral
36
-
3,058
3,594
3,969
1.8
1.9
5.8
7.1
6.1
5.0
0.5
0.5
8.2
9.3
-
-
Yes Bank
Buy
758
953
31,748
7,204
9,078
3.2
3.2
57.8
69.5
13.1
10.9
2.3
2.0
19.6
22.6
-
-
FMCG
Asian Paints
Neutral
825
-
79,105
16,553
19,160
16.0
16.2
17.7
21.5
46.7
38.4
12.4
11.1
29.4
31.2
4.6
4.0
Britannia
Neutral
3,011
-
36,128
8,065
9,395
9.6
10.2
47.2
65.5
63.8
46.0
21.2
20.0
38.3
41.2
4.3
3.7
Colgate
Neutral
1,981
-
26,944
4,836
5,490
19.5
19.7
48.5
53.2
40.9
37.2
29.9
26.1
99.8
97.5
5.5
4.8
Dabur India
Neutral
274
-
48,119
9,370
10,265
17.1
17.2
7.3
8.1
37.3
33.8
11.3
9.2
33.7
30.6
5.0
4.6
GlaxoSmith Con*
Neutral
6,114
-
25,712
4,919
5,742
17.2
17.4
168.3
191.2
36.3
32.0
10.3
8.8
28.8
28.9
4.8
4.1
Godrej Consumer
Neutral
1,234
-
42,017
10,168
12,886
16.1
16.1
32.1
38.4
38.5
32.1
7.8
7.2
19.7
21.0
4.2
3.3
HUL
Neutral
807
-
174,536
34,940
38,957
17.5
17.7
20.8
24.7
38.8
32.7
43.1
34.5
110.5
114.2
4.8
4.3
ITC
Buy
321
409
257,792
41,068
45,068
37.8
37.4
13.9
15.9
23.1
20.2
7.7
6.8
34.1
33.8
5.9
5.3
Marico
Neutral
406
-
26,165
6,551
7,766
15.7
16.0
10.4
12.5
39.1
32.5
11.3
9.4
33.2
32.4
3.9
3.3
Nestle*
Accumulate
6,090
6,646
58,716
11,291
12,847
22.2
22.3
158.9
184.6
38.3
33.0
20.0
18.0
55.0
57.3
5.0
4.4
Tata Global
Buy
123
152
7,763
8,635
9,072
9.8
9.9
6.5
7.6
18.9
16.2
1.9
1.8
6.8
7.4
0.8
0.8
IT
HCL Tech^
Buy
938
1,132
131,966
42,038
47,503
23.5
23.5
56.4
62.9
16.6
14.9
3.9
3.0
23.2
19.8
2.7
2.2
Infosys
Buy
1,102
1,306
253,008
60,250
66,999
28.0
28.0
58.3
63.7
18.9
17.3
4.0
3.4
20.9
19.7
3.5
3.0
TCS
Buy
2,551
3,168
499,701
108,420
123,559
28.8
28.7
127.2
143.9
20.1
17.7
8.0
7.4
39.9
41.8
4.2
3.6
Tech Mahindra
Buy
543
646
52,257
25,566
28,890
16.0
17.0
26.3
31.9
20.7
17.0
3.7
3.2
17.9
18.6
1.8
1.5
Wipro
Buy
579
719
143,011
52,414
58,704
23.7
23.8
38.4
42.3
15.1
13.7
2.9
2.6
19.5
18.0
2.3
1.9
Media
D B Corp
Accumulate
316
356
5,799
2,241
2,495
27.8
27.9
21.8
25.6
14.5
12.3
3.8
3.3
26.7
28.5
2.5
2.3
HT Media
Neutral
84
-
1,949
2,495
2,603
11.2
11.2
7.3
8.6
11.5
9.7
0.9
0.8
7.4
8.1
0.3
0.3
Market Outlook
September 18, 2015
Stock Watch
Company Name
Reco
CMP
Target
Mkt Cap
Sales ( Čcr )
OPM(%)
EPS (Č)
PER(x)
P/BV(x)
RoE(%)
EV/Sales(x)
(Č)
Price ( Č)
( Č cr )
FY16E FY17E
FY16E
FY17E
FY16E
FY17E
FY16E
FY17E
FY16E
FY17E
FY16E
FY17E
FY16E
FY17E
Media
Jagran Prakashan
Buy
132
156
4,299
1,939
2,122
26.0
26.0
8.3
9.2
15.8
14.3
2.7
2.4
17.5
17.1
2.2
2.0
Sun TV Network
Neutral
344
-
13,545
2,779
3,196
70.2
70.5
22.8
27.3
15.1
12.6
3.7
3.4
26.7
28.3
4.6
4.0
Hindustan Media
Buy
216
292
1,589
920
1,031
20.0
20.0
19.2
20.9
11.3
10.4
1.9
1.6
16.4
15.3
1.3
1.1
Ventures
Metals & Mining
Coal India
Buy
337
400
212,988
72,015
78,415
21.2
21.5
21.7
25.3
15.5
13.4
5.3
5.2
33.1
39.1
2.2
2.0
Hind. Zinc
Neutral
133
-
56,260
15,258
16,495
44.2
45.6
17.6
19.2
7.6
7.0
1.2
1.0
15.9
15.3
1.4
0.9
Hindalco
Neutral
77
-
15,962
104,356
111,186
8.7
9.5
6.7
11.1
11.5
7.0
0.4
0.4
3.5
5.9
0.7
0.6
JSW Steel
Neutral
950
-
22,962
48,125
53,595
18.8
21.0
46.9
97.5
20.3
9.7
1.0
0.9
4.4
9.5
1.3
1.1
NMDC
Neutral
100
-
39,786
8,237
10,893
46.6
44.5
10.0
11.7
10.1
8.6
1.1
1.0
12.5
13.0
4.6
3.5
SAIL
Neutral
52
-
21,394
45,915
53,954
7.2
10.5
1.5
4.4
34.4
11.8
0.5
0.5
2.3
4.1
1.1
1.0
Vedanta
Neutral
99
-
29,321
71,445
81,910
26.2
26.3
12.9
19.2
7.7
5.2
0.5
0.5
7.2
8.9
0.9
0.7
Tata Steel
Neutral
230
-
22,357
136,805
149,228
11.3
11.9
26.4
36.8
8.7
6.3
0.7
0.6
6.0
8.0
0.7
0.6
Oil & Gas
Cairn India
Neutral
144
-
27,073
11,323
12,490
49.4
51.0
20.7
20.7
7.0
7.0
0.5
0.4
6.4
6.1
1.5
0.8
GAIL
Neutral
293
-
37,128
64,856
70,933
9.1
9.6
24.0
28.9
12.2
10.1
1.0
1.0
8.8
9.6
0.8
0.7
ONGC
Neutral
231
-
197,247
154,564
167,321
36.8
37.4
28.6
32.5
8.1
7.1
1.0
0.9
12.7
13.5
1.5
1.4
Petronet LNG
Buy
173
210
12,979
39,007
40,785
3.8
4.2
9.2
11.0
18.9
15.8
2.1
1.9
11.6
12.7
0.4
0.4
Indian Oil Corp
Buy
395
455
95,916
359,607
402,760
5.9
6.1
42.5
48.7
9.3
8.1
1.2
1.1
14.1
14.4
0.4
0.3
Reliance Industries
Accumulate
872
930
282,423
313,085
362,904
13.1
13.8
78.4
92.9
11.1
9.4
1.2
1.1
10.8
11.6
1.4
1.2
Pharmaceuticals
Alembic Pharma
Neutral
653
-
12,306
2,601
3,115
21.2
20.2
20.8
23.9
31.4
27.3
10.1
7.6
37.2
31.8
4.8
3.9
Aurobindo Pharma
Buy
694
872
40,539
14,923
17,162
23.0
23.0
38.2
43.6
18.2
15.9
5.6
4.2
36.0
30.2
3.1
2.6
Aventis*
Neutral
4,004
-
9,222
2,156
2,455
15.1
16.8
109.7
133.9
36.5
29.9
5.0
4.1
18.4
22.5
4.0
3.3
Cadila Healthcare
Neutral
1,912
-
39,152
10,224
11,840
20.0
21.0
71.0
85.6
26.9
22.3
7.2
5.7
30.1
28.5
3.9
3.3
Cipla
Neutral
661
-
53,057
14,359
16,884
21.3
19.7
28.4
30.5
23.3
21.7
4.1
3.5
19.3
17.5
3.7
3.1
Dr Reddy's
Neutral
4,006
-
68,309
17,903
20,842
22.7
22.8
160.5
189.5
25.0
21.1
5.1
4.2
22.2
21.7
3.8
3.2
Dishman Pharma
Buy
247
290
1,993
1,716
1,888
20.2
20.2
16.3
21.6
15.2
11.4
1.4
1.3
9.7
11.7
1.3
1.1
GSK Pharma*
Neutral
3,307
-
28,015
2,870
3,158
20.0
22.1
59.5
68.3
55.6
48.4
16.4
16.9
28.5
34.3
9.3
8.5
Indoco Remedies
Neutral
337
-
3,103
1,088
1,262
18.2
18.2
13.1
15.5
25.7
21.7
5.0
4.2
21.2
21.1
2.9
2.5
Ipca labs
Accumulate
741
800
9,347
3,507
4,078
17.6
18.6
25.8
32.0
28.7
23.2
3.7
3.2
13.8
14.9
2.9
2.5
Lupin
Neutral
1,845
-
83,038
14,864
17,244
26.9
26.9
62.1
71.1
29.7
26.0
7.2
5.7
27.4
24.6
5.3
4.5
Sun Pharma
Accumulate
887
950
213,535
28,163
32,610
25.8
30.7
17.4
26.9
51.0
33.0
4.8
4.2
13.0
16.6
7.1
5.9
Market Outlook
September 18, 2015
Stock Watch
Company Name
Reco
CMP
Target
Mkt Cap
Sales ( Čcr )
OPM(%)
EPS (Č)
PER(x)
P/BV(x)
RoE(%)
EV/Sales(x)
(Č)
Price ( Č)
( Č cr )
FY16E FY17E
FY16E
FY17E
FY16E
FY17E
FY16E
FY17E
FY16E
FY17E
FY16E
FY17E
FY16E
FY17E
Power
Tata Power
Neutral
62
-
16,809
35,923
37,402
22.6
22.8
4.1
5.2
15.3
12.1
1.2
1.1
7.5
9.3
1.4
1.3
NTPC
Buy
128
157
105,377
87,064
98,846
23.5
23.5
11.7
13.2
10.9
9.7
1.2
1.1
11.4
12.1
2.2
2.0
Power Grid
Buy
131
170
68,560
20,702
23,361
86.7
86.4
12.1
13.2
10.9
9.9
1.6
1.4
15.6
15.1
8.2
7.7
Telecom
Bharti Airtel
Neutral
359
-
143,547
101,748
109,191
32.1
31.7
12.0
12.5
29.9
28.7
2.1
1.9
6.9
6.7
2.0
1.9
Idea Cellular
Neutral
146
-
52,695
34,282
36,941
32.0
31.5
5.9
6.2
24.8
23.6
2.3
2.1
9.9
9.3
2.1
2.0
zOthers
Abbott India
Neutral
5,299
-
11,261
2,715
3,153
14.5
14.1
134.3
152.2
39.5
34.8
9.9
8.1
27.4
25.6
3.9
3.3
Bajaj Electricals
Buy
250
341
2,522
4,719
5,287
5.2
5.8
8.6
12.7
29.2
19.8
3.3
2.9
11.4
14.8
0.5
0.5
Finolex Cables
Neutral
232
-
3,544
2,728
3,036
10.8
11.0
14.4
16.8
16.1
13.8
2.4
2.1
15.2
15.3
1.0
0.9
Goodyear India*
Buy
556
655
1,283
1,953
1,766
12.4
12.0
67.4
59.6
8.3
9.3
2.1
1.8
27.7
20.2
0.4
0.4
Hitachi
Neutral
1,341
-
3,646
1,806
2,112
9.0
9.2
28.6
29.1
46.9
46.1
11.7
9.4
28.1
22.6
2.1
1.8
Jyothy Laboratories
Neutral
314
-
5,685
1,620
1,847
11.5
11.5
7.3
8.5
43.1
37.1
5.6
5.2
13.3
14.4
3.4
2.9
MRF
Accumulate
39,862
43,575
16,906
20,727
14,841
19.3
18.6
4,905.8
3,351.9
8.1
11.9
2.6
2.1
37.6
19.6
0.8
1.0
Page Industries
Neutral
12,756
-
14,228
1,929
2,450
19.8
20.1
229.9
299.0
55.5
42.7
24.5
17.0
52.1
47.1
7.4
5.8
Relaxo Footwears
Neutral
534
-
6,413
1,767
2,152
12.3
12.5
19.3
25.1
27.8
21.3
6.8
5.2
27.7
27.8
3.7
3.0
Siyaram Silk Mills
Buy
955
1,221
895
1,653
1,873
11.7
12.2
99.3
122.1
9.6
7.8
1.7
1.5
19.5
20.2
0.7
0.6
Styrolution ABS India*
Neutral
768
-
1,351
1,271
1,440
8.6
9.2
32.0
41.1
24.0
18.7
2.5
2.2
10.7
12.4
1.0
0.9
Tree House
Buy
365
449
1,543
259
324
56.8
56.8
17.0
21.7
21.4
16.8
2.2
1.9
10.1
11.5
5.9
4.9
TVS Srichakra
Buy
2,678
3,210
2,050
2,127
2,388
15.2
14.9
237.7
267.5
11.3
10.0
4.8
3.4
51.7
39.8
1.0
0.9
HSIL
Buy
259
434
1,874
2,085
2,436
18.5
18.6
21.7
28.9
12.0
9.0
1.2
1.1
10.0
12.1
1.0
0.8
Kirloskar Engines India
Neutral
300
-
4,342
2,634
3,252
10.1
12.0
10.9
17.4
27.5
17.2
3.1
2.7
11.4
16.8
1.3
1.0
Ltd
M M Forgings
Buy
526
797
635
563
671
22.1
22.9
51.0
66.5
10.3
7.9
2.2
1.7
23.1
24.1
1.3
1.0
Banco Products (India)
Neutral
117
-
835
1,208
1,353
11.0
12.3
10.8
14.5
10.8
8.1
1.2
1.1
11.9
14.5
0.7
0.6
Competent Automobiles Neutral
141
-
87
1,007
1,114
3.1
3.1
23.7
28.2
6.0
5.0
0.8
0.7
13.9
14.6
0.1
0.1
Nilkamal
Accumulate
885
1,005
1,320
1,948
2,147
10.6
10.3
60.0
67.0
14.7
13.2
2.3
2.0
16.8
16.1
0.7
0.6
Visaka Industries
Buy
129
166
204
1,158
1,272
8.6
9.5
23.7
32.7
5.4
3.9
0.6
0.5
10.1
12.5
0.3
0.3
Transport Corporation of
Buy
235
293
1,790
2,830
3,350
8.8
9.0
14.4
18.3
16.4
12.9
2.5
2.2
15.4
17.1
0.8
0.7
India
Elecon Engineering
Buy
71
87
773
1,452
1,596
14.0
14.7
4.4
6.2
16.1
11.4
1.3
1.2
8.6
11.2
0.8
0.7
Surya Roshni
Buy
119
183
522
2,992
3,223
8.3
8.5
14.7
18.3
8.1
6.5
0.8
0.7
9.8
11.0
0.5
0.4
MT Educare
Buy
126
169
502
286
366
18.3
17.7
7.7
9.4
16.3
13.5
3.4
3.0
20.2
21.1
1.7
1.2
Market Outlook
September 18, 2015
Stock Watch
Company Name
Reco
CMP
Target Mkt Cap
Sales ( Čcr )
OPM(%)
EPS (Č)
PER(x)
P/BV(x)
RoE(%)
EV/Sales(x)
(Č)
Price ( Č)
( Č cr )
FY16E FY17E FY16E FY17E FY16E FY17E FY16E FY17E FY16E FY17E FY16E FY17E FY16E FY17E
zOthers
Radico Khaitan
Buy
84
112
1,119
1,565
1,687
11.9
12.4
5.4
6.6
15.5
12.8
1.2
1.2
8.0
9.0
1.2
1.2
Garware Wall Ropes
Buy
289
390
633
875
983
10.4
10.6
23.1
27.8
12.5
10.4
1.8
1.5
14.1
14.8
0.7
0.6
Wonderla Holidays
Buy
277
322
1,565
206
308
44.0
43.6
9.0
12.9
30.8
21.5
4.2
3.8
13.7
17.8
7.5
5.0
Linc Pen & Plastics
Buy
152
185
225
340
371
8.3
8.9
10.8
13.2
14.1
11.5
2.3
2.0
16.0
17.1
0.7
0.6
The Byke Hospitality
Accumulate
164
181
656
222
287
20.5
20.5
5.6
7.6
29.0
21.6
5.5
4.5
18.9
20.8
3.0
2.3
Source: Company, Angel Research; Note: *December year end; #September year end; &October year end; Price as on September 16, 2015
Market Outlook
September 18, 2015
Research Team Tel: 022 - 39357800
DISCLAIMER
Angel Broking Private Limited (hereinafter referred to as “Angel”) is a registered Member of National Stock Exchange of India Limited,
Bombay Stock Exchange Limited and MCX Stock Exchange Limited. It is also registered as a Depository Participant with CDSL and
Portfolio Manager with SEBI. It also has registration with AMFI as a Mutual Fund Distributor. Angel Broking Private Limited is a registered
entity with SEBI for Research Analyst in terms of SEBI (Research Analyst) Regulations, 2014 vide registration number INH000000164.
Angel or its associates has not been debarred/ suspended by SEBI or any other regulatory authority for accessing /dealing in securities
Market. Angel or its associates including its relatives/analyst do not hold any financial interest/beneficial ownership of more than 1% in
the company covered by Analyst. Angel or its associates/analyst has not received any compensation / managed or co-managed public
offering of securities of the company covered by Analyst during the past twelve months. Angel/analyst has not served as an officer,
director or employee of company covered by Analyst and has not been engaged in market making activity of the company covered by
Analyst.
This document is solely for the personal information of the recipient, and must not be singularly used as the basis of any investment
decision. Nothing in this document should be construed as investment or financial advice. Each recipient of this document should make
such investigations as they deem necessary to arrive at an independent evaluation of an investment in the securities of the companies
referred to in this document (including the merits and risks involved), and should consult their own advisors to determine the merits and
risks of such an investment.
Reports based on technical and derivative analysis center on studying charts of a stock's price movement, outstanding positions and
trading volume, as opposed to focusing on a company's fundamentals and, as such, may not match with a report on a company's
fundamentals.
The information in this document has been printed on the basis of publicly available information, internal data and other reliable sources
believed to be true, but we do not represent that it is accurate or complete and it should not be relied on as such, as this document is for
general guidance only. Angel Broking Pvt. Limited or any of its affiliates/ group companies shall not be in any way responsible for any
loss or damage that may arise to any person from any inadvertent error in the information contained in this report. Angel Broking Pvt.
Limited has not independently verified all the information contained within this document. Accordingly, we cannot testify, nor make any
representation or warranty, express or implied, to the accuracy, contents or data contained within this document. While Angel Broking
Pvt. Limited endeavors to update on a reasonable basis the information discussed in this material, there may be regulatory, compliance,
or other reasons that prevent us from doing so.
This document is being supplied to you solely for your information, and its contents, information or data may not be reproduced,
redistributed or passed on, directly or indirectly.
Neither Angel Broking Pvt. Limited, nor its directors, employees or affiliates shall be liable for any loss or damage that may arise from or
in connection with the use of this information.
Note: Please refer to the important ‘Stock Holding Disclosure' report on the Angel website (Research Section). Also, please refer to the
latest update on respective stocks for the disclosure status in respect of those stocks. Angel Broking Pvt. Limited and its affiliates may have
investment positions in the stocks recommended in this report.