Market Outlook
April 18, 2016
Domestic Indices
Chg (%)
(Pts)
(Close)
Market Cues
BSE Sensex
1.9
481
25,627
Indian markets are expected to open on a positive note tracking SGX Nifty.
Nifty
1.8
142
7,850
US stocks closed lower on Friday, with energy stocks leading declines as oil prices
Mid Cap
0.9
99
10,916
fell ahead of highly anticipated weekend meeting of oil producers. Energy closed
Small Cap
1.1
115
10,943
1.3% lower to lead S&P 500 decliners, followed by Information Technology.
Bankex
2.6
462
18,542
Notably, Apple was down 2% following report than they would continue reduced
production of the device from Apr-Jun in light of sluggish sales.
Global Indices
Chg (%)
(Pts)
(Close)
FTSE 100 turned negative as investors booked profits at the end of a bullish week
Dow Jones
(0.2)
(29)
17,897
and shifted their attention towards Sunday’s Oil output meeting scheduled in Doha.
Even though FTSE ended in red, it recorded its biggest weekly gain in 7 weeks, after
Nasdaq
(0.2)
(8)
4,938
the Chinese export data whetted traders risk appetite and catapulted London’s
FTSE
(0.3)
(21)
6,344
benchmark index to a fresh 2016 high on Wednesday.
Nikkei
(0.4)
(63)
16,848
Indian markets rose more than 2% on Wednesday (Indian markets remain closed on
Hang Seng
(0.1)
(21)
21,316
Thursday-Friday for holidays) to their highest level in more than 3 months, on
Shanghai Com
(0.1)
(4)
3,078
account of ease in inflation, forecasts of above average monsoon rains, sparking
hopes of better economic growth and more rate cuts by the central bank.
Advances / Declines
BSE
NSE
News & Result Analysis
Advances
1,604
1,029
Vedanta to develop Mormugao Port
Declines
1,103
524
Railways withdraw the levy of Port Congestion Surcharge
Unchanged
147
86
Result Preview: TCS
Detailed analysis on Pg2
Volumes (` Cr)
Investor’s Ready Reckoner
BSE
2,645
Key Domestic & Global Indicators
NSE
19,279
Stock Watch: Latest investment recommendations on 150+ stocks
Refer Pg5 onwards
Net Inflows (` Cr)
Net
Mtd
Ytd
FII
428
(489)
(13,135)
Top Picks
CMP
Target
Upside
MFs
(63)
(414)
61,145
Company
Sector
Rating
(`)
(`)
(%)
Amara Raja
Auto & Auto Ancillary
Buy
900
1,040
15.5
Top Gainers
Price (`)
Chg (%)
HCL Tech
IT
Buy
838
1,038
23.9
M&M
1,333
7.4
LIC Housing
Financials
Buy
481
592
23.1
Tatachem
402
7.1
Bharat Electronics
Capital Goods
Buy
1,194
1,414
18.4
Coromandel
220
5.6
Navkar Corporation Others
Buy
188
265
40.7
More Top Picks on Pg4
Dhfl
203
5.5
Piind
646
5.5
Key Upcoming Events
Previous
Consensus
Date
Region
Event Description
Reading
Expectations
Top Losers
Price (`)
Chg (%)
Apr 19 US
Buildings Permit (Mar)
1.177M
1.200M
Jpinfratec
8
(2.7)
Apr 20 US
Existing Home Sales (Mar)
5.08M
5.29M
Marico
251
(2.5)
Apr 20 US
Crude Oil Inventories
6.634M
-
Sanofi
4,293
(2.0)
Apr 21 GBP
Retail Sales (MoM) (Mar)
-0.4%
-0.2%
Sunasian
21
(1.9)
Cyient
453
(1.9)
As on April 13, 2016
Market Outlook
April 18, 2016
Vedanta to develop Mormugao Port
Vedanta Ltd has received ‘Letter of Award’ for development of 2 berths and barge
berths at Port of Mormugao, Goa, on ‘design, build, finance, operate and transfer’
basis.
Re-development of the berths at Mormugao Port with capacity of 19.22 mtpa are
planned to handle all type of cargo including iron ore, coal, limestone, bauxite
and general cargo.
This project is expected to be handled by Sterlite Ports Ltd, wholly owned subsidiary
of Vedanta. Currently Vedanta through its subsidiary owns and operates 14 mtpa
capacity, fully mechanized coal terminal at Visakhapatnam Port, A.P. With this
Vedanta’s Sterlite Ports will have strategic presence on both the west and east
coasts in the traditional iron ore and coal hubs, respectively.
Vedanta is the largest iron ore exporter from Goa and this project should provide
logistic integration to their Iron ore business, apart from handling other Cargo.
Ramp-up of Goan Iron ore industry beyond the 20 mtpa through this port will be a
milestone for mining industry with the state giving them added advantage of end-
to-end scale of operations in terms of Cargo movement and consolidation.
Modernization and re-development of Mormugao port will bring larger vessels to
the shore, thereby stimulating the maritime traffic, which in-turn should enhance
efficiencies and further create sustainable ports Infrastructure. Vedanta being a
diversified natural resources company, with close access to port should benefit
them. Also, the prior experience of running Ports gives us the comfort that they
ramp-up the business and efficiently manage the port operations.
This project in our view would entail investment over the next 2-3 years time period
and not affect the near term profitability of the company. Given that the synergies
from this port would be felt from long-term point of view, we continue to maintain
Neutral rating on the stock.
Railways withdraw the levy of Port Congestion Surcharge
Indian Railways (IR) announced to withdraw the levy of port congestion surcharge
with immediate effect. The surcharge withdrawn was levied at 10% of the basic
freight rate on all traffic including containers originating from ports with effect
from 24.11.2014.
3 other policy initiatives were announced by Railways Ministry. These include
(i) opening-up of loading of BCN rakes for 2 point destinations; (ii) incentive
scheme for merry-go-round operations by Railways in colliery-power plant circuits,
and (iii) policy on coastal movement of iron ore, involving combination of rail cum
sea movements, for steel plants located on the west coast.
We view this announcement to be positive for Indian Railways, as it could bring
down the logistics costs and thereby increase traffic volumes to the rail mode from
the road mode. We expect benefits to companies who have higher dependency on
Imported Thermal & Coking coal for Power sector & Steel plants, imported
Bauxite and alumina for Aluminum Industry, import container traffic from gateway
Ports to hinterland, imported Fertilizers, imported Limestone and Dolomite for
steel plants, etc.
Market Outlook
April 18, 2016
Results Preview
TCS (CMP: `2,523/ TP: `2,854 / Upside: 13.1%)
TCS is slated to announce its 4QFY2016 results today. We expect the company to
post revenue of US$4,215mn with 1.7% qoq growth, mostly volume led. In rupee
terms, revenues are expected to grow by 4.0% qoq to `28,454cr, lead by rupee
deprecation. EBITDA margin is expected to remain almost flat moving up only up
by ~8bp qoq to 28.4%, PAT is expected to be at `6,201cr, up 1.5% qoq
sequentially. The main factor to watch out is the FY2017 outlook. We maintain our
accumulate rating on the stock with target price of `2,854.
Y/E
Sales OPM
PAT EPS ROE P/E P/BV EV/EBITDA EV/Sales
March
(` cr)
(%)
(` cr)
(`)
(%)
(x)
(x)
(x)
(x)
FY2016E
1,08,487
28.3
24,038 122.8
38.0
20.6
7.8
15.2
4.2
FY2017E
1,22,590
28.5
27,096 138.4
38.9
18.2
7.1
13.0
3.6
Quarterly Bloomberg Brokers Consensus Estimate
LIC Housing Finance Ltd - April 18, 2016
Particulars (` cr)
4QFY16E
4QFY15
y-o-y (%)
3QFY16
q-o-q (%)
PAT
461
378
22.0
419
10.2
Tata Consultancy Services Ltd Consol - April 18, 2016
Particulars (` cr)
4QFY16E
4QFY15
y-o-y (%)
3QFY16
q-o-q (%)
Net sales
28,368
24,220
17.1
27,364
3.7
EBITDA
8,178
4,281
91.1
7,747
5.6
EBITDA margin (%)
28.8
17.7
28.3
Net profit
6,284
5,906
6.4
6,083
3.3
Wipro Ltd Consol - April 20, 2016
Particulars (` cr)
4QFY16E
4QFY15
y-o-y (%)
3QFY16
q-o-q (%)
Net sales
13,467
12,142
10.9
12,861
4.7
EBITDA
2,911
2,753
5.7
2,673
8.9
EBITDA margin (%)
21.6
22.7
20.8
Net profit
2,361
2,272
3.9
2,234
5.7
Economic and Political News
Goyal moots `5k-cr Investment fund
India's plan to buy 36 Rafale Fighter Planes from France finally takes-off
Maritime India Summit attracts `82,905cr investment
Corporate News
DVC to form JV with Neyveli Lignite for Raghunathpur plant
ITC to resume cigarette production amid health warning row
Alkem Labs accused of fudging trial data by German regulator
Tata Steel working with StanChart for UK unit sale: Source
Market Outlook
April 18, 2016
Top Picks ★★★★★
Large Cap
Market Cap
CMP
Target
Upside
Company
Rationale
(` Cr)
(`)
(`)
(%)
To outpace battery industry growth due to better technological
Amara Raja Batteries
15,377
900
1,040
15.5
products leading to market share gains in both the automotive
OEM and replacement segments.
Uptick in defense capex by government when coupled with
Bharat Electronics
28,657
1,194
1,414
18.4
BELs strong market positioning, indicate that good times are
ahead for BEL.
The stock is trading at attractive valuations and is factoring all
HCL Tech
1,18,176
838
1,038
23.9
the bad news.
Strong visibility for a robust 20% earnings trajectory, coupled
HDFC Bank
2,73,360
1,081
1,262
16.7
with high quality of earnings on account of high quality retail
business and strategic focus on highly rated corporates.
Back on the growth trend, expect a long term growth of 14%
Infosys
2,70,092
1,172
1,347
14.9
to be a US$20bn in FY2020.
LICHF continues to grow its retail loan book at a healthy pace
with improvement in asset quality. We expect the company to
LIC Housing Finance
24,264
481
592
23.1
post a healthy loan book which is likely to reflect in a strong
earnings growth.
Huge bid pipeline of re-development works at Delhi and other
NBCC
11,855
988
1,089
10.2
State Governments and opportunity from Smart City, positions
NBCC to report strong growth, going forward.
Source: Company, Angel Research
Mid Cap
Market Cap
CMP
Target
Upside
Company
Rationale
(` Cr)
(`)
(`)
(%)
Favorable outlook for the AC industry to augur well for
Cooling products business which is out pacing the market
Blue Star
3,655
406
458
12.7
growth. EMPPAC division's profitability to improve once
operating environment turns around.
With a focus on the low and medium income (LMI) consumer
Dewan Housing
5,925
203
270
33.0
segment, the company has increased its presence in tier-II &
III cities where the growth opportunity is immense.
Commencement of new projects, downtrend in the interest
IL&FS Transport
2,594
79
93
17.9
rate cycle, to lead to stock re-rating
Economic recovery to have favourable impact on advertising
& circulation revenue growth. Further, the acquisition of a
Jagran Prakashan
5,263
161
189
17.4
radio business (Radio City) would also boost the company's
revenue growth.
Speedier execution and speedier sales, strong revenue visibilty
Mahindra Lifespace
1,797
438
554
26.5
in short-to-long run, attractive valuations
Massive capacity expansion along with rail advantage at ICD
Navkar Corporation
2,685
188
265
40.7
as well CFS augurs well for the company
Earnings boost on back of stable material prices and
Radico Khaitan
1,168
88
156
77.7
favourable pricing environment. Valuation discount to peers
provides additional comfort
Strong brands and distribution network would boost growth
Siyaram Silk Mills
1,003
1,071
1,354
26.5
going ahead. Stock currently trades at an inexpensive
valuation.
Source: Company, Angel Research
Market Outlook
April 18,2016
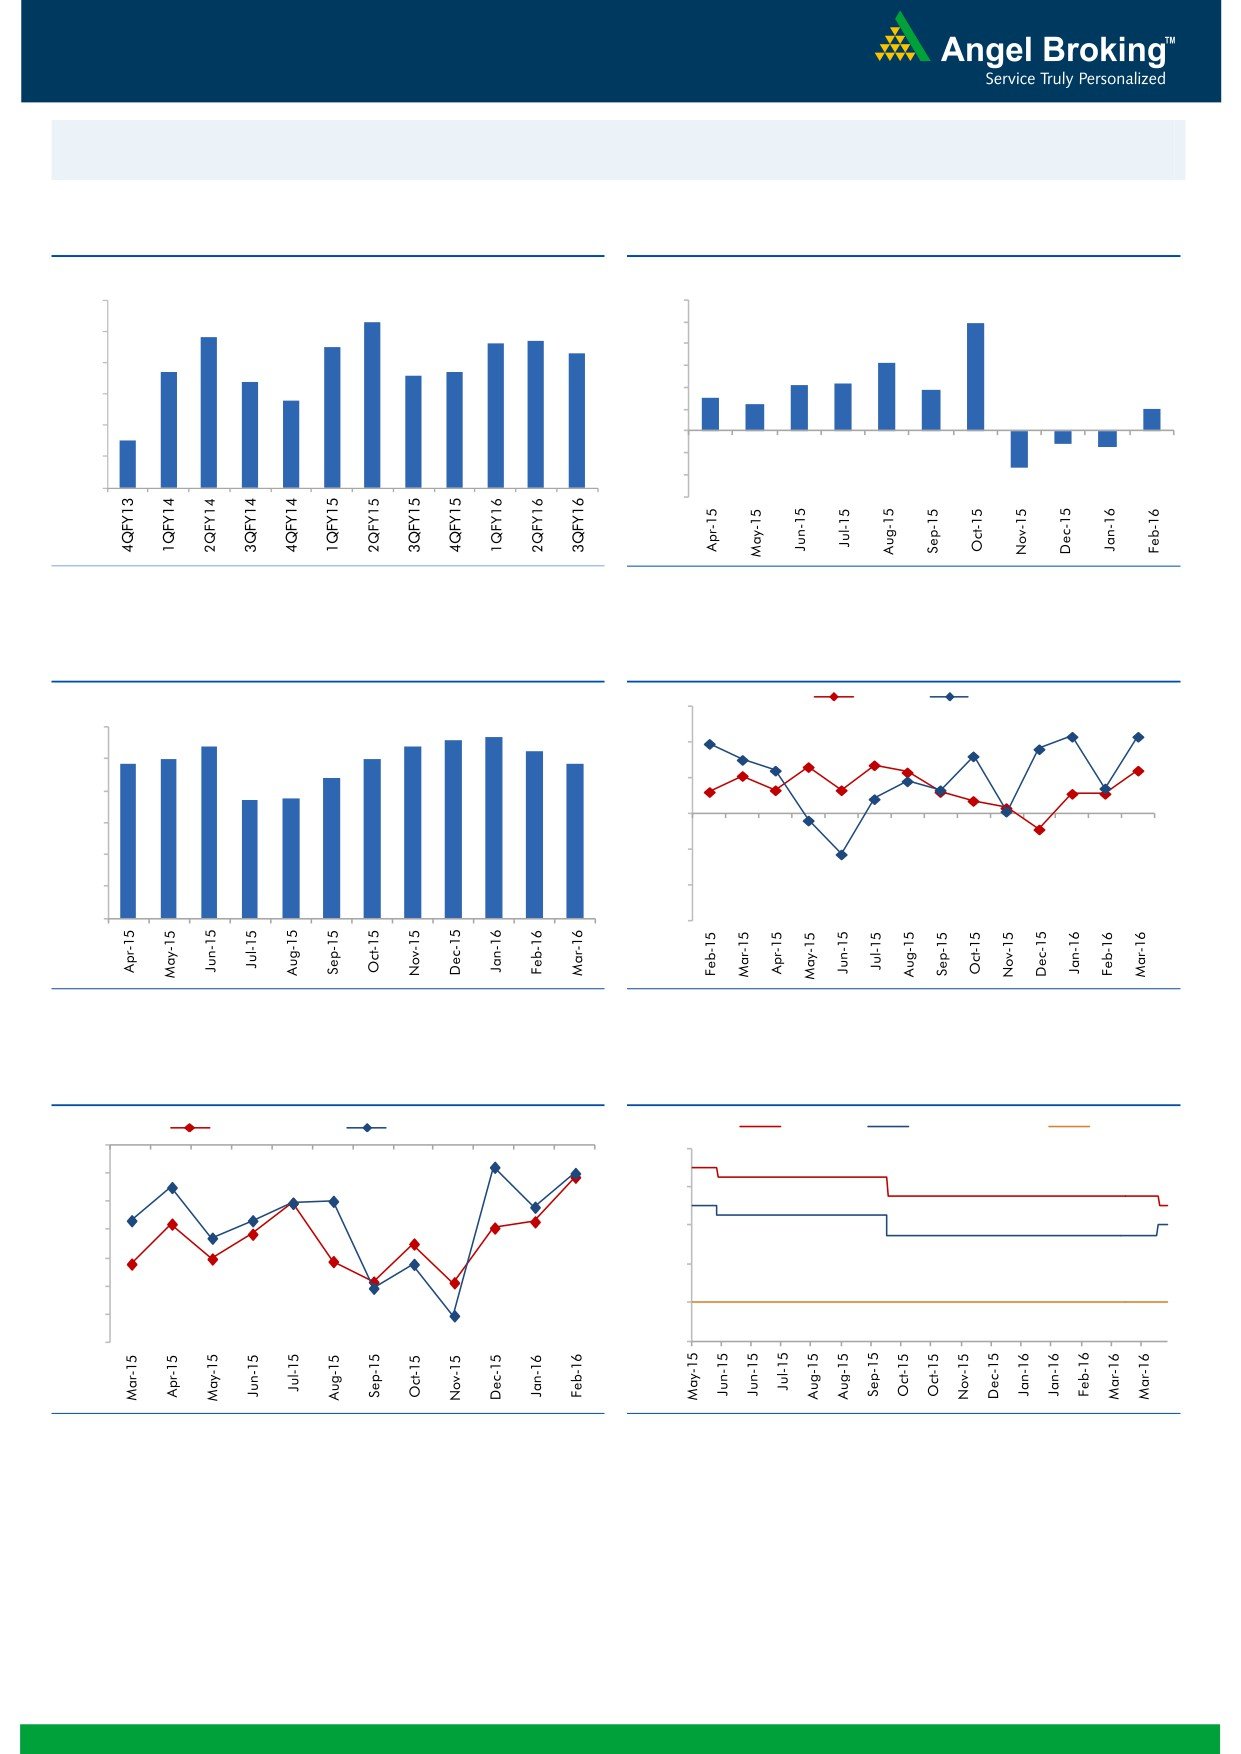
Macro watch
Exhibit 1: Quarterly GDP trends
Exhibit 2: IIP trends
(%)
(%)
9.0
8.3
12.0
9.9
7.8
7.7
10.0
8.0
7.5
7.6
7.3
8.0
6.3
6.7
6.6
6.7
7.0
6.4
6.0
4.2
4.3
3.7
5.8
3.0
2.5
6.0
4.0
2.0
2.0
5.0
4.5
-
4.0
(2.0)
(1.2)
(1.5)
(4.0)
3.0
(3.4)
(6.0)
Source: CSO, Angel Research
Source: MOSPI, Angel Research
Exhibit 3: Monthly CPI inflation trends
Exhibit 4: Manufacturing and services PMI
Mfg. PMI
Services PMI
(%)
56.0
5.6
5.7
6.0
5.4
5.4
5.3
4.9
5.0
5.0
4.8
54.0
5.0
4.4
3.7
3.7
52.0
4.0
50.0
3.0
48.0
2.0
1.0
46.0
-
44.0
Source: MOSPI, Angel Research
Source: Market, Angel Research; Note: Level above 50 indicates expansion
Exhibit 5: Exports and imports growth trends
Exhibit 6: Key policy rates
(%)
Exports yoy growth
Imports yoy growth
(%)
Repo rate
Reverse Repo rate
CRR
0.0
8.00
(5.0)
7.00
(10.0)
(15.0)
6.00
(20.0)
5.00
(25.0)
4.00
(30.0)
(35.0)
3.00
Source: Bloomberg, Angel Research
Source: RBI, Angel Research
Market Outlook
April 18,2016
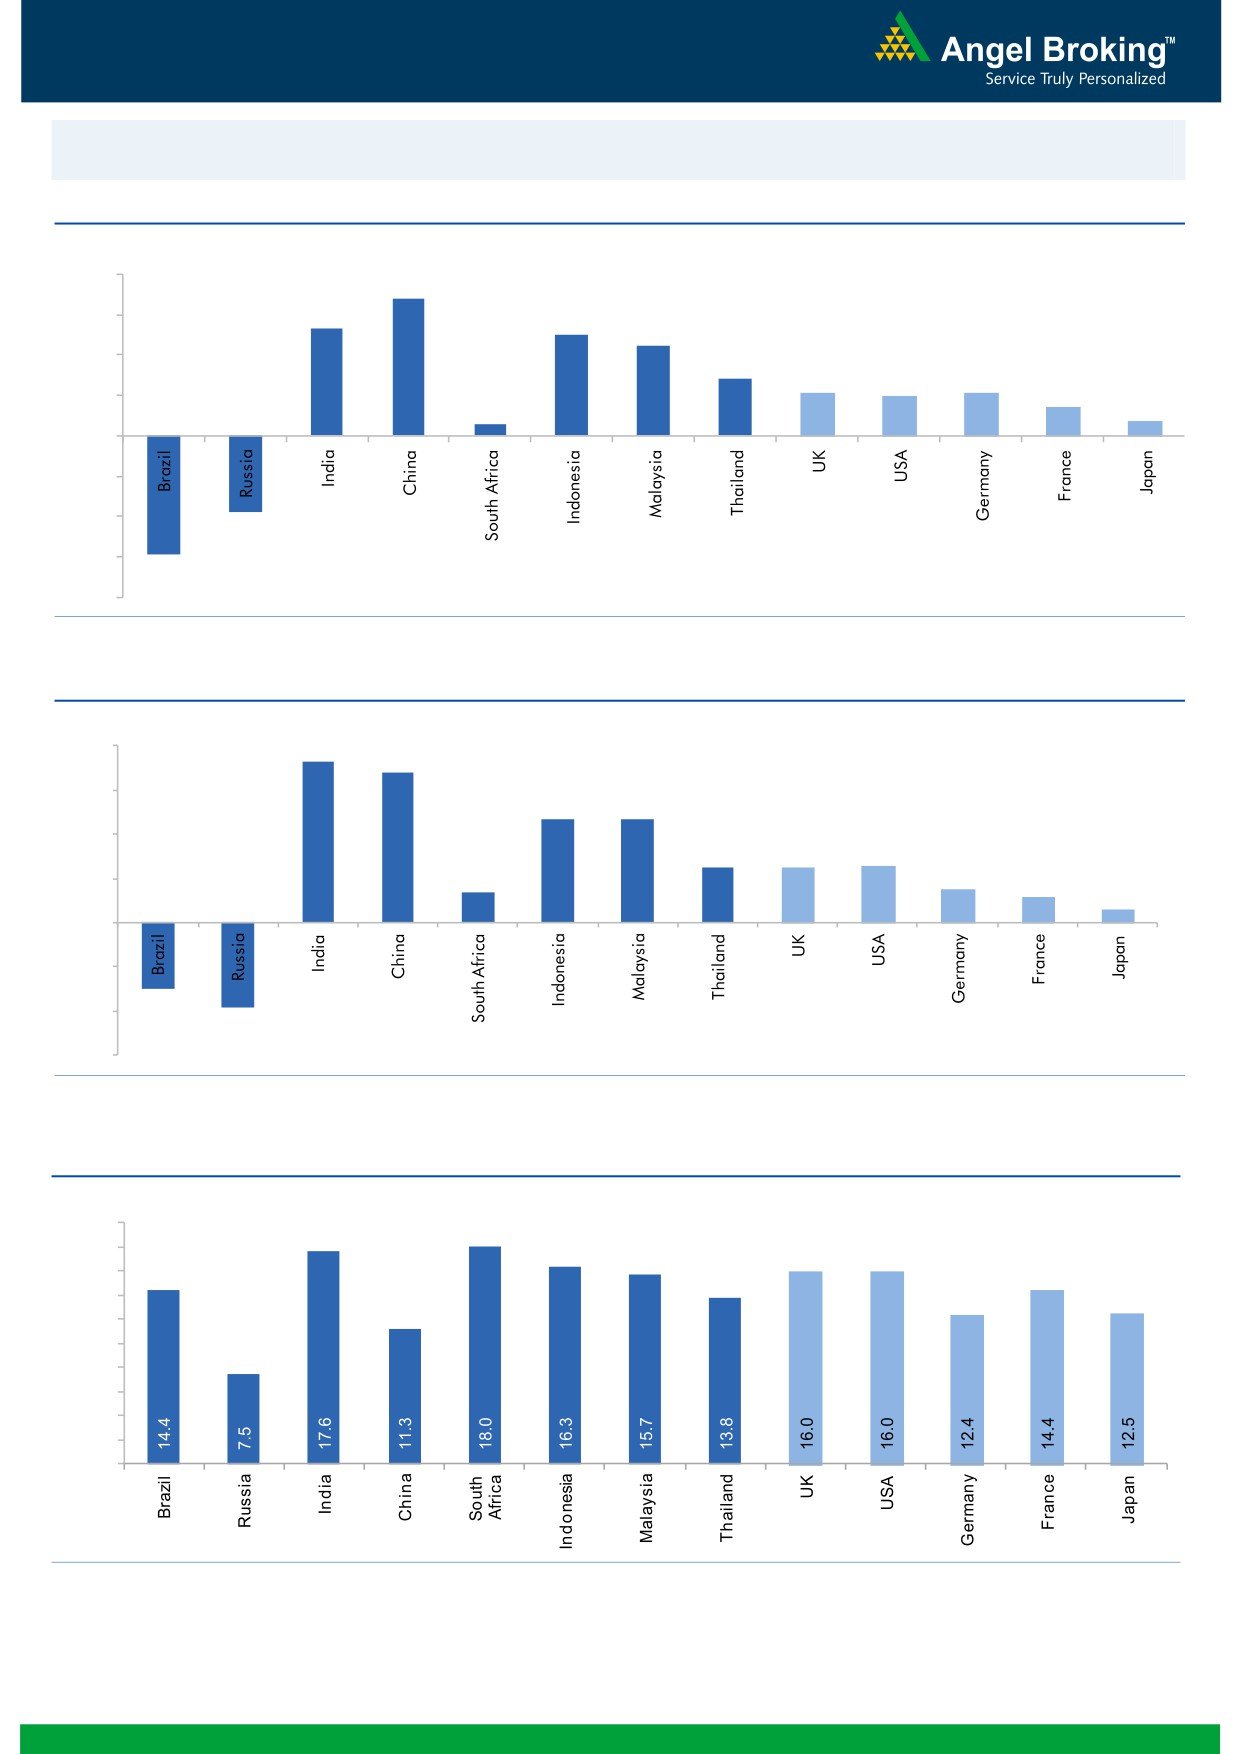
Global watch
Exhibit 1: Latest quarterly GDP Growth (%, yoy) across select developing and developed countries
(%)
8.0
6.8
6.0
5.3
5.0
4.5
4.0
2.8
2.1
2.0
2.1
1.4
2.0
0.6
0.7
-
(2.0)
(4.0)
(3.8)
(6.0)
(5.9)
(8.0)
Source: Bloomberg, Angel Research
Exhibit 2: 2015 GDP Growth projection by IMF (%, yoy) across select developing and developed countries
(%)
8.0
7.3
6.8
6.0
4.7
4.7
4.0
2.5
2.5
2.6
1.4
1.5
2.0
1.2
0.6
-
(2.0)
(3.0)
(4.0)
(3.8)
(6.0)
Source: IMF, Angel Research
Exhibit 3: One year forward P-E ratio across select developing and developed countries
(x)
20.0
18.0
16.0
14.0
12.0
10.0
8.0
6.0
4.0
2.0
-
Source: IMF, Angel Research
Market Outlook
April 18,2016
Exhibit 4: Relative performance of indices across globe
Returns (%)
Country
Name of index
Closing price
1M
3M
1YR
Brazil
Bovespa
53,228
12.9
34.7
(0.8)
Russia
Micex
1,908
2.0
13.5
13.7
India
Nifty
7,850
4.9
3.3
(10.6)
China
Shanghai Composite
3,078
7.5
(3.4)
(22.9)
South Africa
Top 40
46,763
2.2
7.7
(1.5)
Mexico
Mexbol
45,537
1.8
11.0
0.1
Indonesia
LQ45
835
(1.4)
5.2
(12.5)
Malaysia
KLCI
1,728
2.0
5.3
(6.6)
Thailand
SET 50
880
(0.9)
14.3
(12.9)
USA
Dow Jones
17,897
3.7
10.8
0.4
UK
FTSE
6,344
2.7
7.2
(10.0)
Japan
Nikkei
16,848
(1.6)
(2.3)
(14.2)
Germany
DAX
10,052
0.6
2.6
(15.5)
France
CAC
4,495
(0.3)
4.2
(13.2)
Source: Bloomberg, Angel Research
Stock Watch
April 18, 2016
Company Name
Reco
CMP
Target
Mkt Cap
Sales ( Čcr )
OPM(%)
EPS (Č)
PER(x)
P/BV(x)
RoE(%)
EV/Sales(x)
(Č)
Price ( Č)
( Č cr )
FY16E FY17E
FY16E
FY17E
FY16E
FY17E
FY16E
FY17E
FY16E
FY17E
FY16E
FY17E
FY16E
FY17E
Agri / Agri Chemical
Rallis
Neutral
189
-
3,683
2,097
2,415
14.4
14.4
9.5
11.0
19.9
17.2
4.0
3.4
21.1
21.3
1.7
1.5
United Phosphorus
Neutral
502
-
21,533
12,500
14,375
18.3
18.3
29.8
35.9
16.9
14.0
3.1
2.6
20.0
20.3
1.8
1.5
Auto & Auto Ancillary
Ashok Leyland
Neutral
110
-
31,390
17,995
21,544
11.4
11.6
3.4
4.7
32.4
23.5
5.7
5.2
17.7
22.2
1.7
1.4
Bajaj Auto
Accumulate
2,581
2,585
74,680
22,709
25,860
20.9
20.1
129.0
143.6
20.0
18.0
6.1
5.3
30.7
29.4
2.7
2.3
Bharat Forge
Accumulate
829
875
19,306
7,351
8,318
19.9
19.7
31.2
36.5
26.6
22.7
4.8
4.0
19.3
19.2
2.7
2.3
Eicher Motors
Neutral
19,896
-
54,041
15,556
16,747
15.5
17.3
464.8
597.5
42.8
33.3
15.6
11.5
36.2
34.3
3.3
3.1
Gabriel India
Accumulate
94
101
1,345
1,415
1,544
8.7
9.0
4.6
5.4
20.4
17.3
3.7
3.3
18.1
18.9
0.9
0.8
Hero Motocorp
Neutral
3,152
-
62,935
28,244
30,532
15.5
15.9
156.7
168.5
20.1
18.7
8.0
6.8
39.9
36.4
2.0
1.8
Jamna Auto Industries Accumulate
148
160
1,181
1,281
1,473
11.2
11.5
7.6
9.2
19.5
16.1
4.9
4.0
25.4
25.2
1.0
0.8
L G Balakrishnan & Bros Neutral
480
-
754
1,254
1,394
11.6
11.8
35.9
41.7
13.4
11.5
1.8
1.6
13.5
13.8
0.7
0.6
Mahindra and Mahindra Accumulate
1,333
1,364
82,767
38,416
42,904
13.7
13.9
54.8
63.4
24.3
21.0
3.8
3.3
15.4
15.8
1.7
1.4
Maruti
Neutral
3,735
-
112,815
57,865
68,104
16.4
16.7
176.3
225.5
21.2
16.6
4.1
3.5
19.4
21.2
1.6
1.3
Minda Industries
Neutral
1,009
-
1,601
2,523
2,890
8.7
9.0
55.0
65.4
18.4
15.4
3.5
2.9
19.3
18.7
0.7
0.6
Motherson Sumi
Buy
258
313
34,080
39,343
45,100
8.8
9.1
10.1
12.5
25.5
20.6
8.1
6.3
35.3
34.4
0.9
0.8
Rane Brake Lining
Buy
381
465
301
454
511
11.5
12.0
25.2
31.0
15.1
12.3
2.3
2.0
14.9
16.6
0.8
0.7
Setco Automotive
Neutral
32
-
424
594
741
12.7
13.7
1.7
3.2
18.7
9.9
2.0
1.7
10.4
16.9
1.1
0.9
Tata Motors
Neutral
409
-
117,957
259,686
273,957
13.0
13.4
25.9
29.5
15.8
13.9
2.1
1.8
8.0
9.0
0.6
0.6
TVS Motor
Neutral
327
-
15,526
11,263
13,122
6.9
8.5
9.2
15.0
35.5
21.8
8.1
6.5
22.7
29.6
1.3
1.1
Amara Raja Batteries
Buy
900
1,040
15,377
4,892
5,871
17.4
17.6
28.8
37.1
31.3
24.3
7.3
5.8
23.4
24.1
3.1
2.5
Exide Industries
Buy
134
162
11,407
6,950
7,784
14.4
14.8
6.6
7.3
20.3
18.4
2.6
2.3
12.6
12.8
1.4
1.2
Apollo Tyres
Accumulate
169
183
8,625
12,056
12,714
17.2
16.4
23.0
20.3
7.4
8.4
1.3
1.1
17.7
13.6
0.8
0.8
Ceat
Neutral
1,124
-
4,546
6,041
6,597
14.1
13.7
99.5
111.9
11.3
10.0
2.2
1.9
19.6
18.5
0.9
0.8
JK Tyres
Neutral
86
-
1,940
7,446
7,669
15.2
14.0
19.6
18.4
4.4
4.7
1.1
0.9
25.2
19.5
0.7
0.6
Swaraj Engines
Neutral
1,106
-
1,374
552
630
14.2
14.7
44.6
54.1
24.8
20.4
5.8
5.2
23.2
25.6
2.1
1.8
Subros
Neutral
95
-
567
1,293
1,527
11.8
11.9
4.2
6.7
22.5
14.1
1.7
1.5
7.7
11.5
0.7
0.6
Indag Rubber
Neutral
193
-
505
283
329
17.0
17.2
13.0
15.4
14.9
12.5
3.2
2.7
21.8
21.6
1.5
1.2
Capital Goods
ACE
Neutral
41
-
405
660
839
4.7
8.2
1.0
3.9
41.0
10.5
1.3
1.1
3.2
11.3
0.8
0.6
BEML
Buy
941
1,157
3,918
3,277
4,006
6.0
8.9
36.2
64.3
26.0
14.6
1.8
1.6
5.7
11.7
1.2
1.0
Bharat Electronics
Buy
1,194
1,414
28,657
7,737
8,634
16.8
17.2
54.0
61.5
22.1
19.4
3.2
2.8
39.3
45.6
2.8
2.4
Stock Watch
April 18, 2016
Company Name
Reco
CMP
Target
Mkt Cap
Sales ( Čcr )
OPM(%)
EPS (Č)
PER(x)
P/BV(x)
RoE(%)
EV/Sales(x)
(Č)
Price ( Č)
( Č cr )
FY16E
FY17E
FY16E
FY17E
FY16E
FY17E
FY16E
FY17E
FY16E
FY17E
FY16E
FY17E
FY16E
FY17E
Capital Goods
Voltas
Buy
283
353
9,369
5,363
5,963
8.0
9.1
11.0
13.8
25.7
20.5
4.0
3.5
16.2
17.9
1.7
1.5
BGR Energy
Neutral
109
-
784
3,615
3,181
9.5
9.4
16.7
12.4
6.5
8.8
0.6
0.6
10.0
7.0
0.6
0.8
BHEL
Neutral
133
-
32,639
33,722
35,272
10.8
11.7
10.5
14.2
12.7
9.4
0.9
0.9
7.0
9.0
1.0
1.0
Blue Star
Accumulate
406
458
3,655
3,548
3,977
6.3
6.9
13.7
17.2
29.7
23.7
7.5
4.9
26.1
25.4
1.1
0.9
Crompton Greaves
Neutral
54
-
3,381
13,484
14,687
4.9
6.2
4.5
7.1
12.0
7.6
0.9
0.8
7.2
10.8
0.4
0.3
Greaves Cotton
Neutral
137
-
3,338
1,655
1,755
16.6
16.8
7.4
7.8
18.5
17.5
3.7
3.5
21.1
20.6
1.9
1.8
Inox Wind
Buy
255
458
5,652
4,980
5,943
17.0
17.5
26.6
31.6
9.6
8.1
2.9
2.1
35.0
30.0
1.3
1.0
KEC International
Neutral
130
-
3,342
8,791
9,716
6.1
6.8
5.4
8.2
24.1
15.9
2.4
2.2
10.0
14.0
0.6
0.6
Thermax
Neutral
757
-
9,021
6,413
7,525
7.4
8.5
30.5
39.3
24.8
19.3
3.8
3.3
15.0
17.0
1.4
1.1
VATech Wabag
Neutral
561
-
3,056
2,722
3,336
7.9
8.1
19.5
24.6
28.8
22.8
3.0
2.7
11.1
12.4
1.2
1.0
Cement
ACC
Neutral
1,470
-
27,597
13,151
14,757
16.4
18.3
63.9
83.4
23.0
17.6
3.0
2.7
13.3
16.1
1.9
1.6
Ambuja Cements
Neutral
231
-
35,787
11,564
12,556
19.4
20.7
8.9
10.1
25.9
22.8
3.2
3.1
12.8
13.8
2.6
2.4
HeidelbergCement
Neutral
98
-
2,213
1,772
1,926
13.3
15.4
1.0
3.0
97.7
32.6
2.5
2.3
2.6
7.9
1.8
1.6
India Cements
Neutral
93
-
2,863
4,216
4,840
18.0
19.5
4.0
9.9
23.3
9.4
0.9
0.9
4.0
9.5
1.0
0.8
JK Cement
Neutral
665
-
4,652
3,661
4,742
10.1
15.8
7.5
28.5
88.7
23.3
2.7
2.4
7.5
22.9
1.7
1.3
J K Lakshmi Cement
Neutral
344
-
4,051
2,947
3,616
16.7
19.9
11.5
27.2
29.9
12.7
2.8
2.5
9.8
20.8
1.8
1.4
Mangalam Cements
Neutral
240
-
641
1,053
1,347
10.5
13.3
8.4
26.0
28.6
9.2
1.2
1.1
4.3
12.5
1.0
0.7
Orient Cement
Neutral
155
-
3,184
1,854
2,524
21.2
22.2
7.7
11.1
20.2
14.0
2.9
2.5
13.3
15.7
2.4
1.7
Ramco Cements
Neutral
439
-
10,461
4,036
4,545
20.8
21.3
15.1
18.8
29.1
23.4
3.6
3.2
12.9
14.3
3.0
2.6
Shree Cement^
Neutral
12,765
-
44,470
7,150
8,742
26.7
28.6
228.0
345.5
56.0
37.0
8.2
6.9
15.7
20.3
5.8
4.7
UltraTech Cement
Neutral
3,276
-
89,891
24,669
29,265
18.2
20.6
82.0
120.0
40.0
27.3
4.3
3.8
11.3
14.7
3.6
3.0
Construction
ITNL
Buy
79
93
2,594
7,360
8,825
34.0
35.9
7.0
9.0
11.3
8.8
0.4
0.4
3.2
3.7
3.7
3.6
KNR Constructions
Buy
542
603
1,525
937
1,470
14.3
14.0
44.2
38.6
12.3
14.1
2.5
2.1
15.4
15.4
1.6
1.1
Larsen & Toubro
Accumulate
1,236
1,310
115,089
58,870
65,708
8.3
10.3
42.0
53.0
29.4
23.3
2.0
1.9
8.8
11.2
2.2
1.9
Gujarat Pipavav Port
Neutral
178
-
8,591
629
684
51.0
52.2
6.4
5.9
27.8
30.1
3.7
3.4
15.9
12.7
13.3
12.0
MBL Infrastructures
Buy
157
285
649
2,313
2,797
12.2
14.6
19.0
20.0
8.2
7.8
0.9
0.8
11.3
10.6
1.0
0.9
Nagarjuna Const.
Neutral
74
-
4,133
7,892
8,842
8.8
9.1
3.0
5.3
24.8
14.0
1.2
1.1
5.0
8.5
0.8
0.6
PNC Infratech
Accumulate
534
558
2,739
1,873
2,288
13.2
13.5
24.0
32.0
22.2
16.7
2.2
1.9
12.1
12.3
1.6
1.3
Simplex Infra
Neutral
250
-
1,236
5,955
6,829
10.3
10.5
16.0
31.0
15.6
8.1
0.8
0.8
5.3
9.9
0.7
0.6
Stock Watch
April 18, 2016
Company Name
Reco
CMP
Target
Mkt Cap
Sales ( Čcr )
OPM(%)
EPS (Č)
PER(x)
P/BV(x)
RoE(%)
EV/Sales(x)
(Č)
Price ( Č)
( Č cr )
FY16E
FY17E
FY16E
FY17E
FY16E
FY17E
FY16E
FY17E
FY16E
FY17E
FY16E
FY17E
FY16E
FY17E
Construction
Power Mech Projects
Neutral
606
-
891
1,539
1,801
12.8
12.7
59.0
72.1
10.3
8.4
1.5
1.3
18.6
16.8
0.6
0.5
Sadbhav Engineering
Neutral
281
-
4,825
3,481
4,219
10.7
10.8
8.2
11.7
34.3
24.0
3.3
2.9
10.3
13.5
1.6
1.4
NBCC
Accumulate
988
1,089
11,855
5,816
7,382
6.9
7.7
29.6
39.8
33.4
24.8
6.0
4.7
24.1
26.7
1.8
1.4
MEP Infra
Neutral
41
-
668
1,956
1,876
28.1
30.5
1.3
3.0
31.6
13.7
6.6
4.5
21.2
32.8
1.8
1.7
SIPL
Neutral
103
-
3,610
675
1,042
62.4
64.7
-
-
3.8
4.4
-
-
17.0
11.5
Engineers India
Neutral
174
-
5,858
1,667
1,725
13.5
16.0
9.7
11.4
17.9
15.3
2.1
2.0
11.7
13.4
2.2
2.2
Financials
Allahabad Bank
Neutral
57
-
3,468
8,569
9,392
2.8
2.9
16.3
27.5
3.5
2.1
0.3
0.3
7.6
11.9
-
-
Axis Bank
Accumulate
441
494
105,023
26,473
31,527
3.5
3.6
35.7
43.5
12.3
10.1
2.1
1.8
17.9
18.9
-
-
Bank of Baroda
Neutral
152
-
35,127
18,485
21,025
1.9
2.0
13.5
21.1
11.3
7.2
0.9
0.8
7.3
10.6
-
-
Bank of India
Neutral
95
-
7,725
15,972
17,271
1.9
2.0
15.3
33.4
6.2
2.8
0.3
0.2
3.6
7.6
-
-
Canara Bank
Neutral
196
-
10,667
15,441
16,945
2.0
2.1
46.6
70.4
4.2
2.8
0.4
0.3
8.0
11.2
-
-
Dena Bank
Neutral
29
-
1,894
3,440
3,840
2.1
2.3
7.3
10.0
4.1
2.9
0.3
0.3
6.1
7.9
-
-
Dewan Housing Finance Buy
203
270
5,925
1,892
2,277
2.9
2.9
25.9
30.8
7.8
6.6
1.2
1.1
15.3
15.9
-
-
Federal Bank
Neutral
45
-
7,671
3,477
3,999
3.0
3.0
5.0
6.2
8.9
7.2
0.9
0.8
10.6
11.9
-
-
HDFC
Neutral
1,113
-
175,868
10,358
11,852
3.3
3.3
41.1
47.0
27.1
23.7
5.2
4.7
24.7
24.9
-
-
HDFC Bank
Buy
1,081
1,262
273,360
38,309
47,302
4.3
4.3
49.3
61.1
21.9
17.7
3.8
3.3
18.5
19.7
-
-
ICICI Bank
Accumulate
241
254
140,139
34,279
39,262
3.3
3.3
21.0
24.4
11.5
9.9
1.9
1.6
14.4
14.7
-
-
IDBI Bank
Neutral
70
-
14,401
9,625
10,455
1.8
1.8
8.5
14.2
8.2
4.9
0.5
0.5
5.9
9.3
-
-
Indian Bank
Neutral
99
-
4,774
6,160
6,858
2.5
2.5
24.5
29.8
4.1
3.3
0.3
0.3
7.7
8.6
-
-
LIC Housing Finance
Buy
481
592
24,264
3,101
3,745
2.5
2.5
33.0
40.2
14.6
12.0
2.7
2.3
19.7
20.5
-
-
Oriental Bank
Neutral
92
-
2,962
7,643
8,373
2.4
2.4
37.2
45.4
2.5
2.0
0.2
0.2
8.2
9.4
-
-
Punjab Natl.Bank
Neutral
85
-
16,602
23,638
26,557
2.8
2.8
17.9
27.2
4.7
3.1
0.5
0.4
8.5
12.0
-
-
South Ind.Bank
Neutral
18
-
2,417
1,965
2,185
2.5
2.5
2.5
3.3
7.2
5.4
0.7
0.6
9.5
11.7
-
-
St Bk of India
Neutral
192
-
148,851
79,958
86,061
2.6
2.6
13.4
20.7
14.3
9.3
1.2
1.1
11.5
12.8
-
-
Union Bank
Neutral
131
-
9,030
12,646
14,129
2.3
2.4
31.0
39.1
4.2
3.4
0.5
0.4
9.8
11.4
-
-
Vijaya Bank
Neutral
31
-
2,928
3,536
3,827
1.9
1.9
5.5
6.7
5.7
4.7
0.5
0.4
7.8
8.8
-
-
Yes Bank
Neutral
870
-
36,565
7,190
9,011
3.2
3.3
58.2
69.7
14.9
12.5
2.7
2.3
19.2
19.6
-
-
FMCG
Asian Paints
Neutral
873
-
83,748
16,553
19,160
16.0
16.2
17.7
21.5
49.4
40.6
13.1
11.8
29.4
31.2
4.9
4.2
Britannia
Neutral
2,755
-
33,053
8,481
9,795
14.0
14.1
65.5
78.3
42.1
35.2
19.9
16.3
38.3
41.2
3.7
3.2
Stock Watch
April 18, 2016
Company Name
Reco
CMP
Target
Mkt Cap
Sales ( Čcr )
OPM(%)
EPS (Č)
PER(x)
P/BV(x)
RoE(%)
EV/Sales(x)
(Č)
Price ( Č)
( Č cr )
FY16E FY17E
FY16E
FY17E
FY16E
FY17E
FY16E
FY17E
FY16E
FY17E
FY16E
FY17E
FY16E
FY17E
FMCG
Colgate
Neutral
835
-
22,711
4,836
5,490
19.5
19.7
48.5
53.2
17.2
15.7
12.6
11.0
99.8
97.5
4.5
4.0
Dabur India
Neutral
267
-
46,925
9,370
10,265
17.1
17.2
7.3
8.1
36.4
32.9
11.0
8.9
33.7
30.6
4.8
4.4
GlaxoSmith Con*
Neutral
6,017
-
25,303
4,919
5,742
17.2
17.4
168.3
191.2
35.8
31.5
10.1
8.6
28.8
28.9
4.7
4.0
Godrej Consumer
Neutral
1,372
-
46,716
10,168
12,886
16.1
16.1
32.1
38.4
42.7
35.7
8.7
8.0
19.7
21.0
4.6
3.6
HUL
Neutral
896
-
193,781
34,940
38,957
17.5
17.7
20.8
24.7
43.1
36.3
47.9
38.3
110.5
114.2
5.2
4.6
ITC
Accumulate
331
359
266,322
36,804
38,776
37.9
37.9
12.2
12.9
27.1
25.7
7.5
6.6
27.7
25.8
6.6
6.3
Marico
Neutral
251
-
32,422
6,551
7,766
15.7
16.0
10.4
12.5
24.2
20.1
7.0
5.8
33.2
32.4
5.0
4.2
Nestle*
Accumulate
6,106
6,646
58,870
11,291
12,847
22.2
22.3
158.9
184.6
38.4
33.1
20.1
18.1
55.0
57.3
5.1
4.4
Tata Global
Buy
121
144
7,615
8,635
9,072
9.8
9.9
6.5
7.6
18.6
15.9
1.9
1.8
6.8
7.4
0.8
0.8
Procter & Gamble
Accumulate
6,527
7,369
21,186
2,588
2,939
23.3
23.2
130.2
146.2
50.1
44.7
100.0
95.8
27.6
25.3
2.6
2.2
Hygiene
IT
HCL Tech^
Buy
838
1,038
118,176
42,038
47,503
21.2
21.5
51.5
57.7
16.3
14.5
3.5
2.7
21.5
18.8
2.4
2.0
Infosys
Accumulate
1,172
1,347
270,092
61,850
69,981
27.5
27.5
59.4
65.7
19.7
17.8
4.2
3.6
21.2
20.1
3.7
3.1
TCS
Accumulate
2,523
2,854
497,169
108,487
122,590
28.3
28.5
122.8
138.4
20.6
18.2
7.8
7.1
38.0
38.9
4.2
3.6
Tech Mahindra
Accumulate
471
530
45,555
26,524
29,177
16.2
17.0
28.8
33.6
16.3
14.0
3.2
2.7
19.3
19.1
1.5
1.3
Wipro
Buy
585
680
144,437
50,808
56,189
23.7
23.8
37.3
40.7
15.7
14.4
3.0
2.7
19.2
17.7
2.2
1.9
Media
D B Corp
Accumulate
319
356
5,868
2,241
2,495
27.8
27.9
21.8
25.6
14.7
12.5
3.8
3.4
26.7
28.5
2.5
2.2
HT Media
Neutral
82
-
1,912
2,495
2,603
11.2
11.2
7.3
8.6
11.3
9.6
0.9
0.8
7.4
8.1
0.3
0.3
Jagran Prakashan
Buy
161
189
5,263
2,170
2,355
27.2
26.2
8.9
9.9
18.1
16.3
3.8
3.3
20.9
20.5
2.3
2.1
Sun TV Network
Neutral
358
-
14,124
2,779
3,196
70.2
70.5
22.8
27.3
15.7
13.1
3.9
3.5
26.7
28.3
4.9
4.2
Hindustan Media
Neutral
262
-
1,924
920
1,031
20.0
20.0
19.2
20.9
13.7
12.6
2.2
1.9
16.4
15.3
1.5
1.3
Ventures
Metals & Mining
Coal India
Buy
277
380
174,932
76,167
84,130
19.9
22.3
22.4
25.8
12.4
10.7
4.5
4.3
35.5
41.0
1.6
1.4
Hind. Zinc
Accumulate
166
175
69,971
14,641
14,026
50.4
50.4
17.7
16.0
9.4
10.4
1.4
1.3
16.2
13.2
2.2
2.1
Hindalco
Neutral
96
-
19,886
104,356
111,186
8.7
9.5
6.7
11.1
14.3
8.7
0.5
0.5
3.5
5.9
0.7
0.6
JSW Steel
Neutral
1,313
-
31,747
42,308
45,147
16.4
20.7
(10.3)
49.5
26.5
1.5
1.4
(1.0)
5.6
1.8
1.7
NMDC
Neutral
101
-
40,044
8,237
10,893
46.6
44.5
10.0
11.7
10.2
8.7
1.1
1.0
12.5
13.0
4.6
3.5
SAIL
Neutral
44
-
18,234
45,915
53,954
7.2
10.5
1.5
4.4
29.3
10.1
0.4
0.4
2.3
4.1
1.0
0.9
Vedanta
Neutral
94
-
27,868
71,445
81,910
26.2
26.3
12.9
19.2
7.3
4.9
0.5
0.5
7.2
8.9
0.8
0.6
Tata Steel
Neutral
333
-
32,303
126,760
137,307
8.9
11.3
6.4
23.1
52.3
14.4
1.1
1.0
2.0
7.1
0.8
0.8
Oil & Gas
Cairn India
Neutral
155
-
29,089
11,323
12,490
49.4
51.0
20.7
20.7
7.5
7.5
0.5
0.5
6.4
6.1
1.6
0.9
Stock Watch
April 18, 2016
Company Name
Reco
CMP
Target
Mkt Cap
Sales ( Čcr )
OPM(%)
EPS (Č)
PER(x)
P/BV(x)
RoE(%)
EV/Sales(x)
(Č)
Price ( Č)
( Č cr )
FY16E FY17E
FY16E
FY17E
FY16E
FY17E
FY16E
FY17E
FY16E
FY17E
FY16E
FY17E
FY16E
FY17E
Oil & Gas
GAIL
Neutral
369
-
46,750
64,856
70,933
9.1
9.6
24.0
28.9
15.4
12.8
1.3
1.2
8.8
9.6
0.9
0.8
ONGC
Neutral
213
-
182,232
154,564
167,321
36.8
37.4
28.6
32.5
7.5
6.6
1.0
0.9
12.7
13.5
1.4
1.3
Petronet LNG
Neutral
259
-
19,440
29,691
31,188
5.8
6.2
12.8
13.4
20.3
19.3
3.0
2.7
15.8
14.8
0.7
0.7
Indian Oil Corp
Accumulate
416
455
101,100
359,607
402,760
5.9
6.1
42.5
48.7
9.8
8.6
1.3
1.2
14.1
14.4
0.4
0.3
Reliance Industries
Accumulate
1,065
1,150
345,246
304,775
344,392
12.6
13.4
91.3
102.6
11.7
10.4
1.3
1.2
11.8
12.0
1.0
0.9
Pharmaceuticals
Alembic Pharma
Neutral
562
-
10,597
3,274
3,802
26.9
19.4
35.0
28.7
16.1
19.6
7.1
5.4
55.6
31.2
3.1
2.6
Aurobindo Pharma
Accumulate
783
856
45,842
14,923
17,162
22.0
23.0
35.7
42.8
21.9
18.3
6.5
4.9
34.0
30.2
3.4
2.9
Aventis*
Neutral
4,293
-
9,886
2,082
2,371
17.4
20.8
118.2
151.5
36.3
28.3
5.3
4.3
19.9
25.5
4.5
3.8
Cadila Healthcare
Accumulate
320
352
32,760
10,224
11,840
21.0
22.0
14.6
17.6
21.9
18.2
6.0
4.7
30.8
29.0
3.2
2.7
Cipla
Buy
512
605
41,113
13,979
16,447
20.2
18.6
25.7
27.5
19.9
18.6
3.3
2.8
17.6
16.1
2.9
2.4
Dr Reddy's
Buy
3,101
3,933
52,877
16,838
19,575
25.0
23.1
167.5
178.8
18.5
17.3
3.9
3.3
23.1
20.4
3.1
2.6
Dishman Pharma
Neutral
349
-
2,813
1,733
1,906
21.5
21.5
17.0
19.9
20.5
17.5
2.1
1.9
10.5
11.2
2.1
1.8
GSK Pharma*
Neutral
3,723
-
31,533
2,870
3,158
20.0
22.1
59.5
68.3
62.6
54.5
18.5
19.0
28.5
34.3
10.3
9.5
Indoco Remedies
Neutral
271
-
2,500
1,033
1,199
15.9
18.2
9.4
13.6
28.9
20.0
4.3
3.6
15.7
19.7
2.5
2.2
Ipca labs
Buy
494
900
6,232
3,363
3,909
12.9
18.6
13.4
28.0
36.9
17.6
2.6
2.3
7.4
14.0
2.1
1.8
Lupin
Neutral
1,544
-
69,563
13,092
16,561
25.0
27.0
50.4
68.3
30.6
22.6
6.3
5.0
22.8
24.7
5.0
3.8
Sun Pharma
Buy
832
950
200,175
28,163
32,610
25.8
30.7
17.4
26.9
47.8
30.9
4.5
3.9
13.0
16.6
6.5
5.4
Power
Tata Power
Neutral
70
-
18,932
35,923
37,402
22.6
22.8
4.1
5.2
17.3
13.6
1.3
1.2
7.5
9.3
1.5
1.3
NTPC
Accumulate
137
146
113,087
87,271
99,297
23.5
23.5
11.8
13.3
11.7
10.3
1.3
1.2
11.5
12.2
2.3
2.1
Power Grid
Buy
145
170
75,858
20,702
23,361
86.7
86.4
12.1
13.2
12.0
11.0
1.8
1.6
15.6
15.1
8.5
7.9
Real Estate
MLIFE
Buy
438
554
1,797
697
1,011
14.9
19.3
13.8
20.1
31.7
21.8
1.2
1.1
3.8
5.3
3.9
2.6
Telecom
Bharti Airtel
Neutral
352
-
140,629
101,748
109,191
32.1
31.7
12.0
12.5
29.3
28.1
2.0
1.9
6.9
6.7
2.0
1.8
Idea Cellular
Neutral
115
-
41,316
34,282
36,941
32.0
31.5
5.9
6.2
19.5
18.5
1.8
1.6
9.9
9.3
1.8
1.7
zOthers
Abbott India
Neutral
4,822
-
10,246
2,715
3,153
14.5
14.1
134.3
152.2
35.9
31.7
9.0
7.4
27.4
25.6
3.5
2.9
Bajaj Electricals
Accumulate
216
237
2,184
4,719
5,287
5.2
5.8
8.6
12.7
25.3
17.1
2.9
2.5
11.4
14.8
0.5
0.4
Finolex Cables
Neutral
282
-
4,320
2,520
2,883
12.2
12.0
12.7
14.2
22.3
19.9
3.0
2.7
13.6
13.5
1.5
1.2
Goodyear India*
Accumulate
521
582
1,202
1,800
1,600
11.7
11.5
58.7
52.9
8.9
9.8
2.0
1.7
24.6
18.7
0.4
0.4
Hitachi
Neutral
1,194
-
3,246
1,779
2,081
7.8
8.8
21.8
33.4
54.8
35.7
8.8
7.2
17.4
22.1
1.9
1.6
Jyothy Laboratories
Neutral
304
-
5,507
1,620
1,847
11.5
11.5
7.3
8.5
41.7
35.9
5.4
5.0
13.3
14.4
3.3
2.8
Stock Watch
April 18, 2016
Company Name
Reco
CMP
Target
Mkt Cap
Sales ( Čcr )
OPM(%)
EPS (Č)
PER(x)
P/BV(x)
RoE(%)
EV/Sales(x)
(Č)
Price ( Č)
( Č cr )
FY16E
FY17E
FY16E
FY17E
FY16E
FY17E
FY16E
FY17E
FY16E
FY17E
FY16E
FY17E
FY16E
FY17E
zOthers
MRF
Buy
36,499
45,575
15,480
20,316
14,488
21.4
21.1
5,488.0
3,798.0
6.7
9.6
2.3
1.8
41.1
21.2
0.7
0.9
Page Industries
Neutral
12,871
-
14,356
1,929
2,450
19.8
20.1
229.9
299.0
56.0
43.1
24.7
17.2
52.1
47.1
7.5
5.9
Relaxo Footwears
Neutral
500
-
6,000
1,767
2,152
12.3
12.5
19.3
25.1
26.0
19.9
6.4
4.9
27.7
27.8
3.4
2.7
Siyaram Silk Mills
Buy
1,071
1,354
1,003
1,636
1,815
11.5
11.5
89.9
104.1
11.9
10.3
2.0
1.7
17.9
17.8
0.7
0.7
Styrolution ABS India* Neutral
601
-
1,056
1,271
1,440
8.6
9.2
32.0
41.1
18.8
14.6
1.9
1.7
10.7
12.4
0.8
0.7
TVS Srichakra
Buy
2,523
3,217
1,932
2,035
2,252
15.9
15.3
248.6
268.1
10.2
9.4
4.4
3.2
43.6
33.9
1.0
0.8
HSIL
Neutral
308
-
2,223
2,123
2,384
16.1
16.5
15.0
18.9
20.5
16.3
1.6
1.5
8.0
9.4
1.4
1.2
Kirloskar Engines India
Neutral
240
-
3,471
2,403
2,554
8.6
9.9
9.2
10.5
26.1
22.9
2.5
2.4
9.7
10.7
1.0
1.0
Ltd
M M Forgings
Buy
463
614
559
511
615
21.7
21.6
43.1
55.8
10.7
8.3
2.0
1.6
19.9
21.2
1.3
1.0
Banco Products (India) Neutral
123
-
879
1,208
1,353
11.0
12.3
10.8
14.5
11.4
8.5
1.3
1.2
11.9
14.5
0.7
0.6
Competent Automobiles Neutral
151
-
93
1,040
1,137
3.2
3.1
25.7
28.0
5.9
5.4
0.9
0.8
15.0
14.3
0.1
0.1
Nilkamal
Neutral
1,337
-
1,995
1,871
2,031
10.7
10.5
63.2
69.8
21.2
19.2
3.5
3.0
17.6
16.6
1.1
1.0
Visaka Industries
Buy
120
144
191
1,086
1,197
9.9
10.3
21.5
28.8
5.6
4.2
0.5
0.5
9.6
11.6
0.4
0.3
Transport Corporation of
Neutral
272
-
2,068
2,830
3,350
8.8
9.0
14.4
18.3
18.9
14.9
2.9
2.5
15.4
17.1
0.9
0.7
India
Elecon Engineering
Neutral
64
-
693
1,359
1,482
10.3
13.7
0.8
3.9
79.2
16.3
1.3
1.3
1.6
7.8
0.9
0.8
Surya Roshni
Buy
154
201
673
2,992
3,223
8.1
8.4
14.7
18.3
10.5
8.4
1.0
0.9
9.7
11.0
0.5
0.5
MT Educare
Neutral
180
-
717
286
366
18.3
17.7
7.7
9.4
23.3
19.2
4.9
4.3
20.2
21.1
2.3
1.8
Radico Khaitan
Buy
88
156
1,168
1,517
1,635
12.7
13.4
5.8
7.1
15.1
12.4
1.3
1.2
8.6
9.6
1.2
1.1
Garware Wall Ropes
Buy
360
473
787
862
974
11.2
11.2
24.9
29.6
14.5
12.2
2.2
1.9
15.1
15.4
0.9
0.7
Wonderla Holidays
Neutral
381
-
2,155
206
308
44.0
43.6
9.0
12.9
42.4
29.6
5.8
5.3
13.7
17.8
10.3
6.9
Linc Pen & Plastics
Neutral
192
-
283
340
371
8.3
8.9
10.8
13.2
17.8
14.5
2.8
2.5
16.0
17.1
0.9
0.8
The Byke Hospitality
Neutral
159
-
636
222
287
20.5
20.5
5.6
7.6
28.1
21.0
5.3
4.4
18.9
20.8
2.8
2.2
Interglobe Aviation
Neutral
1,031
-
37,149
17,022
21,122
20.7
14.5
63.9
53.7
16.1
19.2
24.2
19.8
149.9
103.2
2.2
1.7
Coffee Day Enterprises
Neutral
234
-
4,817
2,692
2,964
17.0
18.6
-
4.7
-
49.4
2.9
2.7
0.2
5.5
2.2
2.0
Ltd
Navneet Education
Neutral
88
-
2,102
998
1,062
24.1
24.0
5.8
6.1
15.3
14.5
3.4
3.0
22.0
20.6
2.1
1.9
Navkar Corporation
Buy
188
265
2,685
365
436
38.3
37.5
5.6
5.9
33.4
32.0
2.1
2.0
6.3
6.1
7.9
6.8
UFO Moviez
Neutral
518
-
1,424
558
619
32.0
33.2
22.5
30.0
23.0
17.3
2.8
2.4
12.0
13.8
2.4
2.0
VRL Logistics
Neutral
384
-
3,502
1,725
1,902
16.5
16.7
12.2
14.6
31.5
26.4
6.6
5.8
20.8
21.9
2.2
1.9
Team Lease Serv.
Neutral
875
-
1,496
2,565
3,229
1.3
1.5
15.2
22.8
57.6
38.4
4.6
4.1
8.0
10.7
0.5
0.4
Stock Watch
April 18, 2016
Company Name
Reco
CMP
Target Mkt Cap
Sales ( Čcr )
OPM(%)
EPS (Č)
PER(x)
P/BV(x)
RoE(%)
EV/Sales(x)
(Č)
Price ( Č)
( Č cr )
FY16E FY17E FY16E FY17E FY16E FY17E FY16E FY17E FY16E FY17E FY16E FY17E FY16E FY17E
zOthers
S H Kelkar & Co.
Neutral
240
-
3,472
928
1,036
15.3
15.1
4.9
6.1
48.6
39.3
4.6
4.2
9.4
10.7
3.6
3.2
Quick Heal
Neutral
222
-
1,552
339
408
27.8
27.3
7.1
7.7
31.3
28.6
2.7
2.7
8.5
9.3
3.5
3.0
Narayana Hrudaya
Neutral
296
-
6,039
1,603
1,873
10.9
11.5
1.0
2.6
310.2
111.7
7.5
6.9
2.4
6.1
4.0
3.4
Manpasand Bever.
Neutral
496
-
2,482
540
836
19.9
19.6
10.2
16.9
48.4
29.3
3.9
3.5
8.1
12.0
4.3
2.7
Source: Company, Angel Research; Note: *December year end; #September year end; &October year end; Price as on April 13, 2016
Market Outlook
April 18, 2016
Research Team Tel: 022 - 39357800
DISCLAIMER
Angel Broking Private Limited (hereinafter referred to as “Angel”) is a registered Member of National Stock Exchange of India Limited,
Bombay Stock Exchange Limited and Metropolitian Stock Exchange of India Limited. It is also registered as a Depository Participant with
CDSL and Portfolio Manager with SEBI. It also has registration with AMFI as a Mutual Fund Distributor. Angel Broking Private Limited is a
registered entity with SEBI for Research Analyst in terms of SEBI (Research Analyst) Regulations, 2014 vide registration number
INH000000164. Angel or its associates has not been debarred/ suspended by SEBI or any other regulatory authority for accessing
/dealing in securities Market. Angel or its associates including its relatives/analyst do not hold any financial interest/beneficial ownership
of more than 1% in the company covered by Analyst. Angel or its associates/analyst has not received any compensation / managed or co
-managed public offering of securities of the company covered by Analyst during the past twelve months. Angel/analyst has not served as
an officer, director or employee of company covered by Analyst and has not been engaged in market making activity of the company
covered by Analyst.
This document is solely for the personal information of the recipient, and must not be singularly used as the basis of any investment
decision. Nothing in this document should be construed as investment or financial advice. Each recipient of this document should make
such investigations as they deem necessary to arrive at an independent evaluation of an investment in the securities of the companies
referred to in this document (including the merits and risks involved), and should consult their own advisors to determine the merits and
risks of such an investment.
Reports based on technical and derivative analysis center on studying charts of a stock's price movement, outstanding positions and
trading volume, as opposed to focusing on a company's fundamentals and, as such, may not match with a report on a company's
fundamentals.
The information in this document has been printed on the basis of publicly available information, internal data and other reliable sources
believed to be true, but we do not represent that it is accurate or complete and it should not be relied on as such, as this document is for
general guidance only. Angel Broking Pvt. Limited or any of its affiliates/ group companies shall not be in any way responsible for any
loss or damage that may arise to any person from any inadvertent error in the information contained in this report. Angel Broking Pvt.
Limited has not independently verified all the information contained within this document. Accordingly, we cannot testify, nor make any
representation or warranty, express or implied, to the accuracy, contents or data contained within this document. While Angel Broking
Pvt. Limited endeavors to update on a reasonable basis the information discussed in this material, there may be regulatory, compliance,
or other reasons that prevent us from doing so.
This document is being supplied to you solely for your information, and its contents, information or data may not be reproduced,
redistributed or passed on, directly or indirectly.
Neither Angel Broking Pvt. Limited, nor its directors, employees or affiliates shall be liable for any loss or damage that may arise from or
in connection with the use of this information.
Note: Please refer to the important ‘Stock Holding Disclosure' report on the Angel website (Research Section). Also, please refer to the
latest update on respective stocks for the disclosure status in respect of those stocks. Angel Broking Pvt. Limited and its affiliates may have
investment positions in the stocks recommended in this report.