Market Outlook
February 18, 2016
Market Cues
Domestic Indices
Chg (%)
(Pts)
(Close)
Indian markets are expected to open positively tracking the SGX Nifty and some of
BSE Sensex
0.8
190
23,382
its Asian peers.
Nifty
0.9
60
7,108
U.S. markets closed more than 1.5% higher Wednesday for their largest three-day
Mid Cap
0.5
45
9,753
gain since late August, helped by some recovery in oil prices and encouraging
Small Cap
0.2
21
9,803
economic data.
Bankex
(0.2)
(38)
16,044
European markets finished sharply higher on Wednesday as investors cheered the
recovery in oil prices and mining stocks.
Global Indices
Chg (%)
(Pts)
(Close)
Indian markets recovered lost ground to end notably higher on Wednesday after
Dow Jones
1.6
257
16,454
European markets rallied in early trade on the back of some upbeat earnings
Nasdaq
2.2
98
4,534
reports and optimism that global central banks will launch more easing to counter
FTSE
2.9
168
6,030
the slowdown.
Nikkei
(1.4)
(218)
15,836
News & Result Analysis
Hang Seng
(1.0)
(198)
18,925
Maruti Suzuki to increase output from Gurgaon, Manesar plants
Shanghai Com
1.1
31
2,867
L&T eyes road sector as govt focuses on highways
Detailed analysis on Pg2
Advances / Declines
BSE
NSE
Investor’s Ready Reckoner
Advances
1,080
273
Key Domestic & Global Indicators
Declines
1,490
1,290
Unchanged
136
45
Stock Watch: Latest investment recommendations on 150+ stocks
Refer P4 onwards
Volumes (` Cr)
Top Picks
BSE
2,605
CMP
Target
Upside
Company
Sector
Rating
(`)
(`)
(%)
NSE
16,068
Amara Raja Batteries Auto & Auto Ancillary
Buy
845
1,040
23.1
HCL Tech
IT
Buy
825
1,038
25.9
Net Inflows (` Cr)
Net
Mtd
Ytd
LIC Housing Finance Financials
Buy
407
592
45.2
FII
(1,123)
(4,181)
(12,554)
Bharat Electronics
Capital Goods
Buy
1,120
1,414
26.2
MFs
894
1,919
80,246
Navkar Corporation Others
Buy
162
265
63.6
More Top Picks on Pg3
Top Gainers
Price (`)
Chg (%)
Key Upcoming Events
Justdial
526
18.6
Previous
Consensus
Date
Region
Event Description
Reading
Expectations
Sadbhav
244
7.4
Feb 18 US
Initial jobless claims (Thousands)
269
275
Bhusanstl
36
5.9
Feb 18 China
Consumer price index (%)
1.6
1.9
Adaniports
212
5.8
Feb 19 US
Consumer price index (%)
(0.1)
(0.1)
Bankbaroda
138
5.6
Feb 22 Germany
PMI Services
55.0
-
6.(
Top Losers
Price (`)
Chg (%)
Gdl
216
(6.8)
Titan
327
(6.3)
Jisljaleqs
48
(5.4)
Centralbk
49
(4.9)
Jppower
5
(4.6)
As on February 16, 2016
Market Outlook
February 18, 2016
Maruti Suzuki to increase output from Gurgaon, Manesar plants
India's largest car maker Maruti Suzuki is likely to increase output from existing
plants in Gurgaon and Manesar to meet current demand till the new plant in
Gujarat goes on stream by January 2017. As per management, the company
which is likely to close FY16 with a capacity of 1.45 million units, is likely create an
additional 1 lakh to 1.2 lakh output next year.
L&T eyes road sector as govt focuses on highways
As the government looks to double the length of the country's highways to 2 lakh
km, engineering and construction giant Larsen & Toubro has said it sees huge
opportunities in the sector. It has, however, listed out a number of challenges
facing the roads sector, including funding constraints.
In the last two weeks alone the government has bid out 31 projects worth
`28,000cr, of which nearly half were under the EPC mode. L&T also eyes
"expressway projects by state governments, elevated corridors and ring roads in
major cities" as some of the other opportunities in the investor presentation besides
dedicated freight corridor programme and highway projects in the Middle East.
L&T is India's largest E&C company with interests in projects, infrastructure,
development and manufacturing, among others. Its revenues stood at USD 15
billion last year and the company has a market cap of USD 18 billion as on
December 31.L&T is aiming to restructure its top management as part of
succession plan as well as making efforts to expand global presence.
Economic and Political News
Gujarat eyes `4,000 cr investment commitments in tourism sector
Petrol price cut 32 paise, diesel price increased 28 paise per liter
Mines ministry wants 10 pc export duty on Goan iron ore to go
Corporate News
ABG Shipyard to get strategic investor by end-March
Idea picks Ericsson for 4G rollout in Maharashtra, MP & Himachal Pradesh
Dr Reddy's plans to pursue inorganic opportunities
Market Outlook
February 18, 2016
Top Picks ★★★★★
Large Cap
Market Cap
CMP
Target
Upside
Company
Rationale
(` Cr)
(`)
(`)
(%)
To outpace battery industry growth due to better technological
Amara Raja Batteries
14,433
845
1,040
23.1
products leading to market share gains in both the automotive
OEM and replacement segments.
Earnings to grow strongly given the MHCV cyclical upturn.
Ashok Leyland
25,641
90
111
23.2
Focus on exports and LCV's provides additional growth
avenue.
Uptick in defense capex by government when coupled with
Bharat Electronics
26,882
1,120
1,414
26.2
BELs strong market positioning, indicate that good times are
ahead for BEL.
The stock is trading at attractive valuations and is factoring all
HCL Tech
1,16,212
825
1,038
25.9
the bad news.
Strong visibility for a robust 20% earnings trajectory, coupled
HDFC Bank
2,46,345
975
1,262
29.4
with high quality of earnings on account of high quality retail
business and strategic focus on highly rated corporates.
Back on the growth trend, expect a long term growth of 14%
Infosys
2,51,619
1,095
1,347
23.0
to be a US$20bn in FY2020.
LICHF continues to grow its retail loan book at a healthy pace
with improvement in asset quality. We expect the company to
LIC Housing Finance
20,560
407
592
45.2
post a healthy loan book which is likely to reflect in a strong
earnings growth.
Huge bid pipeline of re-development works at Delhi and other
NBCC
10,280
857
1,089
27.1
State Governments and opportunity from Smart City, positions
NBCC to report strong growth, going forward.
New launches to enable outpace industry growth; margins
TVS Motors
13,393
282
330
17.1
expansion to boost earnings.
Source: Company, Angel Research
Mid Cap
Market Cap
CMP
Target
Upside
Company
Rationale
(` Cr)
(`)
(`)
(%)
Favourable outlook for the AC industry to augur well for
Cooling products business which is out pacing the market
Blue Star
3,051
339
439
29.4
growth. EMPPAC division's profitability to improve once
operating environment turns around.
Economic recovery to have favourable impact on advertising &
circulation revenue growth. Further, the acquisition of a radio
Jagran Prakashan
5,074
155
189
21.8
business (Radio City) would also boost the company's revenue
growth.
Massive capacity expansion along with rail advantage at ICD
Navkar Corporation
2,310
162
265
63.6
as well CFS augurs well for the company
Earnings boost on back of stable material prices and
Radico Khaitan
1,310
99
156
58.4
favourable pricing environment. Valuation discount to peers
provides additional comfort
Strong brands and distribution network would boost growth
Siyaram Silk Mills
925
987
1,354
37.1
going ahead. Stock currently trades at an inexpensive
valuation.
Source: Company, Angel Research
Market Outlook
February 18, 2016
Key Upcoming Events
Global economic events release calendar
Date
Time
Country
Event Description
Unit
Period
Bloomberg Data
Last Reported Estimated
Feb 18, 2016
7:00PM
US
Initial Jobless claims
Thousands
Feb 13
269.00
275.00
7:00AM
China
Consumer Price Index (YoY)
% Change
Jan
1.60
1.90
Feb 19, 2016
7:00PM
US
Consumer price index (mom)
% Change
Jan
(0.10)
(0.10)
8:30PM
Euro Zone
Euro-Zone Consumer Confidence
Value
Feb A
(6.30)
(6.60)
Feb 22, 2016
2:00PM
Germany
PMI Services
Value
Feb P
55.00
--
2:00PM
Germany
PMI Manufacturing
Value
Feb P
52.30
--
Feb 23, 2016
12:30PM
Germany
GDP nsa (YoY)
% Change
4Q F
2.10
--
8:30PM
US
Existing home sales
Million
Jan
5.46
5.40
8:30PM
US
Consumer Confidence
S.A./ 1985=100
Feb
98.10
97.50
Feb 24, 2016
8:30PM
US
New home sales
Thousands
Jan
544.00
525.00
Feb 25, 2016
3:00PM
UK
GDP (YoY)
% Change
4Q P
1.90
--
3:30PM
Euro Zone
Euro-Zone CPI (YoY)
%
Jan F
0.40
--
Feb 26, 2016
7:00PM
US
GDP Qoq (Annualised)
% Change
4Q S
0.70
0.40
Mar 1, 2016
3:00PM
UK
PMI Manufacturing
Value
Feb
52.90
--
6:30AM
China
PMI Manufacturing
Value
Feb
49.40
--
2:25PM
Germany
Unemployment change (000's)
Thousands
Feb
(20.00)
--
Mar 4, 2016
7:00PM
US
Change in Nonfarm payrolls
Thousands
Feb
151.00
--
7:00PM
US
Unnemployment rate
%
Feb
4.90
--
Mar 8, 2016
China
Exports YoY%
% Change
Feb
(11.20)
--
3:30PM
Euro Zone
Euro-Zone GDP s.a. (QoQ)
% Change
4Q P
0.30
--
Mar 9, 2016
3:00PM
UK
Industrial Production (YoY)
% Change
Jan
(0.40)
--
Mar 10, 2016
India
Imports YoY%
% Change
Feb
(11.00)
--
India
Exports YoY%
% Change
Feb
(13.60)
--
6:15PM
Euro Zone
ECB announces interest rates
%
Mar 10
0.05
--
Source: Bloomberg, Angel Research
Market Outlook
February 18, 2016
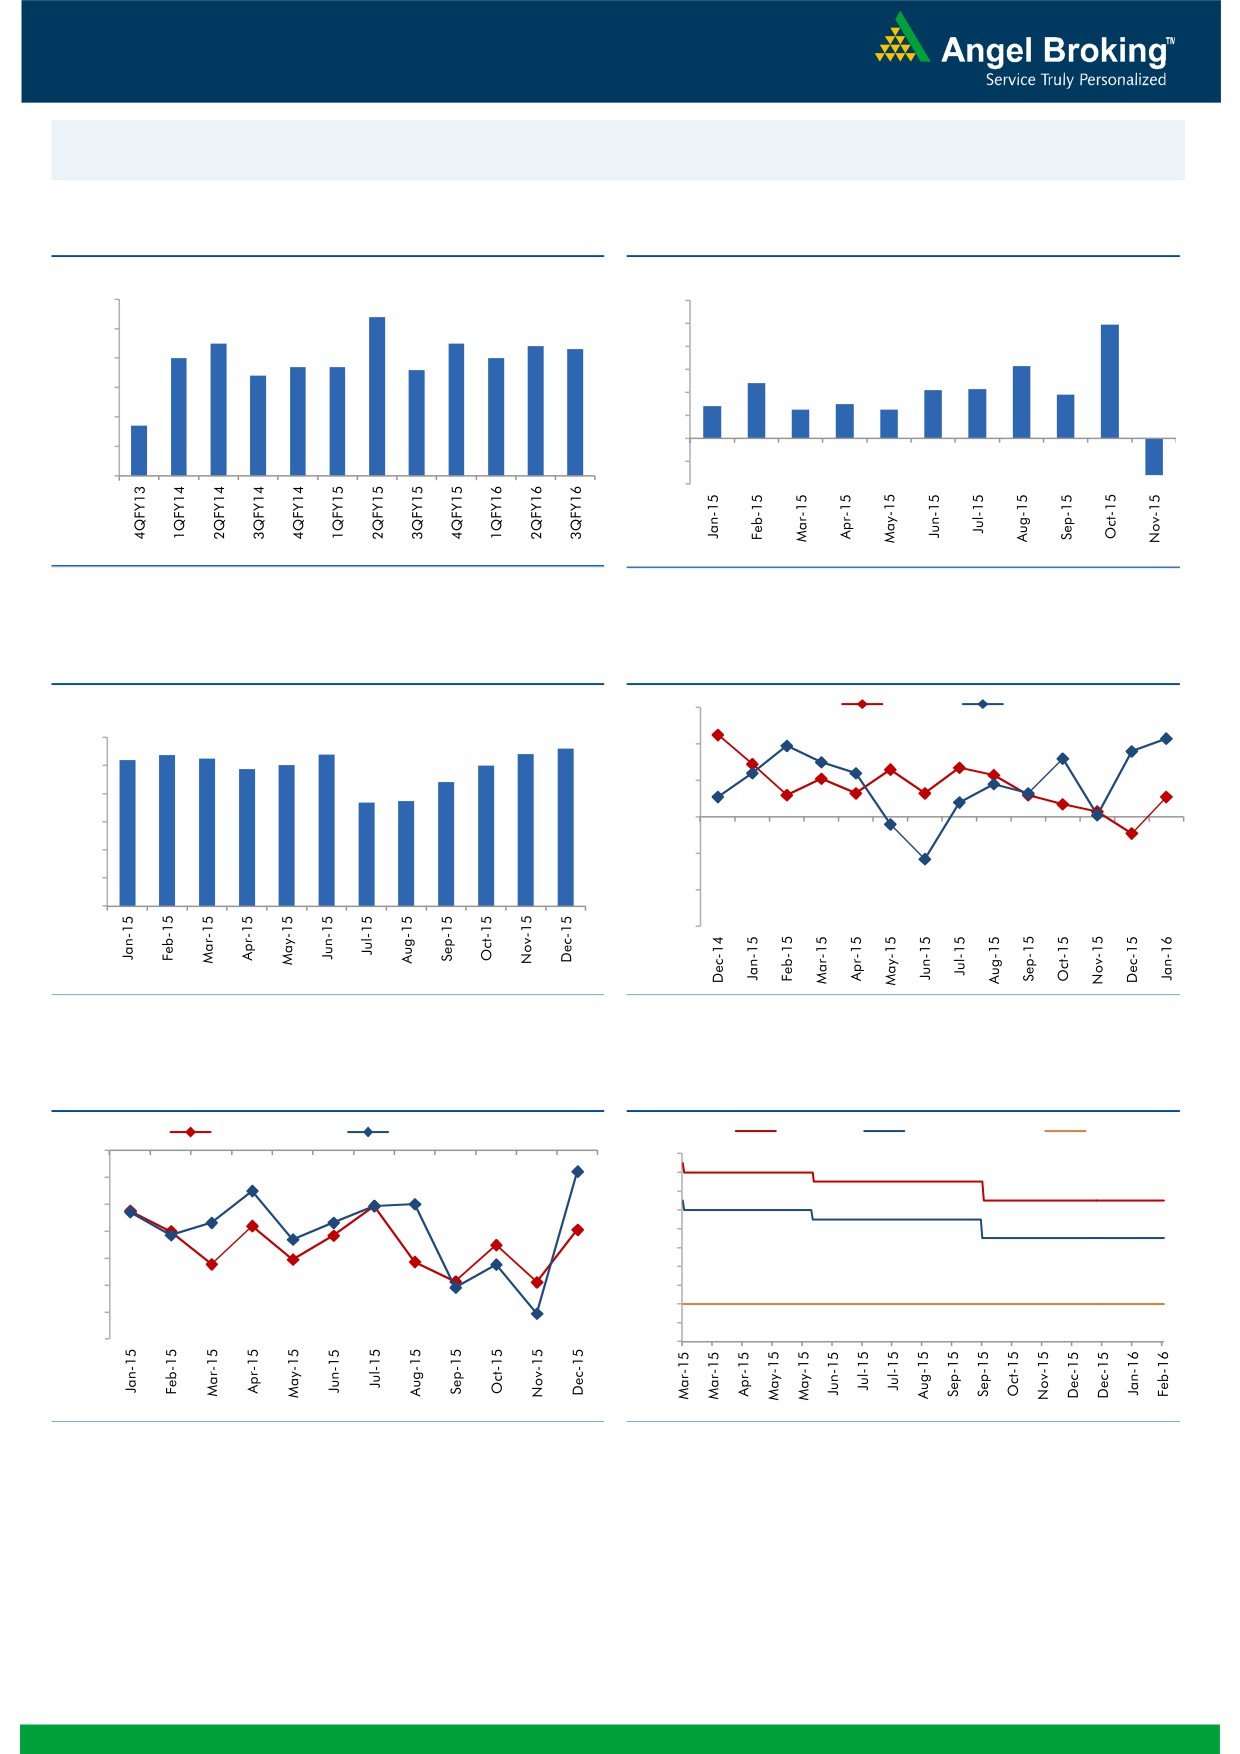
Macro watch
Exhibit 1: Quarterly GDP trends
Exhibit 2: IIP trends
(%)
(%)
9.0
8.4
12.0
9.9
7.5
7.5
10.0
8.0
7.4
7.3
7.0
7.0
6.7
6.7
6.6
8.0
6.3
7.0
6.4
6.0
4.8
4.3
4.2
3.8
6.0
2.8
3.0
4.0
2.5
2.5
4.7
5.0
2.0
(3.2)
-
4.0
(2.0)
3.0
(4.0)
Source: CSO, Angel Research
Source: MOSPI, Angel Research
Exhibit 3: Monthly CPI inflation trends
Exhibit 4: Manufacturing and services PMI
(%)
56.0
Mfg. PMI
Services PMI
6.0
5.4
5.4
5.4
5.6
5.2
5.3
54.0
4.9
5.0
5.0
5.0
4.4
3.7
3.7
52.0
4.0
3.0
50.0
2.0
48.0
1.0
46.0
-
44.0
Source: MOSPI, Angel Research
Source: Market, Angel Research; Note: Level above 50 indicates expansion
Exhibit 5: Exports and imports growth trends
Exhibit 6: Key policy rates
(%)
Exports yoy growth
Imports yoy growth
(%)
Repo rate
Reverse Repo rate
CRR
0.0
8.00
(5.0)
7.50
7.00
(10.0)
6.50
(15.0)
6.00
5.50
(20.0)
5.00
(25.0)
4.50
4.00
(30.0)
3.50
(35.0)
3.00
Source: Bloomberg, Angel Research
Source: RBI, Angel Research
Market Outlook
February 18, 2016
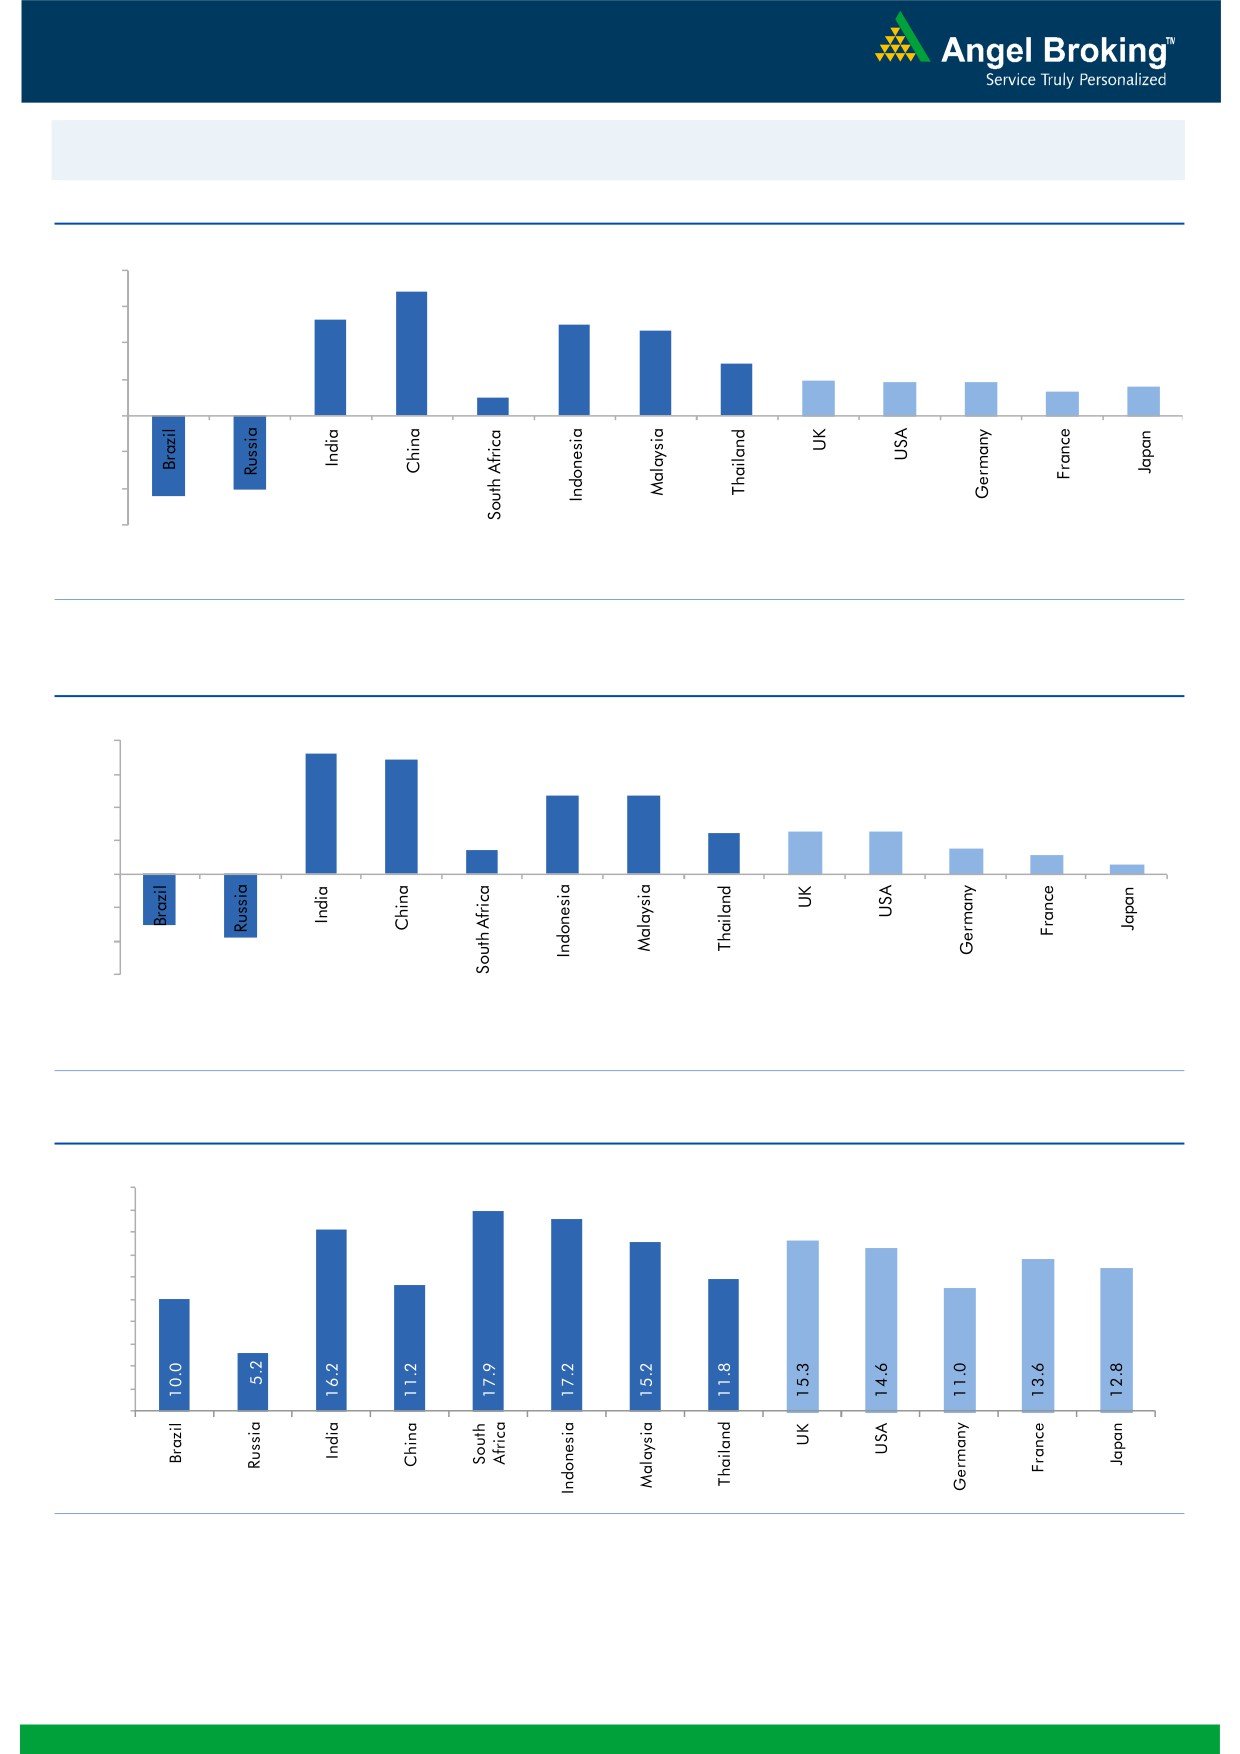
Global watch
Exhibit 1: Latest quarterly GDP Growth (%, yoy) across select developing and developed countries
(%)
8.0
6.8
5.3
6.0
5.0
4.7
4.0
2.9
1.9
1.8
1.8
1.3
1.6
2.0
1.0
(4.5)
(4.1)
-
(2.0)
(4.0)
(6.0)
Source: Bloomberg, Angel Research
Exhibit 2: 2015 GDP Growth projection by IMF (%, yoy) across select developing and developed countries
(%)
7.3
8.0
6.8
6.0
4.7
4.7
4.0
2.5
2.5
2.6
1.4
1.5
2.0
1.2
0.6
(3.0)
(3.8)
-
(2.0)
(4.0)
(6.0)
Source: IMF, Angel Research
Exhibit 3: One year forward P-E ratio across select developing and developed countries
(x)
20.0
18.0
16.0
14.0
12.0
10.0
8.0
6.0
4.0
2.0
-
Source: IMF, Angel Research
Market Outlook
February 18, 2016
Exhibit 4: Relative performance of indices across globe
Returns (%)
Country
Name of index
Closing price
1M
3M
1YR
Brazil
Bovespa
41,631
6.9
(9.9)
(15.4)
Russia
Micex
1,770
9.1
2.4
(1.7)
India
Nifty
7,108
(4.4)
(8.9)
(18.4)
China
Shanghai Composite
2,867
(4.7)
(20.7)
(10.1)
South Africa
Top 40
44,592
5.9
(3.8)
(4.5)
Mexico
Mexbol
43,585
6.7
(0.1)
0.8
Indonesia
LQ45
836
6.5
10.4
(8.3)
Malaysia
KLCI
1,664
1.4
(1.3)
(8.2)
Thailand
SET 50
815
5.6
(8.3)
(24.2)
USA
Dow Jones
16,454
0.5
(5.7)
(8.7)
UK
FTSE
6,030
4.3
(1.9)
(12.5)
Japan
Nikkei
15,836
(7.6)
(19.6)
(10.3)
Germany
DAX
9,377
(1.5)
(12.4)
(14.8)
France
CAC
4,233
1.0
(14.3)
(13.4)
Source: Bloomberg, Angel Research
Stock Watch
February 18, 2016
Company Name
Reco
CMP
Target
Mkt Cap
Sales ( Čcr )
OPM(%)
EPS (Č)
PER(x)
P/BV(x)
RoE(%)
EV/Sales(x)
(Č)
Price ( Č)
( Č cr )
FY16E FY17E
FY16E
FY17E
FY16E
FY17E
FY16E
FY17E
FY16E
FY17E
FY16E
FY17E
FY16E
FY17E
Agri / Agri Chemical
Rallis
Neutral
146
-
2,830
2,097
2,415
14.4
14.4
9.5
11.0
15.3
13.2
3.0
2.6
21.1
21.3
1.4
1.2
United Phosphorus
Buy
395
480
16,923
12,500
14,375
18.3
18.3
29.8
35.9
13.3
11.0
2.4
2.1
20.0
20.3
1.4
1.2
Auto & Auto Ancillary
Ashok Leyland
Buy
90
111
25,641
17,995
21,544
11.4
11.6
3.4
4.7
26.5
19.2
4.6
4.3
17.7
22.2
1.4
1.1
Bajaj Auto
Accumulate
2,357
2,585
68,201
22,709
25,860
20.9
20.1
129.0
143.6
18.3
16.4
5.6
4.8
30.7
29.4
2.5
2.2
Bharat Forge
Buy
785
943
18,278
7,867
8,881
20.0
20.3
34.4
41.0
22.8
19.2
4.4
3.7
21.1
20.9
2.4
2.1
Eicher Motors
Accumulate
18,803
20,044
51,070
15,556
16,747
15.5
17.3
464.8
597.5
40.5
31.5
14.8
10.9
36.2
34.3
3.2
2.9
Gabriel India
Buy
79
101
1,130
1,415
1,544
8.7
9.0
4.6
5.4
17.1
14.6
3.1
2.8
18.1
18.9
0.8
0.7
Hero Motocorp
Accumulate
2,524
2,864
50,399
28,244
30,532
15.5
15.9
156.7
168.5
16.1
15.0
6.4
5.5
39.9
36.4
1.6
1.5
Jamna Auto Industries Buy
128
160
1,025
1,281
1,473
11.2
11.5
7.6
9.2
16.9
14.0
4.3
3.5
25.4
25.2
0.9
0.7
L G Balakrishnan & Bros Neutral
418
-
657
1,254
1,394
11.6
11.8
35.9
41.7
11.7
10.1
1.6
1.4
13.5
13.8
0.6
0.6
Mahindra and Mahindra Accumulate
1,203
1,364
74,714
38,416
42,904
13.7
13.9
54.8
63.4
22.0
19.0
3.4
3.0
15.4
15.8
1.6
1.4
Maruti
Neutral
3,750
-
113,274
57,865
68,104
16.4
16.7
176.3
225.5
21.3
16.6
4.1
3.5
19.4
21.2
1.7
1.4
Minda Industries
Buy
753
1,047
1,194
2,523
2,890
8.7
9.0
55.0
65.4
13.7
11.5
2.6
2.2
19.3
18.7
0.6
0.5
Motherson Sumi
Buy
223
313
29,523
39,343
45,100
8.8
9.1
10.1
12.5
22.1
17.9
7.0
5.5
35.3
34.4
0.8
0.7
Rane Brake Lining
Buy
336
465
266
454
511
11.5
12.0
25.2
31.0
13.3
10.8
2.0
1.8
14.9
16.6
0.7
0.7
Setco Automotive
Neutral
29
-
387
594
741
12.7
13.7
1.7
3.2
17.1
9.1
1.8
1.6
10.4
16.9
1.1
0.9
Tata Motors
Buy
310
371
89,532
259,686
273,957
13.0
13.4
25.9
29.5
12.0
10.5
1.6
1.4
8.0
9.0
0.5
0.5
TVS Motor
Buy
282
330
13,393
11,263
13,122
6.9
8.5
9.2
15.0
30.6
18.8
7.0
5.6
22.7
29.6
1.2
1.0
Amara Raja Batteries
Buy
845
1,040
14,433
4,892
5,871
17.4
17.6
28.8
37.1
29.3
22.8
6.9
5.5
23.4
24.1
2.9
2.4
Exide Industries
Buy
124
162
10,549
6,950
7,784
14.4
14.8
6.6
7.3
18.8
17.0
2.4
2.2
12.6
12.8
1.2
1.1
Apollo Tyres
Accumulate
159
171
8,109
12,146
12,689
16.8
16.0
21.2
19.0
7.5
8.4
1.2
1.1
16.5
13.0
0.7
0.8
Ceat
Buy
952
1,119
3,851
6,041
6,597
14.1
13.7
99.5
111.9
9.6
8.5
1.9
1.6
19.6
18.5
0.8
0.7
JK Tyres
Neutral
81
-
1,834
7,446
7,669
15.2
14.0
19.6
18.4
4.1
4.4
1.0
0.9
25.2
19.5
0.6
0.5
Swaraj Engines
Buy
790
919
981
552
630
14.2
14.7
44.6
54.1
17.7
14.6
4.1
3.8
23.2
25.6
1.6
1.4
Subros
Neutral
80
-
481
1,293
1,527
11.8
11.9
4.2
6.7
19.1
12.0
1.4
1.3
7.7
11.5
0.7
0.6
Indag Rubber
Neutral
160
-
420
283
329
17.0
17.2
13.0
15.4
12.4
10.4
2.7
2.2
21.8
21.6
1.2
1.0
Capital Goods
ACE
Neutral
34
-
338
660
839
4.7
8.2
1.0
3.9
34.2
8.8
1.1
1.0
3.2
11.3
0.7
0.5
BEML
Neutral
957
-
3,984
3,277
4,006
6.0
8.9
29.2
64.3
32.8
14.9
1.8
1.7
5.7
11.7
1.3
1.0
Bharat Electronics
Buy
1,120
1,414
26,882
7,737
8,634
16.8
17.2
54.0
61.5
20.7
18.2
3.0
2.6
39.3
45.6
2.6
2.2
Stock Watch
February 18, 2016
Company Name
Reco
CMP
Target
Mkt Cap
Sales ( Čcr )
OPM(%)
EPS (Č)
PER(x)
P/BV(x)
RoE(%)
EV/Sales(x)
(Č)
Price ( Č)
( Č cr )
FY16E
FY17E
FY16E
FY17E
FY16E
FY17E
FY16E
FY17E
FY16E
FY17E
FY16E
FY17E
FY16E
FY17E
Capital Goods
Voltas
Buy
236
353
7,799
5,363
5,963
8.0
9.1
11.0
13.8
21.4
17.1
3.3
2.9
16.2
17.9
1.4
1.2
BGR Energy
Neutral
97
-
700
3,615
3,181
9.5
9.4
16.7
12.4
5.8
7.8
0.5
0.5
10.0
7.0
0.6
0.8
BHEL
Neutral
106
-
25,883
33,722
35,272
10.8
11.7
10.5
14.2
10.1
7.5
0.7
0.7
7.0
9.0
0.8
0.8
Blue Star
Buy
339
439
3,051
3,548
3,977
6.3
6.9
13.7
17.2
24.8
19.8
6.2
4.1
26.1
25.4
1.0
0.8
Crompton Greaves
Neutral
121
-
7,587
13,484
14,687
4.9
6.2
4.5
7.1
26.9
17.1
1.9
1.8
7.2
10.8
0.7
0.6
Greaves Cotton
Neutral
125
-
3,059
1,655
1,755
16.6
16.8
7.4
7.8
16.9
16.1
3.4
3.2
21.1
20.6
1.8
1.7
Inox Wind
Buy
232
458
5,149
4,980
5,943
17.0
17.5
26.6
31.6
8.7
7.3
2.6
1.9
35.0
30.0
1.2
0.9
KEC International
Neutral
104
-
2,684
8,791
9,716
6.1
6.8
5.4
8.2
19.3
12.7
1.9
1.8
10.0
14.0
0.5
0.5
Thermax
Neutral
778
-
9,276
6,413
7,525
7.4
8.5
30.5
39.3
25.5
19.8
3.9
3.4
15.0
17.0
1.4
1.2
Cement
ACC
Neutral
1,226
-
23,020
13,151
14,757
16.4
18.3
63.9
83.4
19.2
14.7
2.5
2.3
13.3
16.1
1.6
1.3
Ambuja Cements
Neutral
193
-
29,998
11,564
12,556
19.4
20.7
8.9
10.1
21.7
19.1
2.7
2.6
12.8
13.8
2.2
2.0
HeidelbergCement
Neutral
62
-
1,412
1,772
1,926
13.3
15.4
1.0
3.0
62.3
20.8
1.6
1.5
2.6
7.9
1.4
1.2
India Cements
Neutral
71
-
2,172
4,216
4,840
18.0
19.5
4.0
9.9
17.7
7.1
0.7
0.7
4.0
9.5
0.8
0.7
JK Cement
Buy
446
615
3,114
3,661
4,742
10.1
15.8
18.0
61.0
24.8
7.3
1.8
1.6
7.5
22.9
1.3
1.0
J K Lakshmi Cement
Neutral
257
-
3,028
2,947
3,616
16.7
19.9
11.5
27.2
22.4
9.5
2.1
1.8
9.8
20.8
1.4
1.1
Mangalam Cements
Neutral
164
-
437
1,053
1,347
10.5
13.3
8.4
26.0
19.5
6.3
0.8
0.8
4.3
12.5
0.8
0.6
Orient Cement
Neutral
132
-
2,695
1,854
2,524
21.2
22.2
7.7
11.1
17.1
11.9
2.5
2.1
13.3
15.7
2.2
1.5
Ramco Cements
Neutral
371
-
8,822
4,036
4,545
20.8
21.3
15.1
18.8
24.5
19.7
3.0
2.7
12.9
14.3
2.7
2.3
Shree Cement^
Neutral
10,031
-
34,945
7,150
8,742
26.7
28.6
228.0
345.5
44.0
29.0
6.5
5.4
15.7
20.3
4.6
3.7
UltraTech Cement
Accumulate
2,775
3,107
76,151
25,021
30,023
19.1
21.6
89.0
132.0
31.2
21.0
3.6
3.1
12.2
15.9
3.1
2.6
Construction
ITNL
Neutral
68
-
2,245
7,360
8,825
34.0
35.9
7.0
9.0
9.8
7.6
0.3
0.3
3.2
3.7
3.7
3.6
KNR Constructions
Buy
438
673
1,231
937
1,470
14.3
14.0
33.5
38.6
13.1
11.3
2.0
1.7
15.4
15.4
1.4
0.9
Larsen & Toubro
Buy
1,122
1,310
104,526
58,870
65,708
8.3
10.3
42.0
53.0
26.7
21.2
1.9
1.7
8.8
11.2
2.0
1.8
Gujarat Pipavav Port
Neutral
154
-
7,443
629
684
51.0
52.2
6.4
5.9
24.1
26.1
3.2
2.9
15.9
12.7
11.5
10.4
MBL Infrastructures
Buy
136
285
564
2,313
2,797
12.2
14.6
19.0
20.0
7.2
6.8
0.8
0.7
11.3
10.6
1.0
0.9
Nagarjuna Const.
Neutral
65
-
3,605
7,892
8,842
8.8
9.1
3.0
5.3
21.6
12.2
1.1
1.0
5.0
8.5
0.7
0.6
PNC Infratech
Accumulate
514
558
2,637
1,873
2,288
13.2
13.5
24.0
32.0
21.4
16.1
2.1
1.9
12.1
12.3
1.5
1.2
Simplex Infra
Neutral
220
-
1,089
5,955
6,829
10.3
10.5
16.0
31.0
13.8
7.1
0.7
0.7
5.3
9.9
0.7
0.6
Power Mech Projects
Neutral
549
-
807
1,539
1,801
12.8
12.7
59.0
72.1
9.3
7.6
1.4
1.2
18.6
16.8
0.5
0.5
Stock Watch
February 18, 2016
Company Name
Reco
CMP
Target
Mkt Cap
Sales ( Čcr )
OPM(%)
EPS (Č)
PER(x)
P/BV(x)
RoE(%)
EV/Sales(x)
(Č)
Price ( Č)
( Č cr )
FY16E
FY17E
FY16E
FY17E
FY16E
FY17E
FY16E
FY17E
FY16E
FY17E
FY16E
FY17E
FY16E
FY17E
Construction
Sadbhav Engineering
Neutral
243
-
4,173
3,481
4,219
10.7
10.8
8.0
12.0
30.4
20.3
2.8
2.5
10.3
13.5
1.5
1.2
NBCC
Buy
857
1,089
10,280
5,816
7,382
6.9
7.7
29.6
39.8
28.9
21.5
5.2
4.1
24.1
26.7
1.5
1.1
MEP Infra
Neutral
41
-
668
1,956
1,876
28.1
30.5
1.3
3.0
31.6
13.7
6.6
4.5
21.2
32.8
1.8
1.7
SIPL
Neutral
78
-
2,763
675
1,042
62.4
64.7
-
-
2.9
3.4
-
-
15.8
10.7
Financials
Allahabad Bank
Neutral
43
-
2,579
8,569
9,392
2.8
2.9
16.3
27.5
2.6
1.6
0.3
0.2
7.6
11.9
-
-
Axis Bank
Buy
404
494
96,049
26,473
31,527
3.5
3.6
35.7
43.5
11.3
9.3
1.9
1.6
17.9
18.9
-
-
Bank of Baroda
Neutral
138
-
31,867
18,485
21,025
1.9
2.0
13.5
21.1
10.3
6.5
0.8
0.7
7.3
10.6
-
-
Bank of India
Neutral
86
-
7,011
15,972
17,271
1.9
2.0
15.3
33.4
5.6
2.6
0.3
0.2
3.6
7.6
-
-
Canara Bank
Neutral
174
-
9,445
15,441
16,945
2.0
2.1
46.6
70.4
3.7
2.5
0.3
0.3
8.0
11.2
-
-
Dena Bank
Neutral
28
-
1,826
3,440
3,840
2.1
2.3
7.3
10.0
3.9
2.8
0.3
0.2
6.1
7.9
-
-
Federal Bank
Neutral
46
-
7,850
3,477
3,999
3.0
3.0
5.0
6.2
9.1
7.3
0.9
0.8
10.6
11.9
-
-
HDFC
Neutral
1,077
-
169,998
10,358
11,852
3.3
3.3
41.1
47.0
26.2
22.9
5.0
4.5
24.7
24.9
-
-
HDFC Bank
Buy
975
1,262
246,345
38,309
47,302
4.3
4.3
49.3
61.1
19.8
16.0
3.4
2.9
18.5
19.7
-
-
ICICI Bank
Buy
191
254
110,850
34,279
39,262
3.3
3.3
21.0
24.4
9.1
7.8
1.5
1.3
14.4
14.7
-
-
IDBI Bank
Neutral
53
-
10,070
9,625
10,455
1.8
1.8
8.5
14.2
6.2
3.7
0.4
0.4
5.9
9.3
-
-
Indian Bank
Neutral
87
-
4,191
6,160
6,858
2.5
2.5
24.5
29.8
3.6
2.9
0.3
0.3
7.7
8.6
-
-
LIC Housing Finance
Buy
407
592
20,560
3,101
3,745
2.5
2.5
33.0
40.2
12.4
10.1
2.3
2.0
19.7
20.5
-
-
Oriental Bank
Neutral
82
-
2,472
7,643
8,373
2.4
2.4
37.2
45.4
2.2
1.8
0.2
0.2
8.2
9.4
-
-
Punjab Natl.Bank
Neutral
73
-
14,256
23,638
26,557
2.8
2.8
17.9
27.2
4.1
2.7
0.4
0.3
8.5
12.0
-
-
South Ind.Bank
Neutral
17
-
2,316
1,965
2,185
2.5
2.5
2.5
3.3
6.9
5.2
0.7
0.6
9.5
11.7
-
-
St Bk of India
Buy
159
202
123,545
82,520
93,299
2.7
2.8
20.0
24.5
8.0
6.5
0.9
0.8
11.5
12.8
-
-
Union Bank
Neutral
115
-
7,895
12,646
14,129
2.3
2.4
31.0
39.1
3.7
2.9
0.4
0.3
9.8
11.4
-
-
Vijaya Bank
Neutral
31
-
2,689
3,536
3,827
1.9
1.9
5.5
6.7
5.7
4.7
0.5
0.4
7.8
8.8
-
-
Yes Bank
Accumulate
721
767
30,272
7,190
9,011
3.2
3.3
58.2
69.7
12.4
10.4
2.2
1.9
19.2
19.6
-
-
FMCG
Asian Paints
Neutral
854
-
81,896
16,553
19,160
16.0
16.2
17.7
21.5
48.3
39.7
12.8
11.5
29.4
31.2
4.8
4.1
Britannia
Neutral
2,650
-
31,791
8,481
9,795
14.0
14.1
65.5
78.3
40.5
33.8
19.2
15.7
38.3
41.2
3.6
3.1
Colgate
Neutral
836
-
22,728
4,836
5,490
19.5
19.7
48.5
53.2
17.2
15.7
12.6
11.0
99.8
97.5
4.6
4.0
Dabur India
Accumulate
241
267
42,422
9,370
10,265
17.1
17.2
7.3
8.1
32.9
29.8
9.9
8.1
33.7
30.6
4.4
4.0
GlaxoSmith Con*
Accumulate
5,576
6,118
23,449
4,919
5,742
17.2
17.4
168.3
191.2
33.1
29.2
9.4
8.0
28.8
28.9
4.3
3.7
Stock Watch
February 18, 2016
Company Name
Reco
CMP
Target
Mkt Cap
Sales ( Čcr )
OPM(%)
EPS (Č)
PER(x)
P/BV(x)
RoE(%)
EV/Sales(x)
(Č)
Price ( Č)
( Č cr )
FY16E FY17E
FY16E
FY17E
FY16E
FY17E
FY16E
FY17E
FY16E
FY17E
FY16E
FY17E
FY16E
FY17E
FMCG
Godrej Consumer
Neutral
1,179
-
40,151
10,168
12,886
16.1
16.1
32.1
38.4
36.7
30.7
7.5
6.9
19.7
21.0
4.0
3.2
HUL
Neutral
812
-
175,750
34,940
38,957
17.5
17.7
20.8
24.7
39.0
32.9
43.4
34.7
110.5
114.2
4.8
4.3
ITC
Buy
300
359
240,866
36,804
38,776
37.9
37.9
12.2
12.9
24.6
23.2
6.8
6.0
27.7
25.8
6.1
5.8
Marico
Neutral
227
-
29,287
6,551
7,766
15.7
16.0
10.4
12.5
21.9
18.2
6.4
5.3
33.2
32.4
4.4
3.7
Nestle*
Buy
5,070
6,646
48,885
11,291
12,847
22.2
22.3
158.9
184.6
31.9
27.5
16.7
15.0
55.0
57.3
4.2
3.6
Tata Global
Buy
104
144
6,564
8,635
9,072
9.8
9.9
6.5
7.6
16.0
13.7
1.6
1.5
6.8
7.4
0.7
0.7
IT
HCL Tech^
Buy
825
1,038
116,212
42,038
47,503
21.2
21.5
51.5
57.7
16.0
14.3
3.5
2.7
21.5
18.8
2.4
1.9
Infosys
Buy
1,095
1,347
251,619
61,850
69,981
27.5
27.5
59.4
65.7
18.4
16.7
3.9
3.4
21.2
20.1
3.3
2.8
TCS
Buy
2,278
2,854
448,864
108,487
122,590
28.3
28.5
122.8
138.4
18.6
16.5
7.1
6.4
38.0
38.9
3.7
3.3
Tech Mahindra
Buy
430
646
41,609
25,566
28,890
16.0
17.0
26.3
31.9
16.4
13.5
2.9
2.5
17.9
18.6
1.4
1.2
Wipro
Buy
527
680
130,283
50,808
56,189
23.7
23.8
37.3
40.7
14.1
13.0
2.7
2.5
19.2
17.7
2.0
1.7
Media
D B Corp
Buy
307
356
5,637
2,241
2,495
27.8
27.9
21.8
25.6
14.1
12.0
3.7
3.3
26.7
28.5
2.5
2.2
HT Media
Neutral
79
-
1,843
2,495
2,603
11.2
11.2
7.3
8.6
10.9
9.2
0.9
0.8
7.4
8.1
0.2
0.2
Jagran Prakashan
Buy
155
189
5,074
2,170
2,355
27.2
26.2
8.9
9.9
17.4
15.7
3.7
3.2
20.9
20.5
2.2
2.1
Sun TV Network
Neutral
334
-
13,155
2,779
3,196
70.2
70.5
22.8
27.3
14.6
12.2
3.6
3.3
26.7
28.3
4.5
3.9
Hindustan Media
Neutral
268
-
1,966
920
1,031
20.0
20.0
19.2
20.9
14.0
12.8
2.3
2.0
16.4
15.3
1.7
1.5
Ventures
Metals & Mining
Coal India
Buy
313
380
197,671
76,167
84,130
19.9
22.3
22.4
25.8
14.0
12.1
5.0
4.9
35.5
41.0
1.9
1.7
Hind. Zinc
Accumulate
163
175
68,978
14,641
14,026
50.4
50.4
17.7
16.0
9.3
10.2
1.4
1.3
16.2
13.2
2.3
2.2
Hindalco
Neutral
66
-
13,619
104,356
111,186
8.7
9.5
6.7
11.1
9.8
6.0
0.4
0.3
3.5
5.9
0.7
0.6
JSW Steel
Neutral
1,045
-
25,267
42,308
45,147
16.4
20.7
(10.3)
49.5
21.1
1.2
1.1
(1.0)
5.6
1.6
1.5
NMDC
Neutral
89
-
35,365
8,237
10,893
46.6
44.5
10.0
11.7
9.0
7.7
1.0
0.9
12.5
13.0
4.1
3.1
SAIL
Neutral
36
-
14,910
45,915
53,954
7.2
10.5
1.5
4.4
24.0
8.3
0.4
0.3
2.3
4.1
1.0
0.9
Vedanta
Neutral
74
-
22,057
71,445
81,910
26.2
26.3
12.9
19.2
5.8
3.9
0.4
0.4
7.2
8.9
0.8
0.6
Tata Steel
Neutral
251
-
24,412
126,760
137,307
8.9
11.3
6.4
23.1
39.5
10.9
0.8
0.8
2.0
7.1
0.8
0.7
Oil & Gas
Cairn India
Neutral
126
-
23,586
11,323
12,490
49.4
51.0
20.7
20.7
6.1
6.1
0.4
0.4
6.4
6.1
1.2
0.5
GAIL
Neutral
324
-
41,149
64,856
70,933
9.1
9.6
24.0
28.9
13.5
11.2
1.2
1.1
8.8
9.6
0.8
0.7
ONGC
Neutral
200
-
170,981
154,564
167,321
36.8
37.4
28.6
32.5
7.0
6.2
0.9
0.8
12.7
13.5
1.3
1.2
Petronet LNG
Neutral
239
-
17,903
29,691
31,188
5.8
6.2
12.8
13.4
18.7
17.8
2.8
2.5
15.8
14.8
0.7
0.6
Indian Oil Corp
Buy
383
455
92,869
359,607
402,760
5.9
6.1
42.5
48.7
9.0
7.9
1.2
1.1
14.1
14.4
0.4
0.3
Stock Watch
February 18, 2016
Company Name
Reco
CMP
Target
Mkt Cap
Sales ( Čcr )
OPM(%)
EPS (Č)
PER(x)
P/BV(x)
RoE(%)
EV/Sales(x)
(Č)
Price ( Č)
( Č cr )
FY16E FY17E
FY16E
FY17E
FY16E
FY17E
FY16E
FY17E
FY16E
FY17E
FY16E
FY17E
FY16E
FY17E
Oil & Gas
Reliance Industries
Buy
952
1,150
308,537
304,775
344,392
12.6
13.4
91.3
102.6
10.4
9.3
1.2
1.1
11.8
12.0
0.9
0.8
Pharmaceuticals
Alembic Pharma
Neutral
609
-
11,476
3,274
3,802
26.9
19.4
35.0
28.7
17.4
21.2
7.7
5.8
55.6
31.2
3.5
2.9
Aurobindo Pharma
Buy
663
856
38,782
14,923
17,162
22.0
23.0
35.7
42.8
18.6
15.5
5.5
4.1
34.0
30.2
3.0
2.5
Aventis*
Neutral
4,176
-
9,617
2,082
2,371
17.4
20.8
118.2
151.5
35.3
27.6
5.2
4.2
19.9
25.5
4.3
3.6
Cadila Healthcare
Accumulate
314
352
32,156
10,224
11,840
21.0
22.0
14.6
17.6
21.5
17.9
5.9
4.6
30.8
29.0
3.2
2.7
Cipla
Buy
520
636
41,749
14,211
16,611
20.6
19.0
27.0
28.9
19.3
18.0
3.3
2.8
18.4
16.8
2.9
2.4
Dr Reddy's
Buy
2,961
3,933
50,496
16,838
19,575
25.0
23.1
167.5
178.8
17.7
16.6
3.7
3.1
23.1
20.4
2.9
2.5
Dishman Pharma
Neutral
313
-
2,525
1,733
1,906
21.5
21.5
17.0
19.9
18.4
15.7
1.9
1.7
10.5
11.2
2.0
1.7
GSK Pharma*
Neutral
3,195
-
27,062
2,870
3,158
20.0
22.1
59.5
68.3
53.7
46.8
15.8
16.3
28.5
34.3
8.9
8.2
Indoco Remedies
Neutral
260
-
2,398
1,033
1,199
15.9
18.2
9.4
13.6
27.7
19.1
4.1
3.5
15.7
19.7
2.4
2.1
Ipca labs
Buy
599
900
7,555
3,363
3,909
12.9
18.6
13.4
28.0
44.7
21.4
3.2
2.8
7.4
14.0
2.5
2.2
Lupin
Neutral
1,731
-
77,974
13,092
16,561
25.0
27.0
50.4
68.3
34.3
25.3
7.1
5.6
22.8
24.7
5.7
4.4
Sun Pharma
Accumulate
855
950
205,657
28,163
32,610
25.8
30.7
17.4
26.9
49.1
31.8
4.7
4.0
13.0
16.6
6.8
5.6
Power
Tata Power
Neutral
59
-
15,876
35,923
37,402
22.6
22.8
4.1
5.2
14.5
11.4
1.1
1.0
7.5
9.3
1.4
1.3
NTPC
Buy
128
157
105,130
87,064
98,846
23.5
23.5
11.7
13.2
10.9
9.7
1.2
1.1
11.4
12.1
2.2
2.0
Power Grid
Buy
139
170
72,850
20,702
23,361
86.7
86.4
12.1
13.2
11.5
10.5
1.7
1.5
15.6
15.1
8.4
7.9
Telecom
Bharti Airtel
Neutral
320
-
127,717
101,748
109,191
32.1
31.7
12.0
12.5
26.6
25.6
1.8
1.7
6.9
6.7
1.9
1.7
Idea Cellular
Neutral
108
-
38,813
34,282
36,941
32.0
31.5
5.9
6.2
18.3
17.4
1.7
1.5
9.9
9.3
1.7
1.6
zOthers
Abbott India
Neutral
4,652
-
9,885
2,715
3,153
14.5
14.1
134.3
152.2
34.7
30.6
8.6
7.1
27.4
25.6
3.4
2.8
Bajaj Electricals
Buy
166
237
1,673
4,719
5,287
5.2
5.8
8.6
12.7
19.4
13.1
2.2
1.9
11.4
14.8
0.4
0.3
Finolex Cables
Neutral
227
-
3,472
2,520
2,883
12.2
12.0
12.7
14.2
17.9
16.0
2.4
2.2
13.6
13.5
1.1
0.9
Goodyear India*
Buy
468
582
1,079
1,800
1,600
11.7
11.5
58.7
52.9
8.0
8.8
1.8
1.5
24.6
18.7
0.4
0.4
Hitachi
Neutral
1,058
-
2,876
1,779
2,081
7.8
8.8
21.8
33.4
48.5
31.6
7.8
6.3
17.4
22.1
1.7
1.4
Jyothy Laboratories
Neutral
268
-
4,856
1,620
1,847
11.5
11.5
7.3
8.5
36.8
31.7
4.8
4.4
13.3
14.4
2.9
2.4
MRF
Buy
33,242
45,575
14,098
20,316
14,488
21.4
21.1
5,488.0
3,798.0
6.1
8.8
2.1
1.7
41.1
21.2
0.6
0.9
Page Industries
Neutral
10,561
-
11,780
1,929
2,450
19.8
20.1
229.9
299.0
45.9
35.3
20.3
14.1
52.1
47.1
6.1
4.8
Relaxo Footwears
Neutral
399
-
4,788
1,767
2,152
12.3
12.5
19.3
25.1
20.7
15.9
5.1
3.9
27.7
27.8
2.8
2.2
Siyaram Silk Mills
Buy
987
1,354
925
1,636
1,815
11.5
11.5
89.9
104.1
11.0
9.5
1.8
1.6
17.9
17.8
0.7
0.6
Styrolution ABS India*
Neutral
510
-
897
1,271
1,440
8.6
9.2
32.0
41.1
15.9
12.4
1.6
1.5
10.7
12.4
0.7
0.6
Stock Watch
February 18, 2016
Company Name
Reco
CMP
Target
Mkt Cap
Sales ( Čcr )
OPM(%)
EPS (Č)
PER(x)
P/BV(x)
RoE(%)
EV/Sales(x)
(Č)
Price ( Č)
( Č cr )
FY16E
FY17E
FY16E
FY17E
FY16E
FY17E
FY16E
FY17E
FY16E
FY17E
FY16E
FY17E
FY16E
FY17E
zOthers
TVS Srichakra
Buy
2,232
3,217
1,709
2,035
2,252
15.9
15.3
248.6
268.1
9.0
8.3
3.9
2.8
43.6
33.9
0.9
0.7
HSIL
Buy
234
302
1,691
2,123
2,384
16.1
16.5
15.0
18.9
15.6
12.4
1.2
1.1
8.0
9.4
1.1
1.0
Kirloskar Engines India
Neutral
209
-
3,023
2,403
2,554
8.6
9.9
9.2
10.5
22.8
19.9
2.2
2.1
9.7
10.7
0.9
0.8
Ltd
M M Forgings
Buy
381
614
460
511
615
21.7
21.6
43.1
55.8
8.8
6.8
1.6
1.3
19.9
21.2
1.1
0.8
Banco Products (India) Neutral
99
-
704
1,208
1,353
11.0
12.3
10.8
14.5
9.1
6.8
1.1
0.9
11.9
14.5
0.5
0.5
Competent Automobiles Neutral
127
-
78
1,040
1,137
3.2
3.1
25.7
28.0
4.9
4.5
0.7
0.7
15.0
14.3
0.1
0.1
Nilkamal
Neutral
1,037
-
1,548
1,871
2,031
10.7
10.5
63.2
69.8
16.4
14.9
2.7
2.3
17.6
16.6
0.9
0.8
Visaka Industries
Buy
91
144
145
1,086
1,197
9.9
10.3
21.5
28.8
4.2
3.2
0.4
0.4
9.6
11.6
0.4
0.3
Transport Corporation of
Neutral
220
-
1,674
2,830
3,350
8.8
9.0
14.4
18.3
15.3
12.0
2.4
2.1
15.4
17.1
0.7
0.6
India
Elecon Engineering
Neutral
50
-
548
1,359
1,482
10.3
13.7
0.8
3.9
62.6
12.9
1.0
1.0
1.6
7.8
0.8
0.7
Surya Roshni
Buy
129
201
565
2,992
3,223
8.1
8.4
14.7
18.3
8.8
7.0
0.8
0.7
9.7
11.0
0.5
0.4
MT Educare
Neutral
146
-
581
286
366
18.3
17.7
7.7
9.4
18.9
15.6
4.0
3.5
20.2
21.1
1.9
1.5
Radico Khaitan
Buy
99
156
1,310
1,517
1,635
12.7
13.4
5.8
7.1
16.9
13.9
1.5
1.3
8.6
9.6
1.3
1.2
Garware Wall Ropes
Buy
306
473
670
862
974
11.2
11.2
24.9
29.6
12.3
10.4
1.9
1.6
15.1
15.4
0.8
0.7
Wonderla Holidays
Neutral
347
-
1,961
206
308
44.0
43.6
9.0
12.9
38.6
26.9
5.3
4.8
13.7
17.8
9.4
6.3
Linc Pen & Plastics
Accumulate
172
185
255
340
371
8.3
8.9
10.8
13.2
16.0
13.1
2.6
2.2
16.0
17.1
0.8
0.7
The Byke Hospitality
Neutral
153
-
615
222
287
20.5
20.5
5.6
7.6
27.2
20.3
5.1
4.2
18.9
20.8
2.8
2.2
Interglobe Aviation
Neutral
840
-
30,263
17,022
21,122
20.7
14.5
63.9
53.7
13.1
15.7
19.7
16.1
149.9
103.2
1.8
1.4
Coffee Day Enterprises
Neutral
228
-
4,697
2,692
2,964
17.0
18.6
-
4.7
-
48.1
2.8
2.6
0.2
5.5
2.1
2.0
Ltd
Navneet Education
Neutral
84
-
2,001
998
1,062
24.1
24.0
5.8
6.1
14.6
13.8
3.2
2.8
22.0
20.6
2.1
2.0
Navkar Corporation
Buy
162
265
2,310
365
436
38.3
37.5
5.6
5.9
28.7
27.6
1.8
1.7
6.3
6.1
7.1
6.2
Source: Company, Angel Research; Note: *December year end; #September year end; &October year end; Price as on February 17, 2016
Market Outlook
February 18, 2016
Research Team Tel: 022 - 39357800
DISCLAIMER
Angel Broking Private Limited (hereinafter referred to as “Angel”) is a registered Member of National Stock Exchange of India Limited,
Bombay Stock Exchange Limited and Metropolitian Stock Exchange of India Limited. It is also registered as a Depository Participant with
CDSL and Portfolio Manager with SEBI. It also has registration with AMFI as a Mutual Fund Distributor. Angel Broking Private Limited is a
registered entity with SEBI for Research Analyst in terms of SEBI (Research Analyst) Regulations, 2014 vide registration number
INH000000164. Angel or its associates has not been debarred/ suspended by SEBI or any other regulatory authority for accessing
/dealing in securities Market. Angel or its associates including its relatives/analyst do not hold any financial interest/beneficial ownership
of more than 1% in the company covered by Analyst. Angel or its associates/analyst has not received any compensation / managed or co
-managed public offering of securities of the company covered by Analyst during the past twelve months. Angel/analyst has not served as
an officer, director or employee of company covered by Analyst and has not been engaged in market making activity of the company
covered by Analyst.
This document is solely for the personal information of the recipient, and must not be singularly used as the basis of any investment
decision. Nothing in this document should be construed as investment or financial advice. Each recipient of this document should make
such investigations as they deem necessary to arrive at an independent evaluation of an investment in the securities of the companies
referred to in this document (including the merits and risks involved), and should consult their own advisors to determine the merits and
risks of such an investment.
Reports based on technical and derivative analysis center on studying charts of a stock's price movement, outstanding positions and
trading volume, as opposed to focusing on a company's fundamentals and, as such, may not match with a report on a company's
fundamentals.
The information in this document has been printed on the basis of publicly available information, internal data and other reliable sources
believed to be true, but we do not represent that it is accurate or complete and it should not be relied on as such, as this document is for
general guidance only. Angel Broking Pvt. Limited or any of its affiliates/ group companies shall not be in any way responsible for any
loss or damage that may arise to any person from any inadvertent error in the information contained in this report. Angel Broking Pvt.
Limited has not independently verified all the information contained within this document. Accordingly, we cannot testify, nor make any
representation or warranty, express or implied, to the accuracy, contents or data contained within this document. While Angel Broking
Pvt. Limited endeavors to update on a reasonable basis the information discussed in this material, there may be regulatory, compliance,
or other reasons that prevent us from doing so.
This document is being supplied to you solely for your information, and its contents, information or data may not be reproduced,
redistributed or passed on, directly or indirectly.
Neither Angel Broking Pvt. Limited, nor its directors, employees or affiliates shall be liable for any loss or damage that may arise from or
in connection with the use of this information.
Note: Please refer to the important ‘Stock Holding Disclosure' report on the Angel website (Research Section). Also, please refer to the
latest update on respective stocks for the disclosure status in respect of those stocks. Angel Broking Pvt. Limited and its affiliates may have
investment positions in the stocks recommended in this report.