Market Outlook
January 18, 2016
Market Cues
Domestic Indices
Chg (%)
(Pts)
(Close)
Indian markets are expected to open flat tracking the SGX Nifty and mixed Asian
BSE Sensex
(1.3)
(318)
24,455
markets.
Nifty
(1.3)
(99)
7,438
U.S. stocks corrected sharply wiping the gains of the previous session as the drop in
Mid Cap
(2.7)
(285)
10,344
crude prices and the sell-off in China spooked investors globally. Economic data
Small Cap
(3.1)
(348)
10,783
from the US was also negative with the IIP declining by 0.4% while retail sales
Bankex
(2.7)
(483)
17,238
dipped 0.1% in December.
European markets too ended firmly in the red led by the global concerns which
Global Indices
Chg (%)
(Pts)
(Close)
resulted in broad based selling. Energy stocks corrected sharply led by the drop in
crude prices while commodity stocks slumped on account of Chinese concerns.
Dow Jones
(2.4)
(391)
15,988
Nasdaq
(2.7)
(127)
4,488
Indian markets saw a sharp cut in the last hour of trade after trading flat earlier in
the day. Global cues remained weak as crude prices resumed its slide and Chinese
FTSE
(1.9)
(114)
5,804
stocks saw a sell-off on mixed lending and FDI data.
Nikkei
(0.5)
(94)
17,147
Hang Seng
(1.5)
(297)
19,521
News & Result Analysis
Shanghai Com
(3.5)
(107)
2,901
M&M launches first ever compact petrol SUV “KUV100” starting `4.42 lakh
Increased output saves CIL `17,000cr: Coal Secretary
Result Preview: Wipro
Advances / Declines
BSE
NSE
Detailed analysis on Pg2
Advances
385
143
Declines
2,320
1,450
Investor’s Ready Reckoner
Unchanged
143
27
Key Domestic & Global Indicators
Stock Watch: Latest investment recommendations on 150+ stocks
Volumes (` Cr)
Refer P5 onwards
BSE
2,920
Top Picks
NSE
17,548
CMP
Target
Upside
Company
Sector
Rating
(`)
(`)
(%)
Amara Raja Batteries Auto & Auto Ancillary
Buy
813
1,040
28.0
Net Inflows (` Cr)
Net
Mtd
Ytd
HCL Tech
IT
Buy
838
1,132
35.2
FII
282
(3,436)
16,923
Larsen & Toubro
Construction
Buy
1,106
1,646
48.8
MFs
278
1,640
70,135
LIC Housing Finance Financials
Buy
467
592
26.7
Navkar Corporation Others
Buy
200
265
32.2
Top Gainers
Price (`)
Chg (%)
More Top Picks on Pg5
BPCL
934
2.8
Key Upcoming Events
GDL
343
1.5
Previous
Consensus
Date
Region
Event Description
Reading
Expectations
PVR
789
1.4
Jan 18
India
Imports YoY%
(30.3)
-
Kajaria Cer
933
1.3
India
Exports YoY%
(24.4)
-
Tech Mah
520
1.2
Jan 19
China
Industrial Production (YoY)
6.2
6.0
China
Real GDP (YoY)
6.9
6.9
Top Losers
Price (`)
Chg (%)
Wockpharma
1,288
(15.0)
Jindal Steel
64
(11.6)
Tv18Brdcst
41
(9.9)
India Cem
88
(9.7)
NIIT Tech
517
(9.6)
As on January 15, 2015
Market Outlook
January 18, 2016
M&M launches first ever compact petrol SUV “KUV100” starting
`4.42 lakh
Mahindra & Mahindra launched an all new micro-SUV, the “KUV 100” at an
aggressive price of `4.42 lakh to `6.76 lakh ex-showroom Pune aimed at the first
time car buyers. Anand Mahindra, chairman of Mahindra and Mahindra said the
launch of KUV is a new inflection point in the history of company. Mahindra claims
“KUV 100” is the most fuel efficient SUV in the country delivering a mileage of
25.32 kilometer to a litre of diesel and 18.15 kilometer to a litre of petrol.
Powered by an all-new 1.2 litre petrol engine and 1.2 litre common rail diesel
engine, the vehicle is based on a new monocoque architecture, which has been
developed with an investment of close to `1,200cr over a period of 4 years by 350
engineers.
As per the company, KUV 100 will not only help de-risk Mahindra from the noise
against diesel vehicle (as the new sub-compact SUV comes with an all new petrol
engine) but will also help it to tap into a large 1,00,000 units a month market for
premium hatch backs. Apart from attractive pricing, KUV 100 offers a stylish,
highly fuel efficient vehicle, which is high on safety with ABS and EBD as standard
and dual airbags as an option across all variants including base variant. The
vehicle is loaded with host of features like wrap around headlamps with daytime
running lights, alloy wheels, rear spoiler, mood lighting, cooled glove box,
infotainment system with Aux, Bluetooth, USB etc.
M&M believes the vehicle has a potential to grab at least 8-10% segment share of
1,00,000 units/month market for premium hatches. The vendors have already
been told to be prepared with monthly production of 6000 to 7000 units, which
could be scaled up to 12,000 units within 6 months. KUV 100 is the first product
offering of M&M in the petrol SUV segment and is likely to lead to M&M gaining
market share in the utility vehicle space. We maintain Buy rating on the stock.
Increased output saves CIL `17,000cr: Coal Secretary
Increased output by Coal India has resulted in savings of about `17,000cr in the
nine months of this fiscal and is set for a record production of 540-550 MT this
fiscal, as per the Coal Secretary Anil Swarup. He added that coal imports, which
fell down to about 132 MT in April-December period of the current fiscal from
about 155 MT in the same period a year ago, are likely to fall further on the back
of increased output.
Increased production has not only resulted in enhanced energy production but
also made available coal stock for 24 days with power plants, from the earlier
three to seven days. He said apart from increased production, increased offtake
also became possible with availability of higher number of rakes, which went to
204 per day in the current fiscal as against 182 in the last fiscal.
As per media reports, the 10% stake sale in Coal India is likely to be deferred to
next fiscal as the government wants to wait for stability in the equity markets for a
better valuation. Coal India shares are currently trading at ~`318 a share,
resulting in a notional loss of over 11% to investors who purchased the equity at
`358 apiece in the disinvestment on January 31, 2015. We have a buy rating on
the stock with a target price of `380.
Market Outlook
January 18, 2016
Result Preview
Wipro (CMP: `543/ TP `719: Buy / Upside: 32.4%)
During 3QFY2016, we expect the IT services to post a 0.5% sequential growth in
USD revenues to US$1,841mn. In rupee terms, overall consolidated revenues are
expected to come in at `12,739cr, a growth of 1.8% qoq. On operating front, the
EBITDA margins are expected to come in at 21.5% a downtick of 30bp qoq.
Consequently, PAT is expected to come in at `2,318cr, growth of 3.7% qoq. We
maintain our buy on the stock with a price target of `719.
Y/E
Sales OPM
PAT EPS ROE P/E P/BV EV/EBITDA EV/Sales
March
(` cr)
(%)
(` cr)
(`)
(%)
(x)
(x)
(x)
(x)
FY2016E
50,808
23.7
9,233
37.3
19.0
14.6
2.8
9.4
2.1
FY2017E
58,713
23.8
10,450
42.3
17.9
12.9
2.5
7.3
1.7
Quarterly Bloomberg Brokers Consensus Estimate
Asian Paint Ltd. - January 18, 2016
Particulars (` cr)
3QFY16E
3QFY15
y-o-y (%)
2QFY16
q-o-q (%)
Net sales
4,032
3,602
11.9
3,730
8.1
EBITDA
711
583
22.0
621
14.5
EBITDA margin (%)
17.6
16.2
16.6
Net profit
456
368
23.9
399
14.3
Wipro Ltd. - January 18, 2016
Particulars (` cr)
3QFY16E
3QFY15
y-o-y (%)
2QFY16
q-o-q (%)
Net sales
12,822
12,085
6.1
12,513
2.5
EBITDA
2,722
2,676
1.7
2,728
(0.2)
EBITDA margin (%)
21.2
22.1
21.8
Net profit
2,242
2,192
2.3
2,241
0.0
Kotak Bank - January 18, 2016
Particulars (` cr)
3QFY16E
3QFY15
y-o-y (%)
2QFY16
q-o-q (%)
PAT
817
717
14.0
941
(13.2)
Economic and Political News
Petrol becomes cheaper by 32 paise, diesel by 85 paise/litre
Excise duty on petrol, diesel hiked; government to garner `3,700cr
Services exports fall 4% at $12 billion in November
Corporate News
KKR sells stake in Dalmia Bharat Cement for over `1,218cr
HPCL gets green nod for `18,400cr Vizag refinery expansion
ONGC expects 10% lower capex this fiscal on drop in exploration costs
Market Outlook
January 18, 2016
Top Picks HHHHH
Large Cap
Market Cap
CMP
Target
Upside
Company
Rationale
(` Cr)
(`)
(`)
(%)
To outpace battery industry growth due to better technological
Amara Raja Batteries
13,883
813
1,040
28.0
products leading to market share gains in both the automotive
OEM and replacement segments.
Earnings to grow strongly given the MHCV cyclical upturn.
Ashok Leyland
24,204
85
111
30.5
Focus on exports and LCV's provides additional growth
avenue.
The stock is trading at attractive valuations and is factoring all
HCL Tech
1,18,051
838
1,132
35.2
the bad news.
Strong visibility for a robust 20% earnings trajectory, coupled
HDFC Bank
2,63,329
1,043
1,262
21.0
with high quality of earnings on account of high quality retail
business and strategic focus on highly rated corporates.
Back on the growth trend, expect a long term growth of 14%
Infosys
2,61,898
1,140
1,306
14.5
to be a US$20bn in FY2020.
Well positioned to benefit from such expected gradual
recovery in the overall domestic capex cycle, given its presence
Larsen & Toubro
1,02,997
1,106
1,646
48.8
across various infrastructure segments, its execution
capabilities, and its strong balance sheet.
LICHF continues to grow its retail loan book at a healthy pace
with improvement in asset quality. We expect the company to
LIC Housing Finance
23,570
467
592
26.7
post a healthy loan book which is likely to reflect in a strong
earnings growth.
Source: Company, Angel Research
Mid Cap
Market Cap
CMP
Target
Upside
Company
Rationale
(` Cr)
(`)
(`)
(%)
Favourable outlook for the AC industry to augur well for
Cooling products business which is out pacing the market
Blue Star
3,074
342
439
28.4
growth. EMPPAC division's profitability to improve once
operating environment turns around.
Change in business focus towards high-margin chronic &
Garware Wall Ropes
807
369
473
28.3
lifestyle segments and increasing penetration in Europe and
US
Economic recovery to have favourable impact on advertising &
circulation revenue growth. Further, the acquisition of a radio
Jagran Prakashan
5,075
155
189
21.7
business (Radio City) would also boost the company's revenue
growth.
Massive capacity expansion along with rail advantage at ICD
Navkar Corporation
2,859
200
265
32.2
as well CFS augurs well for the company
Earnings boost on back of stable material prices and
Radico Khaitan
1,392
105
156
49.1
favourable pricing environment. Valuation discount to peers
provides additional comfort
Strong brands and distribution network would boost growth
Siyaram Silk Mills
1,059
1,129
1,354
19.9
going ahead. Stock currently trades at an inexpensive
valuation.
Structural shift in the Lighting industry towards LED lighting will
Surya Roshni
631
144
201
39.7
drive growth.
Source: Company, Angel Research
Market Outlook
January 18, 2016
Key Upcoming Events
Result Calendar
Date
Company
Jan 18, 2016
Rallis, Kotak Mah. Bank, Asian Paints, Wipro, Mindtree
Jan 19, 2016
HCL Tech, Reliance Industries, Reliance Power
Jan 20, 2016
UltraTech Cement, Axis Bank, South Ind.Bank, KPIT Cummins, NIIT, Reliance Infra.
Jan 21, 2016
Exide Industries, Reliance Capital, Hind. Zinc, Heritage Foods, Alembic Pharma, Interglobe Aviation
Jan 22, 2016
ITC, D B Corp, Cairn India
Jan 23, 2016
Persistent, Siyaram Silk Mills
Jan 25, 2016
Subros, HDFC Bank, Hindustan Media Ventures
Jan 27, 2016
Colgate, Godrej Consumer, HT Media, Kirloskar Engines India Ltd, L G Balakrishnan & Bros
Jan 28, 2016
ICICI Bank, Dabur India, Jyothy Laboratories, Tide Water Oil India
Jan 29, 2016
TVS Motor, Thermax, Blue Star, Yes Bank, JSW Steel , Elecon Engineering, Indoco Remedies
Jan 30, 2016
IDFC
Source: Bloomberg, Angel Research
Global economic events release calendar
Date
Time
Country
Event Description
Unit
Period
Bloomberg Data
Last Reported Estimated
Jan 18, 2016
India
Imports YoY%
% Change
Dec
(30.30)
--
India
Exports YoY%
% Change
Dec
(24.43)
--
Jan 19, 2016
3:00PM UK
CPI (YoY)
% Change
Dec
0.10
0.20
7:30AM China
Industrial Production (YoY)
% Change
Dec
6.20
6.00
7:30AM China
Real GDP (YoY)
% Change
4Q
6.90
6.90
3:30PM Euro Zone
Euro-Zone CPI (YoY)
%
Dec F
0.20
0.20
Jan 20, 2016
7:00PM US
Housing Starts
Thousands
Dec
1,173.00
1,200.00
7:00PM US
Building permits
Thousands
Dec
1,282.00
1,200.00
3:00PM UK
Jobless claims change
% Change
Dec
3.90
2.75
7:00PM US
Consumer price index (mom)
% Change
Dec
--
--
Jan 21, 2016
7:00PM US
Initial Jobless claims
Thousands
Jan 16
284.00
280.00
8:30PM Euro Zone
Euro-Zone Consumer Confidence
Value
Jan A
(5.70)
(5.70)
6:15PM Euro Zone
ECB announces interest rates
%
Jan 21
0.05
0.05
Jan 22, 2016
2:00PM Germany
PMI Services
Value
Jan P
56.00
55.50
2:00PM Germany
PMI Manufacturing
Value
Jan P
53.20
53.00
8:30PM US
Existing home sales
Million
Dec
4.76
5.20
Jan 26, 2016
8:30PM US
Consumer Confidence
S.A./ 1985=100
Jan
96.50
96.75
Jan 27, 2016
8:30PM US
New home sales
Thousands
Dec
490.00
505.00
Jan 28, 2016
3:00PM UK
GDP (YoY)
% Change
4Q A
2.10
--
12:30AM US
FOMC rate decision
%
Jan 27
0.50
0.50
Jan 29, 2016
7:00PM US
GDP Qoq (Annualised)
% Change
4Q A
2.00
0.50
Source: Bloomberg, Angel Research
Market Outlook
January 18, 2016
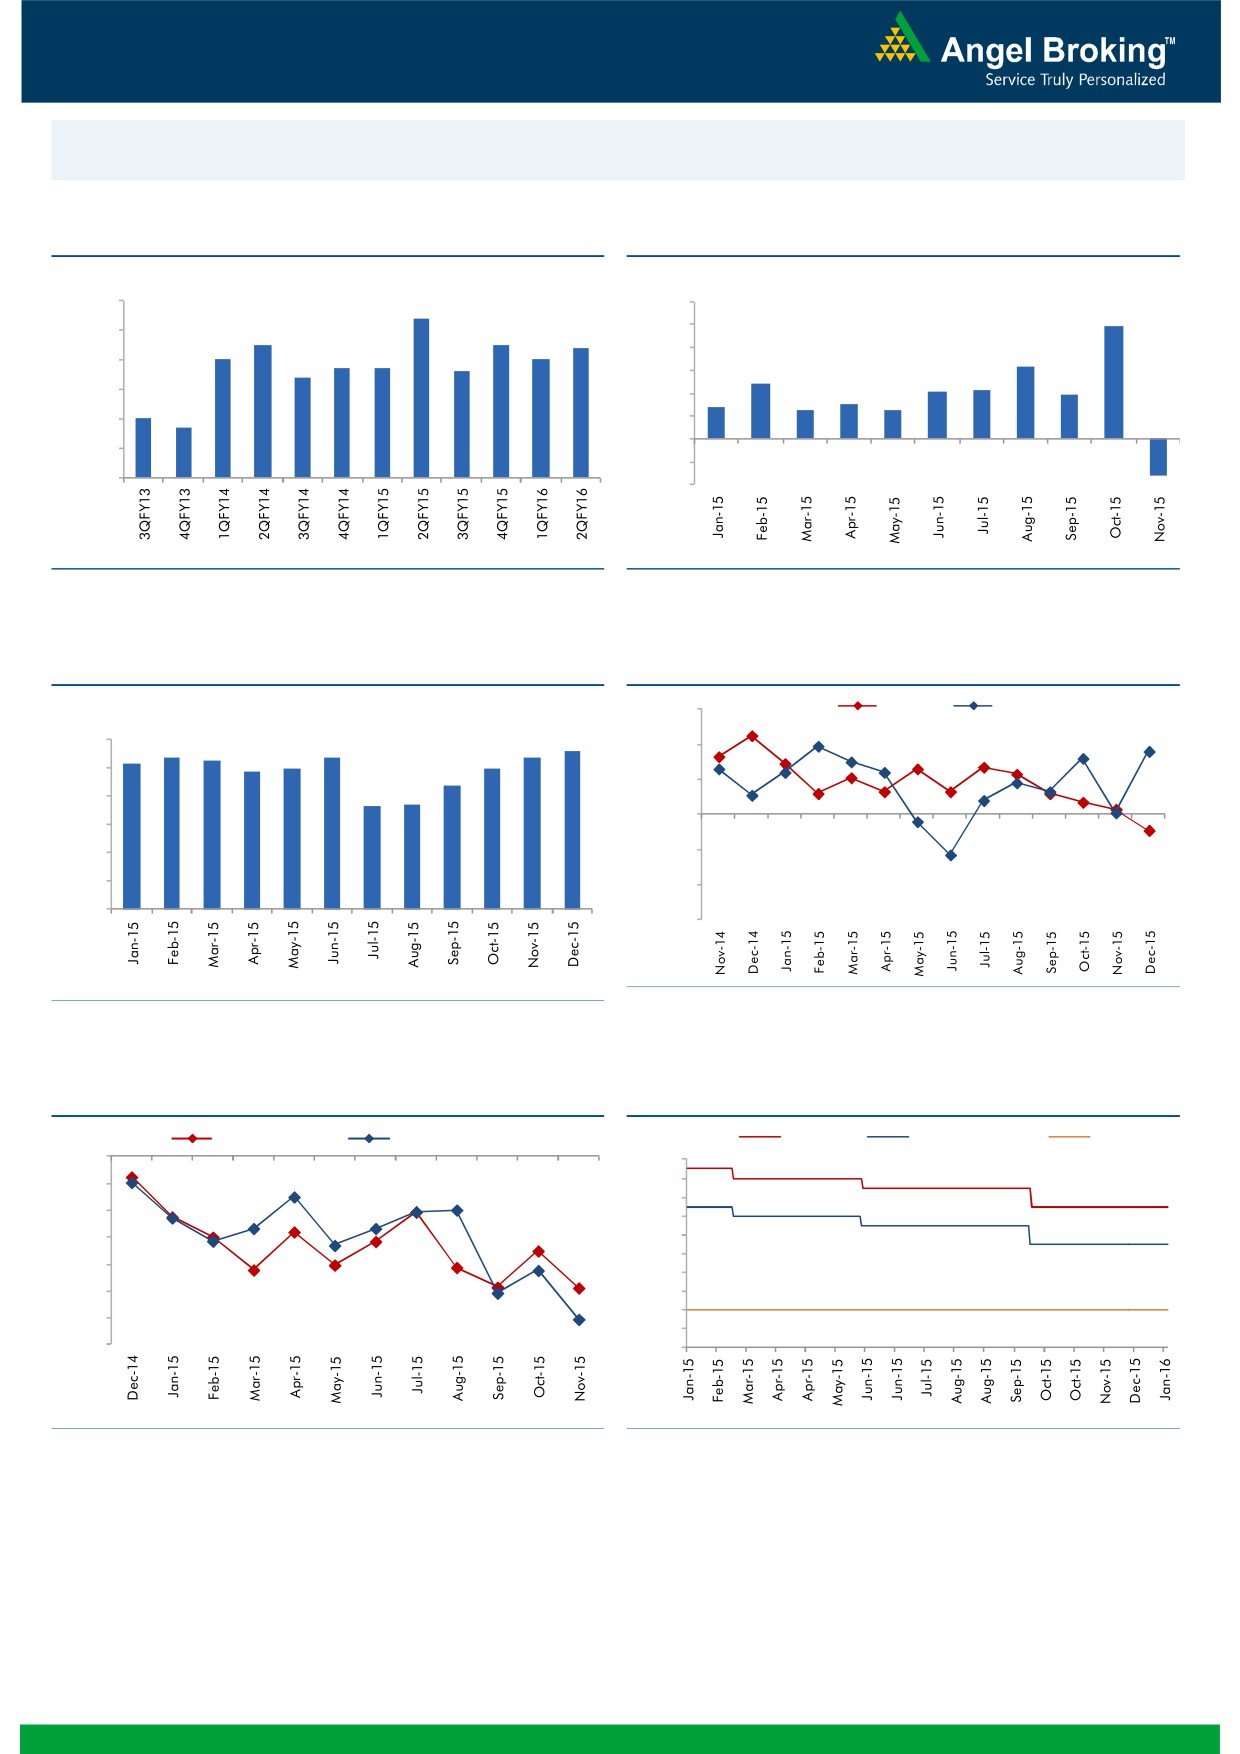
Macro watch
Exhibit 1: Quarterly GDP trends
Exhibit 2: IIP trends
(%)
(%)
9.0
8.4
12.0
9.9
7.5
7.5
10.0
8.0
7.4
7.0
7.0
6.7
6.7
8.0
6.3
6.6
7.0
6.4
6.0
4.8
4.3
4.2
3.8
6.0
2.8
3.0
4.0
2.5
2.5
5.0
4.7
5.0
2.0
-
4.0
(2.0)
3.0
(4.0)
(3.2)
Source: CSO, Angel Research
Source: MOSPI, Angel Research
Exhibit 3: Monthly CPI inflation trends
Exhibit 4: Manufacturing and services PMI
(%)
56.0
Mfg. PMI
Services PMI
5.6
6.0
5.4
5.3
5.4
5.4
54.0
5.2
5.0
5.0
4.9
5.0
4.4
52.0
3.7
3.7
4.0
50.0
3.0
2.0
48.0
1.0
46.0
-
44.0
Source: Market, Angel Research; Note: Level above 50 indicates expansion
Source: MOSPI, Angel Research
Exhibit 5: Exports and imports growth trends
Exhibit 6: Key policy rates
(%)
Exports yoy growth
Imports yoy growth
(%)
Repo rate
Reverse Repo rate
CRR
0.0
8.00
(5.0)
7.50
7.00
(10.0)
6.50
(15.0)
6.00
5.50
(20.0)
5.00
(25.0)
4.50
4.00
(30.0)
3.50
(35.0)
3.00
Source: Bloomberg, Angel Research
Source: RBI, Angel Research
Market Outlook
January 18, 2016
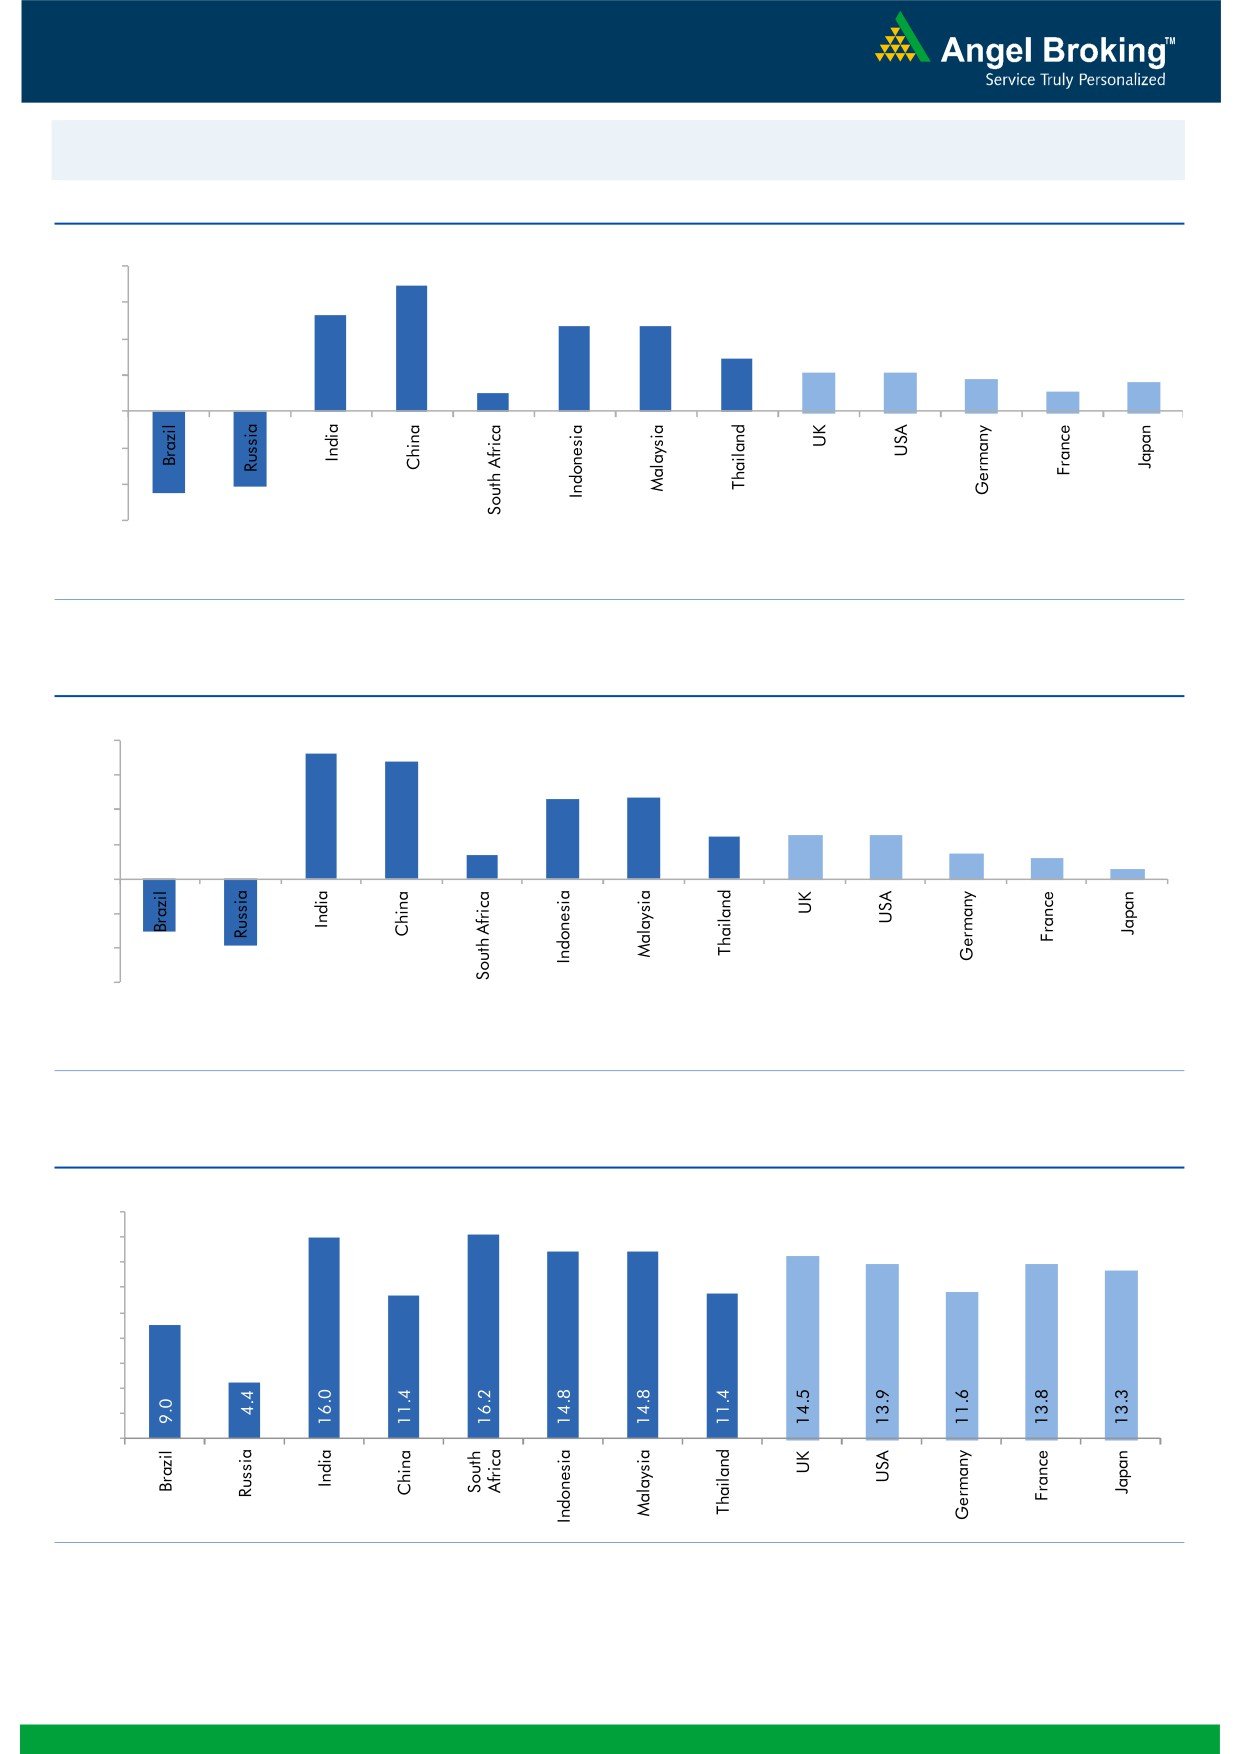
Global watch
Exhibit 1: Latest quarterly GDP Growth (%, yoy) across select developing and developed countries
(%)
8.0
6.9
6.0
5.3
4.7
4.7
4.0
2.9
2.1
2.1
1.8
2.0
1.0
1.1
1.6
-
(2.0)
(4.0)
(4.1)
(4.5)
(6.0)
Source: Bloomberg, Angel Research
Exhibit 2: 2015 GDP Growth projection by IMF (%, yoy) across select developing and developed countries
(%)
7.3
8.0
6.8
6.0
4.7
4.7
4.0
2.5
2.5
2.6
1.4
1.5
2.0
1.2
0.6
-
(2.0)
(4.0)
(3.0)
(3.8)
(6.0)
Source: IMF, Angel Research
Exhibit 3: One year forward P-E ratio across select developing and developed countries
(x)
18.0
16.0
14.0
12.0
10.0
8.0
6.0
4.0
2.0
-
Source: IMF, Angel Research
Market Outlook
January 18, 2016
Exhibit 4: Relative performance of indices across globe
Returns (%)
Country
Name of index
Closing price
1M
3M
1YR
Brazil
Bovespa
38,569
(15.5)
(21.5)
(22.8)
Russia
Micex
1,608
(7.2)
(6.0)
3.5
India
Nifty
7,438
(3.4)
(8.5)
(10.6)
China
Shanghai Composite
2,901
(17.4)
(14.5)
(14.0)
South Africa
Top 40
42,105
(3.3)
(11.6)
(1.0)
Mexico
Mexbol
40,848
(2.5)
(7.8)
(0.4)
Indonesia
LQ45
784
2.2
(0.6)
(11.7)
Malaysia
KLCI
1,629
(0.7)
(4.8)
(5.8)
Thailand
SET 50
773
(4.6)
(16.0)
(21.1)
USA
Dow Jones
15,988
(7.9)
(5.5)
(8.7)
UK
FTSE
5,804
(2.5)
(7.4)
(11.9)
Japan
Nikkei
17,147
(10.0)
(5.5)
1.6
Germany
DAX
9,545
(9.9)
(4.9)
(6.8)
France
CAC
4,210
(5.9)
(9.9)
(7.5)
Source: Bloomberg, Angel Research
Stock Watch
January 18, 2016
Company Name
Reco
CMP
Target
Mkt Cap
Sales ( Čcr )
OPM(%)
EPS (Č)
PER(x)
P/BV(x)
RoE(%)
EV/Sales(x)
(Č)
Price ( Č)
( Č cr )
FY16E FY17E
FY16E
FY17E
FY16E
FY17E
FY16E
FY17E
FY16E
FY17E
FY16E
FY17E
FY16E
FY17E
Agri / Agri Chemical
Rallis
Neutral
162
-
3,156
2,097
2,415
14.4
14.4
9.5
11.0
17.1
14.8
3.4
2.9
21.1
21.3
1.5
1.3
United Phosphorus
Buy
391
510
16,748
13,698
15,752
17.6
17.6
32.1
38.5
12.2
10.2
2.4
2.0
21.4
21.3
1.3
1.1
Auto & Auto Ancillary
Ashok Leyland
Buy
85
111
24,204
17,995
21,544
11.4
11.6
3.4
4.7
25.0
18.1
4.4
4.0
17.7
22.2
1.3
1.1
Bajaj Auto
Buy
2,335
2,728
67,573
23,695
27,298
21.3
20.4
134.6
151.5
17.4
15.4
5.5
4.7
31.8
30.6
2.4
2.1
Bharat Forge
Buy
793
943
18,471
7,867
8,881
20.0
20.3
34.4
41.0
23.1
19.4
4.5
3.7
21.1
20.9
2.5
2.1
Eicher Motors
Buy
16,241
19,036
44,100
15,379
16,498
15.6
16.6
473.2
574.8
34.3
28.3
12.7
9.4
36.7
33.2
2.8
2.6
Gabriel India
Buy
86
101
1,235
1,415
1,544
8.7
9.0
4.6
5.4
18.7
15.9
3.4
3.0
18.1
18.9
0.8
0.8
Hero Motocorp
Accumulate
2,425
2,774
48,431
28,561
31,559
14.7
14.7
151.1
163.2
16.1
14.9
6.2
5.3
38.7
35.6
1.5
1.4
Jamna Auto Industries Neutral
132
-
1,055
1,292
1,486
9.3
9.8
6.0
7.5
22.0
17.6
4.6
3.9
20.7
21.8
0.9
0.8
L G Balakrishnan & Bros Neutral
461
-
723
1,254
1,394
11.6
11.8
35.9
41.7
12.8
11.1
1.7
1.5
13.5
13.8
0.7
0.6
Mahindra and Mahindra Buy
1,177
1,449
73,075
39,031
44,440
13.8
13.9
57.9
67.6
20.3
17.4
3.3
2.9
16.1
16.6
1.5
1.3
Maruti
Neutral
4,273
-
129,088
57,865
68,104
16.4
16.7
176.3
225.5
24.2
19.0
4.7
4.0
19.4
21.2
2.0
1.7
Minda Industries
Accumulate
808
867
1,282
2,567
2,965
8.0
8.3
46.1
57.8
17.5
14.0
2.9
2.4
16.7
17.3
0.6
0.5
Motherson Sumi
Buy
251
313
33,233
39,343
45,100
8.8
9.1
10.1
12.5
24.9
20.1
7.9
6.2
35.3
34.4
0.9
0.8
Rane Brake Lining
Buy
313
366
248
454
511
11.1
11.4
23.8
28.1
13.2
11.1
1.9
1.7
14.2
15.3
0.7
0.6
Setco Automotive
Neutral
37
-
496
594
741
12.7
13.7
1.7
3.2
21.8
11.6
2.3
2.0
10.4
16.9
1.3
1.1
Tata Motors
Buy
342
409
98,612
266,022
312,667
12.8
13.1
26.3
38.3
13.0
8.9
1.7
1.5
8.4
12.1
0.5
0.5
TVS Motor
Buy
278
338
13,191
11,569
13,648
7.3
8.7
10.3
16.1
27.0
17.3
6.7
5.3
24.8
30.5
1.1
0.9
Amara Raja Batteries
Buy
813
1,040
13,883
4,892
5,871
17.4
17.6
28.8
37.1
28.2
21.9
6.6
5.3
23.4
24.1
2.8
2.3
Exide Industries
Buy
135
162
11,454
6,950
7,784
14.4
14.8
6.6
7.3
20.4
18.5
2.6
2.4
12.6
12.8
1.4
1.2
Apollo Tyres
Buy
139
171
7,093
12,146
12,689
16.8
16.0
21.2
19.0
6.6
7.3
1.1
1.0
16.5
13.0
0.7
0.7
Ceat
Buy
962
1,119
3,892
6,041
6,597
14.1
13.7
99.5
111.9
9.7
8.6
1.9
1.6
19.6
18.5
0.8
0.7
JK Tyres
Neutral
95
-
2,159
7,446
7,669
15.2
14.0
19.6
18.4
4.9
5.2
1.2
1.0
25.2
19.5
0.7
0.6
Swaraj Engines
Neutral
908
-
1,128
552
630
14.2
14.7
44.6
54.1
20.4
16.8
4.7
4.3
23.2
25.6
1.9
1.6
Subros
Neutral
94
-
563
1,268
1,488
11.6
11.9
3.7
6.6
25.4
14.2
1.7
1.6
6.8
11.4
0.7
0.6
Indag Rubber
Neutral
177
-
464
283
329
17.0
17.2
13.0
15.4
13.6
11.5
3.0
2.5
21.8
21.6
1.4
1.1
Capital Goods
ACE
Neutral
39
-
390
660
839
4.7
8.2
1.0
3.9
39.5
10.1
1.2
1.1
3.2
11.3
0.7
0.6
BEML
Neutral
1,164
-
4,846
3,277
4,006
6.0
8.9
29.2
64.3
39.9
18.1
2.2
2.0
5.7
11.7
1.6
1.2
Bharat Electronics
Accumulate
1,260
1,414
30,229
7,737
8,634
16.8
17.2
54.0
61.0
23.3
20.7
3.3
3.0
39.3
45.6
3.0
2.6
Stock Watch
January 18, 2016
Company Name
Reco
CMP
Target
Mkt Cap
Sales ( Čcr )
OPM(%)
EPS (Č)
PER(x)
P/BV(x)
RoE(%)
EV/Sales(x)
(Č)
Price ( Č)
( Č cr )
FY16E
FY17E
FY16E
FY17E
FY16E
FY17E
FY16E
FY17E
FY16E
FY17E
FY16E
FY17E
FY16E
FY17E
Capital Goods
Voltas
Buy
280
353
9,273
5,363
5,963
8.0
9.1
11.0
13.8
25.5
20.3
3.9
3.4
16.2
17.9
1.7
1.5
BGR Energy
Neutral
110
-
792
3,615
3,181
9.5
9.4
16.7
12.4
6.6
8.9
0.6
0.6
10.0
7.0
0.6
0.8
BHEL
Neutral
137
-
33,410
33,722
35,272
10.8
11.7
10.5
14.2
13.0
9.6
1.0
0.9
7.0
9.0
1.1
1.0
Blue Star
Buy
342
439
3,074
3,548
3,977
6.3
6.9
13.7
17.2
25.0
19.9
6.3
4.1
26.1
25.4
1.0
0.8
Crompton Greaves
Buy
176
204
11,015
13,484
14,687
4.9
6.2
4.5
7.1
39.1
24.8
2.8
2.6
7.2
10.8
0.9
0.9
Inox Wind
Buy
319
458
7,085
4,980
5,943
17.0
17.5
26.6
31.6
12.0
10.1
3.6
2.6
35.0
30.0
1.6
1.3
KEC International
Neutral
131
-
3,360
8,791
9,716
6.1
6.8
5.4
8.2
24.2
15.9
2.4
2.2
10.0
14.0
0.6
0.6
Thermax
Neutral
865
-
10,308
6,413
7,525
7.4
8.5
30.5
39.3
28.4
22.0
4.4
3.8
15.0
17.0
1.6
1.3
Cement
ACC
Buy
1,231
1,630
23,109
13,151
14,757
16.4
18.3
63.9
83.4
19.3
14.8
2.5
2.3
13.3
16.1
1.6
1.3
Ambuja Cements
Buy
194
233
30,091
11,564
12,556
19.4
20.7
8.9
10.1
21.8
19.2
2.7
2.6
12.8
13.8
2.2
2.0
HeidelbergCement
Neutral
70
-
1,586
1,772
1,926
13.3
15.4
1.0
3.0
70.0
23.3
1.8
1.6
2.6
7.9
1.5
1.3
India Cements
Buy
88
112
2,697
4,216
4,840
18.0
19.5
4.0
9.9
22.0
8.9
0.9
0.8
4.0
9.5
1.0
0.8
JK Cement
Buy
500
744
3,495
3,661
4,742
10.1
15.8
18.0
61.0
27.8
8.2
2.0
1.8
7.5
22.9
1.4
1.1
J K Lakshmi Cement
Buy
287
430
3,381
2,947
3,616
16.7
19.9
11.5
27.2
25.0
10.6
2.4
2.1
9.8
20.8
1.6
1.2
Mangalam Cements
Neutral
182
-
484
1,053
1,347
10.5
13.3
8.4
26.0
21.6
7.0
0.9
0.8
4.3
12.5
0.8
0.6
Orient Cement
Buy
146
183
2,998
1,854
2,524
21.2
22.2
7.7
11.1
19.0
13.2
2.7
2.4
13.3
15.7
2.4
1.6
Ramco Cements
Neutral
374
-
8,915
4,036
4,545
20.8
21.3
15.1
18.8
24.8
19.9
3.0
2.7
12.9
14.3
2.7
2.3
Shree Cement^
Neutral
9,663
-
33,664
7,150
8,742
26.7
28.6
228.0
345.5
42.4
28.0
6.2
5.2
15.7
20.3
4.5
3.6
UltraTech Cement
Buy
2,617
3,282
71,818
25,021
30,023
19.1
21.6
89.0
132.0
29.4
19.8
3.4
3.0
12.2
15.9
2.9
2.5
Construction
ITNL
Neutral
80
-
2,633
7,360
8,825
34.0
35.9
7.0
9.0
11.4
8.9
0.4
0.4
3.2
3.7
3.7
3.6
KNR Constructions
Buy
501
673
1,409
937
1,470
14.3
14.0
33.5
38.6
15.0
13.0
2.3
2.0
15.4
15.4
1.6
1.0
Larsen & Toubro
Buy
1,106
1,646
102,997
65,065
77,009
11.5
11.7
61.5
65.6
18.0
16.9
1.8
1.7
13.4
14.0
1.8
1.5
Gujarat Pipavav Port
Neutral
148
-
7,143
629
684
51.0
52.2
6.4
5.9
23.1
25.0
3.0
2.8
15.9
12.7
11.0
9.9
MBL Infrastructures
Buy
193
285
799
2,313
2,797
12.2
14.6
19.0
20.0
10.2
9.6
1.1
1.0
11.3
10.6
1.1
0.9
Nagarjuna Const.
Neutral
64
-
3,552
7,892
8,842
8.8
9.1
3.0
5.3
21.3
12.1
1.1
1.0
5.0
8.5
0.7
0.6
PNC Infratech
Accumulate
508
558
2,606
1,873
2,288
13.2
13.5
24.0
32.0
21.2
15.9
2.1
1.8
12.1
12.3
1.5
1.2
Simplex Infra
Neutral
293
-
1,451
5,955
6,829
10.3
10.5
16.0
31.0
18.3
9.5
1.0
0.9
5.3
9.9
0.7
0.6
Power Mech Projects
Neutral
647
-
952
1,539
1,801
12.8
12.7
59.0
72.1
11.0
9.0
1.7
1.4
18.6
16.8
0.6
0.5
Sadbhav Engineering
Neutral
294
-
5,049
3,481
4,219
10.7
10.8
8.0
12.0
36.8
24.5
3.4
3.0
10.3
13.5
1.7
1.4
Stock Watch
January 18, 2016
Company Name
Reco
CMP
Target
Mkt Cap
Sales ( Čcr )
OPM(%)
EPS (Č)
PER(x)
P/BV(x)
RoE(%)
EV/Sales(x)
(Č)
Price ( Č)
( Č cr )
FY16E
FY17E
FY16E
FY17E
FY16E
FY17E
FY16E
FY17E
FY16E
FY17E
FY16E
FY17E
FY16E
FY17E
Construction
NBCC
Buy
943
1,089
11,315
7,382
9,506
7.7
8.6
39.8
54.4
23.7
17.3
5.7
4.5
26.7
29.1
1.3
1.0
MEP Infra
Neutral
41
-
673
1,956
1,876
28.1
30.5
1.3
3.0
31.9
13.8
6.7
4.5
21.2
32.8
1.8
1.7
SIPL
Neutral
89
-
3,137
675
1,042
62.4
64.7
-
-
3.3
3.8
-
-
16.3
11.0
Financials
Allahabad Bank
Neutral
53
-
3,168
8,569
9,392
2.8
2.9
16.3
27.5
3.2
1.9
0.3
0.2
7.6
11.9
-
-
Axis Bank
Buy
374
531
88,889
26,473
31,527
3.5
3.6
35.7
43.5
10.5
8.6
2.0
1.8
17.9
18.9
-
-
Bank of Baroda
Neutral
126
-
29,044
18,485
21,025
1.9
2.0
13.5
21.1
9.4
6.0
0.7
0.7
7.3
10.6
-
-
Bank of India
Neutral
94
-
7,448
15,972
17,271
1.9
2.0
15.3
33.4
6.1
2.8
0.3
0.2
3.6
7.6
-
-
Canara Bank
Neutral
180
-
9,768
15,441
16,945
2.0
2.1
46.6
70.4
3.9
2.6
0.3
0.3
8.0
11.2
-
-
Dena Bank
Neutral
37
-
2,371
3,440
3,840
2.1
2.3
7.3
10.0
5.1
3.7
0.4
0.3
6.1
7.9
-
-
Federal Bank
Neutral
48
-
8,219
3,477
3,999
3.0
3.0
5.0
6.2
9.5
7.7
1.0
0.9
10.6
11.9
-
-
HDFC
Neutral
1,149
-
181,372
10,358
11,852
3.3
3.3
41.1
47.0
28.0
24.4
5.3
4.8
24.7
24.9
-
-
HDFC Bank
Buy
1,043
1,262
263,329
38,309
47,302
4.3
4.3
49.3
61.1
21.1
17.1
3.7
3.1
18.5
19.7
-
-
ICICI Bank
Buy
225
304
130,513
34,279
39,262
3.3
3.3
21.0
24.4
10.7
9.2
1.8
1.5
14.4
14.7
-
-
IDBI Bank
Neutral
61
-
9,784
9,625
10,455
1.8
1.8
8.5
14.2
7.2
4.3
0.4
0.4
5.9
9.3
-
-
Indian Bank
Neutral
93
-
4,462
6,160
6,858
2.5
2.5
24.5
29.8
3.8
3.1
0.3
0.3
7.7
8.6
-
-
LIC Housing Finance
Buy
467
592
23,570
3,101
3,745
2.5
2.5
33.0
40.2
14.2
11.6
2.6
2.3
19.7
20.5
-
-
Oriental Bank
Neutral
104
-
3,123
7,643
8,373
2.4
2.4
37.2
45.4
2.8
2.3
0.3
0.2
8.2
9.4
-
-
Punjab Natl.Bank
Neutral
92
-
18,085
23,638
26,557
2.8
2.8
17.9
27.2
5.2
3.4
0.5
0.4
8.5
12.0
-
-
South Ind.Bank
Neutral
18
-
2,478
1,965
2,185
2.5
2.5
2.5
3.3
7.4
5.6
0.7
0.7
9.5
11.7
-
-
St Bk of India
Buy
185
237
143,417
82,520
93,299
2.7
2.8
20.0
24.5
9.2
7.6
1.0
0.9
11.5
12.8
-
-
Union Bank
Neutral
114
-
7,816
12,646
14,129
2.3
2.4
31.0
39.1
3.7
2.9
0.4
0.3
9.8
11.4
-
-
Vijaya Bank
Neutral
31
-
2,646
3,536
3,827
1.9
1.9
5.5
6.7
5.6
4.6
0.5
0.4
7.8
8.8
-
-
Yes Bank
Buy
663
825
27,802
7,190
9,011
3.2
3.3
58.2
69.7
11.4
9.5
2.0
1.7
19.2
19.6
-
-
FMCG
Asian Paints
Neutral
880
-
84,361
16,553
19,160
16.0
16.2
17.7
21.5
49.8
40.9
13.2
11.9
29.4
31.2
4.9
4.3
Britannia
Neutral
2,860
-
34,311
8,065
9,395
9.6
10.2
47.2
65.5
60.6
43.7
20.1
19.0
38.3
41.2
4.1
3.5
Colgate
Neutral
917
-
24,948
4,836
5,490
19.5
19.7
48.5
53.2
18.9
17.2
13.9
12.1
99.8
97.5
5.0
4.4
Dabur India
Accumulate
251
267
44,190
9,370
10,265
17.1
17.2
7.3
8.1
34.3
31.0
10.3
8.4
33.7
30.6
4.6
4.2
GlaxoSmith Con*
Neutral
5,942
-
24,988
4,919
5,742
17.2
17.4
168.3
191.2
35.3
31.1
10.0
8.5
28.8
28.9
4.6
3.9
Godrej Consumer
Neutral
1,243
-
42,342
10,168
12,886
16.1
16.1
32.1
38.4
38.7
32.4
7.9
7.3
19.7
21.0
4.3
3.4
Stock Watch
January 18, 2016
Company Name
Reco
CMP
Target
Mkt Cap
Sales ( Čcr )
OPM(%)
EPS (Č)
PER(x)
P/BV(x)
RoE(%)
EV/Sales(x)
(Č)
Price ( Č)
( Č cr )
FY16E FY17E
FY16E
FY17E
FY16E
FY17E
FY16E
FY17E
FY16E
FY17E
FY16E
FY17E
FY16E
FY17E
FMCG
HUL
Neutral
804
-
174,008
34,940
38,957
17.5
17.7
20.8
24.7
38.7
32.6
43.0
34.4
110.5
114.2
4.8
4.3
ITC
Buy
314
382
252,151
41,068
45,068
37.8
37.4
13.9
15.9
22.5
19.7
7.6
6.7
34.1
33.8
5.8
5.2
Marico
Neutral
225
-
29,029
6,551
7,766
15.7
16.0
10.4
12.5
21.7
18.0
6.3
5.2
33.2
32.4
4.4
3.7
Nestle*
Buy
5,600
6,646
53,992
11,291
12,847
22.2
22.3
158.9
184.6
35.2
30.3
18.4
16.6
55.0
57.3
4.6
4.0
Tata Global
Accumulate
129
144
8,110
8,635
9,072
9.8
9.9
6.5
7.6
19.8
16.9
2.0
1.9
6.8
7.4
0.9
0.8
IT
HCL Tech^
Buy
838
1,132
118,051
42,038
47,503
23.2
23.5
55.8
62.9
15.0
13.3
3.5
2.6
23.0
19.8
2.4
1.9
Infosys
Accumulate
1,140
1,306
261,898
60,250
66,999
27.0
28.0
56.4
63.7
20.2
17.9
4.1
3.5
20.4
19.8
3.6
3.1
TCS
Buy
2,264
2,854
446,006
108,487
122,590
28.3
28.5
122.8
138.4
18.4
16.4
7.0
6.4
38.0
38.9
3.7
3.2
Tech Mahindra
Buy
520
646
50,300
25,566
28,890
16.0
17.0
26.3
31.9
19.8
16.3
3.6
3.0
17.9
18.6
1.7
1.5
Wipro
Buy
543
719
134,254
50,808
58,713
23.7
23.8
37.3
42.3
14.6
12.9
2.8
2.5
19.0
17.9
2.2
1.7
Media
D B Corp
Accumulate
318
356
5,837
2,241
2,495
27.8
27.9
21.8
25.6
14.6
12.4
3.8
3.4
26.7
28.5
2.5
2.3
HT Media
Neutral
82
-
1,911
2,495
2,603
11.2
11.2
7.3
8.6
11.3
9.6
0.9
0.8
7.4
8.1
0.3
0.3
Jagran Prakashan
Buy
155
189
5,075
2,170
2,355
27.2
26.2
8.9
9.9
17.4
15.7
3.7
3.2
20.9
20.5
2.2
2.1
Sun TV Network
Neutral
377
-
14,867
2,779
3,196
70.2
70.5
22.8
27.3
16.6
13.8
4.1
3.7
26.7
28.3
5.1
4.4
Hindustan Media
Neutral
283
-
2,073
920
1,031
20.0
20.0
19.2
20.9
14.7
13.5
2.4
2.1
16.4
15.3
1.8
1.6
Ventures
Metals & Mining
Coal India
Buy
318
380
200,987
76,167
84,130
19.9
22.3
22.4
25.8
14.2
12.3
5.1
5.0
35.5
41.0
2.0
1.8
Hind. Zinc
Buy
139
175
58,690
14,641
14,026
50.4
50.4
17.7
16.0
7.9
8.7
1.2
1.1
16.2
13.2
1.6
1.5
Hindalco
Neutral
72
-
14,847
104,356
111,186
8.7
9.5
6.7
11.1
10.7
6.5
0.4
0.4
3.5
5.9
0.7
0.6
JSW Steel
Neutral
975
-
23,578
42,308
45,147
16.4
20.7
(10.3)
49.5
19.7
1.1
1.1
(1.0)
5.6
1.6
1.5
NMDC
Neutral
86
-
34,097
8,237
10,893
46.6
44.5
10.0
11.7
8.7
7.4
1.0
0.8
12.5
13.0
3.9
3.0
SAIL
Neutral
42
-
17,491
45,915
53,954
7.2
10.5
1.5
4.4
28.1
9.7
0.4
0.4
2.3
4.1
1.0
0.9
Vedanta
Neutral
73
-
21,598
71,445
81,910
26.2
26.3
12.9
19.2
5.7
3.8
0.4
0.4
7.2
8.9
0.8
0.6
Tata Steel
Neutral
230
-
22,328
126,760
137,307
8.9
11.3
6.4
23.1
36.1
10.0
0.7
0.7
2.0
7.1
0.8
0.7
Oil & Gas
Cairn India
Neutral
120
-
22,414
11,323
12,490
49.4
51.0
20.7
20.7
5.8
5.8
0.4
0.4
6.4
6.1
1.1
0.4
GAIL
Neutral
336
-
42,640
64,856
70,933
9.1
9.6
24.0
28.9
14.0
11.6
1.2
1.1
8.8
9.6
0.8
0.8
ONGC
Neutral
220
-
187,836
154,564
167,321
36.8
37.4
28.6
32.5
7.7
6.8
1.0
0.9
12.7
13.5
1.4
1.3
Petronet LNG
Neutral
252
-
18,896
29,691
31,188
5.8
6.2
12.8
13.4
19.7
18.8
2.9
2.6
15.8
14.8
0.7
0.7
Indian Oil Corp
Accumulate
427
455
103,589
359,607
402,760
5.9
6.1
42.5
48.7
10.1
8.8
1.3
1.2
14.1
14.4
0.4
0.3
Reliance Industries
Accumulate
1,073
1,150
347,616
304,775
344,392
12.6
13.4
91.3
102.6
11.8
10.5
1.3
1.2
11.8
12.0
1.1
0.9
Stock Watch
January 18, 2016
Company Name
Reco
CMP
Target
Mkt Cap
Sales ( Čcr )
OPM(%)
EPS (Č)
PER(x)
P/BV(x)
RoE(%)
EV/Sales(x)
(Č)
Price ( Č)
( Č cr )
FY16E FY17E
FY16E
FY17E
FY16E
FY17E
FY16E
FY17E
FY16E
FY17E
FY16E
FY17E
FY16E
FY17E
Pharmaceuticals
Alembic Pharma
Neutral
623
-
11,744
2,658
3,112
24.1
20.2
24.6
23.9
25.3
26.1
9.1
7.0
42.5
30.2
4.4
3.7
Aurobindo Pharma
Accumulate
815
856
47,579
14,923
17,162
22.0
23.0
35.7
42.8
22.8
19.0
6.7
5.1
34.0
30.2
3.6
3.0
Aventis*
Neutral
4,199
-
9,670
2,082
2,371
17.4
20.8
118.2
151.5
35.5
27.7
5.2
4.2
19.9
25.5
4.3
3.6
Cadila Healthcare
Accumulate
308
352
31,542
10,224
11,840
21.0
22.0
14.6
17.6
21.1
17.5
5.8
4.5
30.8
29.0
3.2
2.6
Cipla
Neutral
607
-
48,789
14,211
16,611
20.6
19.0
27.0
28.9
22.5
21.0
3.8
3.3
18.4
16.8
3.4
2.9
Dr Reddy's
Buy
2,937
3,933
50,081
16,838
19,575
25.0
23.1
167.5
178.8
17.5
16.4
3.7
3.1
23.1
20.4
2.9
2.5
Dishman Pharma
Neutral
315
-
2,540
1,733
1,906
21.5
21.5
17.0
19.9
18.5
15.8
1.9
1.7
10.5
11.2
2.0
1.7
GSK Pharma*
Neutral
3,182
-
26,955
2,870
3,158
20.0
22.1
59.5
68.3
53.5
46.6
15.8
16.2
28.5
34.3
8.9
8.1
Indoco Remedies
Neutral
308
-
2,841
1,033
1,199
15.9
18.2
9.4
13.6
32.8
22.7
4.9
4.1
15.7
19.7
2.8
2.5
Ipca labs
Buy
615
900
7,758
3,363
3,909
12.9
18.6
13.4
28.0
45.9
22.0
3.3
2.9
7.4
14.0
2.6
2.2
Lupin
Neutral
1,701
-
76,614
13,092
16,561
25.0
27.0
50.4
68.3
33.7
24.9
7.0
5.5
22.8
24.7
5.6
4.3
Sun Pharma
Buy
786
950
189,135
28,163
32,610
25.8
30.7
17.4
26.9
45.2
29.2
4.3
3.7
13.0
16.6
6.2
5.1
Power
Tata Power
Neutral
62
-
16,701
35,923
37,402
22.6
22.8
4.1
5.2
15.2
12.0
1.2
1.1
7.5
9.3
1.4
1.3
NTPC
Buy
137
157
112,633
87,064
98,846
23.5
23.5
11.7
13.2
11.7
10.4
1.3
1.2
11.4
12.1
2.3
2.1
Power Grid
Buy
139
170
72,902
20,702
23,361
86.7
86.4
12.1
13.2
11.5
10.6
1.7
1.5
15.6
15.1
8.4
7.9
Telecom
Bharti Airtel
Neutral
306
-
122,440
101,748
109,191
32.1
31.7
12.0
12.5
25.5
24.5
1.8
1.7
6.9
6.7
1.8
1.7
Idea Cellular
Neutral
113
-
40,594
34,282
36,941
32.0
31.5
5.9
6.2
19.1
18.2
1.8
1.6
9.9
9.3
1.8
1.7
zOthers
Abbott India
Neutral
5,427
-
11,533
2,715
3,153
14.5
14.1
134.3
152.2
40.4
35.7
10.1
8.3
27.4
25.6
4.0
3.4
Bajaj Electricals
Buy
182
290
1,838
4,719
5,287
5.2
5.8
8.6
12.7
21.3
14.4
2.4
2.1
11.4
14.8
0.4
0.3
Finolex Cables
Neutral
231
-
3,531
2,520
2,883
12.2
12.0
12.7
14.2
18.2
16.3
2.5
2.2
13.6
13.5
1.1
1.0
Goodyear India*
Buy
497
622
1,147
1,888
1,680
12.1
11.9
62.2
56.6
8.0
8.8
1.9
1.6
25.9
19.7
0.4
0.4
Hitachi
Neutral
1,087
-
2,956
1,779
2,081
7.8
8.8
21.8
33.4
49.9
32.5
8.1
6.5
17.4
22.1
1.7
1.5
Jyothy Laboratories
Neutral
293
-
5,307
1,620
1,847
11.5
11.5
7.3
8.5
40.2
34.6
5.2
4.8
13.3
14.4
3.1
2.7
MRF
Buy
37,625
45,575
15,957
20,316
14,488
21.4
21.1
5,488.0
3,798.0
6.9
9.9
2.3
1.9
41.1
21.2
0.7
1.0
Page Industries
Neutral
12,614
-
14,070
1,929
2,450
19.8
20.1
229.9
299.0
54.9
42.2
24.2
16.8
52.1
47.1
7.3
5.7
Relaxo Footwears
Neutral
443
-
5,320
1,767
2,152
12.3
12.5
19.3
25.1
23.0
17.7
5.7
4.3
27.7
27.8
3.1
2.5
Siyaram Silk Mills
Buy
1,129
1,354
1,059
1,636
1,815
11.5
11.5
89.9
104.1
12.6
10.8
2.1
1.8
17.9
17.8
0.8
0.7
Styrolution ABS India*
Neutral
680
-
1,196
1,271
1,440
8.6
9.2
32.0
41.1
21.2
16.6
2.2
1.9
10.7
12.4
0.9
0.8
TVS Srichakra
Buy
2,486
3,240
1,904
2,101
2,338
15.7
15.0
248.6
270.0
10.0
9.2
4.4
3.1
43.6
34.0
0.9
0.8
Stock Watch
January 18, 2016
Company Name
Reco
CMP
Target
Mkt Cap
Sales ( Čcr )
OPM(%)
EPS (Č)
PER(x)
P/BV(x)
RoE(%)
EV/Sales(x)
(Č)
Price ( Č)
( Č cr )
FY16E
FY17E
FY16E
FY17E
FY16E
FY17E
FY16E
FY17E
FY16E
FY17E
FY16E
FY17E
FY16E
FY17E
zOthers
HSIL
Accumulate
278
302
2,011
2,123
2,384
16.1
16.5
15.0
18.9
18.5
14.7
1.4
1.3
8.0
9.4
1.3
1.1
Kirloskar Engines India
Neutral
240
-
3,471
2,471
2,826
8.8
10.4
9.1
13.3
26.3
18.0
2.5
2.3
9.7
13.4
1.1
0.9
Ltd
M M Forgings
Buy
517
614
624
511
615
21.7
21.6
43.1
55.8
12.0
9.3
2.2
1.8
19.9
21.2
1.4
1.1
Banco Products (India) Neutral
128
-
918
1,208
1,353
11.0
12.3
10.8
14.5
11.9
8.9
1.4
1.2
11.9
14.5
0.7
0.6
Competent Automobiles Neutral
148
-
91
1,040
1,137
3.2
3.1
25.7
28.0
5.7
5.3
0.9
0.8
15.0
14.3
0.1
0.1
Nilkamal
Neutral
1,291
-
1,927
1,910
2,083
10.5
10.3
63.3
69.2
20.4
18.7
3.3
2.9
17.6
16.5
1.1
0.9
Visaka Industries
Buy
106
144
169
1,086
1,197
9.9
10.3
21.5
28.8
4.9
3.7
0.5
0.4
9.6
11.6
0.4
0.3
Transport Corporation of
Neutral
262
-
1,992
2,830
3,350
8.8
9.0
14.4
18.3
18.2
14.3
2.8
2.4
15.4
17.1
0.8
0.7
India
Elecon Engineering
Buy
68
85
743
1,369
1,533
13.7
14.9
3.3
6.1
20.5
11.3
1.3
1.2
6.6
11.4
0.9
0.8
Surya Roshni
Buy
144
201
631
2,992
3,223
8.1
8.4
14.7
18.3
9.8
7.9
0.9
0.8
9.7
11.0
0.5
0.5
MT Educare
Neutral
171
-
679
286
366
18.3
17.7
7.7
9.4
22.1
18.2
4.7
4.1
20.2
21.1
2.3
1.7
Radico Khaitan
Buy
105
156
1,392
1,565
1,687
12.2
13.0
5.7
7.1
18.4
14.7
1.5
1.4
8.3
9.6
1.4
1.2
Garware Wall Ropes
Buy
369
473
807
862
974
11.2
11.2
24.9
29.6
14.8
12.5
2.2
1.9
15.1
15.4
0.9
0.8
Wonderla Holidays
Neutral
361
-
2,041
206
308
44.0
43.6
9.0
12.9
40.1
28.0
5.5
5.0
13.7
17.8
9.8
6.5
Linc Pen & Plastics
Neutral
212
-
313
340
371
8.3
8.9
10.8
13.2
19.6
16.0
3.1
2.7
16.0
17.1
1.0
0.9
The Byke Hospitality
Neutral
150
-
603
222
287
20.5
20.5
5.6
7.6
26.7
19.9
5.0
4.1
18.9
20.8
2.8
2.1
Interglobe Aviation
Neutral
1,176
-
42,387
17,022
21,122
20.7
14.5
63.9
53.7
18.4
21.9
27.6
22.6
149.9
103.2
2.5
2.0
Coffee Day Enterprises
Neutral
254
-
5,227
2,692
2,964
17.0
18.6
-
4.7
-
53.6
3.1
2.9
0.2
5.5
2.3
2.2
Ltd
Navneet Education
Neutral
85
-
2,025
998
1,062
24.1
24.0
5.8
6.1
14.8
14.0
3.3
2.9
22.0
20.6
2.1
2.0
Navkar Corporation
Buy
200
265
2,859
365
436
38.3
37.5
5.6
5.9
35.6
34.1
2.2
2.1
6.3
6.1
8.6
7.4
Source: Company, Angel Research; Note: *December year end; #September year end; &October year end; Price as on January 15, 2016
Market Outlook
January 18, 2016
Research Team Tel: 022 - 39357800
DISCLAIMER
Angel Broking Private Limited (hereinafter referred to as “Angel”) is a registered Member of National Stock Exchange of India Limited,
Bombay Stock Exchange Limited and Metropolitian Stock Exchange of India Limited. It is also registered as a Depository Participant with
CDSL and Portfolio Manager with SEBI. It also has registration with AMFI as a Mutual Fund Distributor. Angel Broking Private Limited is a
registered entity with SEBI for Research Analyst in terms of SEBI (Research Analyst) Regulations, 2014 vide registration number
INH000000164. Angel or its associates has not been debarred/ suspended by SEBI or any other regulatory authority for accessing
/dealing in securities Market. Angel or its associates including its relatives/analyst do not hold any financial interest/beneficial ownership
of more than 1% in the company covered by Analyst. Angel or its associates/analyst has not received any compensation / managed or co
-managed public offering of securities of the company covered by Analyst during the past twelve months. Angel/analyst has not served as
an officer, director or employee of company covered by Analyst and has not been engaged in market making activity of the company
covered by Analyst.
This document is solely for the personal information of the recipient, and must not be singularly used as the basis of any investment
decision. Nothing in this document should be construed as investment or financial advice. Each recipient of this document should make
such investigations as they deem necessary to arrive at an independent evaluation of an investment in the securities of the companies
referred to in this document (including the merits and risks involved), and should consult their own advisors to determine the merits and
risks of such an investment.
Reports based on technical and derivative analysis center on studying charts of a stock's price movement, outstanding positions and
trading volume, as opposed to focusing on a company's fundamentals and, as such, may not match with a report on a company's
fundamentals.
The information in this document has been printed on the basis of publicly available information, internal data and other reliable sources
believed to be true, but we do not represent that it is accurate or complete and it should not be relied on as such, as this document is for
general guidance only. Angel Broking Pvt. Limited or any of its affiliates/ group companies shall not be in any way responsible for any
loss or damage that may arise to any person from any inadvertent error in the information contained in this report. Angel Broking Pvt.
Limited has not independently verified all the information contained within this document. Accordingly, we cannot testify, nor make any
representation or warranty, express or implied, to the accuracy, contents or data contained within this document. While Angel Broking
Pvt. Limited endeavors to update on a reasonable basis the information discussed in this material, there may be regulatory, compliance,
or other reasons that prevent us from doing so.
This document is being supplied to you solely for your information, and its contents, information or data may not be reproduced,
redistributed or passed on, directly or indirectly.
Neither Angel Broking Pvt. Limited, nor its directors, employees or affiliates shall be liable for any loss or damage that may arise from or
in connection with the use of this information.
Note: Please refer to the important ‘Stock Holding Disclosure' report on the Angel website (Research Section). Also, please refer to the
latest update on respective stocks for the disclosure status in respect of those stocks. Angel Broking Pvt. Limited and its affiliates may have
investment positions in the stocks recommended in this report.