Market Outlook
November 16, 2015
Market Cues
Domestic Indices
Chg (%)
(Pts)
(Close)
Indian markets are expected to open in red tracking SGX Nifty and Asian peers.
BSE Sensex
(1.0)
(256)
25,611
US markets closed in the red following the recent trend of a negative close in 7 of
Nifty
(0.8)
(63)
7,762
the last 8 trading sessions. The continued weakness was on account of weak retail
Mid Cap
(1.4)
(148)
10,653
sales data, which rose less than expected in the month of October. A separate Labor
Small Cap
(0.8)
(86)
11,125
Department report also showed an unexpected drop in producer prices in October.
Bankex
(0.2)
(33)
19,362
European stocks also ended sharply negative led by weaker than expected Eurozone
GDP data and a sharp fall in mining stocks led by decline in commodity prices.
Global Indices
Chg (%)
(Pts)
(Close)
After a bit of enthusiasm in the auspicious Mahurat trading for Diwali, markets had
Dow Jones
(1.2)
(203)
17,245
another dismal trading session led by weak macro data and negative global cues.
Nasdaq
(1.5)
(77)
4,928
IIP growth was sharply lower than expected in September at 3.6% from 6.3% in
August, while retail inflation inched up for the third successive month in October to
FTSE
(1.0)
(60)
6,118
5%.
Nikkei
(0.5)
(101)
19,597
Hang Seng
(2.2)
(493)
22,396
News & Result Analysis
Shanghai Com
(1.4)
(52)
3,581
Radico Khaitan (Target Upgrade)
Result Review: Coal India, Linc Pen & Plastics, Visaka Industries, Competent
Auto
Advances / Declines
BSE
NSE
Detailed analysis on Pg2
Advances
907
448
Declines
1,687
1,068
Investor’s Ready Reckoner
Unchanged
150
57
Key Domestic & Global Indicators
Stock Watch: Latest investment recommendations on 150+ stocks
Volumes (` Cr)
Refer P6 onwards
BSE
2,632
Top Picks
NSE
17,260
CMP
Target
Upside
Company
Sector
Rating
(`)
(`)
(%)
Axis Bank
Financials
Buy
484
630
30.1
Net Inflows (` Cr)
Net
Mtd
Ytd
HCL Tech
IT
Buy
843
1,132
34.4
FII
(713)
(1,143)
(15,963)
ICICI Bank
Financials
Buy
262
348
32.9
MFs
(3.5)
1,883
52,230
Ashok Leyland
Automobiles
Buy
90
111
22.9
Larsen & Toubro
Construction
Buy
1,332
1,646
23.6
Top Gainers
Price (`)
Chg (%)
More Top Picks on Pg5
Jindal Steel
79
10.2
Key Upcoming Events
Bharti Airtel
69
9.4
Previous
Consensus
Date
Region
Event Description
Renuka
12
7.0
Reading
Expectations
Nov 16
EUR
CPI (YoY) (Oct)
0.0%
0.0%
FSL
36
6.0
Nov 17
GBP
CPI (YoY) (Oct)
-0.1%
-0.1%
CESC
558
5.6
Nov 17
USA
CPI (MoM) (Oct)
0.2%
0.2%
Nov 18
USA
Building Permits (Oct) (mn)
1.105
1.15
Top Losers
Price (`)
Chg (%)
Ibull hsg fin
644
(10.0)
RCom
66
(7.0)
Cairn
131
(5.2)
OIL
372
(5.2)
Godrej Cons
1,258
(5.0)
As on November 13, 2015
Market Outlook
November 16, 2015
Radico Khaitan (Target Upgrade) - (Buy CMP: `122 Target price: `156)
The IFML segment is under penetrated and leaves scope for growth for domestic
liquor companies. Going forward, increase in income levels would lead to higher
growth in IFML brands. RKL (Radico Khaitan) has strong brands in the premium
liquor category, which should lead to higher revenue for the company. The
company's premium offerings reported a CAGR of ~26% over the last seven-year
period, and we expect the growth momentum to continue.
We expect a significant hike in liquor prices in the coming financial year as there
haven't been any significant ones in recent times. Also, we believe that industry
leader - United Spirit would shift focus on profitability over volume growth
considering the debt on its Balance Sheet, which in turn, would lead to increased
scope for other liquor companies to hike prices.
During the 2QFY2016, the company’s net profit grew by 25% yoy to ~`19cr (our
estimate was of ~`15cr) on account of strong operating performance and lower
interest cost (in FY2015 the company has repaid a significant amount of its debt;
further debt reduction is also on the cards)
RKL is trading at 1-year forward EV/Sales multiple of 1.4x, which is at huge
discount to its close peer, United Spirits (4.6x). We have a Buy rating on the stock
and target e have a Buy rating on the stock and target e have a Buy rating on the
stock and target price of 156 (22x FY2017E EPS).
Result Review
Coal India (CMP: `337 / TP: `400 / Upside: 18%)
Coal India reported revenue and EBITDA in line with our expectations. Total
revenue increased 8.2% yoy to `16,958cr, in line with our estimate of `16,833cr.
While production was slightly below our estimate at 108.2MT for the quarter (vs.
our estimate of 110.6), oft-take volumes were marginally ahead of expectations at
121.8MT (Our estimate 119.1MT). Off-take was higher in the FSA segment with e-
auction and washeries volumes in line with expectations. FSA realizations were in
line with expectations at `1,294/T. However, e-auction realizations came in much
lower than expected at `1,788. This was partially offset by better than expected
washeries realizations of `2,328. Lower than expected material and overburden
expenses were offset by a marginal increase in staff and other expenses resulting
in an EBITDA of `3,008cr, as against our estimate of `3,106cr. Net profit at
`2,544cr was slightly ahead of expectations (our estimate `2,445) led by lower
than expected tax expenses and marginally higher than expected other income.
While the slow growth in production remains a concern, off-take is increasing at
an healthy pace. We have a Buy rating on the stock with a price target of `400.
Y/E
Sales OPM
PAT EPS ROE P/E P/BV EV/EBITDA EV/Sales
March
(` cr)
(%)
(` cr)
(`)
(%)
(x)
(x)
(x)
(x)
FY2016E
76,069
19.9
14,133
22.4
35.5
15.1
5.4
9.3
2.1
FY2017E
83,952
22.8
16,554
26.2
41.5
12.9
5.3
7.3
1.9
Market Outlook
November 16, 2015
Linc Pen & Plastics (CMP: `160 / TP: `185 / Upside: 16%)
Linc Pen & Plastics’ (LPPL) 2QFY2016 results outperformed our estimates on the
bottom-line front. The company’s top-line grew by a healthy ~5% yoy to ~`88cr
(our estimates was of ~`89cr), mainly due to growth in domestic and exports
segment. On the operating front, the company reported margin expansion (up by
96bp yoy to 9.1%), primarily on account of lower raw material costs. The reported
net profit grew by 23% yoy to ~`5cr (our estimates was of around ~`4cr) on
account of strong operating performance and lower interest cost.
Going ahead, we expect LPPL to report a top-line CAGR of ~8% over FY2015-17E
to ~`371cr owing to strong domestic as well as export sales. On the bottom-line
front, we expect the company to report ~17% CAGR over FY2015-17E. This would
be on account of expansion in operating margin on the back of lower material
prices and higher exports, which is a high margin business. Further, the company
has reduced its debt significantly, which will lead to cost saving for the company.
Currently, we are positive on LPPL and recommend a BUY rating on the stock.
Visaka Industries (CMP: `130/ TP: `146/ Upside: 13%)
For 2QFY2016, Visaka Industries reported a mixed set of numbers. The top-line at
`192cr (8.2% yoy decline) was marginally below our estimates of `205cr. The
EBITDA declined by 21.6% yoy to `15cr and EBITDA margin contracted by 135bp
yoy to 7.9% owing to 109bp yoy increase in raw material cost as a percentage of
sales to 50.2% and 157bp yoy increase in employee expense to 8.0% of sales. The
other expenses declined by 131bp yoy to 33.9% of sales. We had built in EBITDA
margin estimate of 6.4%. Consequently, the net profit declined by 78.9% yoy to
`0.8cr. We had estimated net profit to be at `1.5cr.
The sales from the Building products segment de-grew by 7.7% yoy to `147.7cr,
while that of Synthetic yarn segment declined by 13.2% yoy to `41.9cr. The
Building products segment reported EBIT of `3.5cr and EBIT margins of 2.3% as
against EBIT and EBIT margins of `6.7cr and 4.2%, respectively a year ago. The
Synthetic yarn division reported EBIT and EBIT margins of `7.1cr and 16.9%
respectively, as against `6.0cr and 12.4%, a year ago.
At the current market price, the stock is trading at PE of 4.4x its FY2017E earnings.
We have an Accumulate rating on the stock with a target price of `146.
Y/E
Sales OPM
PAT
EPS ROE P/E P/BV EV/EBITDA EV/Sales
March
(` cr)
(%)
(` cr)
(`)
(%)
(x)
(x)
(x)
(x)
FY2016E
1,058
9.9
33
20.8
9.3
6.2
0.6
4.3
0.4
FY2017E
1,203
10.0
46
29.2
11.8
4.4
0.5
3.7
0.4
Competent Auto (CMP: `140 / TP: - / Upside: -)
For 2QFY2016, Competent Auto reported a decent set of numbers. The top-line
for the quarter grew by 12.2% yoy to `220cr, which is slightly lower than our
estimates of `226cr. The revenue growth is in-line with growth reported by Maruti
Suzuki in 2QFY2016, where the top-line grew by 13.1% yoy largely owing to 10%
volume growth. The EBIDTA for the quarter came in at `6cr as against `5cr, a year
ago. EBIDTA margins for the quarter improved by 9bp yoy to 2.7% as against
Market Outlook
November 16, 2015
2.6% in 2QFY2015. The Interest expense for the quarter grew by 40% yoy to
`1.6cr as against `1.2cr. Consequently, the net profit came in at `2.6cr, growing
by 21.6% on yoy basis.
At current market price, the stock is trading at 5.1x its FY2017E earnings. We have
a Neutral view on the stock.
Y/E
Sales OPM
PAT
EPS ROE P/E P/BV EV/EBITDA EV/Sales
March
(` cr)
(%)
(` cr)
(`)
(%)
(x)
(x)
(x)
(x)
FY2016E
1,040
3.2
16
26.3
15.3
5.6
0.8
2.2
0.1
FY2017E
1,137
3.1
18
28.5
14.5
5.1
0.7
1.8
0.1
Economic and Political News
Petrol hiked by 36 paise a liter; diesel costlier by 87 paise
NCAER lowers GDP forecast to 7.4% for FY2016 because of slowdown in
agriculture due to deficient monsoon.
Bank credit growth still lingers in H1 with annual growth of 8.4% while debt
market soars with debt issuances rising 18.6%
India's food industry to be worth $65bn by 2018 from ~$40bn currently:
Report
Corporate News
MTNL to soon launch free roaming
Tata steel looking to sell UK plant: Reports
CIL to appoint consultant for `10,000cr power plant in Odisha
Market Outlook
November 16, 2015
Top Picks ★★★★★
Large Cap
Market Cap
CMP
Target
Upside
Company
Rationale
(` Cr)
(`)
(`)
(%)
To outpace battery industry growth due to better technological
Amara Raja Batteries
15,008
879
1,040
18.4
products leading to market share gains in both the automotive
OEM and replacement segments.
Earnings to grow strongly given the MHCV cyclical upturn.
Ashok Leyland
25,698
90
111
22.9
Focus on exports and LCV's provides additional growth
avenue.
Healthy pace of branch expansion, backed by distribution
Axis Bank
1,15,100
484
630
30.1
network, will be the driving force for the bank’s retail business
and overall earnings.
The stock is trading at attractive valuations and is factoring all
HCL Tech
1,18,487
843
1,132
34.4
the bad news.
Strong visibility for a robust 20% earnings trajectory, coupled
HDFC Bank
2,64,687
1,051
1,262
20.1
with high quality of earnings on account of high quality retail
business and strategic focus on highly rated corporates.
Due to its robust franchise and capital adequacy position, the
bank is well positioned to grow by at least a few percentage
ICICI Bank
1,51,987
262
348
32.9
points higher than the average industry growth rate from a
structural point of view.
Back on the growth trend, expect a long term growth of 14%
Infosys
2,52,767
1,100
1,306
18.7
to be a US$20bn in FY2020.
Well positioned to benefit from such expected gradual
recovery in the overall domestic capex cycle, given its presence
Larsen & Toubro
1,23,960
1,332
1,646
23.6
across various infrastructure segments, its execution
capabilities, and its strong balance sheet.
LICHF continues to grow its retail loan book at a healthy pace
with improvement in asset quality. We expect the company to
LIC Housing Finance
23,510
466
571
22.6
post a healthy loan book which is likely to reflect in a strong
earnings growth.
Source: Company, Angel Research
Mid Cap
Market Cap
CMP
Target
Upside
Company
Rationale
(` Cr)
(`)
(`)
(%)
Government thrust on Renewable sector and strong order
Inox Wind
7,980
360
505
40.4
book would drive future growth.
Change in business focus towards high-margin chronic and
Ipca labs
9,074
719
900
25.1
lifestyle segments and increasing penetration in Europe and
US
Economic recovery to have favourable impact on advertising &
circulation revenue growth. Further, the acquisition of a radio
Jagran Prakashan
4,896
150
169
12.9
business (Radio City) would also boost the company's revenue
growth.
Strong brand & quality teaching with innovative technologies
MT Educare
530
133
169
27.0
& higher government educational spending to boost growth
Earnings boost on back of stable material prices and
Radico Khaitan
1,610
121
128
5.7
favourable pricing environment. Valuation discount to peers
provides additional comfort
Strong brands and distribution network would boost growth
Siyaram Silk Mills
879
938
1,145
22.2
going ahead. Stock currently trades at an inexpensive
valuation.
Structural shift in the Lighting industry towards LED lighting will
Surya Roshni
569
130
183
40.9
drive growth.
Source: Company, Angel Research
Market Outlook
November 16, 2015
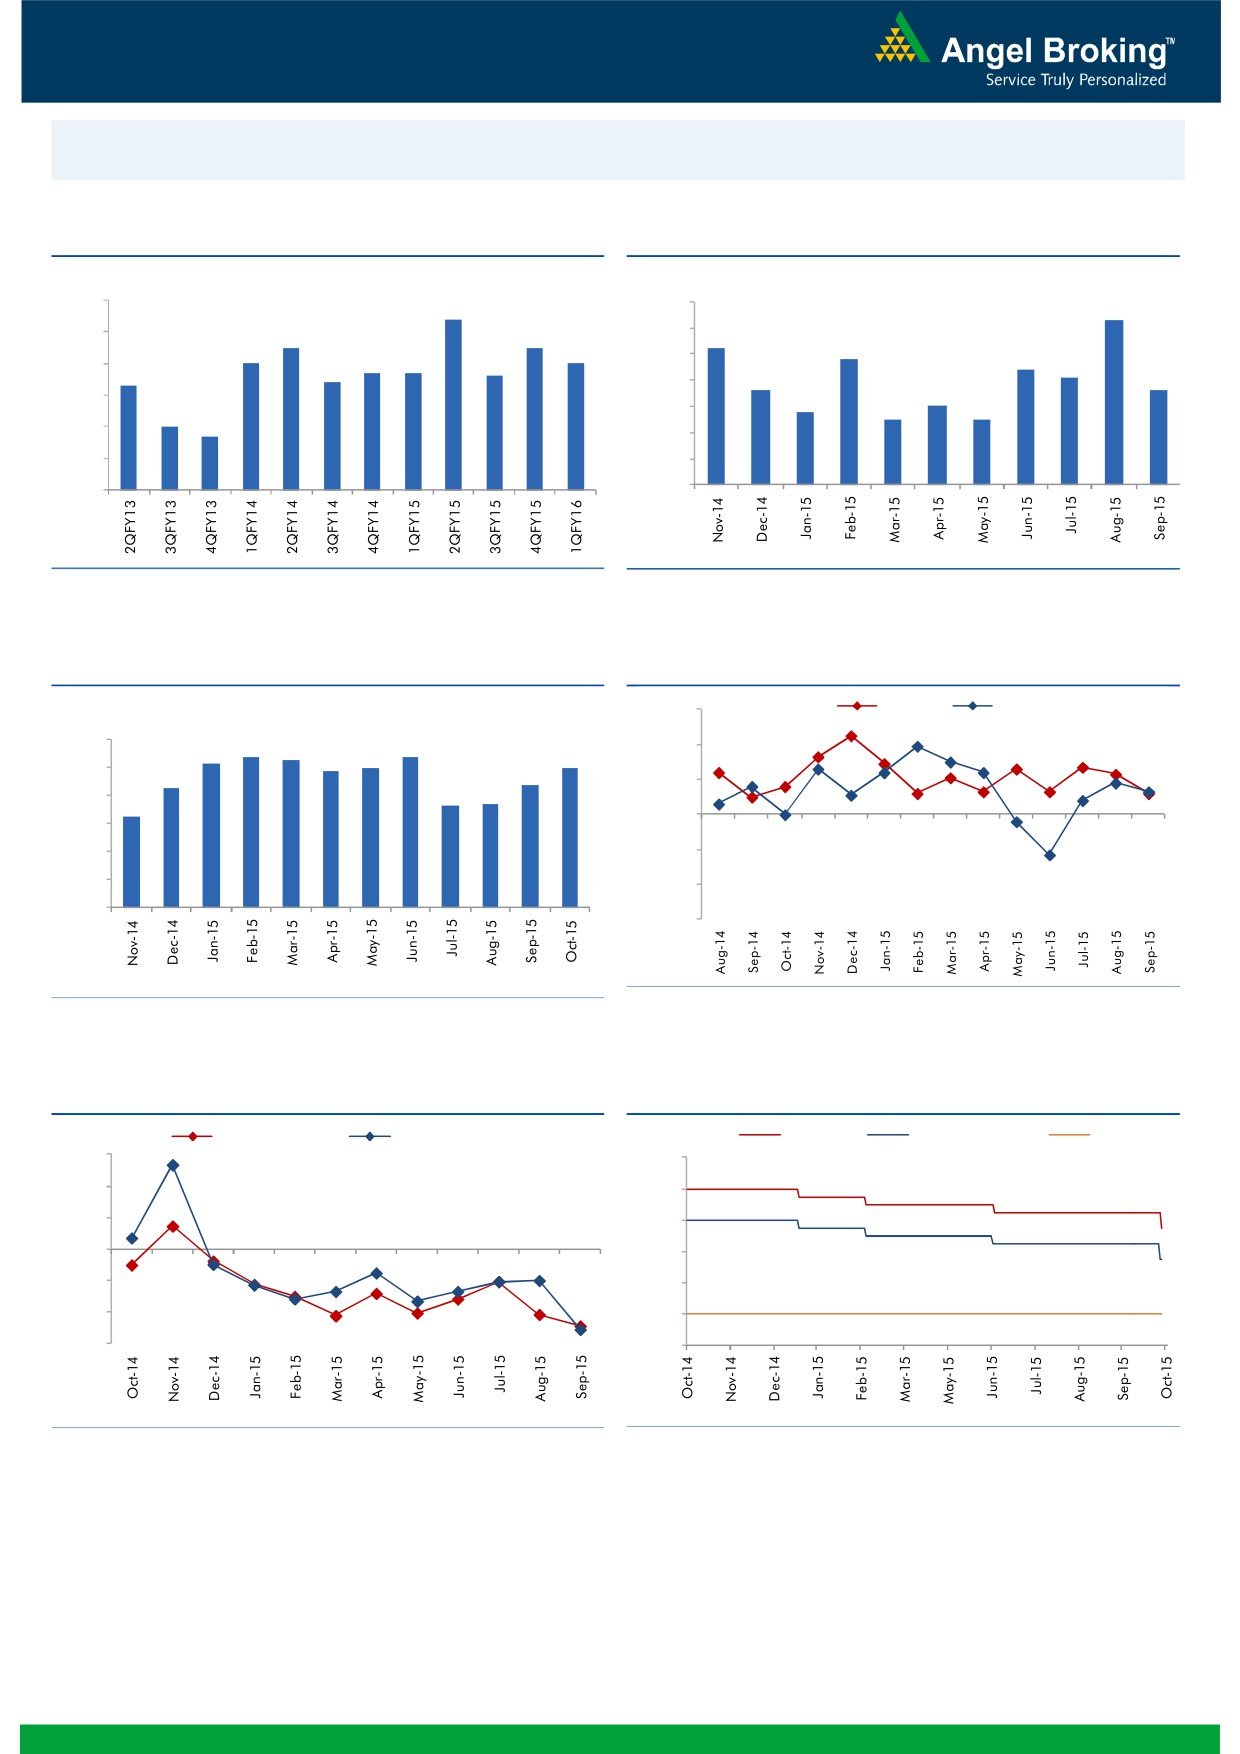
Macro watch
Exhibit 1: Quarterly GDP trends
Exhibit 2: IIP trends
(%)
(%)
9.0
8.4
7.0
6.3
8.0
7.5
7.5
6.0
5.2
7.0
7.0
4.8
6.7
6.7
5.0
4.4
7.0
6.4
6.6
4.1
6.3
3.6
3.6
4.0
6.0
2.8
3.0
2.5
2.5
5.0
3.0
4.7
5.0
2.0
4.0
1.0
3.0
-
Source: CSO, Angel Research
Source: MOSPI, Angel Research
Exhibit 3: Monthly CPI inflation trends
Exhibit 4: Manufacturing and services PMI
(%)
56.0
Mfg. PMI
Services PMI
6.0
5.4
5.3
5.4
54.0
5.2
5.0
5.0
4.9
5.0
4.3
4.4
52.0
3.7
3.7
4.0
3.3
50.0
3.0
2.0
48.0
1.0
46.0
-
44.0
Source: Market, Angel Research; Note: Level above 50 indicates expansion
Source: MOSPI, Angel Research
Exhibit 5: Exports and imports growth trends
Exhibit 6: Key policy rates
(%)
Exports yoy growth
Imports yoy growth
(%)
Repo rate
Reverse Repo rate
CRR
30.0
9.00
20.0
8.00
10.0
7.00
0.0
6.00
(10.0)
5.00
(20.0)
4.00
(30.0)
3.00
Source: Bloomberg, Angel Research
Source: RBI, Angel Research
Market Outlook
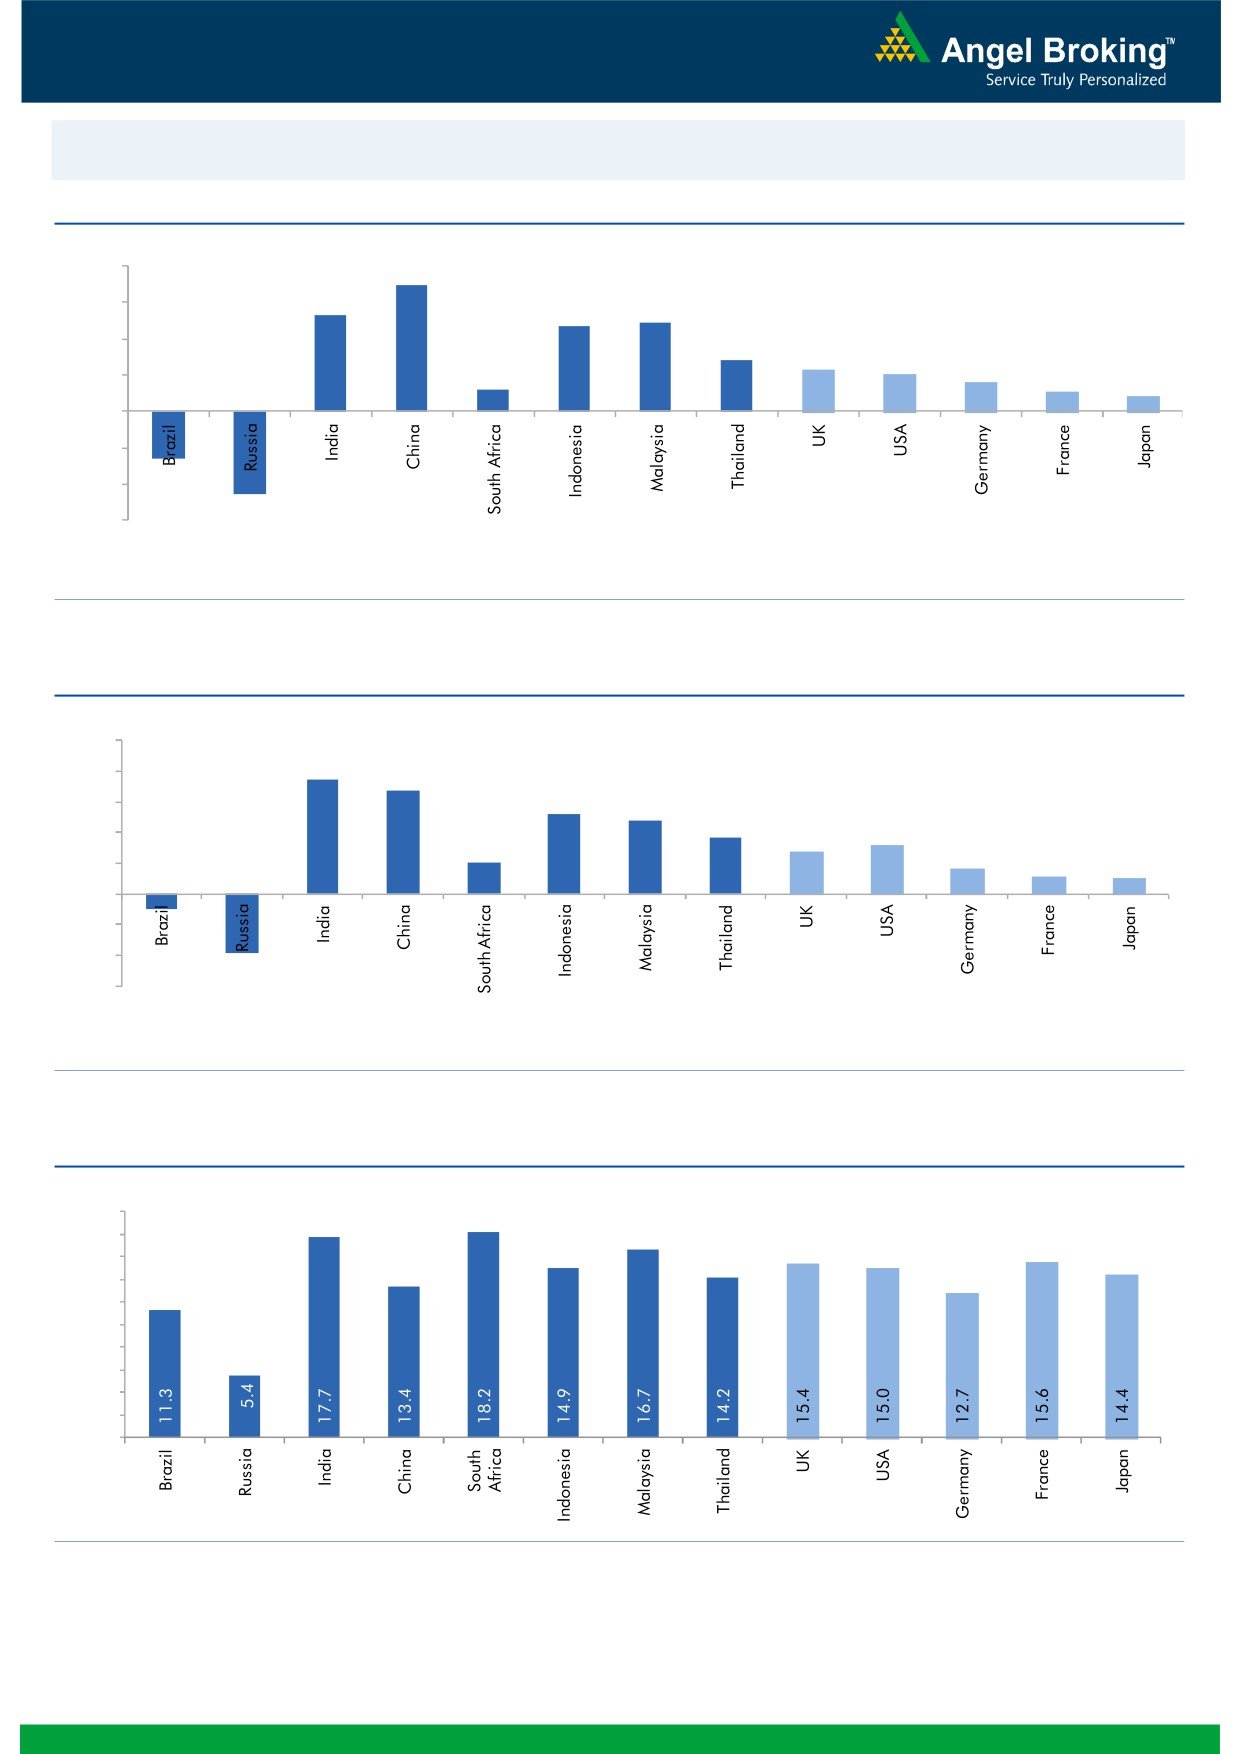
November 16, 2015
Global watch
Exhibit 1: Latest quarterly GDP Growth (%, yoy) across select developing and developed countries
(%)
8.0
6.9
6.0
5.3
4.9
4.7
4.0
2.8
2.3
2.0
1.6
2.0
1.2
1.1
0.8
(2.6)
-
(2.0)
(4.0)
(4.6)
(6.0)
Source: Bloomberg, Angel Research
Exhibit 2: 2015 GDP Growth projection by IMF (%, yoy) across select developing and developed countries
(%)
10.0
7.5
8.0
6.8
5.2
6.0
4.8
3.7
3.1
4.0
2.7
2.0
1.6
1.2
1.0
2.0
-
(2.0)
(4.0)
(1.0)
(3.8)
(6.0)
Source: IMF, Angel Research
Exhibit 3: One year forward P-E ratio across select developing and developed countries
(x)
20.0
18.0
16.0
14.0
12.0
10.0
8.0
6.0
4.0
2.0
-
Source: IMF, Angel Research
Market Outlook
November 16, 2015
Exhibit 4: Relative performance of indices across globe
Returns (%)
Country
Name of index
Closing price
1M
3M
1YR
Brazil
Bovespa
46,517
(1.5)
(5.5)
(10.2)
Russia
Micex
1,728
0.7
2.9
15.2
India
Nifty
7,762
(5.8)
(7.2)
(7.5)
China
Shanghai Composite
3,581
5.6
(7.2)
44.5
South Africa
Top 40
45,979
(3.1)
2.9
1.9
Mexico
Mexbol
43,618
(1.7)
(1.9)
0.6
Indonesia
LQ45
763
(1.2)
(4.7)
(11.9)
Malaysia
KLCI
1,659
(3.4)
1.9
(8.5)
Thailand
SET 50
888
(3.4)
(2.6)
(15.6)
USA
Dow Jones
17,245
0.2
1.9
(2.2)
UK
FTSE
6,118
(4.1)
(5.5)
(8.1)
Japan
Nikkei
19,597
7.1
(4.8)
12.0
Germany
DAX
10,708
6.0
(2.8)
15.7
France
CAC
4,808
2.2
(3.6)
14.4
Source: Bloomberg, Angel Research
Stock Watch
November 16, 2015
Company Name
Reco
CMP
Target
Mkt Cap
Sales ( Čcr )
OPM(%)
EPS (Č)
PER(x)
P/BV(x)
RoE(%)
EV/Sales(x)
(Č)
Price ( Č)
( Č cr )
FY16E FY17E
FY16E
FY17E
FY16E
FY17E
FY16E
FY17E
FY16E
FY17E
FY16E
FY17E
FY16E
FY17E
Agri / Agri Chemical
Rallis
Neutral
196
-
3,811
2,075
2,394
14.4
14.4
9.5
11.0
20.6
17.8
4.1
3.5
21.1
21.3
1.9
1.6
United Phosphorus
Buy
435
510
18,644
13,698
15,752
17.6
17.6
32.1
38.5
13.6
11.3
2.7
2.2
21.4
21.3
1.5
1.2
Auto & Auto Ancillary
Ashok Leyland
Buy
90
111
25,698
18,763
22,357
11.1
11.2
3.6
4.8
25.1
18.8
4.6
4.3
18.7
22.6
1.3
1.1
Bajaj Auto
Accumulate
2,377
2,672
68,783
24,115
27,600
21.3
21.0
136.8
157.2
17.4
15.1
5.6
4.8
32.2
31.5
2.4
2.1
Eicher Motors
Buy
15,616
22,900
42,386
11,809
15,609
15.5
17.0
362.9
567.0
43.0
27.5
13.1
9.7
30.1
35.0
3.5
2.6
Hero Motocorp
Neutral
2,611
-
52,137
28,561
31,559
14.7
14.7
151.1
163.2
17.3
16.0
6.7
5.7
38.7
35.6
1.7
1.5
L G Balakrishnan & Bros Neutral
466
-
732
1,254
1,394
11.6
11.8
35.9
41.7
13.0
11.2
1.8
1.6
13.5
13.8
0.7
0.6
Mahindra and Mahindra Accumulate
1,250
1,410
77,658
38,513
43,579
13.6
13.7
56.1
65.1
22.3
19.2
3.5
3.1
15.7
16.2
1.7
1.4
Maruti
Accumulate
4,624
4,960
139,676
57,865
68,104
16.4
16.7
176.3
225.5
26.2
20.5
5.1
4.3
19.4
21.2
2.2
1.8
Minda Industries
Accumulate
730
809
1,158
2,567
2,965
8.0
8.3
46.1
57.8
15.8
12.6
2.6
2.2
16.7
17.3
0.6
0.5
Rane Brake Lining
Accumulate
336
366
266
454
511
11.1
11.4
23.8
28.1
14.1
12.0
2.0
1.8
14.2
15.3
0.7
0.7
Setco Automotive
Neutral
205
-
547
594
741
12.7
13.7
8.4
15.8
24.4
13.0
2.5
2.2
10.4
16.9
1.4
1.1
Tata Motors
Accumulate
403
424
116,311
264,038
297,882
13.8
13.9
34.5
38.9
11.7
10.4
2.0
1.7
17.6
16.8
0.6
0.6
TVS Motor
Accumulate
296
313
14,077
11,845
14,040
7.2
9.0
10.4
17.4
28.5
17.0
7.1
5.5
25.1
32.0
1.2
1.0
Amara Raja Batteries
Buy
879
1,040
15,008
4,892
5,871
17.4
17.6
28.8
37.1
30.5
23.7
7.1
5.7
23.4
24.1
3.0
2.5
Exide Industries
Accumulate
145
162
12,325
6,950
7,784
14.4
14.8
6.6
7.3
22.0
19.9
2.8
2.5
12.6
12.8
1.5
1.3
Apollo Tyres
Accumulate
155
171
7,895
12,146
12,689
16.8
16.0
21.2
19.0
7.3
8.2
1.2
1.1
16.5
13.0
0.7
0.8
Ceat
Accumulate
983
1,119
3,974
6,041
6,597
14.1
13.7
99.5
111.9
9.9
8.8
1.9
1.6
19.6
18.5
0.8
0.7
JK Tyres
Neutral
92
-
2,093
7,446
7,669
15.2
14.0
19.6
18.4
4.7
5.0
1.2
1.0
25.2
19.5
0.7
0.6
Swaraj Engines
Neutral
937
-
1,163
552
630
14.2
14.7
44.6
54.1
21.0
17.3
4.9
4.4
23.2
25.6
2.0
1.7
Subros
Neutral
87
-
519
1,268
1,488
11.6
11.9
3.7
6.6
23.4
13.1
1.6
1.4
6.8
11.4
0.7
0.6
Indag Rubber
Neutral
195
-
511
283
329
17.0
17.2
13.0
15.4
15.0
12.6
3.3
2.7
21.8
21.6
1.5
1.3
Capital Goods
ACE
Neutral
45
-
449
660
839
4.7
8.2
1.0
3.9
45.4
11.6
1.4
1.3
3.2
11.3
0.8
0.7
BEML
Neutral
1,093
-
4,553
3,277
4,006
6.0
8.9
29.2
64.3
37.5
17.0
2.1
1.9
5.7
11.7
1.5
1.2
BGR Energy
Neutral
112
-
805
3,615
3,181
9.5
9.4
16.7
12.4
6.7
9.0
0.6
0.6
10.0
7.0
0.6
0.8
BHEL
Neutral
178
-
43,531
33,722
35,272
10.8
11.7
10.5
14.2
16.9
12.5
1.3
1.2
7.0
9.0
1.4
1.3
Blue Star
Accumulate
350
382
3,147
3,624
4,157
5.3
6.0
9.6
14.5
36.3
24.2
6.6
5.7
18.6
25.4
1.0
0.8
Crompton Greaves
Buy
169
204
10,567
13,484
14,687
4.9
6.2
4.5
7.1
37.5
23.8
2.7
2.5
7.2
10.8
0.9
0.8
Inox Wind
Buy
360
505
7,980
4,980
5,943
17.0
17.5
26.6
31.6
13.5
11.4
4.0
3.0
35.0
30.0
1.8
1.4
Stock Watch
November 16, 2015
Company Name
Reco
CMP
Target
Mkt Cap
Sales ( Čcr )
OPM(%)
EPS (Č)
PER(x)
P/BV(x)
RoE(%)
EV/Sales(x)
(Č)
Price ( Č)
( Č cr )
FY16E
FY17E
FY16E
FY17E
FY16E
FY17E
FY16E
FY17E
FY16E
FY17E
FY16E
FY17E
FY16E
FY17E
Capital Goods
KEC International
Neutral
140
-
3,592
8,791
9,716
6.1
6.8
5.4
8.2
25.9
17.0
2.6
2.4
10.0
14.0
0.6
0.6
Thermax
Neutral
839
-
10,000
6,413
7,525
7.4
8.5
30.5
39.3
27.5
21.4
4.2
3.7
15.0
17.0
1.5
1.3
Cement
ACC
Buy
1,328
1,630
24,927
13,151
14,757
16.4
18.3
63.9
83.4
20.8
15.9
2.7
2.5
13.3
16.1
1.7
1.5
Ambuja Cements
Buy
193
233
29,944
11,564
12,556
19.4
20.7
8.9
10.1
21.7
19.1
2.7
2.6
12.8
13.8
2.2
2.0
India Cements
Buy
77
112
2,362
4,216
4,840
18.0
19.5
4.0
9.9
19.2
7.8
0.8
0.7
4.0
9.5
0.9
0.7
JK Cement
Accumulate
650
744
4,545
3,661
4,742
10.1
15.8
18.0
61.0
36.1
10.7
2.6
2.3
7.5
22.9
1.7
1.3
J K Lakshmi Cement
Buy
355
430
4,176
2,947
3,616
16.7
19.9
11.5
27.2
30.9
13.1
2.9
2.5
9.8
20.8
1.8
1.5
Mangalam Cements
Neutral
202
-
538
1,053
1,347
10.5
13.3
8.4
26.0
24.0
7.8
1.0
0.9
4.3
12.5
0.9
0.7
Orient Cement
Accumulate
164
183
3,363
1,854
2,524
21.2
22.2
7.7
11.1
21.3
14.8
3.1
2.6
13.3
15.7
2.6
1.8
Ramco Cements
Neutral
380
-
9,046
4,036
4,545
20.8
21.3
15.1
18.8
25.2
20.2
3.1
2.7
12.9
14.3
2.8
2.4
Shree Cement^
Neutral
11,305
-
39,382
7,150
8,742
26.7
28.6
228.0
345.5
49.6
32.7
7.3
6.1
15.7
20.3
5.3
4.2
UltraTech Cement
Buy
2,681
3,282
73,565
25,021
30,023
19.1
21.6
89.0
132.0
30.1
20.3
3.5
3.0
12.2
15.9
3.0
2.5
Construction
ITNL
Neutral
89
-
2,941
7,360
8,825
34.0
35.9
1.0
5.0
89.4
17.9
0.4
0.4
0.3
1.4
3.8
3.7
KNR Constructions
Buy
580
673
1,630
937
1,470
14.3
14.0
33.5
38.6
17.3
15.0
2.6
2.3
15.4
15.4
1.8
1.2
Larsen & Toubro
Buy
1,332
1,646
123,960
64,148
73,241
11.5
11.7
62.0
66.0
21.5
20.2
2.2
2.0
13.4
14.0
2.1
1.9
Gujarat Pipavav Port
Neutral
161
-
7,764
629
684
51.0
52.2
6.4
5.9
25.1
27.2
3.3
3.0
15.9
12.7
12.0
10.8
MBL Infrastructures
Buy
210
285
871
2,313
2,797
12.2
14.6
19.0
20.0
11.1
10.5
1.2
1.1
11.3
10.6
1.1
1.0
Nagarjuna Const.
Neutral
79
-
4,375
7,892
8,842
8.3
9.1
2.4
5.3
32.8
14.9
1.3
1.2
4.2
8.6
0.8
0.7
PNC Infratech
Neutral
525
-
2,694
1,798
2,132
13.2
13.5
22.0
30.0
23.9
17.5
2.1
1.9
11.5
11.4
1.6
1.4
Simplex Infra
Neutral
318
-
1,574
6,241
7,008
10.4
10.7
20.0
36.0
15.9
8.8
1.3
1.2
6.8
11.1
0.8
0.6
Financials
Allahabad Bank
Neutral
75
-
4,513
8,332
9,259
2.8
2.8
21.0
25.6
3.6
2.9
0.4
0.3
9.8
10.9
-
-
Axis Bank
Buy
484
630
115,100
26,473
31,527
3.5
3.6
35.7
43.5
13.5
11.1
2.6
2.3
17.9
18.9
-
-
Bank of Baroda
Neutral
174
-
40,023
19,105
21,474
2.0
2.0
19.1
24.8
9.1
7.0
0.9
0.8
10.2
12.1
-
-
Bank of India
Neutral
130
-
10,315
15,972
17,271
1.9
2.0
15.3
33.4
8.5
3.9
0.4
0.3
3.6
7.6
-
-
Canara Bank
Neutral
276
-
15,008
15,251
16,725
2.0
2.0
59.3
68.6
4.7
4.0
0.5
0.4
10.1
10.7
-
-
Dena Bank
Neutral
41
-
2,326
3,440
3,840
2.1
2.3
7.3
10.0
5.7
4.1
0.4
0.4
6.1
7.9
-
-
Federal Bank
Neutral
54
-
9,209
3,477
3,999
3.0
3.0
5.0
6.2
10.7
8.6
1.1
1.0
10.6
11.9
-
-
HDFC
Neutral
1,179
-
185,929
10,358
11,852
3.3
3.3
41.1
47.0
28.7
25.1
5.5
5.0
24.7
24.9
-
-
HDFC Bank
Buy
1,051
1,262
264,687
38,309
47,302
4.3
4.3
49.3
61.1
21.3
17.2
3.7
3.2
18.5
19.7
-
-
Stock Watch
November 16, 2015
Company Name
Reco
CMP
Target
Mkt Cap
Sales ( Čcr )
OPM(%)
EPS (Č)
PER(x)
P/BV(x)
RoE(%)
EV/Sales(x)
(Č)
Price ( Č)
( Č cr )
FY16E
FY17E
FY16E
FY17E
FY16E
FY17E
FY16E
FY17E
FY16E
FY17E
FY16E
FY17E
FY16E
FY17E
Financials
ICICI Bank
Buy
262
348
151,987
35,168
40,517
3.4
3.4
21.4
25.2
12.2
10.4
2.1
1.8
14.7
15.2
-
-
IDBI Bank
Neutral
86
-
13,786
9,625
10,455
1.8
1.8
8.5
14.2
10.1
6.1
0.6
0.6
5.9
9.3
-
-
Indian Bank
Neutral
126
-
6,035
6,160
6,858
2.5
2.5
24.5
29.8
5.1
4.2
0.4
0.4
7.7
8.6
-
-
LIC Housing Finance
Buy
466
571
23,510
3,101
3,745
2.5
2.5
33.0
40.2
14.1
11.6
2.6
2.2
19.7
20.5
-
-
Oriental Bank
Neutral
148
-
4,432
7,643
8,373
2.4
2.4
37.2
45.4
4.0
3.3
0.4
0.3
8.2
9.4
-
-
Punjab Natl.Bank
Neutral
137
-
26,872
23,638
26,557
2.8
2.8
17.9
27.2
7.7
5.0
0.8
0.6
8.5
12.0
-
-
South Ind.Bank
Neutral
20
-
2,754
1,965
2,185
2.5
2.5
2.5
3.3
8.2
6.2
0.8
0.7
9.5
11.7
-
-
St Bk of India
Buy
240
283
186,462
82,520
93,299
2.7
2.8
20.0
24.5
12.0
9.8
1.3
1.2
11.5
12.8
-
-
Union Bank
Neutral
161
-
11,037
12,646
14,129
2.3
2.4
31.0
39.1
5.2
4.1
0.6
0.5
9.8
11.4
-
-
Vijaya Bank
Neutral
34
-
2,908
3,536
3,827
1.9
1.9
5.5
6.7
6.1
5.1
0.5
0.5
7.8
8.8
-
-
Yes Bank
Buy
737
914
30,882
7,228
9,043
3.2
3.3
57.7
69.4
12.8
10.6
2.3
1.9
19.1
19.6
-
-
FMCG
Asian Paints
Neutral
800
-
76,750
16,553
19,160
16.0
16.2
17.7
21.5
45.3
37.2
12.0
10.8
29.4
31.2
4.5
3.9
Britannia
Neutral
2,914
-
34,956
8,065
9,395
9.6
10.2
47.2
65.5
61.7
44.5
20.5
19.4
38.3
41.2
4.2
3.6
Colgate
Neutral
948
-
25,795
4,836
5,490
19.5
19.7
48.5
53.2
19.6
17.8
14.3
12.5
99.8
97.5
5.2
4.6
Dabur India
Neutral
268
-
47,083
9,370
10,265
17.1
17.2
7.3
8.1
36.5
33.1
11.0
9.0
33.7
30.6
4.9
4.5
GlaxoSmith Con*
Neutral
5,981
-
25,151
4,919
5,742
17.2
17.4
168.3
191.2
35.5
31.3
10.1
8.6
28.8
28.9
4.7
4.0
Godrej Consumer
Neutral
1,258
-
42,837
10,168
12,886
16.1
16.1
32.1
38.4
39.2
32.8
8.0
7.4
19.7
21.0
4.3
3.4
HUL
Neutral
797
-
172,471
34,940
38,957
17.5
17.7
20.8
24.7
38.3
32.3
42.6
34.1
110.5
114.2
4.7
4.2
ITC
Buy
329
409
264,433
41,068
45,068
37.8
37.4
13.9
15.9
23.7
20.7
7.9
7.0
34.1
33.8
6.1
5.5
Marico
Neutral
399
-
25,707
6,551
7,766
15.7
16.0
10.4
12.5
38.4
31.9
11.1
9.3
33.2
32.4
3.9
3.3
Nestle*
Accumulate
6,037
6,646
58,207
11,291
12,847
22.2
22.3
158.9
184.6
38.0
32.7
19.9
17.9
55.0
57.3
5.0
4.4
Tata Global
Accumulate
128
144
8,059
8,635
9,072
9.8
9.9
6.5
7.6
19.7
16.8
2.0
1.9
6.8
7.4
0.9
0.8
IT
HCL Tech^
Buy
843
1,132
118,487
42,038
47,503
23.2
23.5
55.8
62.9
15.1
13.4
3.5
2.7
23.0
19.8
2.4
1.9
Infosys
Buy
1,100
1,306
252,767
60,250
66,999
28.0
28.0
58.3
63.7
18.9
17.3
4.0
3.4
20.9
19.7
3.5
3.0
TCS
Buy
2,397
3,165
472,371
111,274
126,852
28.4
28.7
125.4
143.9
19.1
16.7
7.6
7.0
39.9
42.2
3.9
3.3
Tech Mahindra
Buy
519
646
49,977
25,566
28,890
16.0
17.0
26.3
31.9
19.8
16.3
3.6
3.0
17.9
18.6
1.7
1.5
Wipro
Buy
552
719
136,215
52,414
58,704
23.7
23.8
38.4
42.3
14.4
13.0
2.8
2.5
19.5
18.0
2.2
1.8
Media
D B Corp
Accumulate
327
356
6,000
2,241
2,495
27.8
27.9
21.8
25.6
15.0
12.8
3.9
3.5
26.7
28.5
2.6
2.3
HT Media
Neutral
75
-
1,743
2,495
2,603
11.2
11.2
7.3
8.6
10.3
8.7
0.8
0.7
7.4
8.1
0.2
0.2
Stock Watch
November 16, 2015
Company Name
Reco
CMP
Target
Mkt Cap
Sales ( Čcr )
OPM(%)
EPS (Č)
PER(x)
P/BV(x)
RoE(%)
EV/Sales(x)
(Č)
Price ( Č)
( Č cr )
FY16E FY17E
FY16E
FY17E
FY16E
FY17E
FY16E
FY17E
FY16E
FY17E
FY16E
FY17E
FY16E
FY17E
Media
Jagran Prakashan
Accumulate
150
169
4,896
2,170
2,355
27.0
27.6
12.8
10.3
11.7
14.6
3.2
3.1
21.8
19.4
2.0
1.7
Sun TV Network
Neutral
376
-
14,823
2,779
3,196
70.2
70.5
22.8
27.3
16.5
13.8
4.1
3.7
26.7
28.3
5.1
4.4
Hindustan Media
Neutral
272
-
1,996
920
1,031
20.0
20.0
19.2
20.9
14.2
13.0
2.3
2.0
16.4
15.3
1.7
1.5
Ventures
Metals & Mining
Coal India
Buy
338
400
213,272
77,508
85,330
21.4
23.7
24.8
27.6
13.6
12.2
5.2
5.0
38.6
41.6
2.1
1.8
Hind. Zinc
Buy
145
175
61,415
14,641
14,026
50.4
50.4
17.7
16.0
8.2
9.1
1.3
1.2
16.2
13.2
1.8
1.6
Hindalco
Neutral
78
-
16,024
104,356
111,186
8.7
9.5
6.7
11.1
11.6
7.0
0.4
0.4
3.5
5.9
0.7
0.6
JSW Steel
Neutral
912
-
22,043
42,308
45,147
16.4
20.7
(10.3)
49.5
18.4
1.0
1.0
(1.0)
5.6
1.6
1.5
NMDC
Neutral
91
-
36,059
8,237
10,893
46.6
44.5
10.0
11.7
9.1
7.8
1.0
0.9
12.5
13.0
4.2
3.2
SAIL
Neutral
45
-
18,482
45,915
53,954
7.2
10.5
1.5
4.4
29.7
10.2
0.4
0.4
2.3
4.1
1.0
0.9
Vedanta
Neutral
87
-
25,867
71,445
81,910
26.2
26.3
12.9
19.2
6.8
4.6
0.5
0.4
7.2
8.9
0.8
0.6
Tata Steel
Neutral
222
-
21,576
126,760
137,307
8.9
11.3
6.4
23.1
34.9
9.6
0.7
0.7
2.0
7.1
0.7
0.7
Oil & Gas
Cairn India
Neutral
131
-
24,579
11,323
12,490
49.4
51.0
20.7
20.7
6.3
6.4
0.4
0.4
6.4
6.1
1.2
0.6
GAIL
Neutral
282
-
35,727
64,856
70,933
9.1
9.6
24.0
28.9
11.8
9.8
1.0
0.9
8.8
9.6
0.7
0.7
ONGC
Neutral
229
-
195,750
154,564
167,321
36.8
37.4
28.6
32.5
8.0
7.0
1.0
0.9
12.7
13.5
1.5
1.4
Petronet LNG
Neutral
204
-
15,285
29,691
31,188
5.8
6.2
12.8
13.4
15.9
15.2
2.4
2.1
15.8
14.8
0.6
0.6
Indian Oil Corp
Accumulate
408
455
98,939
359,607
402,760
5.9
6.1
42.5
48.7
9.6
8.4
1.3
1.1
14.1
14.4
0.4
0.3
Reliance Industries
Accumulate
930
1,050
301,239
304,775
344,392
12.6
13.4
91.3
102.6
10.2
9.1
1.1
1.0
11.8
12.0
0.9
0.8
Pharmaceuticals
Alembic Pharma
Neutral
662
-
12,486
2,658
3,112
24.1
20.2
24.6
23.9
26.9
27.7
9.7
7.4
42.5
30.2
4.7
3.9
Aurobindo Pharma
Accumulate
830
872
48,457
14,923
17,162
23.0
23.0
38.2
43.6
21.7
19.0
6.7
5.0
36.0
30.2
3.6
3.1
Aventis*
Neutral
4,586
-
10,562
2,082
2,371
17.4
20.8
118.2
151.5
38.8
30.3
5.7
4.6
19.9
25.5
4.7
4.0
Cadila Healthcare
Neutral
413
-
42,255
10,224
11,840
21.0
22.0
14.6
17.6
28.3
23.5
7.7
6.1
30.8
29.0
4.2
3.5
Cipla
Neutral
619
-
49,680
14,211
16,611
20.6
19.0
27.0
28.9
22.9
21.4
3.9
3.3
18.4
16.8
3.5
2.9
Dr Reddy's
Buy
3,384
4,238
57,710
18,213
21,214
22.6
22.7
163.0
192.5
20.8
17.6
4.3
3.5
22.5
20.0
3.1
2.6
Dishman Pharma
Neutral
381
-
3,073
1,716
1,888
20.2
20.2
16.3
21.6
23.4
17.6
2.2
2.0
9.7
11.7
2.0
1.7
GSK Pharma*
Neutral
3,152
-
26,702
2,870
3,158
20.0
22.1
59.5
68.3
53.0
46.2
15.6
16.1
28.5
34.3
8.8
8.1
Indoco Remedies
Neutral
300
-
2,764
1,033
1,199
15.9
18.2
9.4
13.6
31.9
22.1
4.7
4.0
15.7
19.7
2.8
2.4
Ipca labs
Buy
719
900
9,074
3,363
3,909
12.9
18.6
13.4
28.0
53.7
25.7
7.0
5.6
7.4
14.0
3.0
2.6
Lupin
Neutral
1,777
-
79,995
13,092
16,561
25.0
27.0
50.4
68.3
35.3
26.0
7.3
5.8
22.8
24.7
5.8
4.5
Sun Pharma
Buy
742
950
178,497
28,163
32,610
25.8
30.7
17.4
26.9
42.6
27.6
4.0
3.5
13.0
16.6
5.8
4.8
Stock Watch
November 16, 2015
Company Name
Reco
CMP
Target
Mkt Cap
Sales ( Čcr )
OPM(%)
EPS (Č)
PER(x)
P/BV(x)
RoE(%)
EV/Sales(x)
(Č)
Price ( Č)
( Č cr )
FY16E FY17E
FY16E
FY17E
FY16E
FY17E
FY16E
FY17E
FY16E
FY17E
FY16E
FY17E
FY16E
FY17E
Power
Tata Power
Neutral
68
-
18,473
35,923
37,402
22.6
22.8
4.1
5.2
16.9
13.3
1.3
1.2
7.5
9.3
1.5
1.3
NTPC
Buy
131
157
107,727
87,064
98,846
23.5
23.5
11.7
13.2
11.2
9.9
1.2
1.2
11.4
12.1
2.3
2.0
Power Grid
Buy
130
170
68,011
20,702
23,361
86.7
86.4
12.1
13.2
10.8
9.8
1.6
1.4
15.6
15.1
8.2
7.6
Telecom
Bharti Airtel
Neutral
334
-
133,533
101,748
109,191
32.1
31.7
12.0
12.5
27.8
26.7
1.9
1.8
6.9
6.7
1.9
1.8
Idea Cellular
Neutral
130
-
46,633
34,282
36,941
32.0
31.5
5.9
6.2
22.0
20.9
2.0
1.8
9.9
9.3
1.9
1.8
zOthers
Abbott India
Neutral
5,002
-
10,629
2,715
3,153
14.5
14.1
134.3
152.2
37.3
32.9
9.3
7.7
27.4
25.6
3.6
3.1
Bajaj Electricals
Buy
229
341
2,312
4,719
5,287
5.2
5.8
8.6
12.7
26.8
18.1
3.1
2.7
11.4
14.8
0.5
0.4
Finolex Cables
Neutral
253
-
3,875
2,728
3,036
10.8
11.0
14.4
16.8
17.6
15.1
2.7
2.3
15.2
15.3
1.2
1.0
Goodyear India*
Accumulate
568
622
1,309
1,888
1,680
12.1
11.9
62.2
56.6
9.1
10.0
2.1
1.8
25.9
19.7
0.5
0.5
Hitachi
Neutral
1,364
-
3,708
1,779
2,081
7.8
8.8
21.8
33.4
62.6
40.8
10.1
8.2
17.4
22.1
2.2
1.8
Jyothy Laboratories
Neutral
301
-
5,455
1,620
1,847
11.5
11.5
7.3
8.5
41.3
35.6
5.3
5.0
13.3
14.4
3.2
2.8
MRF
Buy
38,486
45,575
16,322
20,316
14,488
21.4
21.1
5,488.0
3,798.0
7.0
10.1
2.4
1.9
41.1
21.2
0.8
1.0
Page Industries
Neutral
12,156
-
13,559
1,929
2,450
19.8
20.1
229.9
299.0
52.9
40.7
23.3
16.2
52.1
47.1
7.1
5.5
Relaxo Footwears
Neutral
489
-
5,871
1,767
2,152
12.3
12.5
19.3
25.1
25.4
19.5
6.2
4.8
27.7
27.8
3.4
2.7
Siyaram Silk Mills
Buy
938
1,145
879
1,636
1,815
11.5
11.5
89.9
104.1
10.4
9.0
1.7
1.5
17.9
17.8
0.7
0.6
Styrolution ABS India*
Neutral
719
-
1,264
1,271
1,440
8.6
9.2
32.0
41.1
22.4
17.5
2.3
2.1
10.7
12.4
1.0
0.8
Tree House
Buy
240
314
1,014
256
315
57.2
57.5
16.5
21.0
14.5
11.4
1.4
1.3
9.6
10.9
4.1
3.5
TVS Srichakra
Buy
2,740
3,210
2,098
2,127
2,388
15.2
14.9
237.7
267.5
11.5
10.2
4.9
3.5
51.7
39.8
1.0
0.9
HSIL
Accumulate
288
302
2,079
2,123
2,384
16.1
16.5
15.0
18.9
19.1
15.2
1.5
1.4
8.0
9.4
1.3
1.2
Kirloskar Engines India
Neutral
263
-
3,801
2,634
3,252
10.1
12.0
10.9
17.4
24.1
15.1
2.7
2.4
11.4
16.8
1.1
0.8
Ltd
M M Forgings
Buy
515
670
622
541
634
21.7
21.4
47.8
55.9
10.8
9.2
2.1
1.8
21.8
20.9
1.3
1.1
Banco Products (India)
Neutral
129
-
923
1,208
1,353
11.0
12.3
10.8
14.5
12.0
8.9
1.4
1.2
11.9
14.5
0.7
0.6
Competent Automobiles Neutral
140
-
86
1,007
1,114
3.1
3.1
23.7
28.2
5.9
5.0
0.8
0.7
13.9
14.6
0.1
0.1
Nilkamal
Neutral
1,003
-
1,497
1,910
2,083
10.5
10.3
63.3
69.2
15.9
14.5
2.6
2.2
17.6
16.5
0.8
0.7
Visaka Industries
Buy
130
166
206
1,158
1,272
8.6
9.5
23.7
32.7
5.5
4.0
0.6
0.5
10.1
12.5
0.3
0.3
Transport Corporation of
Neutral
282
-
2,148
2,830
3,350
8.8
9.0
14.4
18.3
19.7
15.4
3.0
2.6
15.4
17.1
0.9
0.8
India
Elecon Engineering
Accumulate
76
85
823
1,369
1,533
13.7
14.9
3.3
6.1
22.8
12.5
1.5
1.4
6.6
11.4
0.9
0.8
Surya Roshni
Buy
130
183
569
2,992
3,223
8.1
8.4
14.7
18.3
8.8
7.1
0.8
0.7
9.7
11.0
0.5
0.4
MT Educare
Buy
133
169
530
286
366
18.3
17.7
7.7
9.4
17.2
14.2
3.6
3.2
20.2
21.1
1.8
1.3
Stock Watch
November 16, 2015
Company Name
Reco
CMP
Target Mkt Cap
Sales ( Čcr )
OPM(%)
EPS (Č)
PER(x)
P/BV(x)
RoE(%)
EV/Sales(x)
(Č)
Price ( Č)
( Č cr )
FY16E FY17E FY16E FY17E FY16E FY17E FY16E FY17E FY16E FY17E FY16E FY17E FY16E FY17E
zOthers
Radico Khaitan
Accumulate
121
128
1,610
1,565
1,687
12.2
13.0
5.7
7.1
21.2
17.1
1.8
1.6
8.3
9.6
1.5
1.4
Garware Wall Ropes
Buy
354
423
775
861
967
10.9
10.9
24.0
28.2
14.8
12.6
2.2
1.9
14.6
14.9
0.9
0.8
Wonderla Holidays
Neutral
358
-
2,022
206
308
44.0
43.6
9.0
12.9
39.8
27.7
5.4
4.9
13.7
17.8
9.7
6.5
Linc Pen & Plastics
Accumulate
161
185
239
340
371
8.3
8.9
10.8
13.2
14.9
12.2
2.4
2.1
16.0
17.1
0.7
0.7
The Byke Hospitality
Accumulate
162
181
650
222
287
20.5
20.5
5.6
7.6
28.8
21.5
5.4
4.5
18.9
20.8
3.0
2.3
Source: Company, Angel Research; Note: *December year end; #September year end; &October year end; Price as on November 13, 2015
Market Outlook
November 16, 2015
Research Team Tel: 022 - 39357800
DISCLAIMER
Angel Broking Private Limited (hereinafter referred to as “Angel”) is a registered Member of National Stock Exchange of India Limited,
Bombay Stock Exchange Limited and Metropolitian Stock Exchange of India Limited. It is also registered as a Depository Participant with
CDSL and Portfolio Manager with SEBI. It also has registration with AMFI as a Mutual Fund Distributor. Angel Broking Private Limited is a
registered entity with SEBI for Research Analyst in terms of SEBI (Research Analyst) Regulations, 2014 vide registration number
INH000000164. Angel or its associates has not been debarred/ suspended by SEBI or any other regulatory authority for accessing
/dealing in securities Market. Angel or its associates including its relatives/analyst do not hold any financial interest/beneficial ownership
of more than 1% in the company covered by Analyst. Angel or its associates/analyst has not received any compensation / managed or co
-managed public offering of securities of the company covered by Analyst during the past twelve months. Angel/analyst has not served as
an officer, director or employee of company covered by Analyst and has not been engaged in market making activity of the company
covered by Analyst.
This document is solely for the personal information of the recipient, and must not be singularly used as the basis of any investment
decision. Nothing in this document should be construed as investment or financial advice. Each recipient of this document should make
such investigations as they deem necessary to arrive at an independent evaluation of an investment in the securities of the companies
referred to in this document (including the merits and risks involved), and should consult their own advisors to determine the merits and
risks of such an investment.
Reports based on technical and derivative analysis center on studying charts of a stock's price movement, outstanding positions and
trading volume, as opposed to focusing on a company's fundamentals and, as such, may not match with a report on a company's
fundamentals.
The information in this document has been printed on the basis of publicly available information, internal data and other reliable sources
believed to be true, but we do not represent that it is accurate or complete and it should not be relied on as such, as this document is for
general guidance only. Angel Broking Pvt. Limited or any of its affiliates/ group companies shall not be in any way responsible for any
loss or damage that may arise to any person from any inadvertent error in the information contained in this report. Angel Broking Pvt.
Limited has not independently verified all the information contained within this document. Accordingly, we cannot testify, nor make any
representation or warranty, express or implied, to the accuracy, contents or data contained within this document. While Angel Broking
Pvt. Limited endeavors to update on a reasonable basis the information discussed in this material, there may be regulatory, compliance,
or other reasons that prevent us from doing so.
This document is being supplied to you solely for your information, and its contents, information or data may not be reproduced,
redistributed or passed on, directly or indirectly.
Neither Angel Broking Pvt. Limited, nor its directors, employees or affiliates shall be liable for any loss or damage that may arise from or
in connection with the use of this information.
Note: Please refer to the important ‘Stock Holding Disclosure' report on the Angel website (Research Section). Also, please refer to the
latest update on respective stocks for the disclosure status in respect of those stocks. Angel Broking Pvt. Limited and its affiliates may have
investment positions in the stocks recommended in this report.