Market Outlook
October 16, 2015
Market Cues
Domestic Indices
Chg (%)
(Pts)
(Close)
Indian markets are expected to open positively tracking the SGX Nifty and most its
BSE Sensex
0.9
230
27,010
Asian peers.
Nifty
0.9
72
8,180
US stock markets posted its biggest gain in almost two weeks. The markets closed
Mid Cap
0.8
87
11,007
higher led by shares of financial companies after Citigroup posted strong earnings
Small Cap
0.5
55
11,490
growth in its third quarterly results.
Bankex
0.9
178
20,198
European indices rallied after European Central Bank said inflation was missing its
target, thus raising speculation that the central bank may increase stimulus
measures in the Eurozone.
Global Indices
Chg (%)
(Pts)
(Close)
Dow Jones
1.3
217
17,142
Indian markets edged higher, snapping three day losing streak. Markets were in the
green led by positive cues from the global markets (Asian and European indices
Nasdaq
1.8
87
4,870
were up). Public sector companies, auto stocks and index heavyweights ITC and L&T
FTSE
1.1
69
6,339
led the gains for the market.
Nikkei
1.2
206
18,097
Hang Seng
2.0
448
22,888
News & Result Analysis
Shanghai Com
2.3
76
3,338
Tata Motors looks to regain entire market share in domestic passenger vehicles
segment by 2020 on new launches
Result Review: LIC Housing Finance
Advances / Declines
Bse
Nse
Detailed analysis on Pg2
Advances
1,519
1,019
Declines
1,214
482
Investor’s Ready Reckoner
Unchanged
152
68
Key Domestic & Global Indicators
Stock Watch: Latest investment recommendations on 150+ stocks
Volumes (` Cr)
Refer Pg4 onwards
BSE
2,852
Top Picks
NSE
15,893
CMP
Target
Upside
Company
Sector
Rating
(`)
(`)
(%)
Axis Bank
Financials
Buy
499
701
40.5
Net Inflows (` Cr)
Net
Mtd
Ytd
ICICI Bank
Financials
Buy
286
370
29.4
FII
155
2,670
120,735
Power Grid
Power
Buy
135
170
25.9
MFs
167
808
79,813
TCS
IT
Buy
2,469
3,168
28.3
Aurobindo Pharma Pharmaceuticals Accumulate
792
872
10.1
Top Gainers
Price (`)
Chg (%)
More Top Picks on Pg3
Ttkprestig
4,280
12.0
Key Upcoming Events
Syndibank
124
7.2
Previous
Consensus
Date
Region
Event Description
Aloktext
7
7.1
Reading
Expectations
Oct 16
US
Industrial production
(0.38)
(0.2)
Deltacorp
86
5.1
Oct 16
Euro
CPI
(0.1)
(0.1)
Pmcfin
1
5.0
Oct 19
China
Industrial production
6.1
6.0
Oct 19
China
Real GDP
7.0
6.8
Top Losers
Price (`)
Chg (%)
Dcbbank
107
(20.0)
Bharatforg
890
(4.6)
Tcs
2,483
(4.4)
Zeel
386
(3.9)
Balramchin
62
(3.7)
As on October 14, 2015
Market Outlook
October 16, 2015
Tata Motors looks to regain entire market share in domestic
passenger vehicles segment by 2020 on new launches
Tata Motors aims to regain the market share it lost in passenger vehicle industry,
as it set a target to double segment sales to more than 4 lakh units a year by the
end of the decade. The company had a 10% market share more than a decade
ago, when its Indica hatchback was a favourite for personal use and as a taxi. The
market share has now fallen to 5.7%. If it manages to achieve the target, it will
return to about 10% of the estimated market in 2020.
Tata Motors unveiled the target before its vendors last week. Chairman Cyrus
Mistry urged suppliers to improve their quality and scale to global levels so that the
company can compete more aggressively with multinational auto makers. Its
projection is based on the new vehicles in its pipeline and an expected pick-up in a
market that has been sluggish for most part of the past three years, but is now
showing signs of improvement. It has lined up at least four passenger vehicles for
launch in the coming 18 months. These are the Kite-4 hatchback, Kite-5 sedan,
Eagle Crossover or Hexa, and a sub-4 meter compact SUV — Nexon or Osprey as
it is internally called. The company has already got board approval to invest in the
future modular platform. In the first half of fiscal 2016, Tata Motors passenger car
sales grew 27% to about 55,000 units, even as the utility vehicle segment posted a
similar level of decline. Sales of passenger vehicles, including vans, totalled more
than 76,000 in the first half and the company is expecting this to reach two lakh
for the year. We currently have Accumulate rating on the stock.
Result Review
LIC HOUSING FINANCE (CMP: `490 / TP: `570 /Upside: 16.3%)
LIC Housing Finance reported 2Q FY2016 results, which were above consensus
estimates, with PAT at INR 411.7 cr reflecting a growth of 21% yoy. NII grew
substantially at 34% yoy, aided by healthy loan book growth of 17% yoy and
higher margins, leading to 31% yoy growth in operating income at INR 780.3 cr.
Provisioning expenses for the quarter came in at INR 30.1cr as compared to INR
44.3cr in 1QFY2016 and a writeback of INR 19.03 cr in 2QFY2015. We await
clarity from the management regarding the asset quality performance during the
quarter. The stock currently trades at 2.4x FY2017E ABV. We recommend BUY
rating on the stock.
Y/E
Op. Inc
NIM
PAT
EPS ABV ROA ROE
P/E P/ABV
March
(` cr)
(%)
(` cr)
(`)
(`)
(%)
(%)
(x)
(x)
FY2016E
3,080
2.4
1,651
32.7
176.5
1.4
19.5
14.7
2.8
FY2017E
3,720
2.4
2,012
39.8
207.1
1.4
20.3
12.1
2.4
Market Outlook
October 16, 2015
Economic and Political News
Adani to supply 50 MW to Railways at `3.69 per unit
Delhi-Jaipur highway to be completed by December: Gadkari
RBI expected to cut rates just once in next 18 months: poll
Corporate News
Additional spectrum case: Court discharges Bharti, Vodafone, ex-telecom secy
Finance Ministry wants CBI to fast-track Bank of Baroda fraud case
Aurobindo Pharma gets USFDA nod for Alzheimer's treatment drug
Market Outlook
October 16, 2015
Top Picks ★★★★★
Large Cap
Market Cap
CMP
Target
Upside
Company
Rationale
(` Cr)
(`)
(`)
(%)
Robust US sales along with the acquisations, will aid the growth
Aurobindo
46,250
792
872
10.1
and stable margins.
Healthy pace of branch expansion, backed by distribution
Axis Bank
118,572
499
701
40.5
network.
Robust franchise and capital adequacy position will help the
ICICI Bank
166,187
286
370
29.4
bank to outperform the industry average.
Back on the growth trend; expect a long term growth of 14% to
Infosys
251,975
1,097
1,306
19.1
be a US$20bn in FY2020.
Government thrust on Renewable sector and strong order book
Inox Wind
8,597
387
505
30.5
would drive future growth.
LICHF continues to grow its retail loan book at a healthy pace
LIC HFL
24,804
492
570
15.9
with improvement in asset quality.
Direct beneficiary of the huge investments lined up in the power
Power Grid
70,600
135
170
25.9
transmission sector.
Growth to pick up from 2HFY2017, attractive given the risk-
TCS
486,430
2,469
3,168
28.3
reward.
Tech Mahindra
52,495
545
646
18.5
Acquisitions, to drive growth, normalised valuations attractive.
An improving liability franchise, capital adequacy well above
Yes Bank
31,785
759
953
25.6
Basel III requirements and lowest NPA ratio in the industry.
Source: Company, Angel Research
Mid Cap
Market Cap
CMP
Target
Upside
Company
Rationale
(` Cr)
(`)
(`)
(%)
Bajaj Electricals
2,552
253
341
34.8
Visible turnaround in E&P business to drive the earnings.
Garware Wall Ropes
833
351
390
11.1
Higher exports & easing material prices to drive profitability.
Comfortable balance sheet to support strong growth; this
MBL Infrastructures
970
234
360
53.8
coupled with attractive valuation to lead to rerating.
New product introductions and increased sourcing by clients to
Minda Industries
818
516
652
26.4
enable outpace industry growth.
Strong brand & quality teaching with innovative technologies &
MT Educare
567
143
169
18.2
higher government educational spending to boost growth.
Earnings boost on back of stable material prices and favorable
Radico Khaitan
1,175
88
112
26.9
pricing environment. Valuation discount to peers provides
additional comfort.
Structural shift in the Lighting industry towards LED lighting will
Surya Roshni
614
140
183
30.7
drive growth.
Tree House
1,304
308
449
45.8
Robust expansion plan for pre-schools to drive growth.
Source: Company, Angel Research
Market Outlook
October 16, 2015
Quarterly Bloomberg Brokers Consensus Estimate
Reliance Industries Ltd - October 16, 2015
Particulars (` cr)
2QFY16E
2QFY15
y-o-y (%)
1QFY16
q-o-q (%)
Net sales
61,486
96,486
(36.3)
65,817
(6.6)
EBITDA
8,580
8,235
4.2
9,307
(7.8)
EBITDA margin (%)
14.0
8.5
14.1
Net profit
5,920
5,742
3.1
6,318
(6.3)
Ultratech Cement Ltd - October 19, 2015
Particulars (` cr)
2QFY16E
2QFY15
y-o-y (%)
1QFY16
q-o-q (%)
Net sales
5,550
5,382
3.1
6,038
(8.1)
EBITDA
949
877
8.2
1,152
(17.6)
EBITDA margin (%)
17.1
16.3
19.1
Net profit
424
410
3.3
591
(28.3)
HCL Technologies Ltd Consol - October 19, 2015
Particulars (` cr)
2QFY16E
2QFY15
y-o-y (%)
1QFY16
q-o-q (%)
Net sales
10,088
8,735
15.5
9,777
3.2
EBITDA
2,110
2,192
(3.7)
2,100
0.5
EBITDA margin (%)
20.9
25.1
21.5
Net profit
1,776
1,873
(5.2)
1,783
(0.4)
Hindustan Zinc Ltd - October 19, 2015
Particulars (` cr)
2QFY16E
2QFY15
y-o-y (%)
1QFY16
q-o-q (%)
Net sales
3,693
3,749
(1.5)
3,596
2.7
EBITDA
1,874
2,000
(6.3)
1,660
12.8
EBITDA margin (%)
50.7
53.3
46.2
Net profit
1,980
2,184
(9.3)
1,921
3.1
Hero MotoCorp Ltd - October 20, 2015
Particulars (` cr)
2QFY16E
2QFY15
y-o-y (%)
1QFY16
q-o-q (%)
Net sales
6,665
6,864
(2.9)
6,856
(2.8)
EBITDA
989
935
5.8
1,048
(5.6)
EBITDA margin (%)
14.8
13.6
15.3
Net profit
716
763
(6.2)
750
(4.5)
ACC Ltd - October 20, 2015
Particulars (` cr)
3QFY16E
3QFY15
y-o-y (%)
2QFY16
q-o-q (%)
Net sales
2,753
2,742
0.4
2,961
(7.0)
EBITDA
266
379
(29.8)
334
(20.3)
EBITDA margin (%)
9.7
13.8
11.3
Net profit
117
205
(42.7)
131
(10.7)
Federal Bank Ltd - October 20, 2015
Particulars (` cr)
2QFY16E
2QFY15
y-o-y (%)
1QFY16
q-o-q (%)
PAT
245
240
2.1
141
73.6
Market Outlook
October 16, 2015
Key Upcoming Events
Result Calendar
Date
Company
Oct 16, 2015
Reliance Industries
Oct 17, 2015
South Ind.Bank
Oct 18, 2015
Oct 19, 2015
UltraTech Cement, HCL Tech, Hind. Zinc, Petronet LNG, Heritage Foods
Oct 20, 2015
Hero Motocorp, ACC, Federal Bank, Mphasis, Jyothy Laboratories, Aventis
Oct 21, 2015
M&M, Bajaj Auto, HDFC Bank, Wipro, KPIT Cummins, NIIT, JSW Steel , Cairn India
Oct 22, 2015
Cadila Healthcare
Oct 23, 2015
Asian Paints
Oct 24, 2015
Godrej Consumer, Persistent
Oct 25, 2015
Oct 26, 2015
Blue Star, HDFC, Hindustan Media Ventures, Hitachi
Oct 27, 2015
TVS Motor, Thermax, Axis Bank, Sesa Goa, Lupin, Alembic Pharma
Oct 28, 2015
Amara Raja Batteries, Ambuja Cements, Dabur India, HT Media, Kirloskar Engines India Ltd, Elecon Engineering
Oct 29, 2015
Bharat Forge, Nestle, Colgate, MRF, L G Balakrishnan & Bros, Dr Reddy's, Dishman Pharma
Oct 30, 2015
Apollo Tyres, Subros, ICICI Bank, Kotak Mah. Bank, Indoco Remedies
Oct 31, 2015
IDFC, GSK Pharma
Source: Bloomberg, Angel Research
Global economic events release calendar
Date
Time
Country
Event Description
Unit
Period
Bloomberg Data
Last Reported Estimated
Oct 16, 2015 6:45PM US
Industrial Production
%
Sep
(0.38)
(0.20)
2:30PM Euro Zone
Euro-Zone CPI (YoY)
%
Sep F
(0.10)
(0.10)
Oct 19, 2015 7:30AM China
Industrial Production (YoY)
% Change
Sep
6.10
6.00
7:30AM China
Real GDP (YoY)
% Change
3Q
7.00
6.80
Oct 20, 2015 6:00PM US
Housing Starts
Thousands
Sep
1,126.00
1,142.00
6:00PM US
Building permits
Thousands
Sep
1,170.00
1,163.00
Oct 22, 2015 7:30PM Euro Zone
Euro-Zone Consumer Confidence
Value
Oct A
(7.10)
(7.50)
7:30PM US
Existing home sales
Million
Sep
5.31
5.36
5:15PM Euro Zone
ECB announces interest rates
%
Oct 22
0.05
0.05
Oct 23, 2015 1:00PM Germany
PMI Services
Value
Oct P
54.10
54.00
1:00PM Germany
PMI Manufacturing
Value
Oct P
52.30
51.90
Oct 26, 2015 7:30PM US
New home sales
Thousands
Sep
552.00
--
Oct 27, 2015 3:00PM UK
GDP (YoY)
% Change
3Q A
2.40
--
7:30PM US
Consumer Confidence
S.A./ 1985=100
Oct
103.04
--
Oct 28, 2015 11:30PM US
FOMC rate decision
%
Oct 28
0.25
0.25
Oct 29, 2015 2:25PM Germany
Unemployment change (000's)
Thousands
Oct
2.00
--
6:00PM US
GDP Qoq (Annualised)
% Change
3Q A
3.90
--
Source: Bloomberg, Angel Research
Market Outlook
October 16, 2015
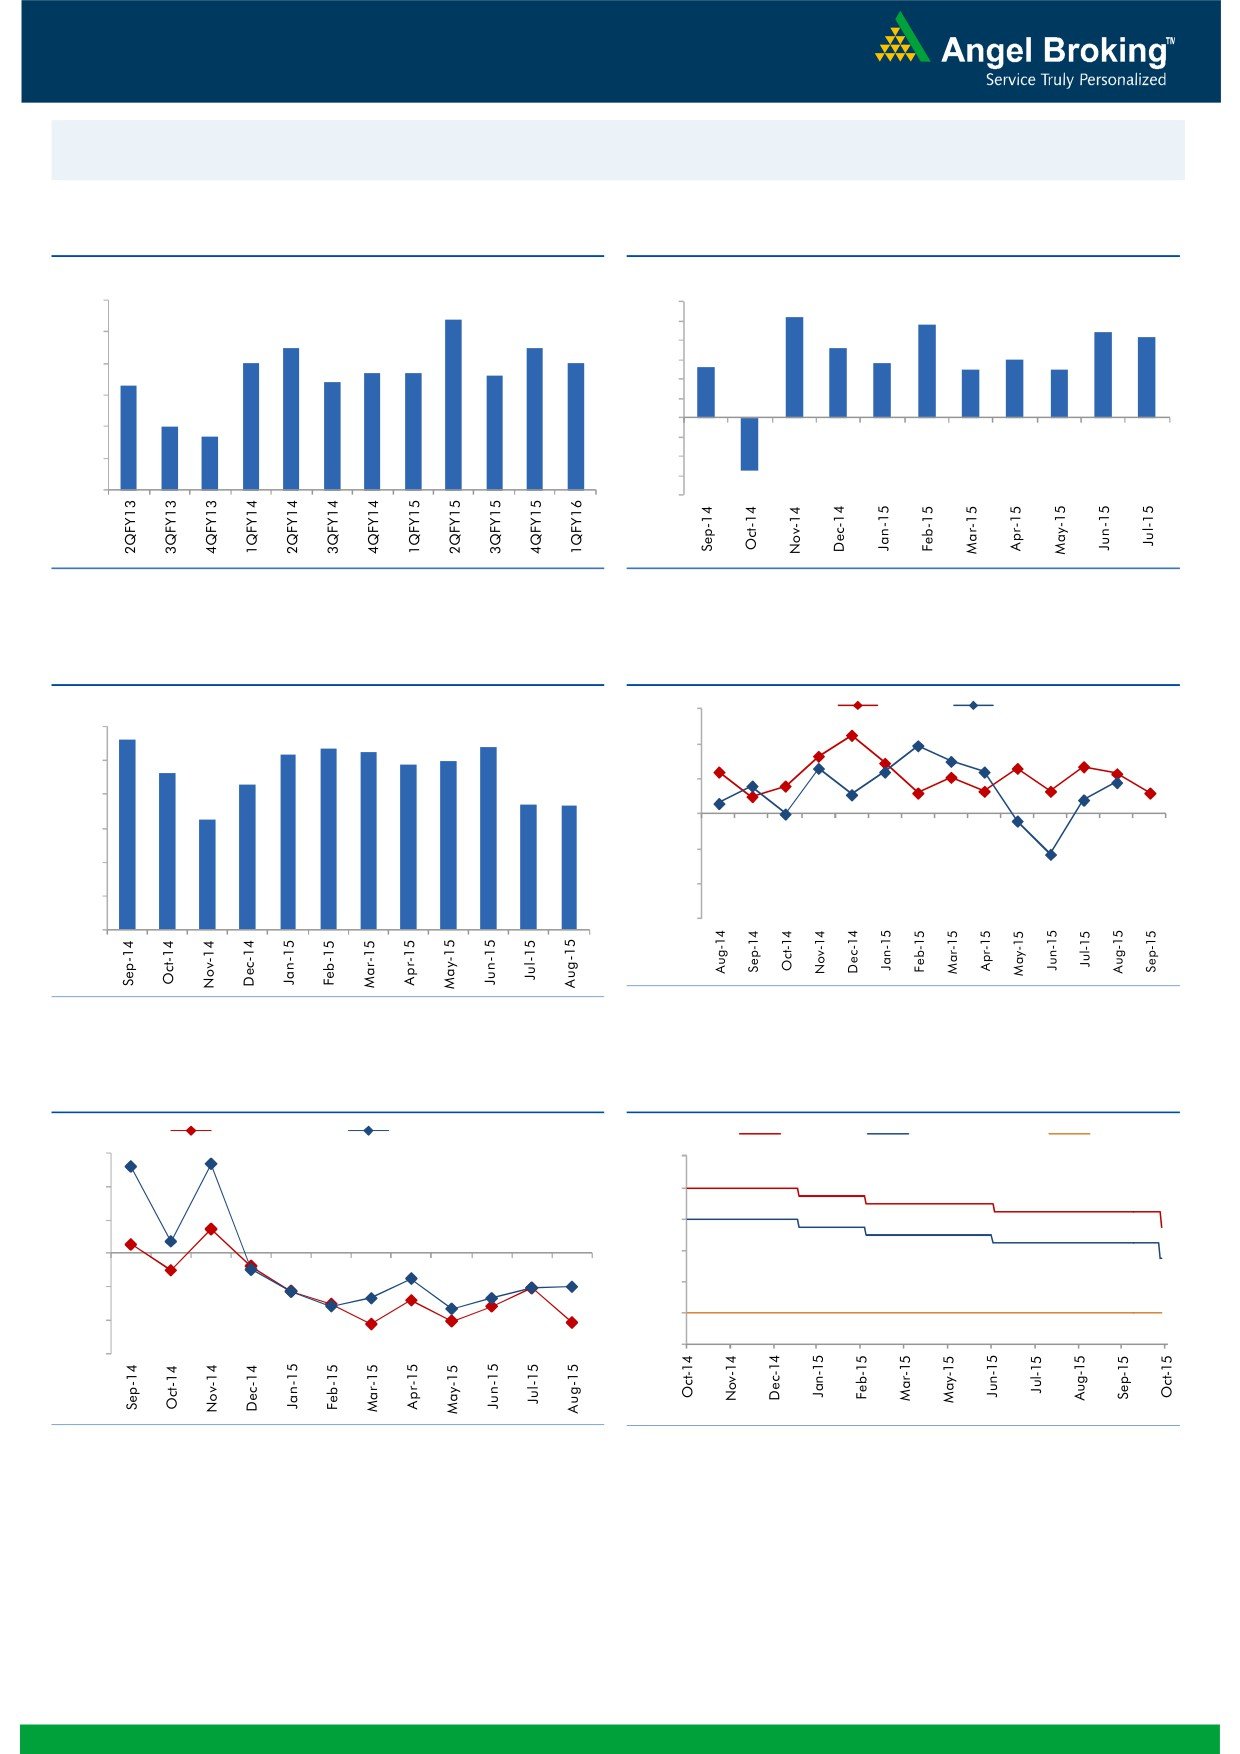
Macro watch
Exhibit 1: Quarterly GDP trends
Exhibit 2: IIP trends
(%)
(%)
9.0
8.4
6.0
5.2
4.8
5.0
4.4
4.2
8.0
7.5
7.5
3.6
4.0
3.0
7.0
7.0
2.6
2.8
6.7
6.7
2.5
2.5
7.0
6.4
6.6
3.0
6.3
2.0
6.0
1.0
5.0
4.7
-
5.0
(1.0)
4.0
(2.0)
(3.0)
3.0
(2.7)
(4.0)
Source: CSO, Angel Research
Source: MOSPI, Angel Research
Exhibit 3: Monthly CPI inflation trends
Exhibit 4: Manufacturing and services PMI
(%)
56.0
Mfg. PMI
Services PMI
6.0
5.6
5.4
5.2
5.4
5.3
4.9
5.0
54.0
5.0
4.6
4.3
52.0
3.7
3.7
4.0
3.3
50.0
3.0
48.0
2.0
46.0
1.0
44.0
-
Source: Market, Angel Research; Note: Level above 50 indicates expansion
Source: MOSPI, Angel Research
Exhibit 5: Exports and imports growth trends
Exhibit 6: Key policy rates
(%)
Exports yoy growth
Imports yoy growth
(%)
Repo rate
Reverse Repo rate
CRR
30.0
9.00
20.0
8.00
10.0
7.00
0.0
6.00
5.00
(10.0)
4.00
(20.0)
3.00
(30.0)
Source: Bloomberg, Angel Research
Source: RBI, Angel Research
Market Outlook
October 16, 2015
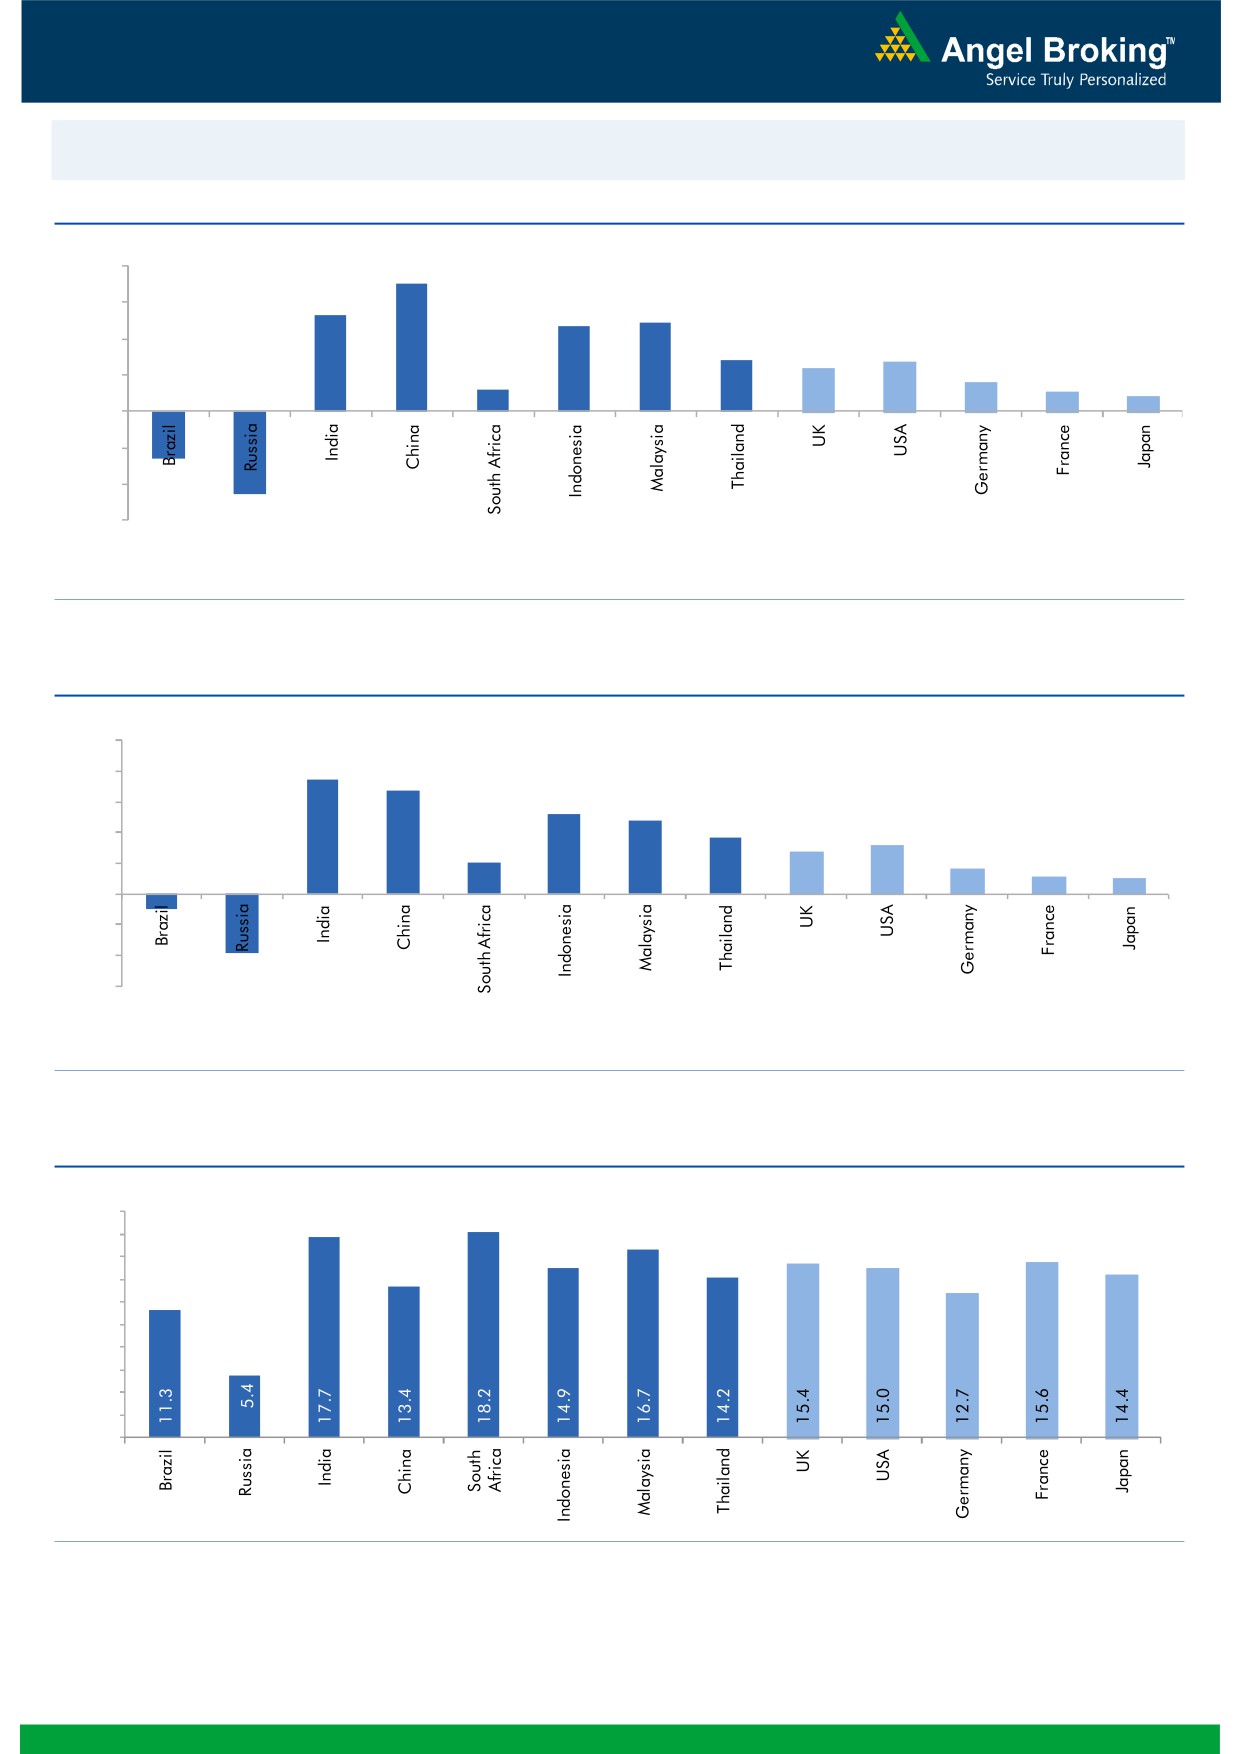
Global watch
Exhibit 1: Latest quarterly GDP Growth (%, yoy) across select developing and developed countries
(%)
8.0
7.0
6.0
5.3
4.9
4.7
4.0
2.8
2.7
2.4
1.6
2.0
1.2
1.1
0.8
-
(2.0)
(2.6)
(4.0)
(4.6)
(6.0)
Source: Bloomberg, Angel Research
Exhibit 2: 2015 GDP Growth projection by IMF (%, yoy) across select developing and developed countries
(%)
10.0
7.5
8.0
6.8
5.2
6.0
4.8
3.7
3.1
4.0
2.7
2.0
1.6
1.2
1.0
2.0
-
(2.0)
(4.0)
(1.0)
(3.8)
(6.0)
Source: IMF, Angel Research
Exhibit 3: One year forward P-E ratio across select developing and developed countries
(x)
20.0
18.0
16.0
14.0
12.0
10.0
8.0
6.0
4.0
2.0
-
Source: IMF, Angel Research
Market Outlook
October 16, 2015
Exhibit 4: Relative performance of indices across globe
Returns (%)
Country
Name of index
Closing price
1M
3M
1YR
Brazil
Bovespa
47,161
(0.3)
(10.9)
(17.6)
Russia
Micex
1,732
0.9
5.0
24.2
India
Nifty
8,180
5.0
(3.2)
2.8
China
Shanghai Composite
3,338
3.6
(9.4)
42.1
South Africa
Top 40
47,463
8.3
1.1
11.7
Mexico
Mexbol
44,088
2.9
(2.8)
2.6
Indonesia
LQ45
770
4.3
(6.0)
(7.4)
Malaysia
KLCI
1,713
6.1
(0.1)
(6.4)
Thailand
SET 50
924
3.8
(5.4)
(11.8)
USA
Dow Jones
17,142
3.3
(5.4)
6.4
UK
FTSE
6,339
3.3
(6.7)
0.4
Japan
Nikkei
18,097
(3.6)
(8.5)
15.2
Germany
DAX
10,065
(1.2)
(13.8)
17.3
France
CAC
4,675
2.3
(8.8)
14.6
Source: Bloomberg, Angel Research
Stock Watch
October 16, 2015
Company Name
Reco
CMP
Target
Mkt Cap
Sales ( Čcr )
OPM(%)
EPS (Č)
PER(x)
P/BV(x)
RoE(%)
EV/Sales(x)
(Č)
Price ( Č)
( Č cr )
FY16E FY17E
FY16E
FY17E
FY16E
FY17E
FY16E
FY17E
FY16E
FY17E
FY16E
FY17E
FY16E
FY17E
Agri / Agri Chemical
Rallis
Neutral
212
-
4,122
2,075
2,394
14.4
14.4
9.5
11.0
22.3
19.3
4.4
3.8
21.1
21.3
2.0
1.7
United Phosphorus
Accumulate
476
510
20,410
13,698
15,752
17.6
17.6
32.1
38.5
14.8
12.4
2.9
2.4
21.4
21.3
1.6
1.3
Auto & Auto Ancillary
Ashok Leyland
Accumulate
95
102
27,036
18,763
22,357
11.1
11.2
3.6
4.8
26.4
19.8
4.9
4.5
18.7
22.6
1.4
1.1
Bajaj Auto
Neutral
2,452
-
70,947
23,544
27,245
19.8
19.8
127.0
143.4
19.3
17.1
5.8
5.0
30.3
29.4
2.6
2.2
Eicher Motors
Buy
18,311
22,859
49,701
11,681
15,550
15.3
16.9
358.5
564.3
51.1
32.5
15.4
11.4
29.8
34.9
4.1
3.1
Hero Motocorp
Neutral
2,567
-
51,269
28,500
32,764
14.1
14.3
146.9
167.0
17.5
15.4
6.6
5.6
37.8
36.5
1.6
1.4
L G Balakrishnan & Bros Neutral
438
-
687
1,254
1,394
11.6
11.8
35.9
41.7
12.2
10.5
1.7
1.5
13.5
13.8
0.7
0.6
Mahindra and Mahindra Accumulate
1,275
1,357
79,186
37,986
42,660
12.8
13.2
51.6
61.9
24.7
20.6
3.6
3.2
14.6
15.6
1.7
1.5
Maruti
Accumulate
4,380
4,960
132,307
58,102
68,587
16.7
16.9
182.0
225.5
24.1
19.4
4.8
4.1
19.9
21.0
2.1
1.7
Minda Industries
Buy
512
652
812
2,567
2,965
7.3
8.0
38.8
54.3
13.2
9.4
1.9
1.6
14.4
16.8
0.4
0.3
Rane Brake Lining
Buy
309
366
245
454
511
11.1
11.4
23.8
28.1
13.0
11.0
1.8
1.7
14.2
15.3
0.7
0.6
Setco Automotive
Neutral
229
-
612
594
741
12.7
13.7
8.4
15.8
27.3
14.5
2.8
2.5
10.4
16.9
1.5
1.2
Tata Motors
Accumulate
381
424
109,916
264,038
297,882
13.8
13.9
34.5
38.9
11.0
9.8
1.9
1.6
17.6
16.8
0.6
0.5
TVS Motor
Neutral
243
-
11,526
11,702
13,713
6.8
7.7
10.1
14.5
24.0
16.7
5.9
4.8
24.5
28.3
1.0
0.8
Amara Raja Batteries
Neutral
993
-
16,957
5,101
6,224
17.8
17.6
31.1
39.2
31.9
25.3
7.9
6.3
24.8
24.8
3.3
2.6
Exide Industries
Accumulate
151
159
12,835
7,363
8,247
13.7
14.5
6.6
7.7
22.9
19.6
2.9
2.6
12.6
13.3
1.5
1.3
Apollo Tyres
Neutral
191
-
9,740
12,576
12,978
16.8
16.1
22.3
19.9
8.6
9.6
1.5
1.3
17.2
13.4
0.9
0.9
Ceat
Neutral
1,235
-
4,997
6,041
6,597
14.3
14.2
101.5
116.6
12.2
10.6
2.4
2.0
20.0
19.1
1.0
0.8
JK Tyres
Neutral
103
-
2,332
7,446
7,669
15.2
14.0
19.6
18.4
5.2
5.6
1.3
1.1
25.2
19.5
0.7
0.6
Swaraj Engines
Accumulate
858
912
1,065
593
677
14.5
14.8
51.2
60.8
16.8
14.1
3.9
3.5
23.3
24.8
1.7
1.4
Subros
Neutral
87
-
520
1,268
1,488
11.6
11.9
3.7
6.6
23.4
13.1
1.6
1.4
6.8
11.4
0.7
0.6
Indag Rubber
Neutral
184
-
482
283
329
17.0
17.2
13.0
15.4
14.2
11.9
3.1
2.6
21.8
21.6
1.4
1.2
Capital Goods
ACE
Neutral
43
-
427
660
839
4.7
8.2
1.0
3.9
43.2
11.1
1.4
1.2
3.2
11.3
0.8
0.6
BEML
Neutral
1,226
-
5,106
3,277
4,006
6.0
8.9
29.2
64.3
42.0
19.1
2.3
2.1
5.7
11.7
1.6
1.3
BGR Energy
Neutral
118
-
853
3,615
3,181
9.5
9.4
16.7
12.4
7.1
9.5
0.7
0.7
10.0
7.0
0.6
0.8
BHEL
Neutral
212
-
51,816
33,722
35,272
10.8
11.7
10.5
14.2
20.2
14.9
1.5
1.4
7.0
9.0
1.6
1.5
Blue Star
Accumulate
361
387
3,243
3,649
4,209
5.0
5.9
9.2
14.7
39.4
24.5
7.1
6.7
9.1
17.5
1.0
0.8
Crompton Greaves
Accumulate
181
204
11,332
13,484
14,687
4.9
6.2
4.5
7.1
40.2
25.5
2.8
2.7
7.2
10.8
1.0
0.9
Inox Wind
Buy
388
505
8,599
4,980
5,943
17.0
17.5
26.6
31.6
14.6
12.3
4.4
3.2
35.0
30.0
1.9
1.5
Stock Watch
October 16, 2015
Company Name
Reco
CMP
Target
Mkt Cap
Sales ( Čcr )
OPM(%)
EPS (Č)
PER(x)
P/BV(x)
RoE(%)
EV/Sales(x)
(Č)
Price ( Č)
( Č cr )
FY16E
FY17E
FY16E
FY17E
FY16E
FY17E
FY16E
FY17E
FY16E
FY17E
FY16E
FY17E
FY16E
FY17E
Capital Goods
KEC International
Neutral
148
-
3,811
8,791
9,716
6.1
6.8
5.4
8.2
27.5
18.1
2.8
2.5
10.0
14.0
0.7
0.6
Thermax
Neutral
855
-
10,183
6,413
7,525
7.4
8.5
30.5
39.3
28.0
21.7
4.3
3.8
15.0
17.0
1.6
1.3
Cement
ACC
Accumulate
1,371
1,548
25,735
11,856
14,092
14.5
17.8
47.6
76.1
28.8
18.0
3.0
2.7
10.6
15.7
2.0
1.7
Ambuja Cements
Accumulate
210
233
32,543
10,569
12,022
20.7
22.2
8.7
10.7
24.1
19.6
3.1
2.9
13.0
15.2
2.7
2.3
India Cements
Buy
84
112
2,583
4,716
5,133
15.9
16.9
3.7
7.5
22.7
11.2
0.8
0.8
3.8
7.3
0.9
0.7
JK Cement
Buy
639
767
4,470
4,056
4,748
14.5
17.0
22.6
41.1
28.3
15.6
2.5
2.3
9.3
15.3
1.5
1.3
J K Lakshmi Cement
Accumulate
376
430
4,426
2,947
3,616
16.7
19.9
11.5
27.2
32.7
13.8
3.1
2.7
9.8
20.8
1.9
1.5
Mangalam Cements
Neutral
223
-
594
1,053
1,347
10.5
13.3
8.4
26.0
26.5
8.6
1.1
1.0
4.3
12.5
0.9
0.7
Orient Cement
Neutral
175
-
3,585
1,854
2,524
21.2
22.2
7.7
11.1
22.7
15.8
3.3
2.8
13.3
15.7
2.7
1.9
Ramco Cements
Neutral
338
-
8,043
4,036
4,545
20.8
21.3
15.1
18.8
22.4
18.0
2.7
2.4
12.9
14.3
2.5
2.2
Shree Cement^
Neutral
11,693
-
40,734
7,150
8,742
26.7
28.6
228.0
345.5
51.3
33.8
7.6
6.3
15.7
20.3
5.5
4.4
UltraTech Cement
Accumulate
2,950
3,282
80,953
27,562
31,548
20.4
22.3
111.9
143.3
26.4
20.6
3.7
3.2
15.2
16.8
3.0
2.6
Construction
ITNL
Neutral
94
-
3,087
7,360
8,825
34.0
35.9
1.0
5.0
93.9
18.8
0.4
0.4
0.3
1.4
3.9
3.7
KNR Constructions
Neutral
591
-
1,662
915
1,479
14.3
13.9
20.3
37.2
29.1
15.9
2.7
2.3
9.6
15.6
1.9
1.2
Larsen & Toubro
Buy
1,561
2,013
145,230
68,920
82,446
10.9
11.5
57.0
73.0
27.4
21.4
2.5
2.3
13.6
15.5
2.3
1.9
Gujarat Pipavav Port
Neutral
194
-
9,357
721
784
53.1
53.6
8.2
9.1
23.6
21.3
3.8
3.1
20.0
18.3
12.5
11.2
MBL Infrastructures
Buy
234
360
970
2,313
2,797
12.2
14.6
19.0
20.0
12.3
11.7
1.3
1.2
11.3
10.6
1.1
1.0
Nagarjuna Const.
Neutral
81
-
4,500
7,892
8,842
8.3
9.1
2.4
5.3
33.7
15.3
1.4
1.3
4.2
8.6
0.8
0.7
PNC Infratech
Neutral
516
-
2,647
1,798
2,132
13.2
13.5
22.0
30.0
23.5
17.2
2.1
1.9
11.5
11.4
1.6
1.3
Simplex Infra
Neutral
350
-
1,730
6,241
7,008
10.4
10.7
20.0
36.0
17.5
9.7
1.4
1.3
6.8
11.1
0.8
0.7
Financials
Allahabad Bank
Neutral
78
-
4,708
8,438
9,521
2.8
2.8
21.9
27.0
3.6
2.9
0.4
0.3
10.2
11.5
-
-
Axis Bank
Buy
499
701
118,572
26,941
32,298
3.5
3.6
37.4
46.4
13.3
10.8
2.7
2.3
18.7
20.0
-
-
Bank of Baroda
Neutral
179
-
41,348
19,027
21,737
1.9
2.0
16.9
24.5
10.6
7.3
1.0
0.9
9.1
12.1
-
-
Bank of India
Neutral
143
-
11,305
16,438
18,706
1.9
2.0
19.2
40.9
7.4
3.5
0.4
0.4
4.5
9.1
-
-
Canara Bank
Neutral
302
-
16,385
15,491
17,269
2.0
2.0
61.6
70.9
4.9
4.3
0.6
0.5
10.5
11.1
-
-
Dena Bank
Neutral
43
-
2,396
3,498
3,977
2.1
2.3
7.8
10.7
5.5
4.0
0.4
0.4
6.5
8.4
-
-
Federal Bank
Neutral
64
-
11,028
3,527
4,135
3.0
3.1
5.2
6.7
12.4
9.6
1.3
1.2
10.8
12.7
-
-
HDFC
Neutral
1,294
-
204,167
10,883
12,799
3.5
3.4
43.0
50.6
30.1
25.6
6.0
5.4
25.9
26.7
-
-
HDFC Bank
Buy
1,085
1,255
273,098
38,059
46,851
4.4
4.5
50.0
62.7
21.7
17.3
3.8
3.2
18.8
20.2
-
-
Stock Watch
October 16, 2015
Company Name
Reco
CMP
Target
Mkt Cap
Sales ( Čcr )
OPM(%)
EPS (Č)
PER(x)
P/BV(x)
RoE(%)
EV/Sales(x)
(Č)
Price ( Č)
( Č cr )
FY16E
FY17E
FY16E
FY17E
FY16E
FY17E
FY16E
FY17E
FY16E
FY17E
FY16E
FY17E
FY16E
FY17E
Financials
ICICI Bank
Buy
286
370
166,187
35,810
41,871
3.4
3.5
22.0
26.2
13.0
10.9
2.3
1.9
15.0
15.6
-
-
IDBI Bank
Neutral
77
-
12,391
9,860
10,978
1.8
1.9
9.3
15.6
8.3
5.0
0.6
0.5
6.4
10.1
-
-
Indian Bank
Neutral
139
-
6,666
6,267
7,171
2.4
2.5
25.4
32.1
5.5
4.3
0.5
0.4
8.0
9.3
-
-
LIC Housing Finance
Buy
492
570
24,804
2,934
3,511
2.3
2.3
30.9
36.8
15.9
13.4
2.6
2.2
16.8
17.5
-
-
Oriental Bank
Neutral
146
-
4,375
7,730
8,595
2.4
2.5
38.8
47.4
3.8
3.1
0.3
0.3
8.6
9.8
-
-
Punjab Natl.Bank
Neutral
137
-
26,980
23,446
26,624
2.8
2.9
17.8
27.5
7.7
5.0
0.8
0.6
8.5
12.1
-
-
South Ind.Bank
Neutral
23
-
3,078
1,930
2,215
2.4
2.4
2.6
3.6
8.8
6.3
0.9
0.8
9.9
12.5
-
-
St Bk of India
Buy
249
307
193,254
83,847
96,307
2.8
2.8
20.1
25.1
12.4
9.9
1.4
1.2
11.5
13.1
-
-
Union Bank
Neutral
178
-
12,233
12,755
14,439
2.3
2.4
31.5
39.9
5.7
4.5
0.6
0.5
9.9
11.6
-
-
Vijaya Bank
Neutral
38
-
3,299
3,594
3,969
1.8
1.9
5.8
7.1
6.6
5.4
0.6
0.5
8.2
9.3
-
-
Yes Bank
Buy
759
953
31,785
7,204
9,078
3.2
3.2
57.8
69.5
13.1
10.9
2.3
2.0
19.6
22.6
-
-
FMCG
Asian Paints
Neutral
869
-
83,388
16,553
19,160
16.0
16.2
17.7
21.5
49.2
40.4
13.1
11.8
29.4
31.2
4.9
4.2
Britannia
Neutral
3,176
-
38,108
8,065
9,395
9.6
10.2
47.2
65.5
67.3
48.5
22.4
21.1
38.3
41.2
4.6
3.9
Colgate
Neutral
908
-
24,685
4,836
5,490
19.5
19.7
48.5
53.2
18.7
17.1
13.7
11.9
99.8
97.5
5.0
4.4
Dabur India
Neutral
272
-
47,759
9,370
10,265
17.1
17.2
7.3
8.1
37.1
33.6
11.2
9.1
33.7
30.6
5.0
4.6
GlaxoSmith Con*
Neutral
6,016
-
25,301
4,919
5,742
17.2
17.4
168.3
191.2
35.8
31.5
10.1
8.6
28.8
28.9
4.7
4.0
Godrej Consumer
Neutral
1,229
-
41,857
10,168
12,886
16.1
16.1
32.1
38.4
38.3
32.0
7.8
7.2
19.7
21.0
4.2
3.3
HUL
Neutral
791
-
171,097
34,940
38,957
17.5
17.7
20.8
24.7
38.0
32.0
42.3
33.8
110.5
114.2
4.7
4.2
ITC
Buy
350
409
280,646
41,068
45,068
37.8
37.4
13.9
15.9
25.1
22.0
8.4
7.4
34.1
33.8
6.5
5.9
Marico
Neutral
399
-
25,755
6,551
7,766
15.7
16.0
10.4
12.5
38.5
31.9
11.2
9.3
33.2
32.4
3.9
3.3
Nestle*
Accumulate
6,204
6,646
59,816
11,291
12,847
22.2
22.3
158.9
184.6
39.0
33.6
20.4
18.4
55.0
57.3
5.1
4.5
Tata Global
Accumulate
135
144
8,494
8,635
9,072
9.8
9.9
6.5
7.6
20.7
17.7
2.1
2.0
6.8
7.4
0.9
0.9
IT
HCL Tech^
Buy
835
1,132
117,419
42,038
47,503
23.5
23.5
56.4
62.9
14.8
13.3
3.4
2.6
23.2
19.8
2.4
1.9
Infosys
Buy
1,097
1,306
251,975
60,250
66,999
28.0
28.0
58.3
63.7
18.8
17.2
4.0
3.4
20.9
19.7
3.5
3.0
TCS
Buy
2,469
3,168
486,430
108,420
123,559
28.8
28.7
127.2
143.9
19.4
17.2
7.7
7.2
39.9
41.8
4.1
3.5
Tech Mahindra
Buy
545
646
52,479
25,566
28,890
16.0
17.0
26.3
31.9
20.7
17.1
3.7
3.2
17.9
18.6
1.8
1.5
Wipro
Buy
578
719
142,673
52,414
58,704
23.7
23.8
38.4
42.3
15.0
13.7
2.9
2.6
19.5
18.0
2.3
1.9
Media
D B Corp
Buy
306
356
5,615
2,241
2,495
27.8
27.9
21.8
25.6
14.0
11.9
3.7
3.2
26.7
28.5
2.4
2.2
HT Media
Neutral
94
-
2,177
2,495
2,603
11.2
11.2
7.3
8.6
12.8
10.9
1.0
0.9
7.4
8.1
0.4
0.4
Stock Watch
October 16, 2015
Company Name
Reco
CMP
Target
Mkt Cap
Sales ( Čcr )
OPM(%)
EPS (Č)
PER(x)
P/BV(x)
RoE(%)
EV/Sales(x)
(Č)
Price ( Č)
( Č cr )
FY16E FY17E
FY16E
FY17E
FY16E
FY17E
FY16E
FY17E
FY16E
FY17E
FY16E
FY17E
FY16E
FY17E
Media
Jagran Prakashan
Accumulate
145
156
4,750
1,939
2,122
26.0
26.0
8.3
9.2
17.5
15.8
3.0
2.7
17.5
17.1
2.4
2.2
Sun TV Network
Neutral
367
-
14,481
2,779
3,196
70.2
70.5
22.8
27.3
16.1
13.5
4.0
3.6
26.7
28.3
5.0
4.3
Hindustan Media
Neutral
280
-
2,053
920
1,031
20.0
20.0
19.2
20.9
14.6
13.4
2.4
2.1
16.4
15.3
1.8
1.6
Ventures
Metals & Mining
Coal India
Buy
342
400
215,893
72,015
78,415
21.2
21.5
21.7
25.3
15.7
13.5
5.3
5.3
33.1
39.1
2.2
2.1
Hind. Zinc
Neutral
148
-
62,471
15,258
16,495
44.2
45.6
17.6
19.2
8.4
7.7
1.3
1.2
15.9
15.3
1.8
1.3
Hindalco
Neutral
88
-
18,162
104,356
111,186
8.7
9.5
6.7
11.1
13.1
8.0
0.5
0.5
3.5
5.9
0.7
0.6
JSW Steel
Neutral
913
-
22,061
48,125
53,595
18.8
21.0
46.9
97.5
19.5
9.4
0.9
0.9
4.4
9.5
1.3
1.1
NMDC
Neutral
100
-
39,806
8,237
10,893
46.6
44.5
10.0
11.7
10.1
8.6
1.1
1.0
12.5
13.0
4.6
3.5
SAIL
Neutral
57
-
23,603
45,915
53,954
7.2
10.5
1.5
4.4
37.9
13.1
0.6
0.5
2.3
4.1
1.2
1.0
Vedanta
Neutral
109
-
32,389
71,445
81,910
26.2
26.3
12.9
19.2
8.5
5.7
0.6
0.5
7.2
8.9
0.9
0.7
Tata Steel
Neutral
255
-
24,795
136,805
149,228
11.3
11.9
26.4
36.8
9.7
6.9
0.8
0.7
6.0
8.0
0.7
0.7
Oil & Gas
Cairn India
Neutral
160
-
29,988
11,323
12,490
49.4
51.0
20.7
20.7
7.7
7.8
0.5
0.5
6.4
6.1
1.7
1.0
GAIL
Neutral
323
-
41,023
64,856
70,933
9.1
9.6
24.0
28.9
13.5
11.2
1.2
1.1
8.8
9.6
0.8
0.7
ONGC
Neutral
260
-
222,657
154,564
167,321
36.8
37.4
28.6
32.5
9.1
8.0
1.2
1.1
12.7
13.5
1.6
1.5
Petronet LNG
Accumulate
187
210
14,048
39,007
40,785
3.8
4.2
9.2
11.0
20.5
17.1
2.3
2.1
11.6
12.7
0.4
0.4
Indian Oil Corp
Accumulate
403
455
97,871
359,607
402,760
5.9
6.1
42.5
48.7
9.5
8.3
1.3
1.1
14.1
14.4
0.4
0.3
Reliance Industries
Neutral
904
-
292,754
313,085
362,904
13.1
13.8
78.4
92.9
11.5
9.7
1.2
1.1
10.8
11.6
1.4
1.2
Pharmaceuticals
Alembic Pharma
Neutral
722
-
13,608
2,601
3,115
21.2
20.2
20.8
23.9
34.7
30.2
11.1
8.4
37.2
31.8
5.3
4.3
Aurobindo Pharma
Accumulate
792
872
46,250
14,923
17,162
23.0
23.0
38.2
43.6
20.7
18.2
6.4
4.8
36.0
30.2
3.4
2.9
Aventis*
Neutral
3,921
-
9,030
2,156
2,455
15.1
16.8
109.7
133.9
35.7
29.3
4.9
4.0
18.4
22.5
3.9
3.2
Cadila Healthcare
Neutral
421
-
43,059
10,224
11,840
20.0
21.0
71.0
85.6
5.9
4.9
1.6
1.3
30.1
28.5
4.3
3.6
Cipla
Neutral
673
-
54,017
14,359
16,884
21.3
19.7
28.4
30.5
23.7
22.1
4.2
3.6
19.3
17.5
3.8
3.1
Dr Reddy's
Neutral
4,209
-
71,769
18,213
21,214
22.6
22.7
163.0
192.5
25.8
21.9
5.3
4.4
22.5
20.0
3.9
3.3
Dishman Pharma
Neutral
362
-
2,921
1,716
1,888
20.2
20.2
16.3
21.6
22.2
16.8
2.1
1.9
9.7
11.7
1.9
1.6
GSK Pharma*
Neutral
3,301
-
27,962
2,870
3,158
20.0
22.1
59.5
68.3
55.5
48.3
16.4
16.8
28.5
34.3
9.2
8.5
Indoco Remedies
Neutral
328
-
3,018
1,088
1,262
18.2
18.2
13.1
15.5
25.0
21.1
4.9
4.1
21.2
21.1
2.8
2.5
Ipca labs
Accumulate
750
800
9,457
3,507
4,078
17.6
18.6
25.8
32.0
29.1
23.4
3.8
3.3
13.8
14.9
3.0
2.5
Lupin
Neutral
2,099
-
94,507
14,864
17,244
26.9
26.9
62.1
71.1
33.8
29.5
8.2
6.5
27.4
24.6
6.1
5.1
Sun Pharma
Accumulate
889
950
213,920
28,163
32,610
25.8
30.7
17.4
26.9
51.1
33.1
4.8
4.2
13.0
16.6
7.1
5.9
Stock Watch
October 16, 2015
Company Name
Reco
CMP
Target
Mkt Cap
Sales ( Čcr )
OPM(%)
EPS (Č)
PER(x)
P/BV(x)
RoE(%)
EV/Sales(x)
(Č)
Price ( Č)
( Č cr )
FY16E FY17E
FY16E
FY17E
FY16E
FY17E
FY16E
FY17E
FY16E
FY17E
FY16E
FY17E
FY16E
FY17E
Power
Tata Power
Neutral
70
-
18,987
35,923
37,402
22.6
22.8
4.1
5.2
17.3
13.6
1.3
1.2
7.5
9.3
1.5
1.4
NTPC
Buy
125
157
103,110
87,064
98,846
23.5
23.5
11.7
13.2
10.7
9.5
1.2
1.1
11.4
12.1
2.2
2.0
Power Grid
Buy
135
170
70,600
20,702
23,361
86.7
86.4
12.1
13.2
11.2
10.2
1.6
1.5
15.6
15.1
8.3
7.8
Telecom
Bharti Airtel
Neutral
351
-
140,489
101,748
109,191
32.1
31.7
12.0
12.5
29.3
28.1
2.0
1.9
6.9
6.7
2.0
1.8
Idea Cellular
Neutral
153
-
54,930
34,282
36,941
32.0
31.5
5.9
6.2
25.9
24.6
2.4
2.2
9.9
9.3
2.2
2.1
zOthers
Abbott India
Neutral
5,574
-
11,845
2,715
3,153
14.5
14.1
134.3
152.2
41.5
36.6
10.4
8.5
27.4
25.6
4.1
3.5
Bajaj Electricals
Buy
253
341
2,552
4,719
5,287
5.2
5.8
8.6
12.7
29.6
20.0
3.4
3.0
11.4
14.8
0.5
0.5
Finolex Cables
Neutral
255
-
3,901
2,728
3,036
10.8
11.0
14.4
16.8
17.7
15.2
2.7
2.3
15.2
15.3
1.2
1.0
Goodyear India*
Buy
567
655
1,308
1,953
1,766
12.4
12.0
67.4
59.6
8.4
9.5
2.1
1.8
27.7
20.2
0.5
0.4
Hitachi
Neutral
1,464
-
3,982
1,806
2,112
9.0
9.2
28.6
29.1
51.2
50.4
12.7
10.3
28.1
22.6
2.3
1.9
Jyothy Laboratories
Neutral
313
-
5,666
1,620
1,847
11.5
11.5
7.3
8.5
42.9
36.9
5.6
5.1
13.3
14.4
3.4
2.9
MRF
Neutral
41,831
-
17,741
20,727
14,841
19.3
18.6
4,905.8
3,351.9
8.5
12.5
2.7
2.2
37.6
19.6
0.8
1.1
Page Industries
Neutral
14,098
-
15,724
1,929
2,450
19.8
20.1
229.9
299.0
61.3
47.2
27.1
18.8
52.1
47.1
8.2
6.4
Relaxo Footwears
Neutral
540
-
6,480
1,767
2,152
12.3
12.5
19.3
25.1
28.1
21.6
6.9
5.3
27.7
27.8
3.7
3.0
Siyaram Silk Mills
Buy
968
1,221
907
1,653
1,873
11.7
12.2
99.3
122.1
9.8
7.9
1.8
1.5
19.5
20.2
0.7
0.6
Styrolution ABS India*
Neutral
806
-
1,418
1,271
1,440
8.6
9.2
32.0
41.1
25.2
19.6
2.6
2.3
10.7
12.4
1.1
0.9
Tree House
Buy
308
449
1,302
259
324
56.8
56.8
17.0
21.7
18.1
14.2
1.8
1.6
10.1
11.5
4.9
4.1
TVS Srichakra
Neutral
3,072
-
2,352
2,127
2,388
15.2
14.9
237.7
267.5
12.9
11.5
5.5
3.9
51.7
39.8
1.2
1.0
HSIL
Neutral
307
-
2,218
2,182
2,404
16.3
16.5
15.8
18.9
19.4
16.3
1.6
1.5
8.4
9.4
1.4
1.2
Kirloskar Engines India
Accumulate
281
297
4,059
2,634
3,252
10.1
12.0
10.9
17.4
25.7
16.1
2.9
2.6
11.4
16.8
1.2
0.9
Ltd
M M Forgings
Buy
548
797
661
563
671
22.1
22.9
51.0
66.5
10.7
8.2
2.2
1.8
23.1
24.1
1.3
1.1
Banco Products (India)
Neutral
141
-
1,008
1,208
1,353
11.0
12.3
10.8
14.5
13.1
9.7
1.5
1.3
11.9
14.5
0.8
0.7
Competent Automobiles Neutral
145
-
89
1,007
1,114
3.1
3.1
23.7
28.2
6.1
5.1
0.9
0.8
13.9
14.6
0.1
0.1
Nilkamal
Neutral
971
-
1,449
1,948
2,147
10.6
10.3
60.0
67.0
16.2
14.5
2.5
2.2
16.8
16.1
0.8
0.7
Visaka Industries
Accumulate
150
166
238
1,158
1,272
8.6
9.5
23.7
32.7
6.3
4.6
0.6
0.6
10.1
12.5
0.4
0.3
Transport Corporation of
Neutral
304
-
2,309
2,830
3,350
8.8
9.0
14.4
18.3
21.1
16.6
3.3
2.8
15.4
17.1
0.9
0.8
India
Elecon Engineering
Buy
75
87
814
1,452
1,596
14.0
14.7
4.4
6.2
16.9
12.0
1.4
1.3
8.6
11.2
0.9
0.7
Surya Roshni
Buy
140
183
614
2,992
3,223
8.3
8.5
14.7
18.3
9.5
7.7
0.9
0.8
9.8
11.0
0.5
0.5
MT Educare
Buy
143
169
571
286
366
18.3
17.7
7.7
9.4
18.6
15.3
3.9
3.4
20.2
21.1
1.9
1.4
Stock Watch
October 16, 2015
Company Name
Reco
CMP
Target Mkt Cap
Sales ( Čcr )
OPM(%)
EPS (Č)
PER(x)
P/BV(x)
RoE(%)
EV/Sales(x)
(Č)
Price ( Č)
( Č cr )
FY16E FY17E FY16E FY17E FY16E FY17E FY16E FY17E FY16E FY17E FY16E FY17E FY16E FY17E
zOthers
Radico Khaitan
Buy
89
112
1,179
1,565
1,687
11.9
12.4
5.4
6.6
16.4
13.5
1.3
1.2
8.0
9.0
1.3
1.2
Garware Wall Ropes
Accumulate
352
390
769
875
983
10.4
10.6
23.1
27.8
15.2
12.7
2.2
1.9
14.1
14.8
0.9
0.8
Wonderla Holidays
Accumulate
300
322
1,697
206
308
44.0
43.6
9.0
12.9
33.4
23.3
4.6
4.1
13.7
17.8
8.1
5.4
Linc Pen & Plastics
Accumulate
165
185
244
340
371
8.3
8.9
10.8
13.2
15.3
12.5
2.5
2.1
16.0
17.1
0.8
0.7
The Byke Hospitality
Accumulate
161
181
645
222
287
20.5
20.5
5.6
7.6
28.5
21.3
5.4
4.4
18.9
20.8
2.9
2.3
Source: Company, Angel Research; Note: *December year end; #September year end; &October year end; Price as on October 15, 2015
Market Outlook
October 16, 2015
Research Team Tel: 022 - 39357800
DISCLAIMER
Angel Broking Private Limited (hereinafter referred to as “Angel”) is a registered Member of National Stock Exchange of India Limited,
Bombay Stock Exchange Limited and Metropolitian Stock Exchange of India Limited. It is also registered as a Depository Participant with
CDSL and Portfolio Manager with SEBI. It also has registration with AMFI as a Mutual Fund Distributor. Angel Broking Private Limited is a
registered entity with SEBI for Research Analyst in terms of SEBI (Research Analyst) Regulations, 2014 vide registration number
INH000000164. Angel or its associates has not been debarred/ suspended by SEBI or any other regulatory authority for accessing
/dealing in securities Market. Angel or its associates including its relatives/analyst do not hold any financial interest/beneficial ownership
of more than 1% in the company covered by Analyst. Angel or its associates/analyst has not received any compensation / managed or co
-managed public offering of securities of the company covered by Analyst during the past twelve months. Angel/analyst has not served as
an officer, director or employee of company covered by Analyst and has not been engaged in market making activity of the company
covered by Analyst.
This document is solely for the personal information of the recipient, and must not be singularly used as the basis of any investment
decision. Nothing in this document should be construed as investment or financial advice. Each recipient of this document should make
such investigations as they deem necessary to arrive at an independent evaluation of an investment in the securities of the companies
referred to in this document (including the merits and risks involved), and should consult their own advisors to determine the merits and
risks of such an investment.
Reports based on technical and derivative analysis center on studying charts of a stock's price movement, outstanding positions and
trading volume, as opposed to focusing on a company's fundamentals and, as such, may not match with a report on a company's
fundamentals.
The information in this document has been printed on the basis of publicly available information, internal data and other reliable sources
believed to be true, but we do not represent that it is accurate or complete and it should not be relied on as such, as this document is for
general guidance only. Angel Broking Pvt. Limited or any of its affiliates/ group companies shall not be in any way responsible for any
loss or damage that may arise to any person from any inadvertent error in the information contained in this report. Angel Broking Pvt.
Limited has not independently verified all the information contained within this document. Accordingly, we cannot testify, nor make any
representation or warranty, express or implied, to the accuracy, contents or data contained within this document. While Angel Broking
Pvt. Limited endeavors to update on a reasonable basis the information discussed in this material, there may be regulatory, compliance,
or other reasons that prevent us from doing so.
This document is being supplied to you solely for your information, and its contents, information or data may not be reproduced,
redistributed or passed on, directly or indirectly.
Neither Angel Broking Pvt. Limited, nor its directors, employees or affiliates shall be liable for any loss or damage that may arise from or
in connection with the use of this information.
Note: Please refer to the important ‘Stock Holding Disclosure' report on the Angel website (Research Section). Also, please refer to the
latest update on respective stocks for the disclosure status in respect of those stocks. Angel Broking Pvt. Limited and its affiliates may have
investment positions in the stocks recommended in this report.