Market Outlook
May 16, 2016
Market Cues
Domestic Indices
Chg (%)
(Pts)
(Close)
BSE Sensex
(1.2)
(301)
25,490
Indian markets are expected to open on flat note tracking global cues.
Nifty
(1.1)
(86)
7,815
U.S markets tumbled Friday, notching another weekly loss for the three main
Mid Cap
(0.6)
(65)
11,156
benchmarks. Markets dropped as a strong report on U.S. retail sales failed to
Small Cap
(0.2)
(27)
11,113
assuage investor worries about the troubled sector. Meanwhile, a drop in crude-oil
futures weighed on energy shares and deflated investors’ appetite for risky assets.
Bankex
(1.3)
(241)
19,040
European markets rebounded from losses earlier in Friday's session as strong U.S.
retail sales data buoyed markets.
Global Indices
Chg (%)
(Pts)
(Close)
Dow Jones
(1.1)
(185)
17,535
Indian markets tumbled on Friday in the wake of weak global cues and
disappointing industrial output as well as consumer inflation data.
Nasdaq
(0.4)
(20)
4,718
FTSE
0.6
34
6,139
News Analysis
Nikkei
(1.4)
(234)
16,412
Bank Of Baroda’s Q4FY16 takes hit due to higher provisions
Hang Seng
(1.0)
(196)
19,719
Result Review: Nilkamal
Detailed analysis on Pg2
Shanghai Com
(0.3)
(9)
2,827
Investor’s Ready Reckoner
Advances / Declines
BSE
NSE
Key Domestic & Global Indicators
Advances
1,044
559
Stock Watch: Latest investment recommendations on 150+ stocks
Declines
1,524
983
Refer Pg5 onwards
Unchanged
165
76
Top Picks
CMP
Target
Upside
Volumes (` Cr)
Company
Sector
Rating
(`)
(`)
(%)
BSE
2,651
Amara Raja
Auto & Auto Ancillary Accumulate
942
1,076
14.2
NSE
19,337
HCL Tech
IT
Buy
722
1,038
43.7
LIC Housing
Financials
Buy
457
592
29.4
Bharat Electronics
Capital Goods
Buy
1,149
1,414
23.1
Net Inflows (` Cr)
Net
Mtd
Ytd
Navkar Corporation Others
Buy
184
265
44.2
FII
51
(162)
11,628
More Top Picks on Pg4
MFs
1,583
2,439
5,035
Key Upcoming Events
Previous
Consensus
Top Gainers
Price (`)
Chg (%)
Date
Region
Event Description
Reading
Expectations
Manappuram
50
19.9
May 16 China
Industrial Production (YoY)
6.80
6.50
Network18
43
8.3
May 17 India
Monthly Wholesale Price YoY%
(0.85)
(0.23)
Nestleind
6,129
7.4
May 17 USA
Consumer Price Index (MoM)
0.10
0.40
Indianb
91
6.2
May 17 USA
Industrial Production (YoY)
(0.59)
0.30
6.(
More Events on Pg5
Indhotel
113
5.9
Top Losers
Price (`)
Chg (%)
Srf
1,263
(8.8)
Ucobank
34
(5.9)
Rcom
52
(5.3)
Polaris
187
(5.2)
Relinfra
511
(5.0)
As on May 13, 2013
Market Outlook
May 16, 2016
Bank Of Baroda’s Q4FY16 takes hit due to higher
provisions
Bank Of Baroda reported a net loss of `3230cr due to higher than expected
provisions and was a negative surprise for us. However, the management feels the
worst seems to be coming to end. The Bank saw another quarter of loss led by
high provisioning in Q4FY16.Total provisions of
`6857cr includes
`1615cr
relating to one time provisions towards employee pensions. Despite this the
provisions towards NPAs remained high at `4880cr, much higher than our and
streets’ expectations.
However, a positive take is the bank has increased its provisioning coverage ratio
from 53% to ~60% during the quarter. Gross Slippages during the quarter
remained elevated at `5932cr, though much lower than Q3FY16.Around `2060
cr of loans from the restructured portfolio slipped into NPAs during the quarter.
The managements feel `13,735cr and further loans worth `13,000cr under SMA 2
remains under stress and NPAs to come largely from this segment. Looking at the
elevated provisions we believe FY17 to remain challenging for the bank. We have
an NEUTRAL rating on the stock.
Nilkamal - 4QFY2016 (CMP: `1,245/ TP: `1,318/ Upside: 5.8%)
Nilkamal reported excellent set of numbers for4QFY2016. The top-line grew by
2.6% yoy to `503cr which is the same as our estimate. Raw material cost declined
by 582bp yoy to 56.4% yoy of sales while employee and other expenses increased
by 104bp yoy and 146bp yoy to 6.8% and 23.6% of sales, respectively. Aided by
lower material cost, the EBITDA margin expanded by 333bp yoy to 13.1% which is
higher than our estimate of 10.2%. The interest outgo has declined by 30% yoy to
`4cr on account of lower debt while the depreciation expense increased by 27.6%
yoy to `16cr. Consequently, the net profit grew by 50.6% yoy to `33cr beating our
estimate of `23cr.
As far as segmental performance is concerned, the plastics division witnessed 2.9%
yoy growth to `438cr and the margins for the segment improved by 523bp yoy to
15.7%. The lifestyle segments’ revenues grew by 0.9% yoy to `60cr while the
segment reported loss of `9 cr. Others, which is includes the mattress business,
saw revenue growth of 18.4% on yoy basis to `10cr while the segment reported
profit of `0.3cr.
At current market price, the stock is trading at 15.1x its FY2018E earnings. We
have an Accumulate rating on the stock with target price of `1,318
Y/E
Sales OPM
PAT
EPS ROE P/E P/BV EV/EBITDA EV/Sales
Mar
(` cr)
(%)
(` cr)
(`)
(%)
(x)
(x)
(x)
(x)
FY2017E
1,999
10.6
106
71.1 16.8 17.5
2.7
8.7
0.9
FY2018E
2,204
10.7
123
82.4 16.7 15.1
2.4
7.4
0.8
Market Outlook
May 16, 2016
Economic and Political News
Odisha to auction six mineral blocks in FY17, seven more in next fiscal
Manufacturing sector likely to slow down in Apr-Jun qtr: Ficci
Delhi-NCR witnesses 62% rise in new home launches in Jan-Mar
Corporate News
SAIL lines up `6,000cr capex for FY17
BHEL commissions 660 Mw power plant in Maharashtra
AkzoNobel Q4 net rises 17% to `52.6cr
Quarterly Bloomberg Brokers Consensus Estimate
Bharat Forge Ltd. - May 17, 2016
Particulars (` cr)
4QFY16E
4QFY15
y-o-y (%)
3QFY16
q-o-q (%)
Net sales
1,100
1,195
(8.0)
1029
6.9
EBITDA
328
360
(8.7)
313
4.8
EBITDA margin (%)
29.9
30.1
30.4
Net profit
183
203
(10.2)
166
15.3
Motherson Sumi Ltd. Consol - May 17, 2016
Particulars (` cr)
4QFY16E
4QFY15
y-o-y (%)
3QFY16
q-o-q (%)
Net sales
10,544
9322
13.1
9676
9
EBITDA
1061
938
13.1
945
12.3
EBITDA margin (%)
10.1
10.1
9.8
Net profit
353
489
(27.8)
427
(17.3)
Punjab National Bank - May 18, 2016
Particulars (` cr)
4QFY16E
4QFY15
y-o-y (%)
3QFY16
q-o-q (%)
Net profit
58
307
(81.2)
51
13.7
JSW Steel Ltd. Consol - May 18, 2016
Particulars (` cr)
4QFY16E
4QFY15
y-o-y (%)
3QFY16
q-o-q (%)
Net sales
10,552
12,364
(14.7)
8,621
22.4
EBITDA
1,473
1,657
(11.1)
(1230)
(219.8)
EBITDA margin (%)
14.0
13.4
(14.3)
Net profit
(64)
31
(306.5)
(982)
(93.5)
Market Outlook
May 16, 2016
Top Picks
Large Cap
Market Cap
CMP
Target
Upside
Company
Rationale
(` Cr)
(`)
(`)
(%)
To outpace battery industry growth due to better technological
Amara Raja Batteries
16,093
942
1,076
14.2
products leading to market share gains in both the automotive
OEM and replacement segments.
Uptick in defense capex by government when coupled with
Bharat Electronics
27,574
1,149
1,414
23.1
BELs strong market positioning, indicate that good times are
ahead for BEL.
The stock is trading at attractive valuations and is factoring all
HCL Tech
1,01,878
722
1,038
43.7
the bad news.
Strong visibility for a robust 20% earnings trajectory, coupled
HDFC Bank
2,88,371
1,140
1,262
10.7
with high quality of earnings on account of high quality retail
business and strategic focus on highly rated corporates.
Back on the growth trend, expect a long term growth of 14%
Infosys
2,78,077
1,207
1,374
13.9
to be a US$20bn in FY2020.
LICHF continues to grow its retail loan book at a healthy pace
with improvement in asset quality. We expect the company to
LIC Housing Finance
23,073
457
592
29.4
post a healthy loan book which is likely to reflect in a strong
earnings growth.
Huge bid pipeline of re-development works at Delhi and other
NBCC
11,790
983
1,089
10.8
State Governments and opportunity from Smart City, positions
NBCC to report strong growth, going forward.
Source: Company, Angel Research
Mid Cap
Market Cap
CMP
Target
Upside
Company
Rationale
(` Cr)
(`)
(`)
(%)
Favorable outlook for the AC industry to augur well for
Cooling products business which is out pacing the market
Blue Star
3,844
427
481
12.6
growth. EMPPAC division's profitability to improve once
operating environment turns around.
With a focus on the low and medium income (LMI) consumer
Dewan Housing
5,950
204
270
32.4
segment, the company has increased its presence in tier-II &
III cities where the growth opportunity is immense.
Commencement of new projects, downtrend in the interest
IL&FS Transport
2,393
73
93
27.8
rate cycle, to lead to stock re-rating
Economic recovery to have favourable impact on advertising
& circulation revenue growth. Further, the acquisition of a
Jagran Prakashan
5,657
173
205
18.5
radio business (Radio City) would also boost the company's
revenue growth.
Speedier execution and speedier sales, strong revenue visibilty
Mahindra Lifespace
1,882
459
554
20.8
in short-to-long run, attractive valuations
Massive capacity expansion along with rail advantage at ICD
Navkar Corporation
2,620
184
265
44.2
as well CFS augurs well for the company
Earnings boost on back of stable material prices and
Radico Khaitan
1,177
88
125
41.3
favourable pricing environment. Valuation discount to peers
provides additional comfort
Strong brands and distribution network would boost growth
Siyaram Silk Mills
1,022
1,091
1,354
24.1
going ahead. Stock currently trades at an inexpensive
valuation.
Source: Company, Angel Research
Market Outlook
May 16, 2016
Key Upcoming Events
Result Calendar
Date
Company
May 16, 2016
JK Tyre, Petronet LNG, Styrolution
May 17, 2016
Motherson Sumi, Bharat Forge, Syndicate Bank, United Bank, GlaxoSmith Con, MT Educare
May 18, 2016
J K Lakshmi Cements, Punjab Natl.Bank, Corporation Bank, JSW Steel , Kirloskar Engines India Ltd, PTC India
May 19, 2016
GSPL, Lupin, Dishman Pharma, CESC, Manpasand Bever.
May 20, 2016
Ramco Cements, ITC, Britannia, Siyaram Silk Mills, Sterling Tools, The Byke Hospitality, Coffee Day Enterprises Ltd
May 23, 2016
BPCL, Heritage Foods, Tata Power Co., VRL Logistics
May 24, 2016
Tata Global, Amara Raja Batteries, Colgate, Tech Mahindra, Page Industries
Bajaj Auto, Bosch India, Cummins India, Thermax, LMW, Hindustan Media Ventures, Tata Steel, GAIL, Abbott India,
May 25, 2016
GSK Pharma
Source: Bloomberg, Angel Research
Global economic events release calendar
Date
Time
Country
Event Description
Unit
Period
Bloomberg Data
Last Reported Estimated
May 16, 201611:00AM China
Industrial Production (YoY)
% Change
Apr
6.80
6.50
May 17, 201612:00PM India
Monthly Wholesale Prices YoY%
% Change
Apr
(0.85)
(0.23)
6:00PM US
Consumer price index (mom)
% Change
Apr
0.10
0.40
6:45PM US
Industrial Production
%
Apr
(0.59)
0.30
6:00PM US
Housing Starts
Thousands
Apr
1,089.00
1,125.00
6:00PM US
Building permits
Thousands
Apr
1,076.00
1,132.00
May 18, 2016 2:30PM Euro Zone
Euro-Zone CPI (YoY)
%
Apr F
(0.20)
(0.20)
2:00PM UK
Jobless claims change
% Change
Apr
6.70
4.00
May 19, 2016 6:00PM US
Initial Jobless claims
Thousands
May 14
294.00
275.00
May 20, 2016 7:30PM US
Existing home sales
Million
Apr
5.33
5.39
May 23, 2016 7:30PM Euro Zone
Euro-Zone Consumer Confidence
Value
May A
(9.30)
--
1:00PM Germany
PMI Manufacturing
Value
May P
51.80
--
1:00PM Germany
PMI Services
Value
May P
54.50
--
May 24, 2016 7:30PM US
New home sales
Thousands
Apr
511.00
--
May 26, 2016 2:00PM UK
GDP (YoY)
% Change
1Q P
2.10
--
May 27, 2016 6:00PM US
GDP Qoq (Annualised)
% Change
1Q S
0.50
--
May 31, 2016 1:25PM Germany
Unemployment change (000's)
Thousands
May
(16.00)
--
7:30PM US
Consumer Confidence
S.A./ 1985=100
May
94.20
--
Source: Bloomberg, Angel Research
Market Outlook
May 16, 2016
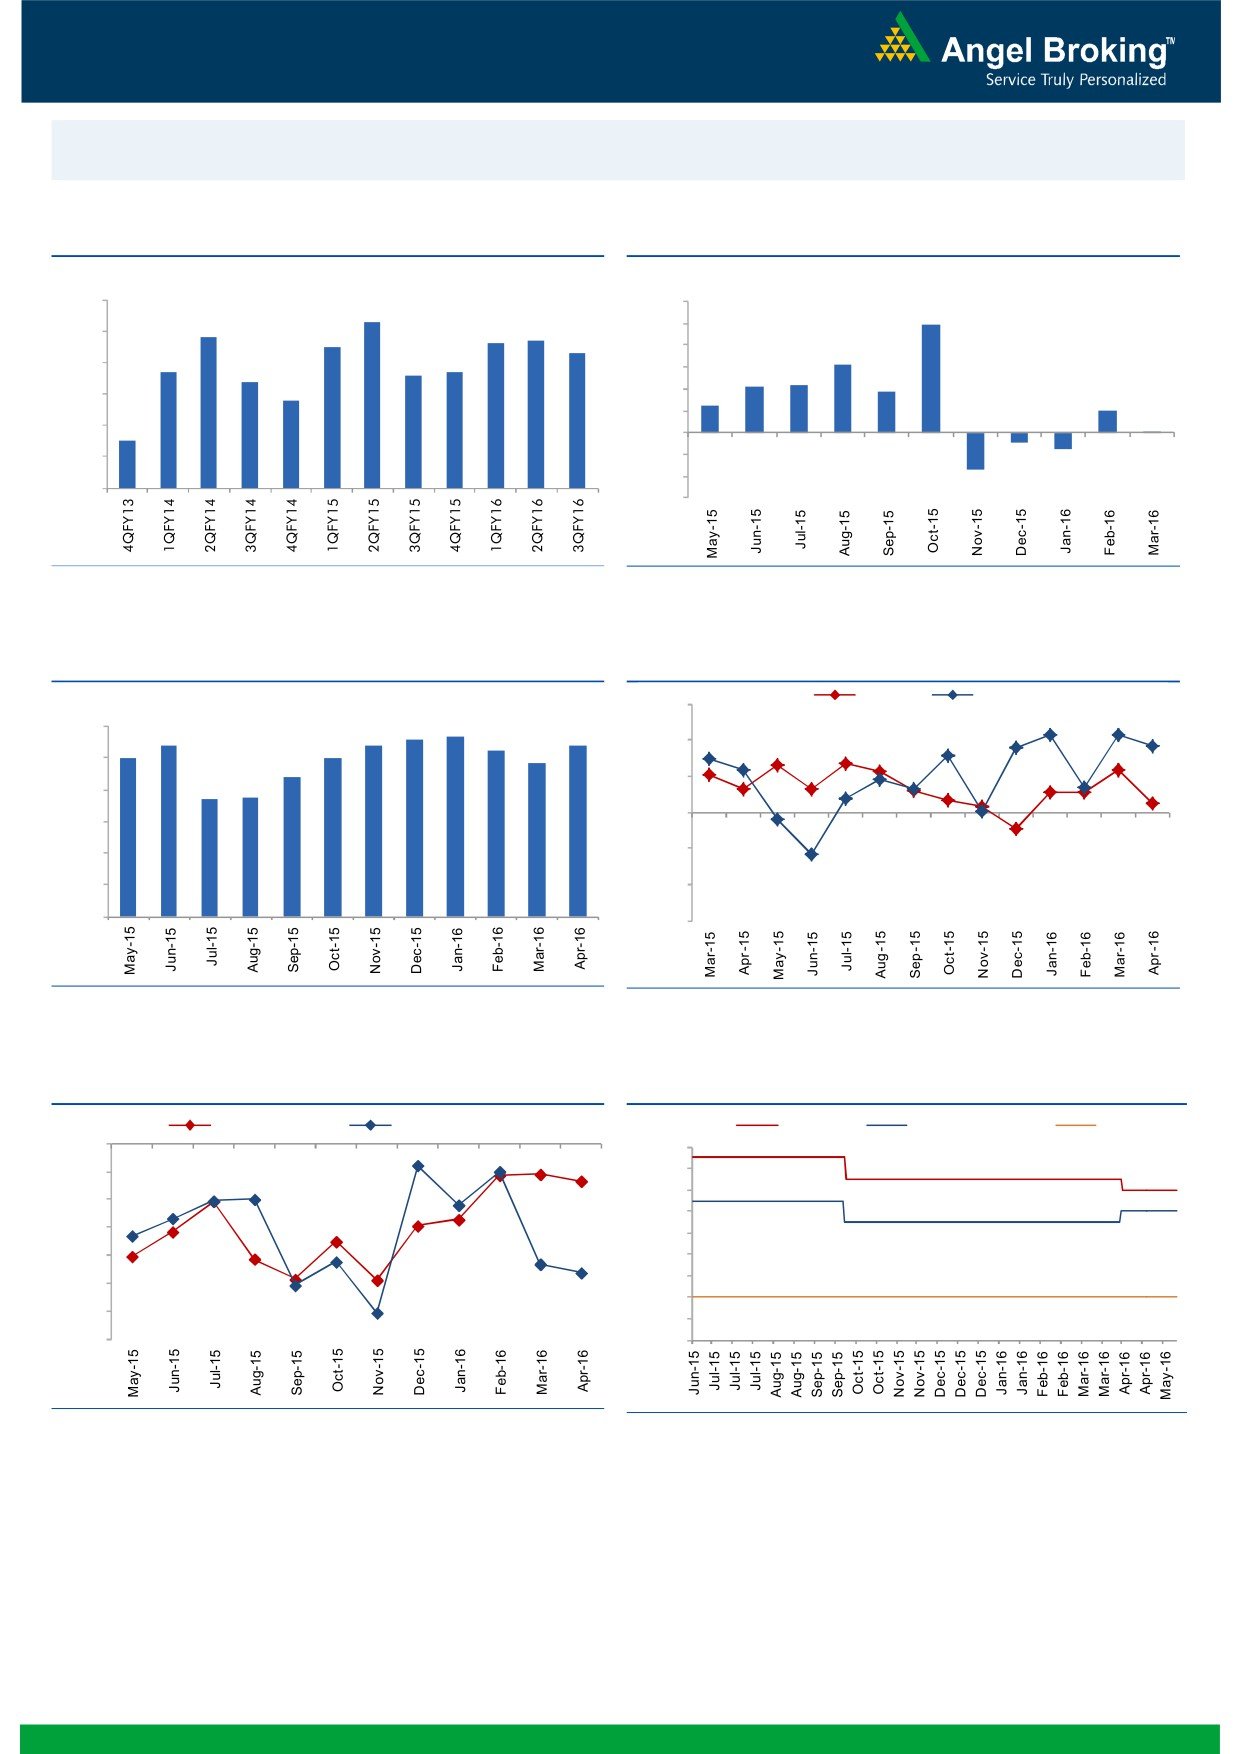
Macro watch
Exhibit 1: Quarterly GDP trends
Exhibit 2: IIP trends
(%)
(%)
9.0
8.3
12.0
9.9
7.8
7.7
8.0
7.5
7.6
10.0
7.3
8.0
6.3
6.7
6.6
6.7
7.0
6.4
6.0
4.2
4.3
3.7
5.8
4.0
2.5
6.0
2.0
2.0
0.1
5.0
4.5
-
4.0
(2.0)
(0.9)
(1.5)
(4.0)
3.0
(3.4)
(6.0)
Source: CSO, Angel Research
Source: MOSPI, Angel Research
Exhibit 3: Monthly CPI inflation trends
Exhibit 4: Manufacturing and services PMI
Mfg. PMI
Services PMI
(%)
56.0
5.6
5.7
6.0
5.4
5.4
5.4
5.3
5.0
5.0
54.0
4.8
5.0
4.4
52.0
3.7
3.7
4.0
50.0
3.0
48.0
2.0
1.0
46.0
-
44.0
Source: MOSPI, Angel Research
Source: Market, Angel Research; Note: Level above 50 indicates expansion
Exhibit 5: Exports and imports growth trends
Exhibit 6: Key policy rates
(%)
Exports yoy growth
Imports yoy growth
(%)
Repo rate
Reverse Repo rate
CRR
0.0
7.50
(5.0)
7.00
6.50
(10.0)
6.00
(15.0)
5.50
(20.0)
5.00
4.50
(25.0)
4.00
(30.0)
3.50
(35.0)
3.00
Source: Bloomberg, Angel Research
Source: RBI, Angel Research
Market Outlook
May 16, 2016
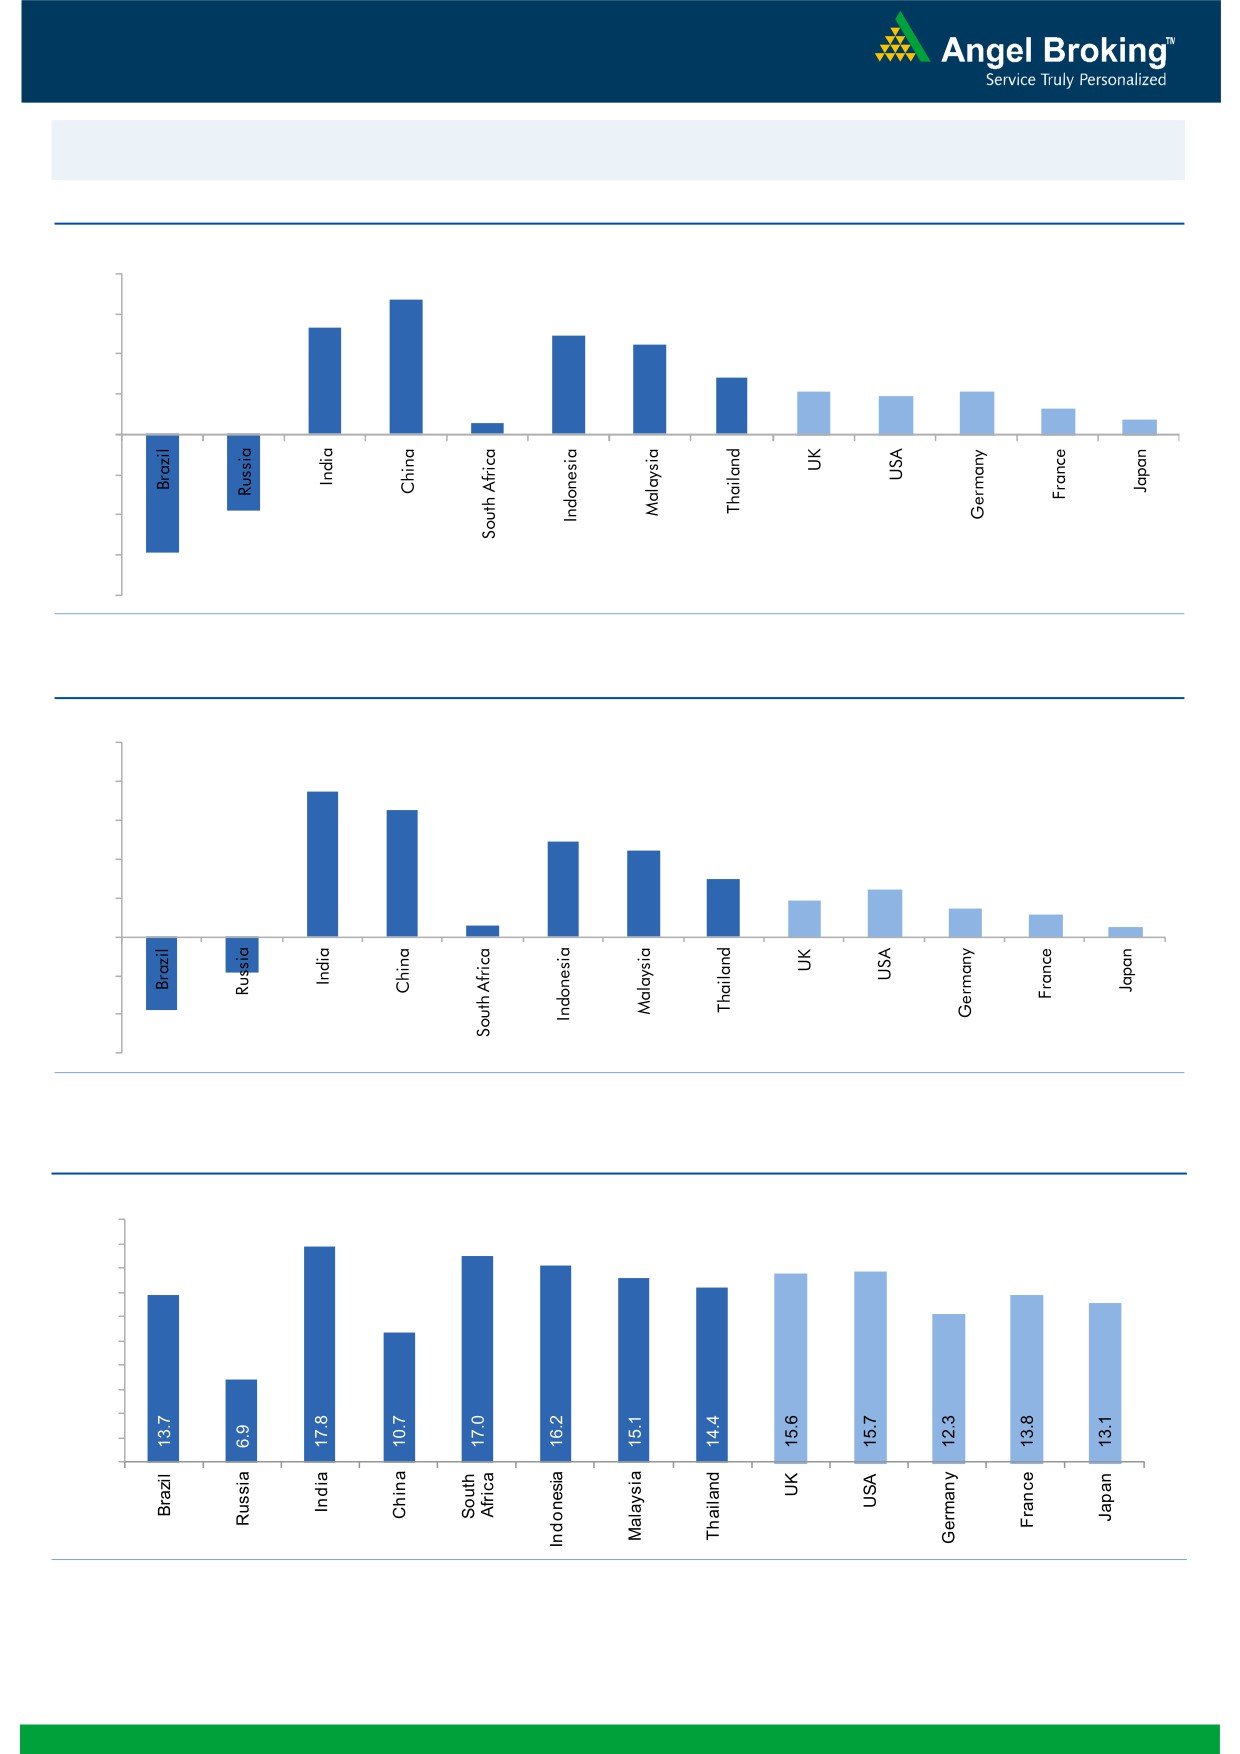
Global watch
Exhibit 1: Latest quarterly GDP Growth (%, yoy) across select developing and developed countries
(%)
8.0
6.7
6.0
5.3
4.9
4.5
4.0
2.8
2.1
1.9
2.1
1.3
2.0
0.6
0.7
-
(2.0)
(4.0)
(3.8)
(6.0)
(5.9)
(8.0)
Source: Bloomberg, Angel Research
Exhibit 2: 2016 GDP Growth projection by IMF (%, yoy) across select developing and developed countries
(%)
10.0
7.5
8.0
6.5
6.0
4.9
4.4
4.0
3.0
2.4
1.9
1.5
2.0
1.1
0.6
0.5
(3.8)
(1.8)
-
(2.0)
(4.0)
(6.0)
Source: IMF, Angel Research
Exhibit 3: One year forward P-E ratio across select developing and developed countries
(x)
20.0
18.0
16.0
14.0
12.0
10.0
8.0
6.0
4.0
2.0
-
Source: IMF, Angel Research
Market Outlook
May 16, 2016
Exhibit 4: Relative performance of indices across globe
Returns (%)
Country
Name of index
Closing price
1M
3M
1YR
Brazil
Bovespa
51,804
(0.4)
31.8
(9.0)
Russia
Micex
1,907
1.6
9.3
13.4
India
Nifty
7,815
3.4
4.4
(4.6)
China
Shanghai Composite
2,827
(8.2)
1.8
(31.6)
South Africa
Top 40
45,403
0.4
3.2
(5.4)
Mexico
Mexbol
45,402
(0.0)
6.7
0.2
Indonesia
LQ45
817
(2.8)
(2.0)
(8.1)
Malaysia
KLCI
1,628
(5.1)
(0.9)
(9.9)
Thailand
SET 50
886
(1.3)
8.5
(11.9)
USA
Dow Jones
17,535
(2.1)
12.0
(4.0)
UK
FTSE
6,139
(1.7)
8.2
(11.9)
Japan
Nikkei
16,412
4.2
(2.4)
(15.9)
Germany
DAX
9,953
(0.7)
13.7
(16.0)
France
CAC
4,320
(3.8)
10.9
(16.0)
Source: Bloomberg, Angel Research
Stock Watch
May 16, 2016
Company Name
Reco
CMP
Target
Mkt Cap
Sales ( Čcr )
OPM(%)
EPS (Č)
PER(x)
P/BV(x)
RoE(%)
EV/Sales(x)
(Č)
Price ( Č)
( Č cr )
FY16E FY17E
FY16E
FY17E
FY16E
FY17E
FY16E
FY17E
FY16E
FY17E
FY16E
FY17E
FY16E
FY17E
Agri / Agri Chemical
Rallis
Neutral
209
-
4,061
1,612
1,911
13.3
13.3
7.4
9.5
28.2
22.0
4.5
4.0
16.7
18.4
2.6
2.2
United Phosphorus
Accumulate
585
684
25,058
13,083
15,176
18.5
18.5
31.5
37.4
18.6
15.6
3.7
3.1
21.4
21.4
2.1
1.8
Auto & Auto Ancillary
Ashok Leyland
Accumulate
103
111
29,284
17,995
21,544
11.4
11.6
3.4
4.7
30.3
21.9
5.3
4.9
17.7
22.2
1.6
1.3
Bajaj Auto
Neutral
2,514
-
72,756
22,709
25,860
20.9
20.1
129.0
143.6
19.5
17.5
6.0
5.1
30.7
29.4
2.8
2.4
Bharat Forge
Accumulate
752
875
17,500
7,351
8,318
19.9
19.7
31.2
36.5
24.1
20.6
4.3
3.6
19.3
19.2
2.6
2.3
Eicher Motors
Neutral
18,993
-
51,587
15,556
16,747
15.5
17.3
464.8
597.5
40.9
31.8
14.9
11.0
36.2
34.3
3.4
3.1
Gabriel India
Accumulate
89
101
1,277
1,415
1,544
8.7
9.0
4.6
5.4
19.3
16.5
3.5
3.1
18.1
18.9
0.9
0.8
Hero Motocorp
Neutral
2,916
-
58,226
28,244
30,532
15.5
15.9
156.7
168.5
18.6
17.3
7.4
6.3
39.9
36.4
1.9
1.7
Jamna Auto Industries Accumulate
148
160
1,180
1,281
1,473
11.2
11.5
7.6
9.2
19.4
16.1
4.9
4.0
25.4
25.2
1.0
0.8
L G Balakrishnan & Bros Neutral
470
-
737
1,254
1,394
11.6
11.8
35.9
41.7
13.1
11.3
1.8
1.6
13.5
13.8
0.7
0.6
Mahindra and Mahindra Neutral
1,313
-
81,556
38,416
42,904
13.7
13.9
54.8
63.4
24.0
20.7
3.7
3.3
15.4
15.8
1.8
1.6
Maruti
Neutral
3,845
-
116,138
57,865
68,104
16.4
16.7
176.3
225.5
21.8
17.1
4.2
3.6
19.4
21.2
1.8
1.5
Minda Industries
Neutral
1,081
-
1,716
2,523
2,890
8.7
9.0
55.0
65.4
19.7
16.5
3.8
3.1
19.3
18.7
0.8
0.7
Motherson Sumi
Buy
263
313
34,788
39,343
45,100
8.8
9.1
10.1
12.5
26.0
21.0
8.2
6.5
35.3
34.4
1.0
0.9
Rane Brake Lining
Buy
378
465
299
454
511
11.5
12.0
25.2
31.0
15.0
12.2
2.2
2.0
14.9
16.6
0.8
0.7
Setco Automotive
Neutral
32
-
427
594
741
12.7
13.7
1.7
3.2
18.8
10.0
2.0
1.7
10.4
16.9
1.1
0.9
Tata Motors
Neutral
390
-
112,601
259,686
273,957
13.0
13.4
25.9
29.5
15.1
13.2
2.0
1.7
8.0
9.0
0.6
0.6
TVS Motor
Accumulate
297
330
14,093
11,263
13,122
6.9
8.5
9.2
15.0
32.2
19.8
7.4
5.9
22.7
29.6
1.2
1.0
Amara Raja Batteries
Accumulate
942
1,076
16,093
4,892
5,871
17.4
17.6
28.8
37.1
32.7
25.4
7.6
6.1
23.4
24.1
3.3
2.7
Exide Industries
Accumulate
146
162
12,448
6,950
7,784
14.4
14.8
6.6
7.3
22.2
20.1
2.8
2.6
12.6
12.8
1.5
1.4
Apollo Tyres
Buy
160
183
8,134
12,056
12,714
17.2
16.4
23.0
20.3
7.0
7.9
1.2
1.1
17.7
13.6
0.7
0.7
Ceat
Accumulate
1,014
1,119
4,103
6,041
6,597
14.1
13.7
99.5
111.9
10.2
9.1
2.0
1.7
19.6
18.5
0.8
0.7
JK Tyres
Neutral
83
-
1,877
7,446
7,669
15.2
14.0
19.6
18.4
4.2
4.5
1.1
0.9
25.2
19.5
0.7
0.6
Swaraj Engines
Neutral
1,100
-
1,366
552
630
14.2
14.7
44.6
54.1
24.7
20.3
5.7
5.2
23.2
25.6
2.3
2.0
Subros
Neutral
89
-
532
1,293
1,527
11.8
11.9
4.2
6.7
21.1
13.2
1.6
1.5
7.7
11.5
0.7
0.6
Indag Rubber
Neutral
176
-
463
283
329
17.0
17.2
13.0
15.4
13.6
11.4
3.0
2.5
21.8
21.6
1.4
1.2
Capital Goods
ACE
Neutral
42
-
416
660
839
4.7
8.2
1.0
3.9
42.1
10.8
1.3
1.2
3.2
11.3
0.8
0.6
BEML
Buy
900
1,157
3,747
3,277
4,006
6.0
8.9
36.2
64.3
24.9
14.0
1.7
1.6
5.7
11.7
1.3
1.0
Bharat Electronics
Buy
1,149
1,414
27,574
7,737
8,634
16.8
17.2
54.0
61.5
21.3
18.7
3.0
2.7
39.3
45.6
2.7
2.3
Stock Watch
May 16, 2016
Company Name
Reco
CMP
Target
Mkt Cap
Sales ( Čcr )
OPM(%)
EPS (Č)
PER(x)
P/BV(x)
RoE(%)
EV/Sales(x)
(Č)
Price ( Č)
( Č cr )
FY16E
FY17E
FY16E
FY17E
FY16E
FY17E
FY16E
FY17E
FY16E
FY17E
FY16E
FY17E
FY16E
FY17E
Capital Goods
Voltas
Accumulate
324
353
10,724
5,363
5,963
8.0
9.1
11.0
13.8
29.5
23.5
4.5
4.0
16.2
17.9
2.0
1.7
BGR Energy
Neutral
110
-
792
3,615
3,181
9.5
9.4
16.7
12.4
6.6
8.9
0.6
0.6
10.0
7.0
0.6
0.8
BHEL
Neutral
123
-
30,032
33,722
35,272
10.8
11.7
10.5
14.2
11.7
8.6
0.9
0.8
7.0
9.0
1.0
0.9
Blue Star
Accumulate
427
481
3,844
3,548
3,977
6.3
6.9
13.7
17.2
31.2
24.9
7.9
5.1
26.1
25.4
1.2
1.0
Crompton Greaves
Neutral
62
-
3,883
13,484
14,687
4.9
6.2
4.5
7.1
13.8
8.7
1.0
0.9
7.2
10.8
0.4
0.4
Greaves Cotton
Neutral
144
-
3,512
1,655
1,755
16.6
16.8
7.4
7.8
19.4
18.4
3.9
3.7
21.1
20.6
2.1
2.0
Inox Wind
Buy
240
286
5,324
4,406
5,605
15.5
15.7
20.4
24.8
11.8
9.7
2.7
2.0
27.9
25.9
1.4
1.1
KEC International
Neutral
131
-
3,356
8,791
9,716
6.1
6.8
5.4
8.2
24.2
15.9
2.4
2.2
10.0
14.0
0.6
0.6
Thermax
Neutral
752
-
8,965
6,413
7,525
7.4
8.5
30.5
39.3
24.7
19.1
3.8
3.3
15.0
17.0
1.4
1.1
VATech Wabag
Neutral
584
-
3,185
2,722
3,336
7.9
8.1
19.5
24.6
30.0
23.8
3.1
2.8
11.1
12.4
1.3
1.0
Cement
ACC
Neutral
1,453
-
27,275
13,151
14,757
16.4
18.3
63.9
83.4
22.7
17.4
2.9
2.7
13.3
16.1
1.9
1.6
Ambuja Cements
Neutral
217
-
33,668
11,564
12,556
19.4
20.7
8.9
10.1
24.4
21.5
3.1
2.9
12.8
13.8
2.6
2.4
HeidelbergCement
Neutral
98
-
2,212
1,772
1,926
13.3
15.4
1.0
3.0
97.6
32.5
2.5
2.3
2.6
7.9
1.8
1.6
India Cements
Neutral
90
-
2,757
4,216
4,840
18.0
19.5
4.0
9.9
22.4
9.1
0.9
0.8
4.0
9.5
1.0
0.8
JK Cement
Neutral
585
-
4,094
3,661
4,742
10.1
15.8
7.5
28.5
78.1
20.5
2.4
2.1
7.5
22.9
1.6
1.2
J K Lakshmi Cement
Neutral
342
-
4,025
2,947
3,616
16.7
19.9
11.5
27.2
29.8
12.6
2.8
2.4
9.8
20.8
1.8
1.4
Mangalam Cements
Neutral
258
-
689
1,053
1,347
10.5
13.3
8.4
26.0
30.7
9.9
1.3
1.2
4.3
12.5
1.0
0.8
Orient Cement
Neutral
158
-
3,236
1,854
2,524
21.2
22.2
7.7
11.1
20.5
14.2
3.0
2.5
13.3
15.7
2.5
1.7
Ramco Cements
Neutral
488
-
11,621
4,036
4,545
20.8
21.3
15.1
18.8
32.3
26.0
4.0
3.5
12.9
14.3
3.4
2.9
Shree Cement^
Neutral
13,662
-
47,593
7,150
8,742
26.7
28.6
228.0
345.5
59.9
39.5
8.8
7.4
15.7
20.3
6.3
5.1
UltraTech Cement
Neutral
3,153
-
86,519
24,669
29,265
18.2
20.6
82.0
120.0
38.5
26.3
4.1
3.6
11.3
14.7
3.6
3.1
Construction
ITNL
Buy
73
93
2,393
7,360
8,825
34.0
35.9
7.0
9.0
10.4
8.1
0.4
0.3
3.2
3.7
3.7
3.6
KNR Constructions
Buy
526
603
1,480
937
1,470
14.3
14.0
44.2
38.6
11.9
13.6
2.4
2.1
15.4
15.4
1.6
1.1
Larsen & Toubro
Neutral
1,287
-
119,941
58,870
65,708
8.3
10.3
42.0
53.0
30.7
24.3
2.1
1.9
8.8
11.2
2.3
2.1
Gujarat Pipavav Port
Neutral
161
-
7,781
629
684
51.0
52.2
6.4
5.9
25.2
27.3
3.3
3.0
15.9
12.7
11.9
10.8
MBL Infrastructures
Buy
126
285
522
2,313
2,797
12.2
14.6
19.0
20.0
6.6
6.3
0.7
0.6
11.3
10.6
0.9
0.8
Nagarjuna Const.
Neutral
76
-
4,208
7,892
8,842
8.8
9.1
3.0
5.3
25.2
14.3
1.3
1.2
5.0
8.5
0.8
0.7
PNC Infratech
Neutral
544
-
2,790
1,873
2,288
13.2
13.5
24.0
32.0
22.7
17.0
2.2
2.0
12.1
12.3
1.6
1.3
Simplex Infra
Neutral
271
-
1,342
5,955
6,829
10.3
10.5
16.0
31.0
17.0
8.8
0.9
0.8
5.3
9.9
0.7
0.6
Stock Watch
May 16, 2016
Company Name
Reco
CMP
Target
Mkt Cap
Sales ( Čcr )
OPM(%)
EPS (Č)
PER(x)
P/BV(x)
RoE(%)
EV/Sales(x)
(Č)
Price ( Č)
( Č cr )
FY16E
FY17E
FY16E
FY17E
FY16E
FY17E
FY16E
FY17E
FY16E
FY17E
FY16E
FY17E
FY16E
FY17E
Construction
Power Mech Projects
Neutral
599
-
881
1,539
1,801
12.8
12.7
59.0
72.1
10.2
8.3
1.5
1.3
18.6
16.8
0.6
0.5
Sadbhav Engineering
Accumulate
276
298
4,727
3,186
3,598
10.2
10.3
8.0
9.0
34.4
30.6
3.2
2.8
9.4
9.9
1.8
1.6
NBCC
Accumulate
983
1,089
11,790
5,816
7,382
6.9
7.7
29.6
39.8
33.2
24.7
6.0
4.7
24.1
26.7
1.8
1.3
MEP Infra
Neutral
40
-
654
1,956
1,876
28.1
30.5
1.3
3.0
30.9
13.4
6.5
4.4
21.2
32.8
1.8
1.7
SIPL
Neutral
100
-
3,520
675
1,042
62.4
64.7
-
-
3.7
4.3
-
-
16.8
11.4
Engineers India
Neutral
179
-
6,019
1,667
1,725
13.5
16.0
9.7
11.4
18.4
15.7
2.2
2.1
11.7
13.4
2.6
2.6
Financials
Allahabad Bank
Neutral
53
-
3,222
8,569
9,392
2.8
2.9
16.3
27.5
3.2
1.9
0.3
0.2
7.6
11.9
-
-
Axis Bank
Neutral
491
-
117,042
26,204
29,738
3.6
3.5
34.5
35.4
14.2
13.9
2.2
2.0
16.8
14.9
-
-
Bank of Baroda
Neutral
155
-
35,703
18,802
21,088
2.0
2.2
(7.4)
13.0
11.9
1.2
1.0
(4.2)
7.3
-
-
Bank of India
Neutral
86
-
6,998
15,972
17,271
1.9
2.0
15.3
33.4
5.6
2.6
0.3
0.2
3.6
7.6
-
-
Canara Bank
Neutral
187
-
10,127
15,441
16,945
2.0
2.1
46.6
70.4
4.0
2.7
0.4
0.3
8.0
11.2
-
-
Dena Bank
Neutral
31
-
2,047
3,440
3,840
2.1
2.3
7.3
10.0
4.2
3.1
0.3
0.3
6.1
7.9
-
-
Dewan Housing Finance Buy
204
270
5,950
1,828
2,225
2.9
3.0
24.9
29.7
8.2
6.9
1.3
1.1
15.1
16.1
-
-
Federal Bank
Neutral
50
-
8,590
3,279
3,787
2.8
2.9
3.9
5.5
12.7
9.0
1.0
1.0
8.4
10.8
-
-
HDFC
Neutral
1,166
-
184,217
10,358
11,852
3.3
3.3
41.1
47.0
28.4
24.8
5.4
4.9
24.7
24.9
-
-
HDFC Bank
Accumulate
1,140
1,262
288,371
38,606
47,696
4.4
4.5
48.8
61.4
23.4
18.6
4.0
3.5
18.7
20.0
-
-
ICICI Bank
Neutral
227
-
131,751
34,279
39,262
3.3
3.3
21.0
24.4
10.8
9.3
1.8
1.5
14.4
14.7
-
-
IDBI Bank
Neutral
66
-
13,496
9,625
10,455
1.8
1.8
8.5
14.2
7.7
4.6
0.5
0.4
5.9
9.3
-
-
Indian Bank
Neutral
91
-
4,380
6,160
6,858
2.5
2.5
24.5
29.8
3.7
3.1
0.3
0.3
7.7
8.6
-
-
LIC Housing Finance
Buy
457
592
23,073
3,179
3,758
2.6
2.6
32.9
40.6
13.9
11.3
2.6
2.2
19.6
20.7
-
-
Oriental Bank
Neutral
83
-
2,668
7,643
8,373
2.4
2.4
37.2
45.4
2.2
1.8
0.2
0.2
8.2
9.4
-
-
Punjab Natl.Bank
Neutral
78
-
15,228
23,122
26,022
2.8
2.8
7.0
21.6
11.1
3.6
0.6
0.5
3.4
10.0
-
-
South Ind.Bank
Neutral
19
-
2,518
1,965
2,185
2.5
2.5
2.5
3.3
7.5
5.6
0.7
0.7
9.5
11.7
-
-
St Bk of India
Neutral
185
-
143,611
79,958
86,061
2.6
2.6
13.4
20.7
13.8
9.0
1.1
1.1
11.5
12.8
-
-
Union Bank
Neutral
116
-
7,971
12,646
14,129
2.3
2.4
31.0
39.1
3.7
3.0
0.4
0.3
9.8
11.4
-
-
Vijaya Bank
Neutral
31
-
2,919
3,536
3,827
1.9
1.9
5.5
6.7
5.7
4.7
0.5
0.4
7.8
8.8
-
-
Yes Bank
Neutral
949
-
39,940
7,190
9,011
3.2
3.3
58.2
69.7
16.3
13.6
2.9
2.5
19.2
19.6
-
-
FMCG
Asian Paints
Neutral
943
-
90,404
16,553
19,160
16.0
16.2
17.7
21.5
53.3
43.8
14.2
12.7
29.4
31.2
5.2
4.5
Britannia
Neutral
2,949
-
35,386
8,481
9,795
14.0
14.1
65.5
78.3
45.0
37.7
21.3
17.5
38.3
41.2
4.1
3.5
Stock Watch
May 16, 2016
Company Name
Reco
CMP
Target
Mkt Cap
Sales ( Čcr )
OPM(%)
EPS (Č)
PER(x)
P/BV(x)
RoE(%)
EV/Sales(x)
(Č)
Price ( Č)
( Č cr )
FY16E FY17E
FY16E
FY17E
FY16E
FY17E
FY16E
FY17E
FY16E
FY17E
FY16E
FY17E
FY16E
FY17E
FMCG
Colgate
Neutral
836
-
22,745
4,136
4,632
22.5
23.3
22.2
25.3
37.7
33.1
22.9
20.4
68.6
67.5
5.4
4.8
Dabur India
Neutral
290
-
50,936
9,370
10,265
17.6
17.3
7.3
8.1
39.5
35.8
10.2
9.4
31.7
30.6
5.3
4.8
GlaxoSmith Con*
Neutral
6,006
-
25,259
4,519
5,142
19.6
19.8
164.3
191.2
36.6
31.4
10.1
8.6
30.8
29.9
5.1
4.4
Godrej Consumer
Neutral
1,395
-
47,508
9,003
10,335
18.1
18.7
34.1
41.8
40.9
33.4
8.8
7.6
23.9
24.8
5.6
4.9
HUL
Neutral
831
-
179,845
33,299
35,497
17.1
17.1
18.9
20.0
44.0
41.6
22.3
25.6
87.6
80.8
5.4
5.0
ITC
Accumulate
319
359
256,947
36,804
38,776
37.9
37.9
12.2
12.9
26.2
24.8
7.3
6.4
27.7
25.8
6.5
6.2
Marico
Neutral
254
-
32,803
6,151
6,966
17.2
17.3
5.4
6.4
47.1
39.7
14.8
11.7
33.2
32.4
5.2
4.6
Nestle*
Neutral
6,129
-
59,088
9,393
10,507
22.2
22.3
106.8
121.8
57.4
50.3
20.2
18.1
34.8
36.7
5.7
5.0
Tata Global
Buy
120
137
7,545
8,635
9,072
9.8
9.9
5.8
7.2
20.6
16.6
1.8
1.8
6.8
7.4
0.9
0.9
Procter & Gamble
Accumulate
6,521
7,369
21,168
2,588
2,939
23.3
23.2
130.2
146.2
50.1
44.6
99.9
95.8
27.6
25.3
7.7
6.7
Hygiene
IT
HCL Tech^
Buy
722
1,038
101,878
42,038
47,503
21.2
21.5
51.5
57.7
14.0
12.5
3.0
2.3
21.5
18.8
2.0
1.6
Infosys
Accumulate
1,207
1,374
278,077
62,441
70,558
27.5
27.5
59.0
65.3
20.5
18.5
4.1
3.7
22.2
22.4
3.9
3.4
TCS
Buy
2,523
3,004
497,218
108,646
122,770
28.3
28.3
123.7
141.0
20.4
17.9
6.8
6.2
33.1
34.6
4.2
3.6
Tech Mahindra
Accumulate
478
530
46,424
26,524
29,177
16.2
17.0
28.8
33.6
16.6
14.2
3.2
2.7
19.3
19.1
1.5
1.3
Wipro
Buy
540
680
133,320
50,808
56,189
23.7
23.8
37.3
40.7
14.5
13.3
2.8
2.5
19.2
17.7
2.1
1.7
Media
D B Corp
Accumulate
329
356
6,050
2,025
2,187
27.4
27.4
17.4
18.9
18.9
17.5
4.3
3.9
22.9
23.7
3.0
2.7
HT Media
Neutral
88
-
2,056
2,495
2,673
12.9
13.2
6.8
7.2
13.0
12.3
1.0
1.0
7.5
7.8
0.4
0.3
Jagran Prakashan
Buy
173
205
5,657
2,170
2,355
27.2
26.2
8.9
9.9
19.4
17.5
4.1
3.6
20.9
20.5
2.5
2.3
Sun TV Network
Neutral
391
-
15,407
2,510
2,763
71.8
71.5
21.9
24.8
17.9
15.8
4.2
3.8
22.8
24.3
5.4
4.9
Hindustan Media
Neutral
278
-
2,039
914
1,016
21.7
21.5
21.9
23.3
12.7
12.0
2.3
1.9
18.0
16.2
1.6
1.4
Ventures
Metals & Mining
Coal India
Buy
282
380
177,806
76,167
84,130
19.9
22.3
22.4
25.8
12.6
10.9
4.5
4.4
35.5
41.0
1.7
1.5
Hind. Zinc
Neutral
166
-
70,056
14,641
14,026
50.4
50.4
17.7
16.0
9.4
10.4
1.4
1.3
16.2
13.2
2.5
2.3
Hindalco
Neutral
89
-
18,440
104,356
111,186
8.7
9.5
6.7
11.1
13.3
8.1
0.5
0.5
3.5
5.9
0.7
0.6
JSW Steel
Neutral
1,269
-
30,672
42,308
45,147
16.4
20.7
(10.3)
49.5
25.6
1.4
1.4
(1.0)
5.6
1.8
1.7
NMDC
Neutral
89
-
35,345
8,237
10,893
46.6
44.5
10.0
11.7
9.0
7.6
1.0
0.9
12.5
13.0
4.2
3.2
SAIL
Neutral
42
-
17,202
45,915
53,954
7.2
10.5
1.5
4.4
27.7
9.5
0.4
0.4
2.3
4.1
1.0
0.9
Vedanta
Neutral
98
-
29,054
71,445
81,910
26.2
26.3
12.9
19.2
7.6
5.1
0.5
0.5
7.2
8.9
0.9
0.7
Tata Steel
Neutral
323
-
31,370
126,760
137,307
8.9
11.3
6.4
23.1
50.8
14.0
1.0
1.0
2.0
7.1
0.8
0.8
Oil & Gas
Cairn India
Neutral
135
-
25,329
11,323
12,490
49.4
51.0
20.7
20.7
6.5
6.5
0.4
0.4
6.4
6.1
1.3
0.7
Stock Watch
May 16, 2016
Company Name
Reco
CMP
Target
Mkt Cap
Sales ( Čcr )
OPM(%)
EPS (Č)
PER(x)
P/BV(x)
RoE(%)
EV/Sales(x)
(Č)
Price ( Č)
( Č cr )
FY16E FY17E
FY16E
FY17E
FY16E
FY17E
FY16E
FY17E
FY16E
FY17E
FY16E
FY17E
FY16E
FY17E
Oil & Gas
GAIL
Neutral
379
-
48,132
64,856
70,933
9.1
9.6
24.0
28.9
15.8
13.1
1.4
1.3
8.8
9.6
0.9
0.8
ONGC
Neutral
204
-
174,660
154,564
145,998
36.8
37.4
20.8
22.6
9.8
9.0
0.9
0.9
10.1
9.7
1.4
1.5
Petronet LNG
Neutral
279
-
20,895
29,691
31,188
5.8
6.2
12.8
13.4
21.8
20.8
3.3
2.9
15.8
14.8
0.8
0.7
Indian Oil Corp
Accumulate
414
455
100,614
359,607
402,760
5.9
6.1
42.5
48.7
9.8
8.5
1.3
1.2
14.1
14.4
0.4
0.3
Reliance Industries
Buy
978
1,150
316,998
304,775
344,392
12.6
13.4
91.3
102.6
10.7
9.5
1.2
1.1
11.8
12.0
1.0
0.8
Pharmaceuticals
Alembic Pharma
Neutral
582
-
10,968
3,274
3,802
26.9
19.4
35.0
28.7
16.6
20.3
7.4
5.6
55.6
31.2
3.3
2.8
Aurobindo Pharma
Accumulate
786
856
45,997
14,923
17,162
22.0
23.0
35.7
42.8
22.0
18.4
6.5
4.9
34.0
30.2
3.5
3.0
Aventis*
Accumulate
4,300
4,738
9,904
2,049
2,375
15.4
17.3
115.4
153.5
37.3
28.0
6.1
4.8
19.3
25.8
4.6
3.9
Cadila Healthcare
Accumulate
327
352
33,471
10,224
11,840
21.0
22.0
14.6
17.6
22.4
18.6
6.1
4.8
30.8
29.0
3.4
2.9
Cipla
Accumulate
531
605
42,680
13,979
16,447
20.2
18.6
25.7
27.5
20.7
19.3
3.4
2.9
17.6
16.1
3.1
2.5
Dr Reddy's
Buy
2,912
3,933
49,663
16,838
19,575
25.0
23.1
167.5
178.8
17.4
16.3
3.7
3.1
23.1
20.4
2.9
2.5
Dishman Pharma
Neutral
162
-
2,610
1,733
1,906
21.5
21.5
10.1
10.0
16.0
16.2
1.9
1.7
10.5
11.2
2.1
1.8
GSK Pharma*
Neutral
3,407
-
28,859
2,870
3,158
20.0
22.1
59.5
68.3
57.3
49.9
16.9
17.4
28.5
34.3
9.7
8.9
Indoco Remedies
Neutral
261
-
2,402
1,033
1,199
15.9
18.2
9.4
13.6
27.7
19.2
4.1
3.5
15.7
19.7
2.4
2.1
Ipca labs
Buy
468
750
5,907
3,363
3,909
12.9
18.6
13.4
28.0
34.9
16.7
2.5
2.2
7.4
14.0
2.1
1.8
Lupin
Neutral
1,588
-
71,568
13,092
16,561
25.0
27.0
50.4
68.3
31.5
23.3
6.5
5.1
22.8
24.7
5.3
4.0
Sun Pharma
Buy
795
950
191,332
28,163
32,610
25.8
30.7
17.4
26.9
45.7
29.6
4.3
3.8
13.0
16.6
6.3
5.3
Power
Tata Power
Neutral
70
-
19,027
35,923
37,402
22.6
22.8
4.1
5.2
17.4
13.7
1.3
1.2
7.5
9.3
1.5
1.4
NTPC
Neutral
141
-
116,302
87,271
99,297
23.5
23.5
11.8
13.3
12.0
10.6
1.3
1.3
11.5
12.2
2.4
2.1
Power Grid
Buy
145
170
75,596
20,702
23,361
86.7
86.4
12.1
13.2
12.0
10.9
1.8
1.6
15.6
15.1
8.6
8.0
Real Estate
MLIFE
Buy
459
554
1,882
826
1,133
20.1
21.8
22.6
30.7
20.3
14.9
1.2
1.1
6.0
7.4
4.2
2.9
Telecom
Bharti Airtel
Neutral
355
-
141,888
101,748
109,191
32.1
31.7
12.0
12.5
29.6
28.4
2.0
1.9
6.9
6.7
2.1
1.9
Idea Cellular
Neutral
113
-
40,686
34,282
36,941
32.0
31.5
5.9
6.2
19.2
18.2
1.8
1.6
9.9
9.3
1.8
1.7
zOthers
Abbott India
Neutral
4,662
-
9,907
2,715
3,153
14.5
14.1
134.3
152.2
34.7
30.6
8.7
7.1
27.4
25.6
3.4
2.9
Bajaj Electricals
Neutral
232
-
2,340
4,719
5,287
5.2
5.8
8.6
12.7
27.1
18.3
3.1
2.7
11.4
14.8
0.5
0.4
Finolex Cables
Neutral
286
-
4,373
2,520
2,883
12.2
12.0
12.7
14.2
22.6
20.1
3.1
2.7
13.6
13.5
1.5
1.3
Goodyear India*
Accumulate
507
582
1,168
1,800
1,600
11.7
11.5
58.7
52.9
8.6
9.6
1.9
1.7
24.6
18.7
0.4
0.4
Hitachi
Neutral
1,380
-
3,752
1,779
2,081
7.8
8.8
21.8
33.4
63.3
41.3
10.2
8.3
17.4
22.1
2.2
1.9
Jyothy Laboratories
Neutral
320
-
5,797
1,620
1,847
11.5
11.5
7.3
8.5
43.9
37.8
5.7
5.3
13.3
14.4
3.4
2.9
Stock Watch
May 16, 2016
Company Name
Reco
CMP
Target
Mkt Cap
Sales ( Čcr )
OPM(%)
EPS (Č)
PER(x)
P/BV(x)
RoE(%)
EV/Sales(x)
(Č)
Price ( Č)
( Č cr )
FY16E
FY17E
FY16E
FY17E
FY16E
FY17E
FY16E
FY17E
FY16E
FY17E
FY16E
FY17E
FY16E
FY17E
zOthers
MRF
Buy
32,938
45,575
13,969
20,316
14,488
21.4
21.1
5,488.0
3,798.0
6.0
8.7
2.1
1.7
41.1
21.2
0.6
0.9
Page Industries
Neutral
12,913
-
14,403
1,929
2,450
19.8
20.1
229.9
299.0
56.2
43.2
24.8
17.2
52.1
47.1
7.5
5.9
Relaxo Footwears
Neutral
512
-
6,150
1,767
2,152
12.3
12.5
19.3
25.1
26.6
20.4
6.5
5.0
27.7
27.8
3.5
2.9
Siyaram Silk Mills
Buy
1,091
1,354
1,022
1,636
1,815
11.5
11.5
89.9
104.1
12.1
10.5
2.0
1.7
17.9
17.8
0.8
0.7
Styrolution ABS India* Neutral
626
-
1,101
1,271
1,440
8.6
9.2
32.0
41.1
19.6
15.3
2.0
1.8
10.7
12.4
0.8
0.7
TVS Srichakra
Buy
2,518
3,217
1,928
2,035
2,252
15.9
15.3
248.6
268.1
10.1
9.4
4.4
3.2
43.6
33.9
1.0
0.8
HSIL
Neutral
309
-
2,234
2,123
2,384
16.1
16.5
15.0
18.9
20.5
16.4
1.6
1.5
8.0
9.4
1.4
1.2
Kirloskar Engines India
Neutral
235
-
3,403
2,403
2,554
8.6
9.9
9.2
10.5
25.6
22.4
2.5
2.3
9.7
10.7
1.1
1.0
Ltd
M M Forgings
Buy
454
546
548
511
615
21.7
21.6
43.1
55.8
10.5
8.1
1.9
1.6
19.9
21.2
1.3
1.0
Banco Products (India) Neutral
130
-
927
1,208
1,353
11.0
12.3
10.8
14.5
12.0
9.0
1.4
1.2
11.9
14.5
0.7
0.6
Competent Automobiles Neutral
150
-
92
1,040
1,137
3.2
3.1
25.7
28.0
5.8
5.4
0.9
0.8
15.0
14.3
0.1
0.1
Nilkamal
Neutral
1,248
-
1,863
1,871
2,031
10.7
10.5
63.2
69.8
19.8
17.9
3.2
2.8
17.6
16.6
1.1
0.9
Visaka Industries
Accumulate
128
143
204
1,020
1,120
8.7
9.1
13.9
20.1
9.2
6.4
0.6
0.6
6.4
8.7
0.4
0.4
Transport Corporation of
Neutral
260
-
1,980
2,830
3,350
8.8
9.0
14.4
18.3
18.1
14.2
2.8
2.4
15.4
17.1
0.8
0.7
India
Elecon Engineering
Neutral
62
-
676
1,359
1,482
10.3
13.7
0.8
3.9
77.3
16.0
1.3
1.2
1.6
7.8
0.9
0.8
Surya Roshni
Buy
149
201
651
2,992
3,223
8.1
8.4
14.7
18.3
10.1
8.1
0.9
0.9
9.7
11.0
0.5
0.5
MT Educare
Neutral
192
-
763
286
366
18.3
17.7
7.7
9.4
24.8
20.4
5.2
4.6
20.2
21.1
2.5
1.9
Radico Khaitan
Buy
88
125
1,177
1,543
1,659
12.6
13.0
5.8
6.3
15.3
14.0
1.3
1.2
8.5
8.6
1.3
1.2
Garware Wall Ropes
Buy
354
473
774
862
974
11.2
11.2
24.9
29.6
14.2
12.0
2.1
1.8
15.1
15.4
0.9
0.8
Wonderla Holidays
Neutral
379
-
2,144
206
308
44.0
43.6
9.0
12.9
42.2
29.4
5.8
5.2
13.7
17.8
10.3
6.9
Linc Pen & Plastics
Neutral
192
-
284
340
371
8.3
8.9
10.8
13.2
17.8
14.5
2.8
2.5
16.0
17.1
0.9
0.8
The Byke Hospitality
Neutral
153
-
612
222
287
20.5
20.5
5.6
7.6
27.1
20.2
5.1
4.2
18.9
20.8
2.9
2.2
Interglobe Aviation
Neutral
1,043
-
37,571
17,022
21,122
20.7
14.5
63.9
53.7
16.3
19.4
24.5
20.0
149.9
103.2
2.2
1.8
Coffee Day Enterprises
Neutral
267
-
5,496
2,692
2,964
17.0
18.6
-
4.7
-
56.3
3.3
3.1
0.2
5.5
2.4
2.2
Ltd
Navneet Education
Neutral
89
-
2,109
998
1,062
24.1
24.0
5.8
6.1
15.4
14.5
3.4
3.0
22.0
20.6
2.2
2.1
Navkar Corporation
Buy
184
265
2,620
365
436
38.3
37.5
5.6
5.9
32.6
31.3
2.0
1.9
6.3
6.1
7.7
6.6
UFO Moviez
Neutral
523
-
1,443
558
619
32.0
33.2
22.5
30.0
23.2
17.4
2.8
2.4
12.0
13.8
2.5
2.1
VRL Logistics
Neutral
393
-
3,583
1,725
1,902
16.5
16.7
12.2
14.6
32.3
27.0
6.7
5.9
20.8
21.9
2.3
2.0
Team Lease Serv.
Neutral
873
-
1,492
2,565
3,229
1.3
1.5
15.2
22.8
57.5
38.3
4.6
4.1
8.0
10.7
0.5
0.4
Stock Watch
May 16, 2016
Company Name
Reco
CMP
Target Mkt Cap
Sales ( Čcr )
OPM(%)
EPS (Č)
PER(x)
P/BV(x)
RoE(%)
EV/Sales(x)
(Č)
Price ( Č)
( Č cr )
FY16E FY17E FY16E FY17E FY16E FY17E FY16E FY17E FY16E FY17E FY16E FY17E FY16E FY17E
zOthers
S H Kelkar & Co.
Neutral
225
-
3,253
928
1,036
15.3
15.1
4.9
6.1
45.6
36.8
4.3
3.9
9.4
10.7
3.4
3.0
Quick Heal
Neutral
244
-
1,706
339
408
27.8
27.3
7.1
7.7
34.5
31.5
2.9
2.9
8.5
9.3
4.2
3.5
Narayana Hrudaya
Neutral
318
-
6,494
1,603
1,873
10.9
11.5
1.0
2.6
333.6
120.1
8.0
7.4
2.4
6.1
4.0
3.5
Manpasand Bever.
Neutral
522
-
2,615
540
836
19.9
19.6
10.2
16.9
51.0
30.9
4.1
3.7
8.1
12.0
4.7
3.0
Source: Company, Angel Research; Note: *December year end; #September year end; &October year end; Price as on May 13, 2016
Market Outlook
May 16, 2016
Research Team Tel: 022 - 39357800
DISCLAIMER
Angel Broking Private Limited (hereinafter referred to as “Angel”) is a registered Member of National Stock Exchange of India Limited,
Bombay Stock Exchange Limited and Metropolitian Stock Exchange of India Limited. It is also registered as a Depository Participant with
CDSL and Portfolio Manager with SEBI. It also has registration with AMFI as a Mutual Fund Distributor. Angel Broking Private Limited is a
registered entity with SEBI for Research Analyst in terms of SEBI (Research Analyst) Regulations, 2014 vide registration number
INH000000164. Angel or its associates has not been debarred/ suspended by SEBI or any other regulatory authority for accessing
/dealing in securities Market. Angel or its associates including its relatives/analyst do not hold any financial interest/beneficial ownership
of more than 1% in the company covered by Analyst. Angel or its associates/analyst has not received any compensation / managed or co
-managed public offering of securities of the company covered by Analyst during the past twelve months. Angel/analyst has not served as
an officer, director or employee of company covered by Analyst and has not been engaged in market making activity of the company
covered by Analyst.
This document is solely for the personal information of the recipient, and must not be singularly used as the basis of any investment
decision. Nothing in this document should be construed as investment or financial advice. Each recipient of this document should make
such investigations as they deem necessary to arrive at an independent evaluation of an investment in the securities of the companies
referred to in this document (including the merits and risks involved), and should consult their own advisors to determine the merits and
risks of such an investment.
Reports based on technical and derivative analysis center on studying charts of a stock's price movement, outstanding positions and
trading volume, as opposed to focusing on a company's fundamentals and, as such, may not match with a report on a company's
fundamentals.
The information in this document has been printed on the basis of publicly available information, internal data and other reliable sources
believed to be true, but we do not represent that it is accurate or complete and it should not be relied on as such, as this document is for
general guidance only. Angel Broking Pvt. Limited or any of its affiliates/ group companies shall not be in any way responsible for any
loss or damage that may arise to any person from any inadvertent error in the information contained in this report. Angel Broking Pvt.
Limited has not independently verified all the information contained within this document. Accordingly, we cannot testify, nor make any
representation or warranty, express or implied, to the accuracy, contents or data contained within this document. While Angel Broking
Pvt. Limited endeavors to update on a reasonable basis the information discussed in this material, there may be regulatory, compliance,
or other reasons that prevent us from doing so.
This document is being supplied to you solely for your information, and its contents, information or data may not be reproduced,
redistributed or passed on, directly or indirectly.
Neither Angel Broking Pvt. Limited, nor its directors, employees or affiliates shall be liable for any loss or damage that may arise from or
in connection with the use of this information.
Note: Please refer to the important ‘Stock Holding Disclosure' report on the Angel website (Research Section). Also, please refer to the
latest update on respective stocks for the disclosure status in respect of those stocks. Angel Broking Pvt. Limited and its affiliates may have
investment positions in the stocks recommended in this report.