Market Outlook
February 16, 2016
Market Cues
Domestic Indices
Chg (%)
(Pts)
(Close)
Indian markets are expected to open positively tracking the SGX Nifty and its Asian
BSE Sensex
2.5
568
23,554
peers.
Nifty
2.6
182
7,163
US markets were closed on account of President’s day holiday.
Mid Cap
3.5
334
9,949
European shares continued the uptrend for the second consecutive day amid hopes
Small Cap
3.4
324
10,007
of stimulus from the ECB.
Bankex
3.6
573
16,428
Indian markets opened the weak firmly, rallying close to 3%. Key benchmark indices
jumped as firmness in the global stocks boosted the sentiment in the domestic
Global Indices
Chg (%)
(Pts)
(Close)
bourses.
Dow Jones
2.0
314
15,974
Nasdaq
1.7
71
4,338
News & Result Analysis
FTSE
2.0
117
5,824
Make in India: Saab, Bharat Forge to form JV for air defence solutions
Detailed analysis on Pg2
Nikkei
7.2
1,070
16,023
Hang Seng
3.3
599
18,918
Investor’s Ready Reckoner
Shanghai Com
(0.6)
(17)
2,746
Key Domestic & Global Indicators
Stock Watch: Latest investment recommendations on 150+ stocks
Advances / Declines
BSE
NSE
Refer P4 onwards
Advances
2,004
493
Top Picks
Declines
670
1,076
CMP
Target
Upside
Company
Sector
Rating
Unchanged
115
64
(`)
(`)
(%)
Amara Raja Batteries Auto & Auto Ancillary
Buy
874
1,040
19.0
HCL Tech
IT
Buy
826
1,038
25.7
Volumes (` Cr)
LIC Housing Finance Financials
Buy
428
592
38.2
BSE
3,032
Bharat Electronics
Capital Goods
Buy
1,161
1,414
21.8
NSE
18,107
Navkar Corporation Others
Buy
166
265
59.6
More Top Picks on Pg3
Net Inflows (` Cr)
Net
Mtd
Ytd
Key Upcoming Events
FII
(1,210)
(3,014)
(11,287)
Previous
Consensus
Date
Region
Event Description
MFs
504
780
77,647
Reading
Expectations
Feb 16 UK
CPI YoY (% Change)
0.20
0.30
Feb 17 US
Housing starts (Thousands)
1,149
1,170
Top Gainers
Price (`)
Chg (%)
Feb 17 US
Industrial Production (%)
(0.36)
0.35
Bankbaroda
140
22.0
Feb 18 US
Initial jobless claims (Thousands)
269
275
Vedl
75
18.3
6.(
Rtnpower
10
17.3
Ucobank
33
16.9
Sreinfra
53
16.1
Top Losers
Price (`)
Chg (%)
Aiaeng
738
(3.5)
Cholafin
697
(2.7)
Ajantpharm
1,279
(2.5)
Gspl
132
(2.2)
Bhartiartl
319
(2.0)
As on February 15, 2016
Market Outlook
February 16, 2016
Make in India: Saab, Bharat Forge to form JV for air defence
solutions
Swedish defence and security major Saab and Bharat Forge group have renewed
their commitment to manufacture air defence solutions in India. The two groups
had signed a strategic alliance in FY 2014 and today announced plans to form a
joint venture company to develop missile systems.
The joint venture will handle main part of production delivery of air defence
systems. The production in India will comprise of sub-systems and systems for
short-range surface to air missiles and very short-range air defence missile
systems, with the aim to transfer production and technology. To secure production
quality, orders of missile parts have already been issued to Kalyani Strategic
Systems Ltd — a Bharat Forge subsidiary involved in the project.
"The joint venture is already under preparation within both companies and will be
ready to launch soon," said Gorgen Johansson, head of Saab business area
dynamics.
Bharat Forge has identified defence as one of the key pillars for forging growth.
Under the “Make in India” initiative, Bharat Forge is tying up with global defence
players with a view to gain technology and harness its manufacturing prowess to
broaden the revenue profile. We currently have Buy rating on the stock.
Economic and Political News
Govt committed to adequate coal supply to non-power sector: Anil Swarup
Indian power and coal sector a $1 trillion investment opportunity by 2030:
Piyush Goyal
RBI's Raghuram Rajan says not in favour of devaluing exchange rate
India sees lower 2016 wheat harvest at 93.82 MT
Corporate News
JSW eyes port asset acquisitions, to cut debt at its steel unit
Vedanta, Odisha Govt tie up to commission aluminium park
Dr Agarwal's Eye Hospital to invest `600 crore for expansion
Biocon gets its first generics approval in the European Union
Market Outlook
February 16, 2016
Top Picks ★★★★★
Large Cap
Market Cap
CMP
Target
Upside
Company
Rationale
(` Cr)
(`)
(`)
(%)
To outpace battery industry growth due to better technological
Amara Raja Batteries
14,928
874
1,040
19.0
products leading to market share gains in both the automotive
OEM and replacement segments.
Earnings to grow strongly given the MHCV cyclical upturn.
Ashok Leyland
25,485
90
111
24.0
Focus on exports and LCV's provides additional growth
avenue.
Uptick in defense capex by government when coupled with
Bharat Electronics
27,871
1,161
1,414
21.8
BELs strong market positioning, indicate that good times are
ahead for BEL.
The stock is trading at attractive valuations and is factoring all
HCL Tech
116,339
826
1,038
25.7
the bad news.
Strong visibility for a robust 20% earnings trajectory, coupled
HDFC Bank
246,092
974
1,262
29.6
with high quality of earnings on account of high quality retail
business and strategic focus on highly rated corporates.
Back on the growth trend, expect a long term growth of 14%
Infosys
250,677
1,091
1,347
23.4
to be a US$20bn in FY2020.
LICHF continues to grow its retail loan book at a healthy pace
with improvement in asset quality. We expect the company to
LIC Housing Finance
21,600
428
592
38.2
post a healthy loan book which is likely to reflect in a strong
earnings growth.
Huge bid pipeline of re-development works at Delhi and other
NBCC
10,400
867
1,089
25.6
State Governments and opportunity from Smart City, positions
NBCC to report strong growth, going forward.
New launches to enable outpace industry growth; margins
TVS Motors
13,542
285
330
15.8
expansion to boost earnings.
Source: Company, Angel Research
Mid Cap
Market Cap
CMP
Target
Upside
Company
Rationale
(` Cr)
(`)
(`)
(%)
Favourable outlook for the AC industry to augur well for
Cooling products business which is out pacing the market
Blue Star
3,008
334
439
31.3
growth. EMPPAC division's profitability to improve once
operating environment turns around.
Economic recovery to have favourable impact on advertising &
circulation revenue growth. Further, the acquisition of a radio
Jagran Prakashan
5,093
156
189
21.3
business (Radio City) would also boost the company's revenue
growth.
Massive capacity expansion along with rail advantage at ICD
Navkar Corporation
2,367
166
265
59.6
as well CFS augurs well for the company
Earnings boost on back of stable material prices and
Radico Khaitan
1,322
99
156
56.9
favourable pricing environment. Valuation discount to peers
provides additional comfort
Strong brands and distribution network would boost growth
Siyaram Silk Mills
964
1,029
1,354
31.6
going ahead. Stock currently trades at an inexpensive
valuation.
Structural shift in the Lighting industry towards LED lighting will
Surya Roshni
3,008
334
439
31.3
drive growth.
Source: Company, Angel Research
Market Outlook
February 16, 2016
Key Upcoming Events
Global economic events release calendar
Date
Time
Country
Event Description
Unit
Period
Bloomberg Data
Last Reported Estimated
Feb 16, 2016
3:00PM
UK
CPI (YoY)
% Change
Jan
0.20
0.30
Feb 17, 2016
7:00PM
US
Housing Starts
Thousands
Jan
1,149.00
1,175.00
7:00PM
US
Building permits
Thousands
Jan
1,204.00
1,200.00
3:00PM
UK
Jobless claims change
% Change
Jan
(4.30)
(3.00)
7:45PM
US
Industrial Production
%
Jan
(0.36)
0.35
US
Producer Price Index (mom)
% Change
Jan
(0.80)
--
Feb 18, 2016
7:00PM
US
Initial Jobless claims
Thousands
Feb 13
269.00
275.00
7:00AM
China
Consumer Price Index (YoY)
% Change
Jan
1.60
1.90
Feb 19, 2016
7:00PM
US
Consumer price index (mom)
% Change
Jan
(0.10)
(0.10)
8:30PM
Euro Zone
Euro-Zone Consumer Confidence
Value
Feb A
(6.30)
(6.60)
Feb 22, 2016
2:00PM
Germany
PMI Services
Value
Feb P
55.00
--
2:00PM
Germany
PMI Manufacturing
Value
Feb P
52.30
--
Feb 23, 2016
12:30PM
Germany
GDP nsa (YoY)
% Change
4Q F
2.10
--
8:30PM
US
Existing home sales
Million
Jan
5.46
5.50
8:30PM
US
Consumer Confidence
S.A./ 1985=100
Feb
98.10
97.50
Feb 24, 2016
8:30PM
US
New home sales
Thousands
Jan
544.00
525.00
Feb 25, 2016
3:00PM
UK
GDP (YoY)
% Change
4Q P
1.90
--
3:30PM
Euro Zone
Euro-Zone CPI (YoY)
%
Jan F
0.40
--
Feb 26, 2016
7:00PM
US
GDP Qoq (Annualised)
% Change
4Q S
0.70
0.30
Source: Bloomberg, Angel Research
Market Outlook
February 16, 2016
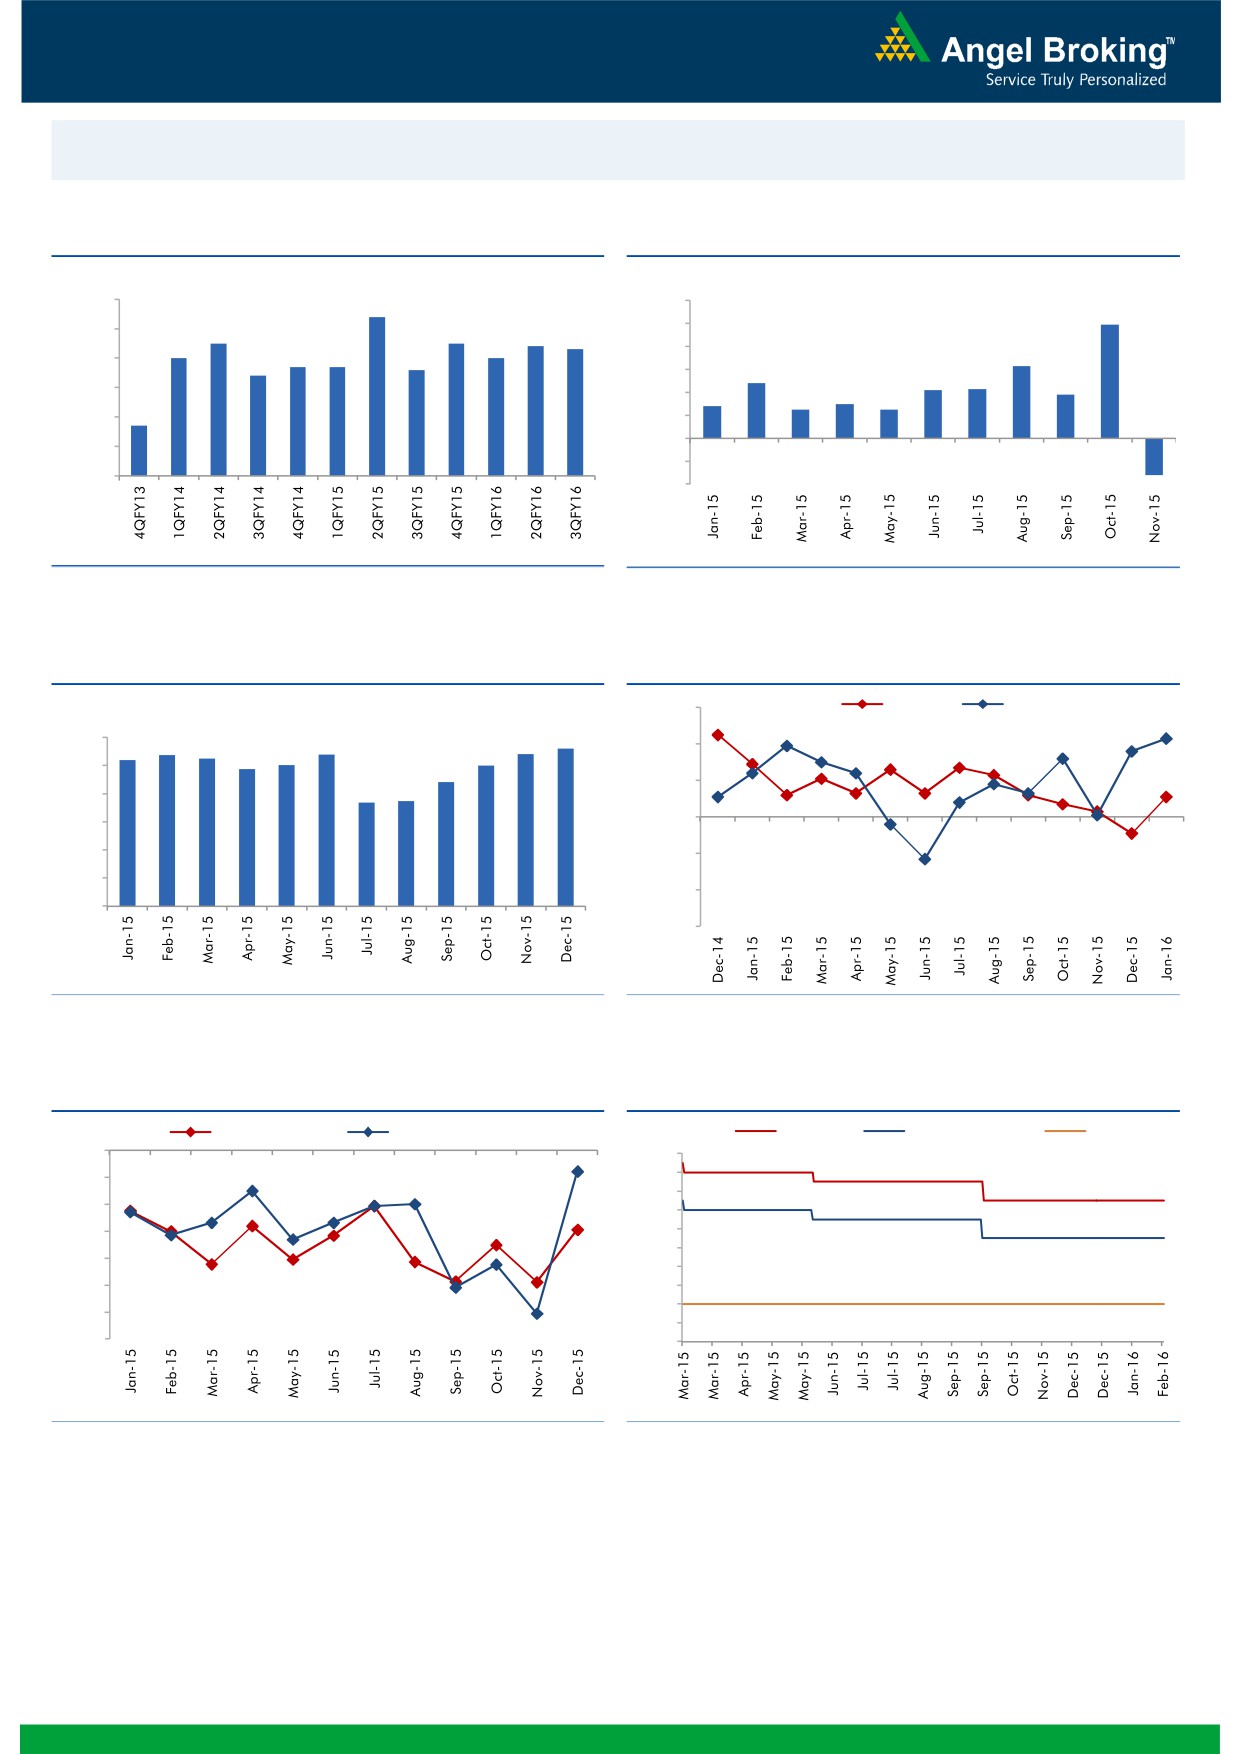
Macro watch
Exhibit 1: Quarterly GDP trends
Exhibit 2: IIP trends
(%)
(%)
9.0
8.4
12.0
9.9
7.5
7.5
10.0
8.0
7.4
7.3
7.0
7.0
6.7
6.7
6.6
8.0
6.3
7.0
6.4
6.0
4.8
4.3
4.2
3.8
6.0
2.8
3.0
4.0
2.5
2.5
4.7
5.0
2.0
(3.2)
-
4.0
(2.0)
3.0
(4.0)
Source: CSO, Angel Research
Source: MOSPI, Angel Research
Exhibit 3: Monthly CPI inflation trends
Exhibit 4: Manufacturing and services PMI
(%)
56.0
Mfg. PMI
Services PMI
6.0
5.4
5.4
5.4
5.6
5.2
5.3
54.0
4.9
5.0
5.0
5.0
4.4
3.7
3.7
52.0
4.0
3.0
50.0
2.0
48.0
1.0
46.0
-
44.0
Source: MOSPI, Angel Research
Source: Market, Angel Research; Note: Level above 50 indicates expansion
Exhibit 5: Exports and imports growth trends
Exhibit 6: Key policy rates
(%)
Exports yoy growth
Imports yoy growth
(%)
Repo rate
Reverse Repo rate
CRR
0.0
8.00
(5.0)
7.50
7.00
(10.0)
6.50
(15.0)
6.00
5.50
(20.0)
5.00
(25.0)
4.50
4.00
(30.0)
3.50
(35.0)
3.00
Source: Bloomberg, Angel Research
Source: RBI, Angel Research
Market Outlook
February 16, 2016
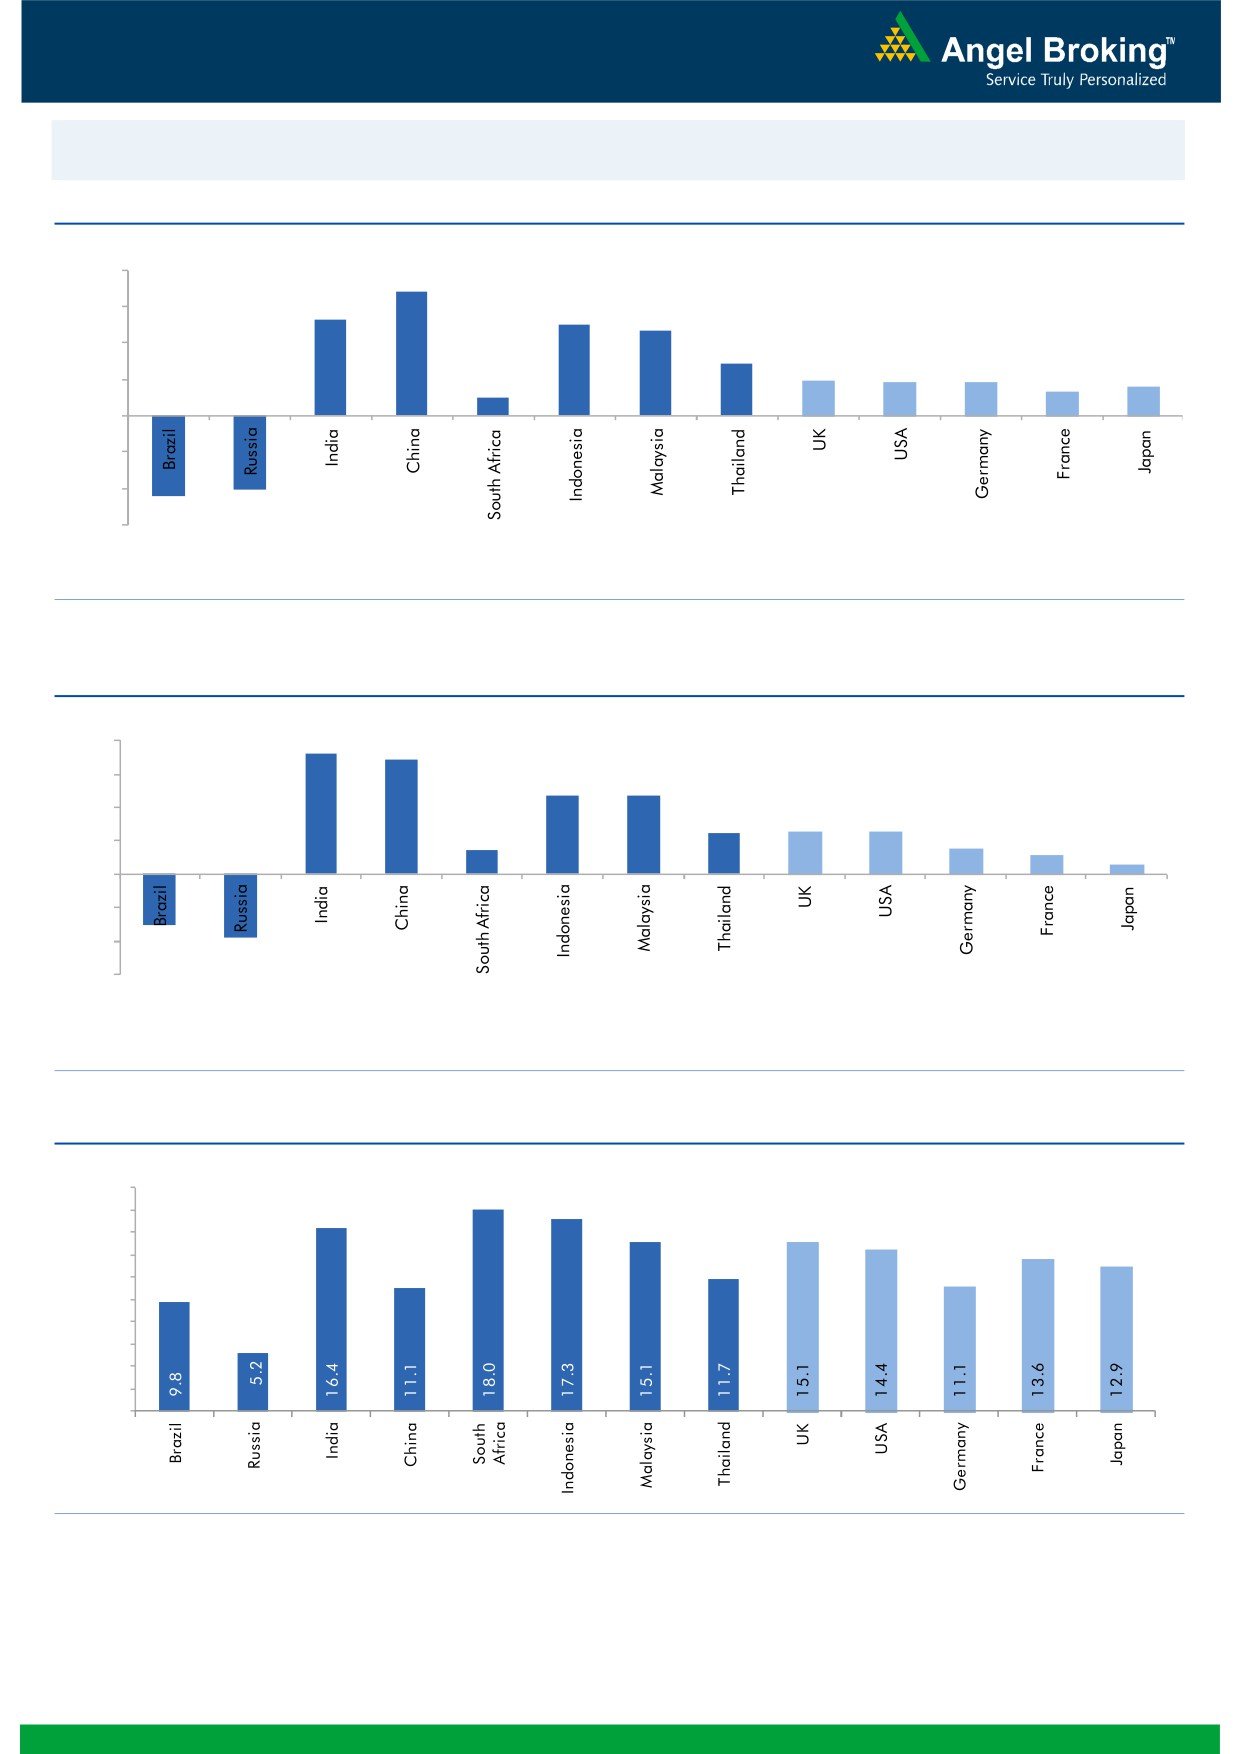
Global watch
Exhibit 1: Latest quarterly GDP Growth (%, yoy) across select developing and developed countries
(%)
8.0
6.8
5.3
6.0
5.0
4.7
4.0
2.9
1.9
1.8
1.8
1.3
1.6
2.0
1.0
(4.5)
(4.1)
-
(2.0)
(4.0)
(6.0)
Source: Bloomberg, Angel Research
Exhibit 2: 2015 GDP Growth projection by IMF (%, yoy) across select developing and developed countries
(%)
7.3
8.0
6.8
6.0
4.7
4.7
4.0
2.5
2.5
2.6
1.4
1.5
2.0
1.2
0.6
(3.0)
(3.8)
-
(2.0)
(4.0)
(6.0)
Source: IMF, Angel Research
Exhibit 3: One year forward P-E ratio across select developing and developed countries
(x)
20.0
18.0
16.0
14.0
12.0
10.0
8.0
6.0
4.0
2.0
-
Source: IMF, Angel Research
Market Outlook
February 16, 2016
Exhibit 4: Relative performance of indices across globe
Returns (%)
Country
Name of index
Closing price
1M
3M
1YR
Brazil
Bovespa
40,093
0.4
(16.6)
(18.1)
Russia
Micex
1,739
3.4
(0.1)
(3.6)
India
Nifty
7,163
(5.3)
(8.5)
(16.4)
China
Shanghai Composite
2,746
(12.1)
(23.0)
(12.7)
South Africa
Top 40
44,379
3.8
(5.1)
(5.1)
Mexico
Mexbol
43,206
5.4
(2.6)
0.3
Indonesia
LQ45
831
6.2
10.7
(9.2)
Malaysia
KLCI
1,650
(0.5)
(2.3)
(8.5)
Thailand
SET 50
813
2.9
(9.1)
(23.8)
USA
Dow Jones
15,974
(3.3)
(10.0)
(11.4)
UK
FTSE
5,824
(1.6)
(5.7)
(15.6)
Japan
Nikkei
16,023
(9.6)
(18.4)
(9.4)
Germany
DAX
9,207
(6.0)
(15.6)
(15.5)
France
CAC
4,115
(4.6)
(14.4)
(14.8)
Source: Bloomberg, Angel Research
Stock Watch
February 16, 2016
Company Name
Reco
CMP
Target
Mkt Cap
Sales ( Čcr )
OPM(%)
EPS (Č)
PER(x)
P/BV(x)
RoE(%)
EV/Sales(x)
(Č)
Price ( Č)
( Č cr )
FY16E FY17E
FY16E
FY17E
FY16E
FY17E
FY16E
FY17E
FY16E
FY17E
FY16E
FY17E
FY16E
FY17E
Agri / Agri Chemical
Rallis
Neutral
151
-
2,936
2,097
2,415
14.4
14.4
9.5
11.0
15.9
13.7
3.2
2.7
21.1
21.3
1.4
1.2
United Phosphorus
Buy
406
480
17,391
12,500
14,375
18.3
18.3
29.8
35.9
13.6
11.3
2.5
2.1
20.0
20.3
1.5
1.2
Auto & Auto Ancillary
Ashok Leyland
Buy
90
111
25,485
17,995
21,544
11.4
11.6
3.4
4.7
26.3
19.1
4.6
4.2
17.7
22.2
1.4
1.1
Bajaj Auto
Buy
2,343
2,728
67,806
23,695
27,298
21.3
20.4
134.6
151.5
17.4
15.5
5.5
4.7
31.8
30.6
2.4
2.1
Bharat Forge
Buy
786
943
18,295
7,867
8,881
20.0
20.3
34.4
41.0
22.9
19.2
4.4
3.7
21.1
20.9
2.5
2.1
Eicher Motors
Accumulate
18,772
20,044
50,974
15,556
16,747
15.5
17.3
464.8
597.5
40.4
31.4
14.8
10.9
36.2
34.3
3.2
2.9
Gabriel India
Buy
81
101
1,168
1,415
1,544
8.7
9.0
4.6
5.4
17.7
15.1
3.2
2.8
18.1
18.9
0.8
0.7
Hero Motocorp
Accumulate
2,516
2,864
50,235
28,244
30,532
15.5
15.9
156.7
168.5
16.1
14.9
6.4
5.4
39.9
36.4
1.6
1.5
Jamna Auto Industries Buy
134
160
1,072
1,281
1,473
11.2
11.5
7.6
9.2
17.7
14.6
4.5
3.7
25.4
25.2
0.9
0.8
L G Balakrishnan & Bros Neutral
436
-
685
1,254
1,394
11.6
11.8
35.9
41.7
12.2
10.5
1.7
1.5
13.5
13.8
0.7
0.6
Mahindra and Mahindra Buy
1,223
1,449
75,941
39,031
44,440
13.8
13.9
57.9
67.6
21.1
18.1
3.4
3.0
16.1
16.6
1.6
1.3
Maruti
Neutral
3,712
-
112,122
57,865
68,104
16.4
16.7
176.3
225.5
21.1
16.5
4.1
3.5
19.4
21.2
1.7
1.4
Minda Industries
Buy
815
1,047
1,293
2,523
2,890
8.7
9.0
55.0
65.4
14.8
12.5
2.9
2.3
19.3
18.7
0.6
0.5
Motherson Sumi
Buy
240
313
31,792
39,343
45,100
8.8
9.1
10.1
12.5
23.8
19.2
7.5
5.9
35.3
34.4
0.9
0.8
Rane Brake Lining
Buy
348
465
276
454
511
11.5
12.0
25.2
31.0
13.8
11.2
2.1
1.9
14.9
16.6
0.7
0.7
Setco Automotive
Neutral
30
-
401
594
741
12.7
13.7
1.7
3.2
17.7
9.4
1.9
1.6
10.4
16.9
1.1
0.9
Tata Motors
Buy
316
409
91,366
266,022
312,667
12.8
13.1
26.3
38.3
12.0
8.3
1.6
1.3
8.4
12.1
0.5
0.5
TVS Motor
Buy
285
330
13,542
11,263
13,122
6.9
8.5
9.2
15.0
31.0
19.0
7.1
5.6
22.7
29.6
1.2
1.0
Amara Raja Batteries
Buy
874
1,040
14,928
4,892
5,871
17.4
17.6
28.8
37.1
30.4
23.6
7.1
5.7
23.4
24.1
3.0
2.4
Exide Industries
Buy
129
162
10,957
6,950
7,784
14.4
14.8
6.6
7.3
19.5
17.7
2.5
2.3
12.6
12.8
1.3
1.2
Apollo Tyres
Accumulate
156
171
7,964
12,146
12,689
16.8
16.0
21.2
19.0
7.4
8.2
1.2
1.1
16.5
13.0
0.7
0.8
Ceat
Buy
953
1,119
3,856
6,041
6,597
14.1
13.7
99.5
111.9
9.6
8.5
1.9
1.6
19.6
18.5
0.8
0.7
JK Tyres
Neutral
82
-
1,862
7,446
7,669
15.2
14.0
19.6
18.4
4.2
4.5
1.1
0.9
25.2
19.5
0.6
0.6
Swaraj Engines
Accumulate
803
919
997
552
630
14.2
14.7
44.6
54.1
18.0
14.8
4.2
3.8
23.2
25.6
1.7
1.4
Subros
Neutral
83
-
499
1,293
1,527
11.8
11.9
4.2
6.7
19.8
12.4
1.5
1.4
7.7
11.5
0.7
0.6
Indag Rubber
Neutral
166
-
435
283
329
17.0
17.2
13.0
15.4
12.8
10.7
2.8
2.3
21.8
21.6
1.3
1.0
Capital Goods
ACE
Neutral
36
-
353
660
839
4.7
8.2
1.0
3.9
35.7
9.1
1.1
1.0
3.2
11.3
0.7
0.5
BEML
Neutral
983
-
4,093
3,277
4,006
6.0
8.9
29.2
64.3
33.7
15.3
1.9
1.7
5.7
11.7
1.3
1.0
Bharat Electronics
Buy
1,161
1,414
27,871
7,737
8,634
16.8
17.2
54.0
61.5
21.5
18.9
3.1
2.7
39.3
45.6
2.7
2.3
Stock Watch
February 16, 2016
Company Name
Reco
CMP
Target
Mkt Cap
Sales ( Čcr )
OPM(%)
EPS (Č)
PER(x)
P/BV(x)
RoE(%)
EV/Sales(x)
(Č)
Price ( Č)
( Č cr )
FY16E
FY17E
FY16E
FY17E
FY16E
FY17E
FY16E
FY17E
FY16E
FY17E
FY16E
FY17E
FY16E
FY17E
Capital Goods
Voltas
Buy
238
353
7,873
5,363
5,963
8.0
9.1
11.0
13.8
21.6
17.2
3.3
2.9
16.2
17.9
1.4
1.3
BGR Energy
Neutral
99
-
717
3,615
3,181
9.5
9.4
16.7
12.4
6.0
8.0
0.6
0.6
10.0
7.0
0.6
0.8
BHEL
Neutral
108
-
26,422
33,722
35,272
10.8
11.7
10.5
14.2
10.3
7.6
0.8
0.7
7.0
9.0
0.9
0.8
Blue Star
Buy
334
439
3,008
3,548
3,977
6.3
6.9
13.7
17.2
24.4
19.5
6.1
4.0
26.1
25.4
0.9
0.8
Crompton Greaves
Neutral
126
-
7,897
13,484
14,687
4.9
6.2
4.5
7.1
28.0
17.8
2.0
1.9
7.2
10.8
0.7
0.6
Greaves Cotton
Neutral
127
-
3,090
1,655
1,755
16.6
16.8
7.4
7.8
17.1
16.2
3.4
3.2
21.1
20.6
1.8
1.7
Inox Wind
Buy
249
458
5,517
4,980
5,943
17.0
17.5
26.6
31.6
9.4
7.9
2.8
2.1
35.0
30.0
1.3
1.0
KEC International
Neutral
109
-
2,802
8,791
9,716
6.1
6.8
5.4
8.2
20.2
13.3
2.0
1.9
10.0
14.0
0.5
0.5
Thermax
Neutral
771
-
9,183
6,413
7,525
7.4
8.5
30.5
39.3
25.3
19.6
3.9
3.4
15.0
17.0
1.4
1.2
Cement
ACC
Buy
1,255
1,630
23,564
13,151
14,757
16.4
18.3
63.9
83.4
19.6
15.1
2.5
2.3
13.3
16.1
1.6
1.4
Ambuja Cements
Buy
198
233
30,689
11,564
12,556
19.4
20.7
8.9
10.1
22.2
19.6
2.8
2.6
12.8
13.8
2.3
2.1
HeidelbergCement
Neutral
65
-
1,465
1,772
1,926
13.3
15.4
1.0
3.0
64.7
21.6
1.6
1.5
2.6
7.9
1.4
1.2
India Cements
Buy
74
112
2,273
4,216
4,840
18.0
19.5
4.0
9.9
18.5
7.5
0.7
0.7
4.0
9.5
0.9
0.7
JK Cement
Buy
453
744
3,167
3,661
4,742
10.1
15.8
18.0
61.0
25.2
7.4
1.8
1.6
7.5
22.9
1.3
1.0
J K Lakshmi Cement
Buy
269
430
3,169
2,947
3,616
16.7
19.9
11.5
27.2
23.4
9.9
2.2
1.9
9.8
20.8
1.5
1.2
Mangalam Cements
Neutral
168
-
448
1,053
1,347
10.5
13.3
8.4
26.0
20.0
6.5
0.8
0.8
4.3
12.5
0.8
0.6
Orient Cement
Buy
135
183
2,766
1,854
2,524
21.2
22.2
7.7
11.1
17.5
12.2
2.5
2.2
13.3
15.7
2.2
1.6
Ramco Cements
Neutral
375
-
8,935
4,036
4,545
20.8
21.3
15.1
18.8
24.9
20.0
3.0
2.7
12.9
14.3
2.7
2.3
Shree Cement^
Neutral
10,526
-
36,671
7,150
8,742
26.7
28.6
228.0
345.5
46.2
30.5
6.8
5.7
15.7
20.3
4.9
3.9
UltraTech Cement
Buy
2,804
3,282
76,935
25,021
30,023
19.1
21.6
89.0
132.0
31.5
21.2
3.7
3.2
12.2
15.9
3.1
2.6
Construction
ITNL
Neutral
69
-
2,265
7,360
8,825
34.0
35.9
7.0
9.0
9.8
7.7
0.3
0.3
3.2
3.7
3.7
3.6
KNR Constructions
Buy
457
673
1,284
937
1,470
14.3
14.0
33.5
38.6
13.6
11.8
2.1
1.8
15.4
15.4
1.5
0.9
Larsen & Toubro
Accumulate
1,149
1,310
107,041
58,870
65,708
8.3
10.3
42.0
53.0
27.4
21.7
1.9
1.7
8.8
11.2
2.0
1.8
Gujarat Pipavav Port
Neutral
154
-
7,438
629
684
51.0
52.2
6.4
5.9
24.0
26.1
3.2
2.9
15.9
12.7
11.5
10.4
MBL Infrastructures
Buy
141
285
584
2,313
2,797
12.2
14.6
19.0
20.0
7.4
7.0
0.8
0.7
11.3
10.6
1.0
0.9
Nagarjuna Const.
Neutral
64
-
3,583
7,892
8,842
8.8
9.1
3.0
5.3
21.5
12.2
1.1
1.0
5.0
8.5
0.7
0.6
PNC Infratech
Accumulate
523
558
2,685
1,873
2,288
13.2
13.5
24.0
32.0
21.8
16.4
2.1
1.9
12.1
12.3
1.5
1.3
Simplex Infra
Neutral
237
-
1,174
5,955
6,829
10.3
10.5
16.0
31.0
14.8
7.7
0.8
0.7
5.3
9.9
0.7
0.6
Power Mech Projects
Neutral
561
-
826
1,539
1,801
12.8
12.7
59.0
72.1
9.5
7.8
1.4
1.2
18.6
16.8
0.5
0.5
Stock Watch
February 16, 2016
Company Name
Reco
CMP
Target
Mkt Cap
Sales ( Čcr )
OPM(%)
EPS (Č)
PER(x)
P/BV(x)
RoE(%)
EV/Sales(x)
(Č)
Price ( Č)
( Č cr )
FY16E
FY17E
FY16E
FY17E
FY16E
FY17E
FY16E
FY17E
FY16E
FY17E
FY16E
FY17E
FY16E
FY17E
Construction
Sadbhav Engineering
Neutral
244
-
4,179
3,481
4,219
10.7
10.8
8.0
12.0
30.5
20.3
2.8
2.5
10.3
13.5
1.5
1.2
NBCC
Buy
867
1,089
10,400
5,816
7,382
6.9
7.7
29.6
39.8
29.3
21.8
5.3
4.2
24.1
26.7
1.5
1.2
MEP Infra
Neutral
45
-
733
1,956
1,876
28.1
30.5
1.3
3.0
34.7
15.0
7.3
4.9
21.2
32.8
1.8
1.8
SIPL
Neutral
73
-
2,582
675
1,042
62.4
64.7
-
-
2.8
3.1
-
-
15.5
10.5
Financials
Allahabad Bank
Neutral
44
-
2,645
8,569
9,392
2.8
2.9
16.3
27.5
2.7
1.6
0.3
0.2
7.6
11.9
-
-
Axis Bank
Buy
418
494
99,370
26,473
31,527
3.5
3.6
35.7
43.5
11.7
9.6
2.0
1.7
17.9
18.9
-
-
Bank of Baroda
Neutral
140
-
32,155
18,485
21,025
1.9
2.0
13.5
21.1
10.4
6.6
0.8
0.7
7.3
10.6
-
-
Bank of India
Neutral
90
-
7,271
15,972
17,271
1.9
2.0
15.3
33.4
5.9
2.7
0.3
0.2
3.6
7.6
-
-
Canara Bank
Neutral
179
-
9,728
15,441
16,945
2.0
2.1
46.6
70.4
3.9
2.5
0.3
0.3
8.0
11.2
-
-
Dena Bank
Neutral
29
-
1,845
3,440
3,840
2.1
2.3
7.3
10.0
4.0
2.9
0.3
0.2
6.1
7.9
-
-
Federal Bank
Neutral
44
-
7,610
3,477
3,999
3.0
3.0
5.0
6.2
8.8
7.1
0.9
0.8
10.6
11.9
-
-
HDFC
Neutral
1,081
-
170,676
10,358
11,852
3.3
3.3
41.1
47.0
26.3
23.0
5.0
4.6
24.7
24.9
-
-
HDFC Bank
Buy
974
1,262
246,092
38,309
47,302
4.3
4.3
49.3
61.1
19.8
16.0
3.4
2.9
18.5
19.7
-
-
ICICI Bank
Buy
203
254
118,230
34,279
39,262
3.3
3.3
21.0
24.4
9.7
8.4
1.6
1.4
14.4
14.7
-
-
IDBI Bank
Neutral
54
-
10,213
9,625
10,455
1.8
1.8
8.5
14.2
6.3
3.8
0.4
0.4
5.9
9.3
-
-
Indian Bank
Neutral
86
-
4,152
6,160
6,858
2.5
2.5
24.5
29.8
3.5
2.9
0.3
0.3
7.7
8.6
-
-
LIC Housing Finance
Buy
428
592
21,600
3,101
3,745
2.5
2.5
33.0
40.2
13.0
10.7
2.4
2.1
19.7
20.5
-
-
Oriental Bank
Neutral
87
-
2,598
7,643
8,373
2.4
2.4
37.2
45.4
2.3
1.9
0.2
0.2
8.2
9.4
-
-
Punjab Natl.Bank
Neutral
77
-
15,080
23,638
26,557
2.8
2.8
17.9
27.2
4.3
2.8
0.4
0.4
8.5
12.0
-
-
South Ind.Bank
Neutral
18
-
2,457
1,965
2,185
2.5
2.5
2.5
3.3
7.3
5.5
0.7
0.7
9.5
11.7
-
-
St Bk of India
Buy
167
202
129,832
82,520
93,299
2.7
2.8
20.0
24.5
8.4
6.8
0.9
0.8
11.5
12.8
-
-
Union Bank
Neutral
120
-
8,256
12,646
14,129
2.3
2.4
31.0
39.1
3.9
3.1
0.4
0.4
9.8
11.4
-
-
Vijaya Bank
Neutral
31
-
2,693
3,536
3,827
1.9
1.9
5.5
6.7
5.7
4.7
0.5
0.4
7.8
8.8
-
-
Yes Bank
Neutral
752
-
31,565
7,190
9,011
3.2
3.3
58.2
69.7
12.9
10.8
2.3
2.0
19.2
19.6
-
-
FMCG
Asian Paints
Neutral
858
-
82,275
16,553
19,160
16.0
16.2
17.7
21.5
48.5
39.9
12.9
11.6
29.4
31.2
4.8
4.1
Britannia
Neutral
2,668
-
32,009
8,065
9,395
9.6
10.2
47.2
65.5
56.5
40.7
18.8
17.8
38.3
41.2
3.8
3.3
Colgate
Neutral
848
-
23,068
4,836
5,490
19.5
19.7
48.5
53.2
17.5
15.9
12.8
11.2
99.8
97.5
4.7
4.1
Dabur India
Accumulate
248
267
43,627
9,370
10,265
17.1
17.2
7.3
8.1
33.8
30.6
10.2
8.3
33.7
30.6
4.6
4.2
GlaxoSmith Con*
Accumulate
5,801
6,118
24,398
4,919
5,742
17.2
17.4
168.3
191.2
34.5
30.3
9.8
8.3
28.8
28.9
4.5
3.8
Stock Watch
February 16, 2016
Company Name
Reco
CMP
Target
Mkt Cap
Sales ( Čcr )
OPM(%)
EPS (Č)
PER(x)
P/BV(x)
RoE(%)
EV/Sales(x)
(Č)
Price ( Č)
( Č cr )
FY16E FY17E
FY16E
FY17E
FY16E
FY17E
FY16E
FY17E
FY16E
FY17E
FY16E
FY17E
FY16E
FY17E
FMCG
Godrej Consumer
Neutral
1,245
-
42,398
10,168
12,886
16.1
16.1
32.1
38.4
38.8
32.4
7.9
7.3
19.7
21.0
4.3
3.4
HUL
Neutral
805
-
174,192
34,940
38,957
17.5
17.7
20.8
24.7
38.7
32.6
43.1
34.4
110.5
114.2
4.8
4.3
ITC
Buy
304
359
244,122
41,068
45,068
37.8
37.4
13.9
15.9
21.8
19.1
7.3
6.4
34.1
33.8
5.6
5.0
Marico
Neutral
229
-
29,597
6,551
7,766
15.7
16.0
10.4
12.5
22.1
18.4
6.4
5.3
33.2
32.4
4.4
3.8
Nestle*
Buy
5,059
6,646
48,778
11,291
12,847
22.2
22.3
158.9
184.6
31.8
27.4
16.6
15.0
55.0
57.3
4.2
3.6
Tata Global
Buy
106
144
6,690
8,635
9,072
9.8
9.9
6.5
7.6
16.3
14.0
1.6
1.6
6.8
7.4
0.7
0.7
IT
HCL Tech^
Buy
826
1,038
116,339
42,038
47,503
21.2
21.5
51.5
57.7
16.0
14.3
3.5
2.7
21.5
18.8
2.4
1.9
Infosys
Buy
1,091
1,347
250,677
61,850
69,981
27.5
27.5
59.4
65.7
18.4
16.6
3.9
3.3
21.2
20.1
3.3
2.8
TCS
Buy
2,270
2,854
447,198
108,487
122,590
28.3
28.5
122.8
138.4
18.5
16.4
7.0
6.4
38.0
38.9
3.7
3.2
Tech Mahindra
Buy
431
646
41,726
25,566
28,890
16.0
17.0
26.3
31.9
16.4
13.5
3.0
2.5
17.9
18.6
1.4
1.2
Wipro
Buy
526
680
129,923
50,808
56,189
23.7
23.8
37.3
40.7
14.1
12.9
2.7
2.5
19.2
17.7
2.0
1.7
Media
D B Corp
Accumulate
315
356
5,783
2,241
2,495
27.8
27.9
21.8
25.6
14.5
12.3
3.8
3.3
26.7
28.5
2.5
2.3
HT Media
Neutral
79
-
1,849
2,495
2,603
11.2
11.2
7.3
8.6
10.9
9.2
0.9
0.8
7.4
8.1
0.2
0.2
Jagran Prakashan
Buy
156
189
5,093
2,170
2,355
27.2
26.2
8.9
9.9
17.5
15.7
3.7
3.2
20.9
20.5
2.2
2.1
Sun TV Network
Neutral
346
-
13,635
2,779
3,196
70.2
70.5
22.8
27.3
15.2
12.7
3.7
3.4
26.7
28.3
4.7
4.0
Hindustan Media
Neutral
271
-
1,989
920
1,031
20.0
20.0
19.2
20.9
14.1
13.0
2.3
2.0
16.4
15.3
1.7
1.5
Ventures
Metals & Mining
Coal India
Buy
324
380
204,555
76,167
84,130
19.9
22.3
22.4
25.8
14.5
12.5
5.2
5.1
35.5
41.0
2.0
1.8
Hind. Zinc
Neutral
168
-
70,943
14,641
14,026
50.4
50.4
17.7
16.0
9.5
10.5
1.5
1.3
16.2
13.2
2.5
2.3
Hindalco
Neutral
67
-
13,804
104,356
111,186
8.7
9.5
6.7
11.1
10.0
6.1
0.4
0.3
3.5
5.9
0.7
0.6
JSW Steel
Neutral
1,041
-
25,151
42,308
45,147
16.4
20.7
(10.3)
49.5
21.0
1.2
1.1
(1.0)
5.6
1.6
1.5
NMDC
Neutral
90
-
35,603
8,237
10,893
46.6
44.5
10.0
11.7
9.0
7.7
1.0
0.9
12.5
13.0
4.1
3.1
SAIL
Neutral
36
-
14,827
45,915
53,954
7.2
10.5
1.5
4.4
23.8
8.2
0.3
0.3
2.3
4.1
1.0
0.9
Vedanta
Neutral
75
-
22,235
71,445
81,910
26.2
26.3
12.9
19.2
5.8
3.9
0.4
0.4
7.2
8.9
0.8
0.6
Tata Steel
Neutral
246
-
23,911
126,760
137,307
8.9
11.3
6.4
23.1
38.7
10.7
0.8
0.8
2.0
7.1
0.8
0.7
Oil & Gas
Cairn India
Neutral
125
-
23,408
11,323
12,490
49.4
51.0
20.7
20.7
6.0
6.1
0.4
0.4
6.4
6.1
1.1
0.5
GAIL
Neutral
335
-
42,481
64,856
70,933
9.1
9.6
24.0
28.9
14.0
11.6
1.2
1.1
8.8
9.6
0.8
0.7
ONGC
Neutral
200
-
171,024
154,564
167,321
36.8
37.4
28.6
32.5
7.0
6.2
0.9
0.8
12.7
13.5
1.3
1.2
Petronet LNG
Neutral
258
-
19,354
29,691
31,188
5.8
6.2
12.8
13.4
20.2
19.2
3.0
2.7
15.8
14.8
0.7
0.7
Indian Oil Corp
Buy
389
455
94,350
359,607
402,760
5.9
6.1
42.5
48.7
9.2
8.0
1.2
1.1
14.1
14.4
0.4
0.3
Stock Watch
February 16, 2016
Company Name
Reco
CMP
Target
Mkt Cap
Sales ( Čcr )
OPM(%)
EPS (Č)
PER(x)
P/BV(x)
RoE(%)
EV/Sales(x)
(Č)
Price ( Č)
( Č cr )
FY16E FY17E
FY16E
FY17E
FY16E
FY17E
FY16E
FY17E
FY16E
FY17E
FY16E
FY17E
FY16E
FY17E
Oil & Gas
Reliance Industries
Buy
945
1,150
306,010
304,775
344,392
12.6
13.4
91.3
102.6
10.4
9.2
1.2
1.1
11.8
12.0
0.9
0.8
Pharmaceuticals
Alembic Pharma
Neutral
623
-
11,735
3,274
3,802
26.9
19.4
35.0
28.7
17.8
21.7
7.9
5.9
55.6
31.2
3.6
3.0
Aurobindo Pharma
Buy
654
856
38,233
14,923
17,162
22.0
23.0
35.7
42.8
18.3
15.3
5.4
4.1
34.0
30.2
2.9
2.5
Aventis*
Neutral
4,281
-
9,860
2,082
2,371
17.4
20.8
118.2
151.5
36.2
28.3
5.3
4.3
19.9
25.5
4.4
3.7
Cadila Healthcare
Accumulate
315
352
32,227
10,224
11,840
21.0
22.0
14.6
17.6
21.6
17.9
5.9
4.6
30.8
29.0
3.2
2.7
Cipla
Buy
540
636
43,395
14,211
16,611
20.6
19.0
27.0
28.9
20.0
18.7
3.4
2.9
18.4
16.8
3.0
2.5
Dr Reddy's
Buy
2,856
3,933
48,703
16,838
19,575
25.0
23.1
167.5
178.8
17.1
16.0
3.6
3.0
23.1
20.4
2.8
2.4
Dishman Pharma
Neutral
319
-
2,575
1,733
1,906
21.5
21.5
17.0
19.9
18.8
16.0
1.9
1.7
10.5
11.2
2.0
1.7
GSK Pharma*
Neutral
3,222
-
27,295
2,870
3,158
20.0
22.1
59.5
68.3
54.2
47.2
16.0
16.4
28.5
34.3
9.0
8.2
Indoco Remedies
Neutral
272
-
2,505
1,033
1,199
15.9
18.2
9.4
13.6
28.9
20.0
4.3
3.6
15.7
19.7
2.5
2.2
Ipca labs
Buy
615
900
7,760
3,363
3,909
12.9
18.6
13.4
28.0
45.9
22.0
3.3
2.9
7.4
14.0
2.6
2.2
Lupin
Neutral
1,798
-
80,983
13,092
16,561
25.0
27.0
50.4
68.3
35.7
26.3
7.4
5.8
22.8
24.7
5.9
4.5
Sun Pharma
Accumulate
849
950
204,309
28,163
32,610
25.8
30.7
17.4
26.9
48.8
31.6
4.6
4.0
13.0
16.6
6.7
5.6
Power
Tata Power
Neutral
60
-
16,106
35,923
37,402
22.6
22.8
4.1
5.2
14.7
11.6
1.1
1.1
7.5
9.3
1.4
1.3
NTPC
Buy
125
157
103,027
87,064
98,846
23.5
23.5
11.7
13.2
10.7
9.5
1.2
1.1
11.4
12.1
2.2
2.0
Power Grid
Buy
139
170
72,562
20,702
23,361
86.7
86.4
12.1
13.2
11.5
10.5
1.7
1.5
15.6
15.1
8.4
7.8
Telecom
Bharti Airtel
Neutral
319
-
127,377
101,748
109,191
32.1
31.7
12.0
12.5
26.6
25.5
1.8
1.7
6.9
6.7
1.9
1.7
Idea Cellular
Neutral
109
-
39,191
34,282
36,941
32.0
31.5
5.9
6.2
18.5
17.6
1.7
1.5
9.9
9.3
1.7
1.6
zOthers
Abbott India
Neutral
4,803
-
10,205
2,715
3,153
14.5
14.1
134.3
152.2
35.8
31.6
8.9
7.4
27.4
25.6
3.5
2.9
Bajaj Electricals
Buy
172
290
1,740
4,719
5,287
5.2
5.8
8.6
12.7
20.1
13.6
2.3
2.0
11.4
14.8
0.4
0.3
Finolex Cables
Neutral
229
-
3,505
2,520
2,883
12.2
12.0
12.7
14.2
18.1
16.1
2.5
2.2
13.6
13.5
1.1
1.0
Goodyear India*
Buy
481
582
1,109
1,800
1,600
11.7
11.5
58.7
52.9
8.2
9.1
1.8
1.6
24.6
18.7
0.4
0.4
Hitachi
Neutral
1,059
-
2,879
1,779
2,081
7.8
8.8
21.8
33.4
48.6
31.7
7.8
6.3
17.4
22.1
1.7
1.4
Jyothy Laboratories
Neutral
273
-
4,938
1,620
1,847
11.5
11.5
7.3
8.5
37.4
32.2
4.8
4.5
13.3
14.4
2.9
2.5
MRF
Buy
33,265
45,575
14,108
20,316
14,488
21.4
21.1
5,488.0
3,798.0
6.1
8.8
2.1
1.7
41.1
21.2
0.6
0.9
Page Industries
Neutral
10,760
-
12,001
1,929
2,450
19.8
20.1
229.9
299.0
46.8
36.0
20.7
14.4
52.1
47.1
6.3
4.9
Relaxo Footwears
Neutral
418
-
5,020
1,767
2,152
12.3
12.5
19.3
25.1
21.7
16.7
5.3
4.1
27.7
27.8
2.9
2.4
Siyaram Silk Mills
Buy
1,029
1,354
964
1,636
1,815
11.5
11.5
89.9
104.1
11.4
9.9
1.9
1.6
17.9
17.8
0.8
0.7
Styrolution ABS India*
Neutral
515
-
906
1,271
1,440
8.6
9.2
32.0
41.1
16.1
12.6
1.6
1.5
10.7
12.4
0.7
0.6
Stock Watch
February 16, 2016
Company Name
Reco
CMP
Target
Mkt Cap
Sales ( Čcr )
OPM(%)
EPS (Č)
PER(x)
P/BV(x)
RoE(%)
EV/Sales(x)
(Č)
Price ( Č)
( Č cr )
FY16E
FY17E
FY16E
FY17E
FY16E
FY17E
FY16E
FY17E
FY16E
FY17E
FY16E
FY17E
FY16E
FY17E
zOthers
TVS Srichakra
Buy
2,326
3,217
1,781
2,035
2,252
15.9
15.3
248.6
268.1
9.4
8.7
4.1
2.9
43.6
33.9
0.9
0.8
HSIL
Buy
250
302
1,808
2,123
2,384
16.1
16.5
15.0
18.9
16.6
13.3
1.3
1.2
8.0
9.4
1.2
1.1
Kirloskar Engines India
Neutral
217
-
3,131
2,403
2,554
8.6
9.9
9.2
10.5
23.6
20.6
2.3
2.2
9.7
10.7
0.9
0.9
Ltd
M M Forgings
Buy
416
614
502
511
615
21.7
21.6
43.1
55.8
9.7
7.5
1.8
1.4
19.9
21.2
1.2
0.9
Banco Products (India) Neutral
104
-
744
1,208
1,353
11.0
12.3
10.8
14.5
9.7
7.2
1.1
1.0
11.9
14.5
0.6
0.5
Competent Automobiles Neutral
138
-
85
1,040
1,137
3.2
3.1
25.7
28.0
5.4
4.9
0.8
0.7
15.0
14.3
0.1
0.1
Nilkamal
Neutral
1,099
-
1,640
1,871
2,031
10.7
10.5
63.2
69.8
17.4
15.8
2.8
2.4
17.6
16.6
0.9
0.8
Visaka Industries
Buy
97
144
154
1,086
1,197
9.9
10.3
21.5
28.8
4.5
3.4
0.4
0.4
9.6
11.6
0.4
0.3
Transport Corporation of
Neutral
231
-
1,759
2,830
3,350
8.8
9.0
14.4
18.3
16.1
12.6
2.5
2.2
15.4
17.1
0.7
0.6
India
Elecon Engineering
Neutral
52
-
570
1,359
1,482
10.3
13.7
0.8
3.9
65.2
13.5
1.1
1.0
1.6
7.8
0.8
0.7
Surya Roshni
Buy
135
201
591
2,992
3,223
8.1
8.4
14.7
18.3
9.2
7.4
0.9
0.8
9.7
11.0
0.5
0.4
MT Educare
Neutral
154
-
615
286
366
18.3
17.7
7.7
9.4
20.0
16.5
4.2
3.7
20.2
21.1
2.1
1.6
Radico Khaitan
Buy
99
156
1,322
1,517
1,635
12.7
13.4
5.8
7.1
17.1
14.0
1.5
1.3
8.6
9.6
1.3
1.2
Garware Wall Ropes
Buy
319
473
698
862
974
11.2
11.2
24.9
29.6
12.8
10.8
1.9
1.7
15.1
15.4
0.8
0.7
Wonderla Holidays
Neutral
344
-
1,942
206
308
44.0
43.6
9.0
12.9
38.2
26.7
5.2
4.7
13.7
17.8
9.3
6.2
Linc Pen & Plastics
Neutral
183
-
270
340
371
8.3
8.9
10.8
13.2
16.9
13.9
2.7
2.4
16.0
17.1
0.8
0.8
The Byke Hospitality
Neutral
154
-
616
222
287
20.5
20.5
5.6
7.6
27.2
20.3
5.1
4.2
18.9
20.8
2.8
2.2
Interglobe Aviation
Neutral
839
-
30,236
17,022
21,122
20.7
14.5
63.9
53.7
13.1
15.6
19.7
16.1
149.9
103.2
1.8
1.4
Coffee Day Enterprises
Neutral
225
-
4,630
2,692
2,964
17.0
18.6
-
4.7
-
47.4
2.8
2.6
0.2
5.5
2.1
2.0
Ltd
Navneet Education
Neutral
84
-
1,989
998
1,062
24.1
24.0
5.8
6.1
14.5
13.7
3.2
2.8
22.0
20.6
2.1
2.0
Navkar Corporation
Buy
166
265
2,367
365
436
38.3
37.5
5.6
5.9
29.4
28.2
1.8
1.7
6.3
6.1
7.3
6.3
Source: Company, Angel Research; Note: *December year end; #September year end; &October year end; Price as on February 15, 2016
Market Outlook
February 16, 2016
Research Team Tel: 022 - 39357800
DISCLAIMER
Angel Broking Private Limited (hereinafter referred to as “Angel”) is a registered Member of National Stock Exchange of India Limited,
Bombay Stock Exchange Limited and Metropolitian Stock Exchange of India Limited. It is also registered as a Depository Participant with
CDSL and Portfolio Manager with SEBI. It also has registration with AMFI as a Mutual Fund Distributor. Angel Broking Private Limited is a
registered entity with SEBI for Research Analyst in terms of SEBI (Research Analyst) Regulations, 2014 vide registration number
INH000000164. Angel or its associates has not been debarred/ suspended by SEBI or any other regulatory authority for accessing
/dealing in securities Market. Angel or its associates including its relatives/analyst do not hold any financial interest/beneficial ownership
of more than 1% in the company covered by Analyst. Angel or its associates/analyst has not received any compensation / managed or co
-managed public offering of securities of the company covered by Analyst during the past twelve months. Angel/analyst has not served as
an officer, director or employee of company covered by Analyst and has not been engaged in market making activity of the company
covered by Analyst.
This document is solely for the personal information of the recipient, and must not be singularly used as the basis of any investment
decision. Nothing in this document should be construed as investment or financial advice. Each recipient of this document should make
such investigations as they deem necessary to arrive at an independent evaluation of an investment in the securities of the companies
referred to in this document (including the merits and risks involved), and should consult their own advisors to determine the merits and
risks of such an investment.
Reports based on technical and derivative analysis center on studying charts of a stock's price movement, outstanding positions and
trading volume, as opposed to focusing on a company's fundamentals and, as such, may not match with a report on a company's
fundamentals.
The information in this document has been printed on the basis of publicly available information, internal data and other reliable sources
believed to be true, but we do not represent that it is accurate or complete and it should not be relied on as such, as this document is for
general guidance only. Angel Broking Pvt. Limited or any of its affiliates/ group companies shall not be in any way responsible for any
loss or damage that may arise to any person from any inadvertent error in the information contained in this report. Angel Broking Pvt.
Limited has not independently verified all the information contained within this document. Accordingly, we cannot testify, nor make any
representation or warranty, express or implied, to the accuracy, contents or data contained within this document. While Angel Broking
Pvt. Limited endeavors to update on a reasonable basis the information discussed in this material, there may be regulatory, compliance,
or other reasons that prevent us from doing so.
This document is being supplied to you solely for your information, and its contents, information or data may not be reproduced,
redistributed or passed on, directly or indirectly.
Neither Angel Broking Pvt. Limited, nor its directors, employees or affiliates shall be liable for any loss or damage that may arise from or
in connection with the use of this information.
Note: Please refer to the important ‘Stock Holding Disclosure' report on the Angel website (Research Section). Also, please refer to the
latest update on respective stocks for the disclosure status in respect of those stocks. Angel Broking Pvt. Limited and its affiliates may have
investment positions in the stocks recommended in this report.