Market Outlook
March 15, 2016
Market Cues
Domestic Indices
Chg (%)
(Pts)
(Close)
Indian markets are expected to open flat tracking SGX Nifty and some of the Asian
BSE Sensex
0.3
86
24,804
peers.
Nifty
0.4
29
7,539
Mid Cap
0.3
32
10,303
U.S. stocks closed mixed in low volume trade on Monday, mostly shaking off decline
Small Cap
0.4
43
10,321
in oil prices ahead of the Fed meeting later in the week. Dow Jones hit new highs for
2016 on Monday, while S&P 500 edged lower as losses in Materials and Energy
Bankex
0.8
139
17,386
sector capped gains seen across Consumer-discretionary sector.
Global Indices
Chg (%)
(Pts)
(Close)
Key European indices ended Monday’s trading session in green. German DAX
powered through 10,000 level before easing back to close 1.6% higher. FTSE 100
Dow Jones
0.1
16
17,229
was up 0.6%, mainly on account of mining stocks which were amongst the day’s
Nasdaq
0.0
2
4,750
best gainers. Anglo American and Glencore were amongst the biggest gainers.
FTSE
0.6
35
6,175
Indian markets gained for second consecutive session. Equity indices closed in green
Nikkei
1.7
295
17,234
from day's high amidst volatility, tracking positive global cues. FMCG, Oil, Metals
Hang Seng
1.2
236
20,435
and select banking stocks helped the market.
Shanghai Com
1.8
49
2,859
News & Result Analysis
Advances / Declines
BSE
NSE
CPI reverses its rising trend; WPI falls for 16th consecutive month
Wipro makes strategic investment in Emailage Corp
Advances
1,326
650
Road Ministry to raise `50,000cr for highway expansion projects
Declines
1,349
903
Detailed analysis on Pg2
Unchanged
159
73
Investor’s Ready Reckoner
Volumes (` Cr)
Key Domestic & Global Indicators
BSE
4,253
Stock Watch: Latest investment recommendations on 150+ stocks
NSE
26,081
Refer Pg5 onwards
Top Picks
Net Inflows (` Cr)
Net
Mtd
Ytd
CMP
Target
Upside
Company
Sector
Rating
FII
439
10,005
(24,207)
(`)
(`)
(%)
Amara Raja Batteries Auto & Auto Ancillary
Buy
912
1,040
14.0
MFs
(475)
(2,430)
78,609
HCL Tech
IT
Buy
827
1,038
25.4
LIC Housing Finance Financials
Buy
456
592
29.7
Top Gainers
Price (`)
Chg (%)
Bharat Electronics
Capital Goods
Buy
1,075
1,414
31.6
Corpbank
42
7.4
Navkar Corporation Others
Buy
163
265
62.7
Suntv
369
7.4
More Top Picks on Pg4
Crompgreav
155
5.9
Key Upcoming Events
Aiaeng
874
5.9
Previous
Consensus
Date
Region
Event Description
Bhusanstl
38
5.7
Reading
Expectations
Mar 15 US
Retail Sales (MoM)
0.2%
(0.1%)
Mar 16 US
Housing Stats
1.099M
1.150M
Top Losers
Price (`)
Chg (%)
Mar 16 GBP
Unemployment Rate (Jan)
5.1%
5.1%
Pfizer
1,761
(8.7)
Mar 16 USD
Crude Oil Inventories
3.880M
Coalindia
297
(7.0)
6.(
Jpinfratec
9
(5.7)
Jindalstel
60
(4.9)
Aloktext
4
(4.6)
As on March 14, 2016
Market Outlook
March 15, 2016
CPI reverses its rising trend; WPI falls for 16th consecutive month
The wholesale price index (WPI) based inflation declined for the 16th consecutive
month in February, coming at -0.91% as compared to -0.90% in January.
Consumer price inflation index falls to 5.18% for the month of February 2016
thereby reversing its previous 5 consecutive month rising trend. The surprise fall in
prices was led by a greater-than-expected slump in food inflation, which fell to
5.3%t from 6.85% month-on-month. On a positive surprise, prices of vegetables
grew marginal 0.7% vs 6.39% in January. Retail Food Inflation eased to 5.3% as
compared to 6.85% in January. This has raised expectations from the RBI for an
early rate cut and by a higher magnitude than expected earlier. We expect rate
sensitive sectors to benefit with inflations coming down .The next RBI Bi-monthly
monetary policy will be announced on April 5, 2016.
Below is a summary of the Inflation rates (%) for the major groups:
Exhibit 1: Inflation Data
Jan-16 Inflation
Feb-16 Inflation
Group
Change (%)
Rate (%)
Rate (%)
Food and beverages
6.66
5.52
(1.14)
Pan, tobacco and intoxicants
9.03
8.39
(0.64)
Clothing and footwear
5.71
5.52
(0.19)
Housing
5.20
5.33
0.13
Fuel and Light
5.32
4.59
(0.73)
Miscellaneous
3.95
4.38
0.43
General Index (All Groups)
5.69
5.18
(0.51)
Source: Company
Wipro makes strategic investment in Emailage Corp
Wipro announced that it has made an undisclosed investment to pick up less than
5% stake in Emailage Corp, a US risk assessment and fraud prevention company.
This investment is in line with Wipro’s strategy to participate in external innovation
ecosystem, for which the company has set up an investment arm, Wipro Ventures
Emailage, is Arizona based risk assessment and fraud prevention company, with
presence its across Brazil and the United Kingdom and works with Fortune 500
financial institutions, merchants, businesses and organizations globally.
Founded in 2012, Emailage generated approx. $1.5mn of revenues for FY2015
(December year ending).
This is Wipro ventures seventh investment in the last 2 years, the last 3 being-
Vicarious, Talena and Drivestream, all from the U.S.
Given the size of this acquisition, we sense that financials of the company would
not be much affected. We maintain BUY rating on the stock with price target of
`680.
Market Outlook
March 15, 2016
Road Ministry to raise `50,000cr for highway expansion projects
As per media reports, Ministry of Road Transport & Highways (MoRTH) is in talks to
raise about `50,000cr from Employees Provident Fund Organisation (EPFO) and
Life Insurance Corporation (LIC).
The highways ministry plans to use the funds for medium sized highway projects
that would be constructed under Engineering Procurement and Construction (EPC)
model, which is fully government funded.
The Highway ministry has also approached the German, Canadian and Dutch
pension funds to invest in India's highway sector by taking up government-
constructed highway projects under the Toll, Operate and Transfer (TOT) model.
Under the TOT model, roads already built by National Highways Authority of India
(NHAI) are awarded to private sector in lieu of an upfront fee. The private party
operates the highway stretch and collects tolls on it for a long-term period.
We view this development to be a big positive for the Roads & Highways sector, as
it opens up one more funding avenue for MoRTH to fund its road projects. With
MoRTH offering toll guarantee and ~10% revenue growth seen across toll
projects, we are of optimistic that entities like, EPFO, LIC and other International
pension funds would find investment in the Indian Roads and Highways sector to
be now more attractive.
This fund raising strategy should support government’s initiative to upgrade
~50,000kms of state highways in to National Highways in the next fiscal year. As
a result, awarding activity would further gain traction in the next fiscal, which in-
turn should benefit road EPC players. We maintain BUY on Sadbhav Eng., KNR
Construction and MBL Infrastructure.
Economic and Political News
Rain, hail hit standing crops
Telangana presents `1.30lakh cr Budget
Corporate News
Jindal Power sells 4.12% stake in Indian Energy Exchange
ONGC to invest in KG basin: Sarraf
SpiceJet, Maran agree to resolve warrants' issue
Market Outlook
March 15, 2016
Top Picks ★★★★★
Large Cap
Market Cap
CMP
Target
Upside
Company
Rationale
(` Cr)
(`)
(`)
(%)
To outpace battery industry growth due to better technological
Amara Raja Batteries
15,580
912
1,040
14.0
products leading to market share gains in both the automotive
OEM and replacement segments.
Earnings to grow strongly given the MHCV cyclical upturn.
Ashok Leyland
27,648
97
111
14.3
Focus on exports and LCV's provides additional growth
avenue.
Uptick in defense capex by government when coupled with
Bharat Electronics
25,793
1,075
1,414
31.6
BELs strong market positioning, indicate that good times are
ahead for BEL.
The stock is trading at attractive valuations and is factoring all
HCL Tech
116,674
827
1,038
25.4
the bad news.
Strong visibility for a robust 20% earnings trajectory, coupled
HDFC Bank
259,644
1,028
1,262
22.8
with high quality of earnings on account of high quality retail
business and strategic focus on highly rated corporates.
Back on the growth trend, expect a long term growth of 14%
Infosys
262,926
1,141
1,347
18.1
to be a US$20bn in FY2020.
LICHF continues to grow its retail loan book at a healthy pace
with improvement in asset quality. We expect the company to
LIC Housing Finance
23,023
456
592
29.7
post a healthy loan book which is likely to reflect in a strong
earnings growth.
Huge bid pipeline of re-development works at Delhi and other
NBCC
11,137
928
1,089
17.3
State Governments and opportunity from Smart City, positions
NBCC to report strong growth, going forward.
New launches to enable outpace industry growth; margins
TVS Motors
13,713
289
330
14.3
expansion to boost earnings.
Source: Company, Angel Research
Mid Cap
Market Cap
CMP
Target
Upside
Company
Rationale
(` Cr)
(`)
(`)
(%)
Favourable outlook for the AC industry to augur well for
Cooling products business which is out pacing the market
Blue Star
3,003
334
439
31.5
growth. EMPPAC division's profitability to improve once
operating environment turns around.
Commencement of new projects, downtrend in the interest rate
IL&FS Transport
2,434
74
93
25.7
cycle, to lead to stock re-rating
Economic recovery to have favourable impact on advertising &
circulation revenue growth. Further, the acquisition of a radio
Jagran Prakashan
4,961
152
189
24.5
business (Radio City) would also boost the company's revenue
growth.
Speedier execution and speedier sales, strong revenue visibilty
Mahindra Lifespace
1,738
424
554
30.8
in short-to-long run, attractive valuations
Massive capacity expansion along with rail advantage at ICD
Navkar Corporation
2,317
162
265
63.1
as well CFS augurs well for the company
Earnings boost on back of stable material prices and
Radico Khaitan
1,330
100
156
56.1
favourable pricing environment. Valuation discount to peers
provides additional comfort
Strong brands and distribution network would boost growth
Siyaram Silk Mills
935
997
1,354
35.8
going ahead. Stock currently trades at an inexpensive
valuation.
Source: Company, Angel Research
Market Outlook
March 15, 2016
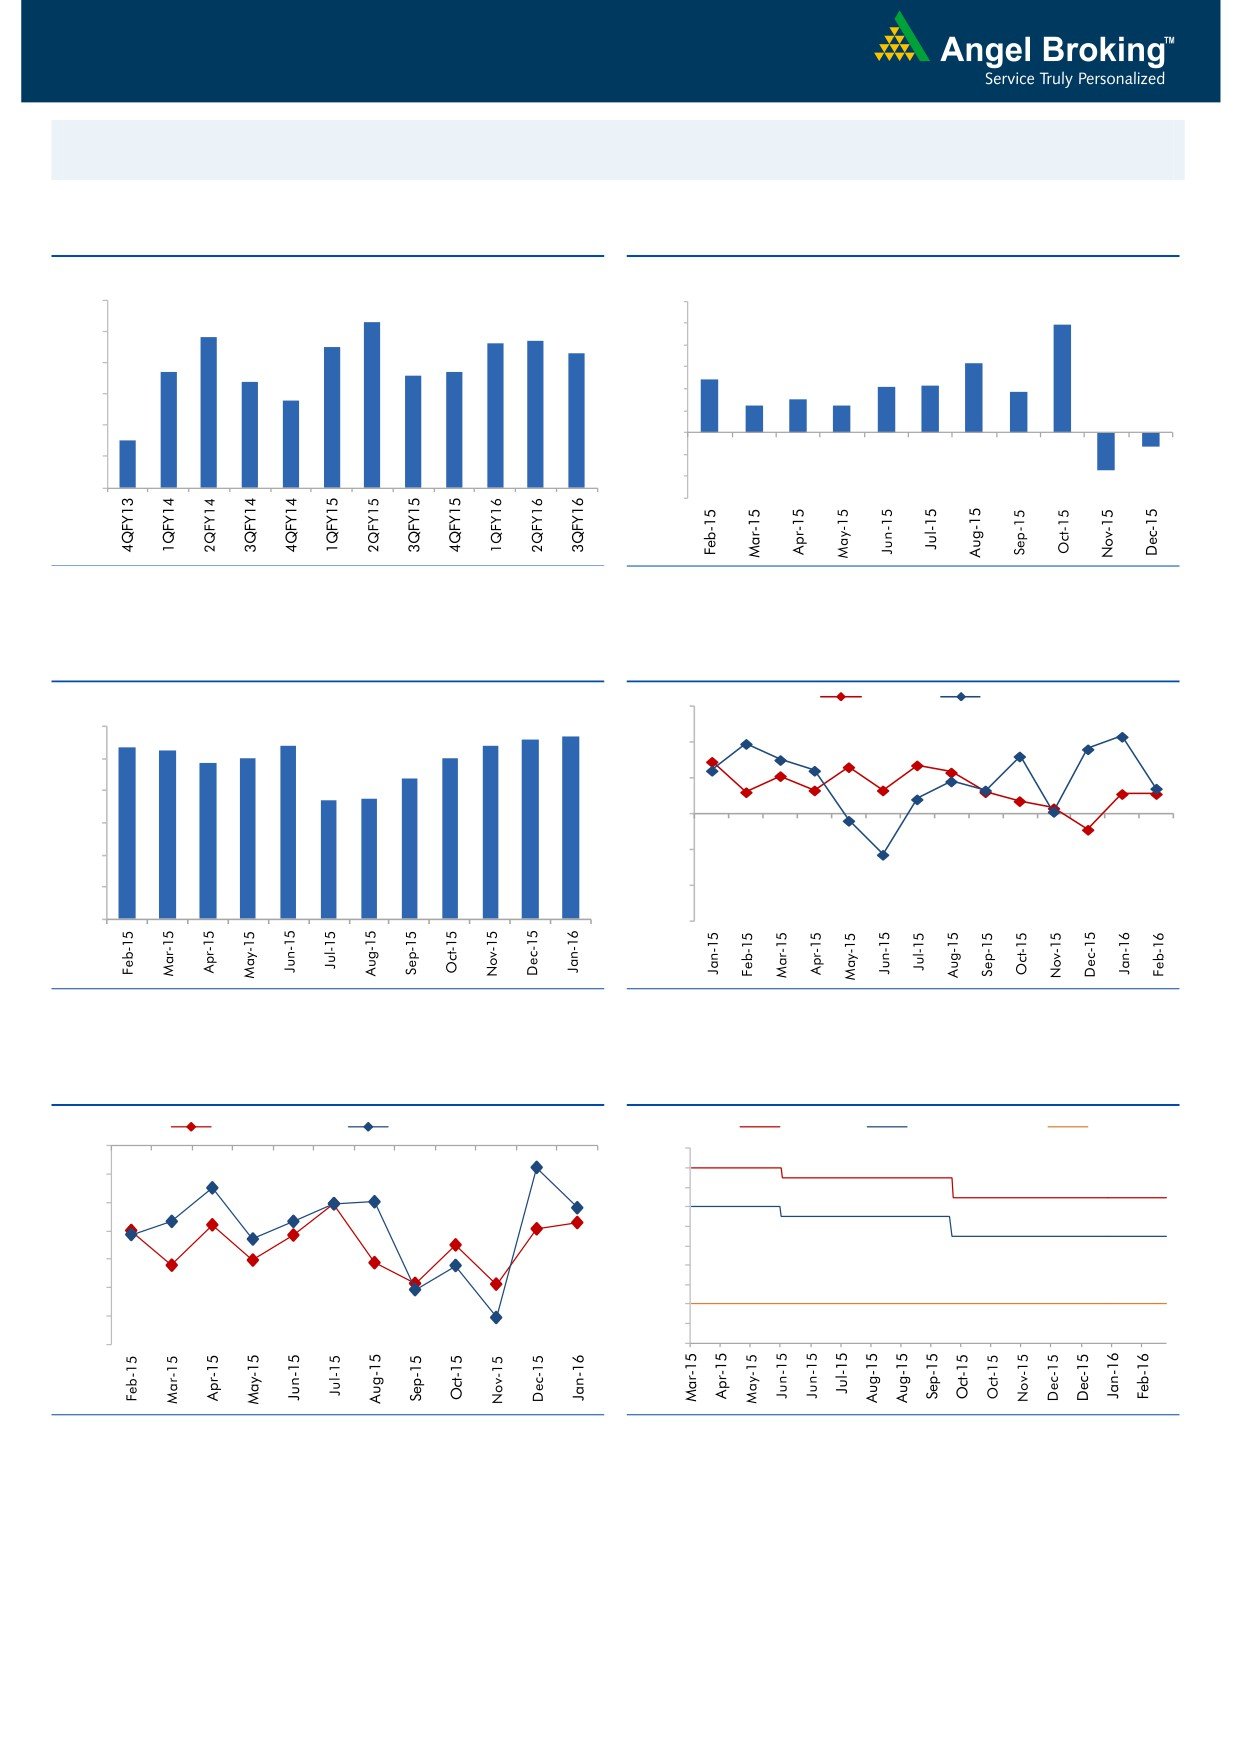
Macro watch
Exhibit 1: Quarterly GDP trends
Exhibit 2: IIP trends
(%)
(%)
9.0
12.0
8.3
9.9
7.8
7.6
7.7
10.0
8.0
7.5
7.3
8.0
6.3
6.7
6.6
6.7
7.0
6.4
4.8
6.0
4.2
4.3
3.7
5.8
3.0
4.0
2.5
2.5
6.0
2.0
5.0
4.5
-
4.0
(2.0)
(1.3)
(4.0)
3.0
(3.4)
(6.0)
Source: CSO, Angel Research
Source: MOSPI, Angel Research
Exhibit 3: Monthly CPI inflation trends
Exhibit 4: Manufacturing and services PMI
Mfg. PMI
Services PMI
(%)
56.0
5.6
5.7
6.0
5.4
5.4
5.4
5.3
4.9
5.0
5.0
54.0
5.0
4.4
3.7
3.7
52.0
4.0
50.0
3.0
48.0
2.0
1.0
46.0
-
44.0
Source: MOSPI, Angel Research
Source: Market, Angel Research; Note: Level above 50 indicates expansion
Exhibit 5: Exports and imports growth trends
Exhibit 6: Key policy rates
(%)
Exports yoy growth
Imports yoy growth
(%)
Repo rate
Reverse Repo rate
CRR
0.0
8.00
7.50
(5.0)
7.00
(10.0)
6.50
6.00
(15.0)
5.50
(20.0)
5.00
(25.0)
4.50
4.00
(30.0)
3.50
(35.0)
3.00
Source: Bloomberg, Angel Research
Source: RBI, Angel Research
Market Outlook
March 15, 2016
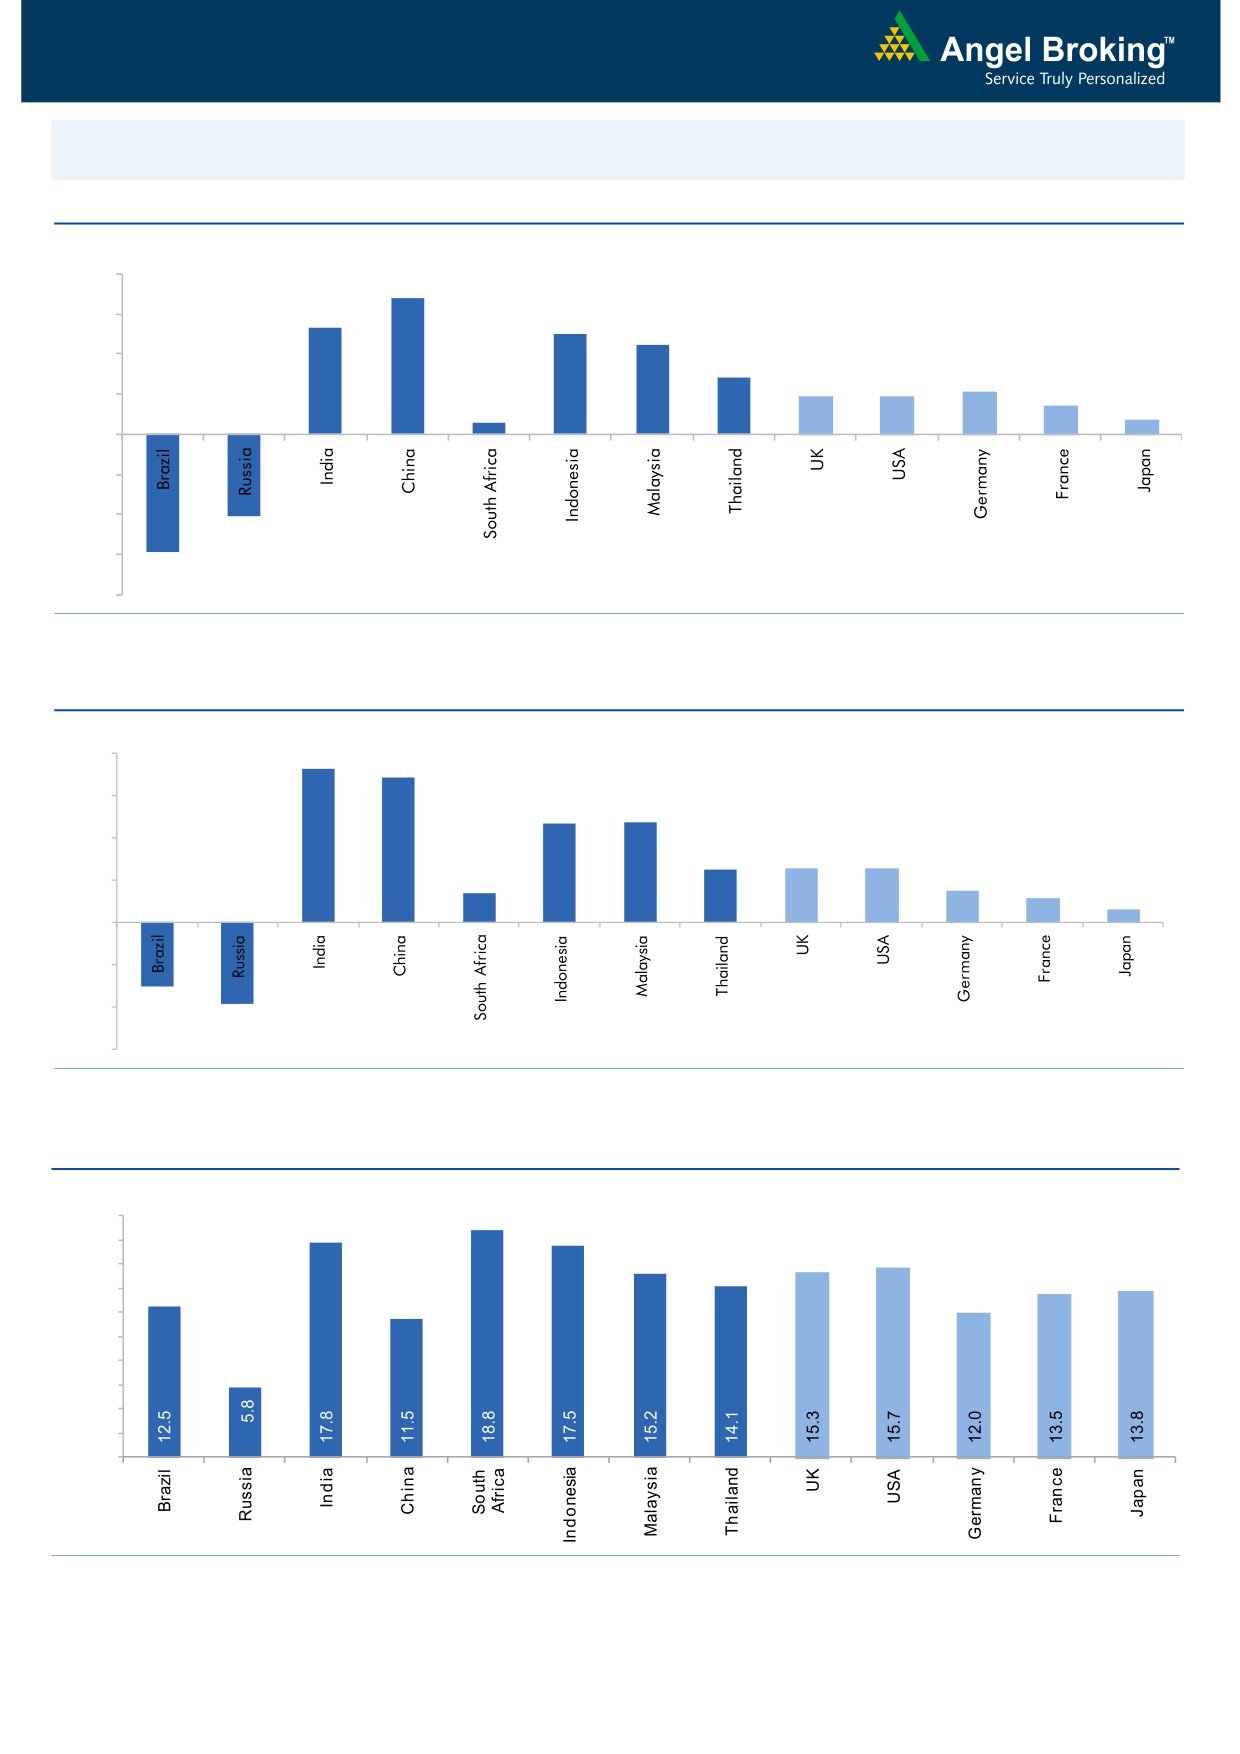
Global watch
Exhibit 1: Latest quarterly GDP Growth (%, yoy) across select developing and developed countries
(%)
8.0
6.8
6.0
5.3
5.0
4.5
4.0
2.8
1.9
1.9
2.1
1.4
2.0
0.6
0.7
-
(2.0)
(4.0)
(4.1)
(6.0)
(5.9)
(8.0)
Source: Bloomberg, Angel Research
Exhibit 2: 2015 GDP Growth projection by IMF (%, yoy) across select developing and developed countries
(%)
8.0
7.3
6.8
6.0
4.7
4.7
4.0
2.5
2.5
2.6
1.4
1.5
2.0
1.2
0.6
-
(2.0)
(3.0)
(4.0)
(3.8)
(6.0)
Source: IMF, Angel Research
Exhibit 3: One year forward P-E ratio across select developing and developed countries
(x)
20.0
18.0
16.0
14.0
12.0
10.0
8.0
6.0
4.0
2.0
-
Source: IMF, Angel Research
Market Outlook
March 15, 2016
Exhibit 4: Relative performance of indices across globe
Returns (%)
Country
Name of index
Closing price
1M
3M
1YR
Brazil
Bovespa
48,867
24.3
7.7
(3.0)
Russia
Micex
1,865
8.2
7.1
12.1
India
Nifty
7,539
4.5
(1.9)
(13.5)
China
Shanghai Composite
2,859
2.8
(18.2)
(12.4)
South Africa
Top 40
46,556
10.7
5.2
1.5
Mexico
Mexbol
44,692
5.5
5.3
1.6
Indonesia
LQ45
852
0.7
8.2
(10.7)
Malaysia
KLCI
1,700
3.4
1.9
(5.9)
Thailand
SET 50
900
9.4
8.3
(12.5)
USA
Dow Jones
17,229
8.3
(1.5)
(4.2)
UK
FTSE
6,175
11.5
1.4
(9.7)
Japan
Nikkei
17,234
9.7
(11.6)
(8.1)
Germany
DAX
9,990
14.1
(5.7)
(16.6)
France
CAC
4,507
15.7
(0.9)
(11.4)
Source: Bloomberg, Angel Research
Stock Watch
March 15, 2016
Company Name
Reco
CMP
Target
Mkt Cap
Sales ( Čcr )
OPM(%)
EPS (Č)
PER(x)
P/BV(x)
RoE(%)
EV/Sales(x)
(Č)
Price ( Č)
( Č cr )
FY16E FY17E
FY16E
FY17E
FY16E
FY17E
FY16E
FY17E
FY16E
FY17E
FY16E
FY17E
FY16E
FY17E
Agri / Agri Chemical
Rallis
Neutral
162
-
3,142
2,097
2,415
14.4
14.4
9.5
11.0
17.0
14.7
3.4
2.9
21.1
21.3
1.5
1.3
United Phosphorus
Accumulate
440
480
18,861
12,500
14,375
18.3
18.3
29.8
35.9
14.8
12.3
2.7
2.3
20.0
20.3
1.6
1.3
Auto & Auto Ancillary
Ashok Leyland
Accumulate
97
111
27,648
17,995
21,544
11.4
11.6
3.4
4.7
28.6
20.7
5.0
4.6
17.7
22.2
1.5
1.2
Bajaj Auto
Accumulate
2,313
2,585
66,932
22,709
25,860
20.9
20.1
129.0
143.6
17.9
16.1
5.5
4.7
30.7
29.4
2.5
2.2
Bharat Forge
Accumulate
816
875
19,005
7,351
8,318
19.9
19.7
31.2
36.5
26.2
22.4
4.7
4.0
19.3
19.2
2.7
2.4
Eicher Motors
Neutral
19,850
-
53,915
15,556
16,747
15.5
17.3
464.8
597.5
42.7
33.2
15.6
11.5
36.2
34.3
3.4
3.1
Gabriel India
Buy
87
101
1,252
1,415
1,544
8.7
9.0
4.6
5.4
19.0
16.1
3.4
3.1
18.1
18.9
0.9
0.8
Hero Motocorp
Neutral
2,817
-
56,255
28,244
30,532
15.5
15.9
156.7
168.5
18.0
16.7
7.2
6.1
39.9
36.4
1.8
1.7
Jamna Auto Industries Buy
134
160
1,068
1,281
1,473
11.2
11.5
7.6
9.2
17.6
14.5
4.4
3.6
25.4
25.2
0.9
0.8
L G Balakrishnan & Bros Neutral
425
-
667
1,254
1,394
11.6
11.8
35.9
41.7
11.9
10.2
1.6
1.4
13.5
13.8
0.6
0.6
Mahindra and Mahindra Accumulate
1,211
1,364
75,214
38,416
42,904
13.7
13.9
54.8
63.4
22.1
19.1
3.4
3.0
15.4
15.8
1.6
1.4
Maruti
Neutral
3,649
-
110,240
57,865
68,104
16.4
16.7
176.3
225.5
20.7
16.2
4.0
3.4
19.4
21.2
1.7
1.4
Minda Industries
Accumulate
927
1,047
1,470
2,523
2,890
8.7
9.0
55.0
65.4
16.9
14.2
3.3
2.6
19.3
18.7
0.7
0.6
Motherson Sumi
Buy
249
313
32,949
39,343
45,100
8.8
9.1
10.1
12.5
24.7
19.9
7.8
6.1
35.3
34.4
0.9
0.8
Rane Brake Lining
Buy
384
465
304
454
511
11.5
12.0
25.2
31.0
15.2
12.4
2.3
2.1
14.9
16.6
0.8
0.7
Setco Automotive
Neutral
31
-
407
594
741
12.7
13.7
1.7
3.2
17.9
9.5
1.9
1.6
10.4
16.9
1.1
0.9
Tata Motors
Neutral
366
-
105,643
259,686
273,957
13.0
13.4
25.9
29.5
14.1
12.4
1.9
1.6
8.0
9.0
0.6
0.6
TVS Motor
Accumulate
289
330
13,713
11,263
13,122
6.9
8.5
9.2
15.0
31.4
19.2
7.2
5.7
22.7
29.6
1.2
1.0
Amara Raja Batteries
Buy
912
1,040
15,580
4,892
5,871
17.4
17.6
28.8
37.1
31.7
24.6
7.4
5.9
23.4
24.1
3.1
2.5
Exide Industries
Buy
137
162
11,628
6,950
7,784
14.4
14.8
6.6
7.3
20.7
18.7
2.6
2.4
12.6
12.8
1.3
1.2
Apollo Tyres
Accumulate
169
183
8,625
12,056
12,714
17.2
16.4
23.0
20.3
7.4
8.4
1.3
1.1
17.7
13.6
0.8
0.8
Ceat
Accumulate
1,079
1,119
4,364
6,041
6,597
14.1
13.7
99.5
111.9
10.8
9.6
2.1
1.8
19.6
18.5
0.9
0.7
JK Tyres
Neutral
81
-
1,833
7,446
7,669
15.2
14.0
19.6
18.4
4.1
4.4
1.0
0.9
25.2
19.5
0.6
0.6
Swaraj Engines
Accumulate
850
919
1,055
552
630
14.2
14.7
44.6
54.1
19.1
15.7
4.4
4.0
23.2
25.6
1.8
1.5
Subros
Neutral
84
-
505
1,293
1,527
11.8
11.9
4.2
6.7
20.1
12.6
1.5
1.4
7.7
11.5
0.7
0.6
Indag Rubber
Neutral
167
-
439
283
329
17.0
17.2
13.0
15.4
12.9
10.8
2.8
2.3
21.8
21.6
1.3
1.1
Capital Goods
ACE
Neutral
38
-
373
660
839
4.7
8.2
1.0
3.9
37.7
9.7
1.2
1.1
3.2
11.3
0.7
0.6
BEML
Accumulate
1,035
1,157
4,309
3,277
4,006
6.0
8.9
36.2
64.3
28.6
16.1
2.0
1.8
5.7
11.7
1.4
1.1
Bharat Electronics
Buy
1,075
1,414
25,793
7,737
8,634
16.8
17.2
54.0
61.5
19.9
17.5
2.8
2.5
39.3
45.6
2.5
2.1
Stock Watch
March 15, 2016
Company Name
Reco
CMP
Target
Mkt Cap
Sales ( Čcr )
OPM(%)
EPS (Č)
PER(x)
P/BV(x)
RoE(%)
EV/Sales(x)
(Č)
Price ( Č)
( Č cr )
FY16E
FY17E
FY16E
FY17E
FY16E
FY17E
FY16E
FY17E
FY16E
FY17E
FY16E
FY17E
FY16E
FY17E
Capital Goods
Voltas
Buy
249
353
8,239
5,363
5,963
8.0
9.1
11.0
13.8
22.6
18.0
3.5
3.0
16.2
17.9
1.5
1.3
BGR Energy
Neutral
103
-
745
3,615
3,181
9.5
9.4
16.7
12.4
6.2
8.3
0.6
0.6
10.0
7.0
0.6
0.8
BHEL
Neutral
106
-
25,847
33,722
35,272
10.8
11.7
10.5
14.2
10.1
7.4
0.7
0.7
7.0
9.0
0.8
0.8
Blue Star
Buy
344
439
3,096
3,548
3,977
6.3
6.9
13.7
17.2
25.1
20.1
6.3
4.1
26.1
25.4
0.9
0.8
Crompton Greaves
Neutral
155
-
9,715
13,484
14,687
4.9
6.2
4.5
7.1
34.4
21.8
2.4
2.3
7.2
10.8
0.8
0.7
Greaves Cotton
Neutral
125
-
3,055
1,655
1,755
16.6
16.8
7.4
7.8
16.9
16.0
3.4
3.2
21.1
20.6
1.8
1.7
Inox Wind
Buy
253
458
5,606
4,980
5,943
17.0
17.5
26.6
31.6
9.5
8.0
2.8
2.1
35.0
30.0
1.3
1.0
KEC International
Neutral
117
-
2,995
8,791
9,716
6.1
6.8
5.4
8.2
21.6
14.2
2.2
2.0
10.0
14.0
0.6
0.5
Thermax
Neutral
759
-
9,042
6,413
7,525
7.4
8.5
30.5
39.3
24.9
19.3
3.8
3.3
15.0
17.0
1.4
1.1
Cement
ACC
Neutral
1,234
-
23,164
13,151
14,757
16.4
18.3
63.9
83.4
19.3
14.8
2.5
2.3
13.3
16.1
1.6
1.3
Ambuja Cements
Neutral
204
-
31,612
11,564
12,556
19.4
20.7
8.9
10.1
22.9
20.2
2.9
2.7
12.8
13.8
2.3
2.1
HeidelbergCement
Neutral
73
-
1,663
1,772
1,926
13.3
15.4
1.0
3.0
73.4
24.5
1.9
1.7
2.6
7.9
1.5
1.3
India Cements
Neutral
75
-
2,310
4,216
4,840
18.0
19.5
4.0
9.9
18.8
7.6
0.8
0.7
4.0
9.5
0.9
0.7
JK Cement
Neutral
566
-
3,959
3,661
4,742
10.1
15.8
7.5
28.5
75.5
19.9
2.3
2.0
7.5
22.9
1.6
1.2
J K Lakshmi Cement
Neutral
292
-
3,431
2,947
3,616
16.7
19.9
11.5
27.2
25.4
10.7
2.4
2.1
9.8
20.8
1.6
1.3
Mangalam Cements
Neutral
182
-
486
1,053
1,347
10.5
13.3
8.4
26.0
21.7
7.0
0.9
0.8
4.3
12.5
0.8
0.6
Orient Cement
Neutral
132
-
2,710
1,854
2,524
21.2
22.2
7.7
11.1
17.2
11.9
2.5
2.1
13.3
15.7
2.3
1.6
Ramco Cements
Neutral
389
-
9,259
4,036
4,545
20.8
21.3
15.1
18.8
25.8
20.7
3.2
2.8
12.9
14.3
2.8
2.4
Shree Cement^
Neutral
11,496
-
40,050
7,150
8,742
26.7
28.6
228.0
345.5
50.4
33.3
7.4
6.2
15.7
20.3
5.2
4.2
UltraTech Cement
Neutral
3,008
-
82,557
24,669
29,265
18.2
20.6
82.0
120.0
36.7
25.1
3.9
3.5
11.3
14.7
3.4
2.9
Construction
ITNL
Buy
72
93
2,377
7,360
8,825
34.0
35.9
7.0
9.0
10.3
8.0
0.4
0.3
3.2
3.7
3.7
3.6
KNR Constructions
Buy
517
603
1,454
937
1,470
14.3
14.0
44.2
38.6
11.7
13.4
2.3
2.0
15.4
15.4
1.6
1.1
Larsen & Toubro
Accumulate
1,184
1,310
110,264
58,870
65,708
8.3
10.3
42.0
53.0
28.2
22.3
2.0
1.8
8.8
11.2
2.1
1.9
Gujarat Pipavav Port
Neutral
159
-
7,667
629
684
51.0
52.2
6.4
5.9
24.8
26.9
3.3
3.0
15.9
12.7
11.8
10.7
MBL Infrastructures
Buy
137
285
569
2,313
2,797
12.2
14.6
19.0
20.0
7.2
6.9
0.8
0.7
11.3
10.6
1.0
0.9
Nagarjuna Const.
Neutral
67
-
3,744
7,892
8,842
8.8
9.1
3.0
5.3
22.5
12.7
1.1
1.0
5.0
8.5
0.7
0.6
PNC Infratech
Accumulate
489
558
2,507
1,873
2,288
13.2
13.5
24.0
32.0
20.4
15.3
2.0
1.8
12.1
12.3
1.5
1.2
Simplex Infra
Neutral
222
-
1,097
5,955
6,829
10.3
10.5
16.0
31.0
13.9
7.2
0.7
0.7
5.3
9.9
0.7
0.6
Power Mech Projects
Neutral
563
-
829
1,539
1,801
12.8
12.7
59.0
72.1
9.6
7.8
1.4
1.2
18.6
16.8
0.6
0.5
Stock Watch
March 15, 2016
Company Name
Reco
CMP
Target
Mkt Cap
Sales ( Čcr )
OPM(%)
EPS (Č)
PER(x)
P/BV(x)
RoE(%)
EV/Sales(x)
(Č)
Price ( Č)
( Č cr )
FY16E
FY17E
FY16E
FY17E
FY16E
FY17E
FY16E
FY17E
FY16E
FY17E
FY16E
FY17E
FY16E
FY17E
Construction
Sadbhav Engineering
Buy
252
289
4,318
3,481
4,219
10.7
10.8
8.2
11.7
30.7
21.5
2.9
2.6
10.3
13.5
1.5
1.2
NBCC
Buy
928
1,089
11,137
5,816
7,382
6.9
7.7
29.6
39.8
31.4
23.3
5.6
4.4
24.1
26.7
1.7
1.3
MEP Infra
Neutral
38
-
625
1,956
1,876
28.1
30.5
1.3
3.0
29.6
12.8
6.2
4.2
21.2
32.8
1.7
1.7
SIPL
Neutral
87
-
3,078
675
1,042
62.4
64.7
-
-
3.3
3.7
-
-
16.4
11.0
Financials
Allahabad Bank
Neutral
52
-
3,105
8,569
9,392
2.8
2.9
16.3
27.5
3.2
1.9
0.3
0.2
7.6
11.9
-
-
Axis Bank
Buy
416
494
99,048
26,473
31,527
3.5
3.6
35.7
43.5
11.6
9.6
2.0
1.7
17.9
18.9
-
-
Bank of Baroda
Neutral
141
-
32,489
18,485
21,025
1.9
2.0
13.5
21.1
10.5
6.7
0.8
0.7
7.3
10.6
-
-
Bank of India
Neutral
94
-
7,616
15,972
17,271
1.9
2.0
15.3
33.4
6.1
2.8
0.3
0.2
3.6
7.6
-
-
Canara Bank
Neutral
185
-
10,051
15,441
16,945
2.0
2.1
46.6
70.4
4.0
2.6
0.4
0.3
8.0
11.2
-
-
Dena Bank
Neutral
28
-
1,829
3,440
3,840
2.1
2.3
7.3
10.0
3.9
2.8
0.3
0.2
6.1
7.9
-
-
Federal Bank
Neutral
48
-
8,280
3,477
3,999
3.0
3.0
5.0
6.2
9.6
7.7
1.0
0.9
10.6
11.9
-
-
HDFC
Neutral
1,156
-
182,578
10,358
11,852
3.3
3.3
41.1
47.0
28.2
24.6
5.4
4.9
24.7
24.9
-
-
HDFC Bank
Buy
1,028
1,262
259,644
38,309
47,302
4.3
4.3
49.3
61.1
20.8
16.8
3.6
3.1
18.5
19.7
-
-
ICICI Bank
Buy
222
254
128,889
34,279
39,262
3.3
3.3
21.0
24.4
10.6
9.1
1.8
1.5
14.4
14.7
-
-
IDBI Bank
Neutral
64
-
12,227
9,625
10,455
1.8
1.8
8.5
14.2
7.6
4.5
0.5
0.4
5.9
9.3
-
-
Indian Bank
Neutral
101
-
4,841
6,160
6,858
2.5
2.5
24.5
29.8
4.1
3.4
0.3
0.3
7.7
8.6
-
-
LIC Housing Finance
Buy
456
592
23,023
3,101
3,745
2.5
2.5
33.0
40.2
13.8
11.4
2.6
2.2
19.7
20.5
-
-
Oriental Bank
Neutral
88
-
2,648
7,643
8,373
2.4
2.4
37.2
45.4
2.4
1.9
0.2
0.2
8.2
9.4
-
-
Punjab Natl.Bank
Neutral
82
-
16,170
23,638
26,557
2.8
2.8
17.9
27.2
4.6
3.0
0.5
0.4
8.5
12.0
-
-
South Ind.Bank
Neutral
17
-
2,350
1,965
2,185
2.5
2.5
2.5
3.3
7.0
5.3
0.7
0.6
9.5
11.7
-
-
St Bk of India
Neutral
182
-
141,205
79,958
86,061
2.6
2.6
13.4
20.7
13.6
8.8
1.1
1.0
11.5
12.8
-
-
Union Bank
Neutral
125
-
8,590
12,646
14,129
2.3
2.4
31.0
39.1
4.0
3.2
0.4
0.4
9.8
11.4
-
-
Vijaya Bank
Neutral
31
-
2,689
3,536
3,827
1.9
1.9
5.5
6.7
5.7
4.7
0.5
0.4
7.8
8.8
-
-
Yes Bank
Neutral
803
-
33,739
7,190
9,011
3.2
3.3
58.2
69.7
13.8
11.5
2.5
2.1
19.2
19.6
-
-
FMCG
Asian Paints
Neutral
897
-
86,069
16,553
19,160
16.0
16.2
17.7
21.5
50.8
41.7
13.5
12.1
29.4
31.2
5.0
4.3
Britannia
Neutral
2,822
-
33,861
8,481
9,795
14.0
14.1
65.5
78.3
43.1
36.0
20.4
16.7
38.3
41.2
3.9
3.3
Colgate
Neutral
844
-
22,968
4,836
5,490
19.5
19.7
48.5
53.2
17.4
15.9
12.8
11.1
99.8
97.5
4.5
3.9
Dabur India
Accumulate
250
267
43,996
9,370
10,265
17.1
17.2
7.3
8.1
34.1
30.9
10.3
8.4
33.7
30.6
4.6
4.2
GlaxoSmith Con*
Accumulate
5,619
6,118
23,630
4,919
5,742
17.2
17.4
168.3
191.2
33.4
29.4
9.5
8.1
28.8
28.9
4.4
3.8
Stock Watch
March 15, 2016
Company Name
Reco
CMP
Target
Mkt Cap
Sales ( Čcr )
OPM(%)
EPS (Č)
PER(x)
P/BV(x)
RoE(%)
EV/Sales(x)
(Č)
Price ( Č)
( Č cr )
FY16E FY17E
FY16E
FY17E
FY16E
FY17E
FY16E
FY17E
FY16E
FY17E
FY16E
FY17E
FY16E
FY17E
FMCG
Godrej Consumer
Neutral
1,294
-
44,053
10,168
12,886
16.1
16.1
32.1
38.4
40.3
33.7
8.2
7.6
19.7
21.0
4.5
3.5
HUL
Neutral
855
-
184,979
34,940
38,957
17.5
17.7
20.8
24.7
41.1
34.6
45.7
36.5
110.5
114.2
5.1
4.5
ITC
Accumulate
324
359
260,681
36,804
38,776
37.9
37.9
12.2
12.9
26.6
25.1
7.4
6.5
27.7
25.8
6.6
6.2
Marico
Neutral
251
-
32,345
6,551
7,766
15.7
16.0
10.4
12.5
24.2
20.1
7.0
5.8
33.2
32.4
4.8
4.0
Nestle*
Buy
5,105
6,646
49,220
11,291
12,847
22.2
22.3
158.9
184.6
32.1
27.7
16.8
15.1
55.0
57.3
4.3
3.7
Tata Global
Buy
116
144
7,299
8,635
9,072
9.8
9.9
6.5
7.6
17.8
15.2
1.8
1.7
6.8
7.4
0.8
0.7
IT
HCL Tech^
Buy
827
1,038
116,674
42,038
47,503
21.2
21.5
51.5
57.7
16.1
14.3
3.5
2.7
21.5
18.8
2.4
1.9
Infosys
Buy
1,141
1,347
262,926
61,850
69,981
27.5
27.5
59.4
65.7
19.2
17.4
4.1
3.5
21.2
20.1
3.5
3.0
TCS
Buy
2,352
2,854
463,445
108,487
122,590
28.3
28.5
122.8
138.4
19.2
17.0
7.3
6.6
38.0
38.9
3.9
3.4
Tech Mahindra
Buy
470
530
45,438
26,524
29,177
16.2
17.0
28.8
33.6
16.3
14.0
3.2
2.7
19.3
19.1
1.4
1.2
Wipro
Buy
540
680
133,303
50,808
56,189
23.7
23.8
37.3
40.7
14.5
13.3
2.8
2.5
19.2
17.7
2.1
1.7
Media
D B Corp
Accumulate
315
356
5,789
2,241
2,495
27.8
27.9
21.8
25.6
14.5
12.3
3.8
3.3
26.7
28.5
2.6
2.3
HT Media
Neutral
81
-
1,889
2,495
2,603
11.2
11.2
7.3
8.6
11.1
9.4
0.9
0.8
7.4
8.1
0.3
0.2
Jagran Prakashan
Buy
149
189
4,869
2,170
2,355
27.2
26.2
8.9
9.9
16.7
15.1
3.5
3.1
20.9
20.5
2.2
2.0
Sun TV Network
Neutral
369
-
14,522
2,779
3,196
70.2
70.5
22.8
27.3
16.2
13.5
4.0
3.6
26.7
28.3
4.6
4.0
Hindustan Media
Neutral
252
-
1,848
920
1,031
20.0
20.0
19.2
20.9
13.1
12.1
2.2
1.9
16.4
15.3
1.6
1.4
Ventures
Metals & Mining
Coal India
Buy
297
380
187,501
76,167
84,130
19.9
22.3
22.4
25.8
13.2
11.5
4.8
4.7
35.5
41.0
2.0
1.8
Hind. Zinc
Neutral
171
-
72,042
14,641
14,026
50.4
50.4
17.7
16.0
9.7
10.7
1.5
1.4
16.2
13.2
2.5
2.4
Hindalco
Neutral
85
-
17,501
104,356
111,186
8.7
9.5
6.7
11.1
12.6
7.7
0.5
0.4
3.5
5.9
0.7
0.6
JSW Steel
Neutral
1,181
-
28,557
42,308
45,147
16.4
20.7
(10.3)
49.5
23.9
1.3
1.3
(1.0)
5.6
1.7
1.6
NMDC
Neutral
95
-
37,486
8,237
10,893
46.6
44.5
10.0
11.7
9.5
8.1
1.1
0.9
12.5
13.0
4.3
3.3
SAIL
Neutral
42
-
17,470
45,915
53,954
7.2
10.5
1.5
4.4
28.1
9.7
0.4
0.4
2.3
4.1
1.0
0.9
Vedanta
Neutral
89
-
26,386
71,445
81,910
26.2
26.3
12.9
19.2
6.9
4.6
0.5
0.4
7.2
8.9
0.8
0.6
Tata Steel
Neutral
296
-
28,777
126,760
137,307
8.9
11.3
6.4
23.1
46.6
12.8
0.9
0.9
2.0
7.1
0.8
0.8
Oil & Gas
Cairn India
Neutral
152
-
28,432
11,323
12,490
49.4
51.0
20.7
20.7
7.3
7.3
0.5
0.5
6.4
6.1
1.5
0.9
GAIL
Neutral
343
-
43,509
64,856
70,933
9.1
9.6
24.0
28.9
14.3
11.9
1.2
1.1
8.8
9.6
0.9
0.8
ONGC
Neutral
208
-
178,125
154,564
167,321
36.8
37.4
28.6
32.5
7.3
6.4
0.9
0.9
12.7
13.5
1.3
1.3
Petronet LNG
Neutral
250
-
18,728
29,691
31,188
5.8
6.2
12.8
13.4
19.5
18.6
2.9
2.6
15.8
14.8
0.7
0.7
Indian Oil Corp
Buy
385
455
93,525
359,607
402,760
5.9
6.1
42.5
48.7
9.1
7.9
1.2
1.1
14.1
14.4
0.4
0.3
Stock Watch
March 15, 2016
Company Name
Reco
CMP
Target
Mkt Cap
Sales ( Čcr )
OPM(%)
EPS (Č)
PER(x)
P/BV(x)
RoE(%)
EV/Sales(x)
(Č)
Price ( Č)
( Č cr )
FY16E FY17E
FY16E
FY17E
FY16E
FY17E
FY16E
FY17E
FY16E
FY17E
FY16E
FY17E
FY16E
FY17E
Oil & Gas
Reliance Industries
Accumulate
1,019
1,150
330,022
304,775
344,392
12.6
13.4
91.3
102.6
11.2
9.9
1.3
1.1
11.8
12.0
1.0
0.8
Pharmaceuticals
Alembic Pharma
Neutral
620
-
11,685
3,274
3,802
26.9
19.4
35.0
28.7
17.7
21.6
7.9
5.9
55.6
31.2
3.5
3.0
Aurobindo Pharma
Buy
735
856
42,990
14,923
17,162
22.0
23.0
35.7
42.8
20.6
17.2
6.1
4.6
34.0
30.2
3.2
2.8
Aventis*
Neutral
4,427
-
10,197
2,082
2,371
17.4
20.8
118.2
151.5
37.5
29.2
5.5
4.4
19.9
25.5
4.5
3.8
Cadila Healthcare
Neutral
349
-
35,683
10,224
11,840
21.0
22.0
14.6
17.6
23.9
19.8
6.5
5.1
30.8
29.0
3.5
2.9
Cipla
Accumulate
538
605
43,226
13,979
16,447
20.2
18.6
25.7
27.5
20.9
19.6
3.4
2.9
17.6
16.1
3.1
2.5
Dr Reddy's
Buy
3,234
3,933
55,157
16,838
19,575
25.0
23.1
167.5
178.8
19.3
18.1
4.1
3.4
23.1
20.4
3.2
2.7
Dishman Pharma
Neutral
366
-
2,957
1,733
1,906
21.5
21.5
17.0
19.9
21.6
18.4
2.2
2.0
10.5
11.2
2.2
1.9
GSK Pharma*
Neutral
3,257
-
27,585
2,870
3,158
20.0
22.1
59.5
68.3
54.7
47.7
16.2
16.6
28.5
34.3
9.1
8.3
Indoco Remedies
Neutral
280
-
2,583
1,033
1,199
15.9
18.2
9.4
13.6
29.8
20.6
4.4
3.8
15.7
19.7
2.6
2.2
Ipca labs
Buy
542
900
6,833
3,363
3,909
12.9
18.6
13.4
28.0
40.4
19.3
2.9
2.5
7.4
14.0
2.3
2.0
Lupin
Neutral
1,869
-
84,187
13,092
16,561
25.0
27.0
50.4
68.3
37.1
27.4
7.7
6.1
22.8
24.7
6.1
4.7
Sun Pharma
Accumulate
864
950
207,936
28,163
32,610
25.8
30.7
17.4
26.9
49.7
32.1
4.7
4.1
13.0
16.6
6.9
5.7
Power
Tata Power
Neutral
59
-
15,971
35,923
37,402
22.6
22.8
4.1
5.2
14.6
11.5
1.1
1.0
7.5
9.3
1.4
1.3
NTPC
Buy
127
146
104,965
87,271
99,297
23.5
23.5
11.8
13.3
10.8
9.6
1.2
1.1
11.5
12.2
2.2
2.0
Power Grid
Buy
138
170
72,431
20,702
23,361
86.7
86.4
12.1
13.2
11.5
10.5
1.7
1.5
15.6
15.1
8.4
7.8
Real Estate
MLIFE
Buy
428
554
1,756
697
1,011
14.9
19.3
13.8
20.1
31.0
21.3
1.2
1.1
3.8
5.3
3.8
2.6
Telecom
Bharti Airtel
Neutral
341
-
136,271
101,748
109,191
32.1
31.7
12.0
12.5
28.4
27.3
2.0
1.8
6.9
6.7
2.0
1.8
Idea Cellular
Neutral
102
-
36,599
34,282
36,941
32.0
31.5
5.9
6.2
17.2
16.4
1.6
1.4
9.9
9.3
1.6
1.6
zOthers
Abbott India
Neutral
4,867
-
10,342
2,715
3,153
14.5
14.1
134.3
152.2
36.3
32.0
9.0
7.5
27.4
25.6
3.5
3.0
Bajaj Electricals
Buy
191
237
1,927
4,719
5,287
5.2
5.8
8.6
12.7
22.3
15.1
2.5
2.2
11.4
14.8
0.4
0.4
Finolex Cables
Neutral
233
-
3,556
2,520
2,883
12.2
12.0
12.7
14.2
18.4
16.4
2.5
2.2
13.6
13.5
1.1
1.0
Goodyear India*
Buy
471
582
1,087
1,800
1,600
11.7
11.5
58.7
52.9
8.0
8.9
1.8
1.6
24.6
18.7
0.4
0.4
Hitachi
Neutral
1,147
-
3,118
1,779
2,081
7.8
8.8
21.8
33.4
52.6
34.3
8.5
6.9
17.4
22.1
1.8
1.5
Jyothy Laboratories
Neutral
291
-
5,268
1,620
1,847
11.5
11.5
7.3
8.5
39.9
34.3
5.2
4.8
13.3
14.4
3.1
2.6
MRF
Buy
34,570
45,575
14,661
20,316
14,488
21.4
21.1
5,488.0
3,798.0
6.3
9.1
2.2
1.7
41.1
21.2
0.7
0.9
Page Industries
Neutral
11,532
-
12,862
1,929
2,450
19.8
20.1
229.9
299.0
50.2
38.6
22.1
15.4
52.1
47.1
6.6
5.2
Relaxo Footwears
Neutral
385
-
4,626
1,767
2,152
12.3
12.5
19.3
25.1
20.0
15.4
4.9
3.8
27.7
27.8
2.7
2.2
Siyaram Silk Mills
Buy
982
1,354
921
1,636
1,815
11.5
11.5
89.9
104.1
10.9
9.4
1.8
1.6
17.9
17.8
0.7
0.7
Stock Watch
March 15, 2016
Company Name
Reco
CMP
Target
Mkt Cap
Sales ( Čcr )
OPM(%)
EPS (Č)
PER(x)
P/BV(x)
RoE(%)
EV/Sales(x)
(Č)
Price ( Č)
( Č cr )
FY16E
FY17E
FY16E
FY17E
FY16E
FY17E
FY16E
FY17E
FY16E
FY17E
FY16E
FY17E
FY16E
FY17E
zOthers
Styrolution ABS India* Neutral
548
-
964
1,271
1,440
8.6
9.2
32.0
41.1
17.1
13.4
1.8
1.6
10.7
12.4
0.7
0.6
TVS Srichakra
Buy
2,365
3,217
1,811
2,035
2,252
15.9
15.3
248.6
268.1
9.5
8.8
4.2
3.0
43.6
33.9
0.9
0.8
HSIL
Accumulate
271
302
1,961
2,123
2,384
16.1
16.5
15.0
18.9
18.0
14.4
1.4
1.3
8.0
9.4
1.3
1.1
Kirloskar Engines India
Neutral
212
-
3,067
2,403
2,554
8.6
9.9
9.2
10.5
23.1
20.2
2.2
2.1
9.7
10.7
0.9
0.8
Ltd
M M Forgings
Buy
432
614
522
511
615
21.7
21.6
43.1
55.8
10.0
7.7
1.8
1.5
19.9
21.2
1.2
0.9
Banco Products (India) Neutral
100
-
713
1,208
1,353
11.0
12.3
10.8
14.5
9.3
6.9
1.1
0.9
11.9
14.5
0.6
0.5
Competent Automobiles Neutral
129
-
79
1,040
1,137
3.2
3.1
25.7
28.0
5.0
4.6
0.8
0.7
15.0
14.3
0.1
0.1
Nilkamal
Neutral
1,107
-
1,652
1,871
2,031
10.7
10.5
63.2
69.8
17.5
15.9
2.9
2.5
17.6
16.6
0.9
0.8
Visaka Industries
Buy
109
144
172
1,086
1,197
9.9
10.3
21.5
28.8
5.1
3.8
0.5
0.4
9.6
11.6
0.4
0.3
Transport Corporation of
Neutral
276
-
2,097
2,830
3,350
8.8
9.0
14.4
18.3
19.2
15.1
3.0
2.6
15.4
17.1
0.9
0.7
India
Elecon Engineering
Neutral
59
-
637
1,359
1,482
10.3
13.7
0.8
3.9
72.9
15.0
1.2
1.2
1.6
7.8
0.8
0.8
Surya Roshni
Buy
135
201
591
2,992
3,223
8.1
8.4
14.7
18.3
9.2
7.4
0.9
0.8
9.7
11.0
0.5
0.4
MT Educare
Neutral
155
-
618
286
366
18.3
17.7
7.7
9.4
20.1
16.6
4.2
3.7
20.2
21.1
2.1
1.6
Radico Khaitan
Buy
99
156
1,318
1,517
1,635
12.7
13.4
5.8
7.1
17.0
13.9
1.5
1.3
8.6
9.6
1.4
1.2
Garware Wall Ropes
Buy
310
473
678
862
974
11.2
11.2
24.9
29.6
12.5
10.5
1.9
1.6
15.1
15.4
0.8
0.6
Wonderla Holidays
Neutral
370
-
2,089
206
308
44.0
43.6
9.0
12.9
41.1
28.7
5.6
5.1
13.7
17.8
10.0
6.6
Linc Pen & Plastics
Neutral
187
-
276
340
371
8.3
8.9
10.8
13.2
17.3
14.2
2.8
2.4
16.0
17.1
0.8
0.8
The Byke Hospitality
Neutral
155
-
622
222
287
20.5
20.5
5.6
7.6
27.5
20.5
5.2
4.3
18.9
20.8
2.8
2.2
Interglobe Aviation
Neutral
805
-
28,996
17,022
21,122
20.7
14.5
63.9
53.7
12.6
15.0
18.9
15.5
149.9
103.2
1.8
1.4
Coffee Day Enterprises
Neutral
225
-
4,637
2,692
2,964
17.0
18.6
-
4.7
-
47.5
2.8
2.6
0.2
5.5
2.1
2.0
Ltd
Navneet Education
Neutral
81
-
1,930
998
1,062
24.1
24.0
5.8
6.1
14.1
13.3
3.1
2.7
22.0
20.6
2.0
1.9
Navkar Corporation
Buy
163
265
2,323
365
436
38.3
37.5
5.6
5.9
28.9
27.7
1.8
1.7
6.3
6.1
7.2
6.2
Source: Company, Angel Research; Note: *December year end; #September year end; &October year end; Price as on March 14, 2016
Market Outlook
March 15, 2016
Research Team Tel: 022 - 39357800
DISCLAIMER
Angel Broking Private Limited (hereinafter referred to as “Angel”) is a registered Member of National Stock Exchange of India Limited,
Bombay Stock Exchange Limited and Metropolitian Stock Exchange of India Limited. It is also registered as a Depository Participant with
CDSL and Portfolio Manager with SEBI. It also has registration with AMFI as a Mutual Fund Distributor. Angel Broking Private Limited is a
registered entity with SEBI for Research Analyst in terms of SEBI (Research Analyst) Regulations, 2014 vide registration number
INH000000164. Angel or its associates has not been debarred/ suspended by SEBI or any other regulatory authority for accessing
/dealing in securities Market. Angel or its associates including its relatives/analyst do not hold any financial interest/beneficial ownership
of more than 1% in the company covered by Analyst. Angel or its associates/analyst has not received any compensation / managed or co
-managed public offering of securities of the company covered by Analyst during the past twelve months. Angel/analyst has not served as
an officer, director or employee of company covered by Analyst and has not been engaged in market making activity of the company
covered by Analyst.
This document is solely for the personal information of the recipient, and must not be singularly used as the basis of any investment
decision. Nothing in this document should be construed as investment or financial advice. Each recipient of this document should make
such investigations as they deem necessary to arrive at an independent evaluation of an investment in the securities of the companies
referred to in this document (including the merits and risks involved), and should consult their own advisors to determine the merits and
risks of such an investment.
Reports based on technical and derivative analysis center on studying charts of a stock's price movement, outstanding positions and
trading volume, as opposed to focusing on a company's fundamentals and, as such, may not match with a report on a company's
fundamentals.
The information in this document has been printed on the basis of publicly available information, internal data and other reliable sources
believed to be true, but we do not represent that it is accurate or complete and it should not be relied on as such, as this document is for
general guidance only. Angel Broking Pvt. Limited or any of its affiliates/ group companies shall not be in any way responsible for any
loss or damage that may arise to any person from any inadvertent error in the information contained in this report. Angel Broking Pvt.
Limited has not independently verified all the information contained within this document. Accordingly, we cannot testify, nor make any
representation or warranty, express or implied, to the accuracy, contents or data contained within this document. While Angel Broking
Pvt. Limited endeavors to update on a reasonable basis the information discussed in this material, there may be regulatory, compliance,
or other reasons that prevent us from doing so.
This document is being supplied to you solely for your information, and its contents, information or data may not be reproduced,
redistributed or passed on, directly or indirectly.
Neither Angel Broking Pvt. Limited, nor its directors, employees or affiliates shall be liable for any loss or damage that may arise from or
in connection with the use of this information.
Note: Please refer to the important ‘Stock Holding Disclosure' report on the Angel website (Research Section). Also, please refer to the
latest update on respective stocks for the disclosure status in respect of those stocks. Angel Broking Pvt. Limited and its affiliates may have
investment positions in the stocks recommended in this report.