Market Outlook
February 15, 2016
Market Cues
Domestic Indices
Chg (%)
(Pts)
(Close)
Indian markets are expected to open positively tracking the SGX Nifty and most of its
BSE Sensex
0.1
34
22,986
Asian peers.
Nifty
0.1
5
6,981
US markets staged a strong comeback rallying by about 2%. The gain in the markets
Mid Cap
(0.8)
(76)
9,615
came after a five session loss earlier in the week which was led by commodity and
Small Cap
(1.2)
(119)
9,683
banking shares.
Bankex
(0.2)
(35)
15,855
European shares ended sharply higher gaining by about 3% as the crude oil prices
and stocks of mining companies rebounded.
Global Indices
Chg (%)
(Pts)
(Close)
Indian markets ended on a flat note amid a volatile session.
Dow Jones
2.0
314
15,974
Nasdaq
1.7
71
4,338
News & Result Analysis
FTSE
3.1
171
5,708
Result Review: Sun Pharma
Detailed analysis on Pg2
Nikkei
(4.8)
(761)
14,953
Hang Seng
(1.2)
(226)
18,320
Investor’s Ready Reckoner
Shanghai Com
(0.6)
(18)
2,763
Key Domestic & Global Indicators
Stock Watch: Latest investment recommendations on 150+ stocks
Advances / Declines
BSE
NSE
Refer P4 onwards
Advances
865
121
Top Picks
Declines
1,731
1,478
CMP
Target
Upside
Company
Sector
Rating
Unchanged
132
29
(`)
(`)
(%)
Amara Raja Batteries Auto & Auto Ancillary
Buy
826
1,040
26.0
HCL Tech
IT
Buy
798
1,038
30.0
Volumes (` Cr)
LIC Housing Finance Financials
Buy
409
592
44.8
BSE
3,700
Bharat Electronics
Capital Goods
Buy
1,125
1,414
25.6
NSE
22,454
Navkar Corporation Others
Buy
168
265
57.9
More Top Picks on Pg3
Net Inflows (` Cr)
Net
Mtd
Ytd
Key Upcoming Events
FII
(1,210)
(3,014)
(11,287)
Previous
Consensus
Date
Region
Event Description
MFs
504
780
77,647
Reading
Expectations
Feb 15 India
Monthly wholesales prices YoY% (% Change)
(0.73)
(0.13)
Feb 15 China
Exports YoY% (% Change)
(1.40)
(1.80)
Top Gainers
Price (`)
Chg (%)
Feb 16 UK
CPI YoY (% Change)
0.20
0.30
Idea
110
9.1
Feb 17 US
Housing starts (Thousands)
1,149
1,170
Tatamotors
299
8.3
6.(
Infratel
385
8.3
Suzlon
14
5.4
Bhartiartl
325
5.4
Top Losers
Price (`)
Chg (%)
Bhel
105
(13.1)
Wockpharma
761
(13.1)
Justdial
417
(12.5)
Sci
58
(10.0)
Cox&Kings
160
(9.9)
As on February 12, 2016
Market Outlook
February 15, 2016
Result Review
Sun Pharma - 3QFY2016 (CMP: `848/ TP: - `950/ Upside: - 12%)
Sun pharmaceuticals, posted results much better than expected on the OPM front.
The company posted sales of `7047cr V/s `7000cr expected in 3QFY2016, a yoy
growth of 2.3%.
India sales at `1,890cr, up by 8% yoy over 3QFY2015. Sales in the US were
US$486mn for the quarter, a reduction of 11% over same period last year and
accounted for 45% of total sales. Sales for the quarter were impacted primarily
due to competitive pressure on some products and temporary supply constraints
arising from remediation efforts at the Halol facility. The Company had partly
benefitted in same period last year from the 180-day exclusivity on Valsartan
tablets in the US resulting in a higher base. Formulation sales in Rest of World
(ROW) markets excluding US and Emerging Markets were US$85mn in
3QFY2016, a de-growth of 6% from the corresponding quarter last year. Sales in
emerging markets were at US$151mn for 3QFY2016, a decline of 7% from the
corresponding quarter last year and accounted for 14% of total sales.
On the operating front, the Gross Profit margin, came in at 75.1% V/s 73.7%
expected, enabling the OPM’s to come in at 30.3% in 3QFY2016, V/s 25.6%
expected and 30.8% in 3QFY2015.The R&D expenditure during the period was
8.3% of sales V/s 7.5% of sales in 3QFY2015. Thus, Adj. net profit came in at
`1,417cr V/s `1,145cr expected a yoy growth of 258.3%. This was on back of
80% dip in tax expenses and an other income of `254.7cr V/s a net loss of
`29.6cr in 3QFY2015. Overall, we maintain our accumulate rating on the stock
with a price target of `950.
Y/E
Sales OPM
PAT
EPS ROE P/E P/BV EV/EBITDA EV/Sales
Mar
(` cr)
(%)
(` cr)
(`)
(%)
(x)
(x)
(x)
(x)
FY2016E
28,163
25.8
4,179
17.4 13.0 48.7
4.6
26.0
6.7
FY2017E
32,610
30.7
6,483
26.9 16.6 31.5
4.0
18.2
5.6
Economic and Political News
Healthcare sector to see 15% revenue growth in FY17: Ind-Ra
Prasad to launch Electronics Development Fund on Feb 15
Govt is committed to helping banks with capital infusion: Jaitley
Corporate News
Ashok Leyland continues to make and sell LCVs, despite row with JV partner
Nissan
Power Grid, Adani, Essel in fray for Warangal project
Indian oil firms' losses on selling subsidised petroleum products shrink 70%
Market Outlook
February 15, 2016
Top Picks ★★★★★
Large Cap
Market Cap
CMP
Target
Upside
Company
Rationale
(` Cr)
(`)
(`)
(%)
To outpace battery industry growth due to better technological
Amara Raja Batteries
14,102
826
1,040
26.0
products leading to market share gains in both the automotive
OEM and replacement segments.
Earnings to grow strongly given the MHCV cyclical upturn.
Ashok Leyland
23,678
83
111
33.4
Focus on exports and LCV's provides additional growth
avenue.
Uptick in defense capex by government when coupled with
Bharat Electronics
27,011
1,125
1,414
25.6
BELs strong market positioning, indicate that good times are
ahead for BEL.
The stock is trading at attractive valuations and is factoring all
HCL Tech
112,506
798
1,038
30.0
the bad news.
Strong visibility for a robust 20% earnings trajectory, coupled
HDFC Bank
245,877
973
1,262
29.7
with high quality of earnings on account of high quality retail
business and strategic focus on highly rated corporates.
Back on the growth trend, expect a long term growth of 14%
Infosys
248,874
1,084
1,347
24.3
to be a US$20bn in FY2020.
LICHF continues to grow its retail loan book at a healthy pace
with improvement in asset quality. We expect the company to
LIC Housing Finance
20,621
409
592
44.8
post a healthy loan book which is likely to reflect in a strong
earnings growth.
Huge bid pipeline of re-development works at Delhi and other
NBCC
10,056
838
1,089
30.0
State Governments and opportunity from Smart City, positions
NBCC to report strong growth, going forward.
New launches to enable outpace industry growth; margins
TVS Motors
13,120
276
330
19.5
expansion to boost earnings.
Source: Company, Angel Research
Mid Cap
Market Cap
CMP
Target
Upside
Company
Rationale
(` Cr)
(`)
(`)
(%)
Favourable outlook for the AC industry to augur well for
Cooling products business which is out pacing the market
Blue Star
2,984
332
439
32.3
growth. EMPPAC division's profitability to improve once
operating environment turns around.
Economic recovery to have favourable impact on advertising &
circulation revenue growth. Further, the acquisition of a radio
Jagran Prakashan
5,020
154
189
23.1
business (Radio City) would also boost the company's revenue
growth.
Massive capacity expansion along with rail advantage at ICD
Navkar Corporation
2,393
168
265
57.9
as well CFS augurs well for the company
Earnings boost on back of stable material prices and
Radico Khaitan
1,292
97
156
60.6
favourable pricing environment. Valuation discount to peers
provides additional comfort
Strong brands and distribution network would boost growth
Siyaram Silk Mills
939
1,002
1,354
35.2
going ahead. Stock currently trades at an inexpensive
valuation.
Structural shift in the Lighting industry towards LED lighting will
Surya Roshni
2,984
332
439
32.3
drive growth.
Source: Company, Angel Research
Market Outlook
February 15, 2016
Key Upcoming Events
Global economic events release calendar
Date
Time
Country
Event Description
Unit
Period
Bloomberg Data
Last Reported Estimated
Feb 15, 2016
12:00PM
India
Monthly Wholesale Prices YoY%
% Change
Jan
(0.73)
(0.13)
China
Exports YoY%
% Change
Jan
(1.40)
(1.80)
Feb 16, 2016
3:00PM
UK
CPI (YoY)
% Change
Jan
0.20
0.30
Feb 17, 2016
7:00PM
US
Housing Starts
Thousands
Jan
1,149.00
1,170.00
7:00PM
US
Building permits
Thousands
Jan
1,204.00
1,200.00
3:00PM
UK
Jobless claims change
% Change
Jan
(4.30)
(3.00)
7:45PM
US
Industrial Production
%
Jan
(0.36)
0.30
US
Producer Price Index (mom)
% Change
Jan
(0.70)
--
Feb 18, 2016
7:00PM
US
Initial Jobless claims
Thousands
Feb 13
269.00
275.00
7:00AM
China
Consumer Price Index (YoY)
% Change
Jan
1.60
1.90
Feb 19, 2016
7:00PM
US
Consumer price index (mom)
% Change
Jan
(0.10)
(0.10)
8:30PM
Euro Zone
Euro-Zone Consumer Confidence
Value
Feb A
(6.30)
(6.60)
Feb 22, 2016
2:00PM
Germany
PMI Services
Value
Feb P
55.00
--
2:00PM
Germany
PMI Manufacturing
Value
Feb P
52.30
--
Feb 23, 2016
8:30PM
US
Existing home sales
Million
Jan
5.46
--
8:30PM
US
Consumer Confidence
S.A./ 1985=100
Feb
98.10
--
Feb 24, 2016
8:30PM
US
New home sales
Thousands
Jan
544.00
--
Feb 25, 2016
3:00PM
UK
GDP (YoY)
% Change
4Q P
1.90
--
3:30PM
Euro Zone
Euro-Zone CPI (YoY)
%
Jan F
0.40
--
Feb 26, 2016
7:00PM
US
GDP Qoq (Annualised)
% Change
4Q S
0.70
--
Source: Bloomberg, Angel Research
Market Outlook
February 15, 2016
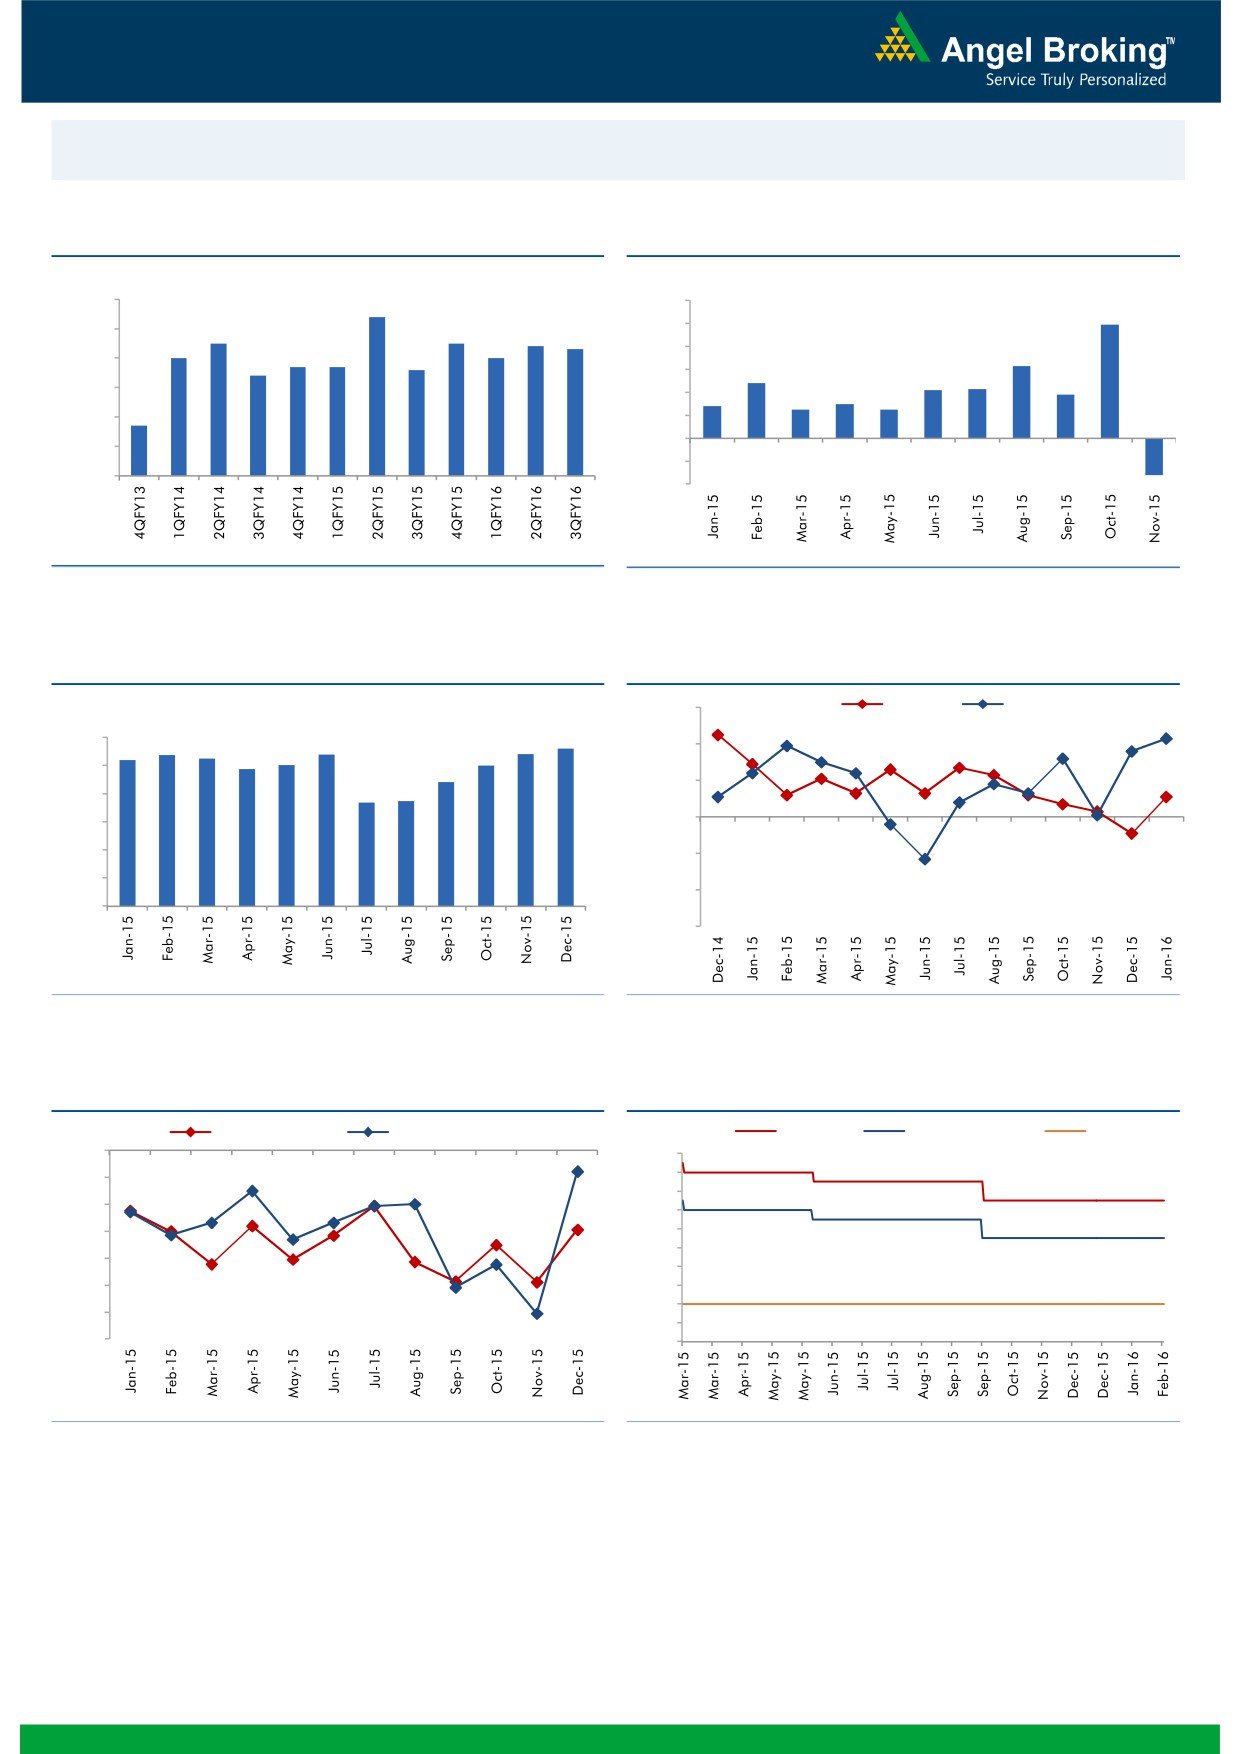
Macro watch
Exhibit 1: Quarterly GDP trends
Exhibit 2: IIP trends
(%)
(%)
9.0
8.4
12.0
9.9
7.5
7.5
10.0
8.0
7.4
7.3
7.0
7.0
6.7
6.7
6.6
8.0
6.3
7.0
6.4
6.0
4.8
4.3
4.2
3.8
6.0
2.8
3.0
4.0
2.5
2.5
4.7
5.0
2.0
(3.2)
-
4.0
(2.0)
3.0
(4.0)
Source: CSO, Angel Research
Source: MOSPI, Angel Research
Exhibit 3: Monthly CPI inflation trends
Exhibit 4: Manufacturing and services PMI
(%)
56.0
Mfg. PMI
Services PMI
6.0
5.4
5.4
5.4
5.6
5.2
5.3
54.0
4.9
5.0
5.0
5.0
4.4
3.7
3.7
52.0
4.0
3.0
50.0
2.0
48.0
1.0
46.0
-
44.0
Source: MOSPI, Angel Research
Source: Market, Angel Research; Note: Level above 50 indicates expansion
Exhibit 5: Exports and imports growth trends
Exhibit 6: Key policy rates
(%)
Exports yoy growth
Imports yoy growth
(%)
Repo rate
Reverse Repo rate
CRR
0.0
8.00
(5.0)
7.50
7.00
(10.0)
6.50
(15.0)
6.00
5.50
(20.0)
5.00
(25.0)
4.50
4.00
(30.0)
3.50
(35.0)
3.00
Source: Bloomberg, Angel Research
Source: RBI, Angel Research
Market Outlook
February 15, 2016
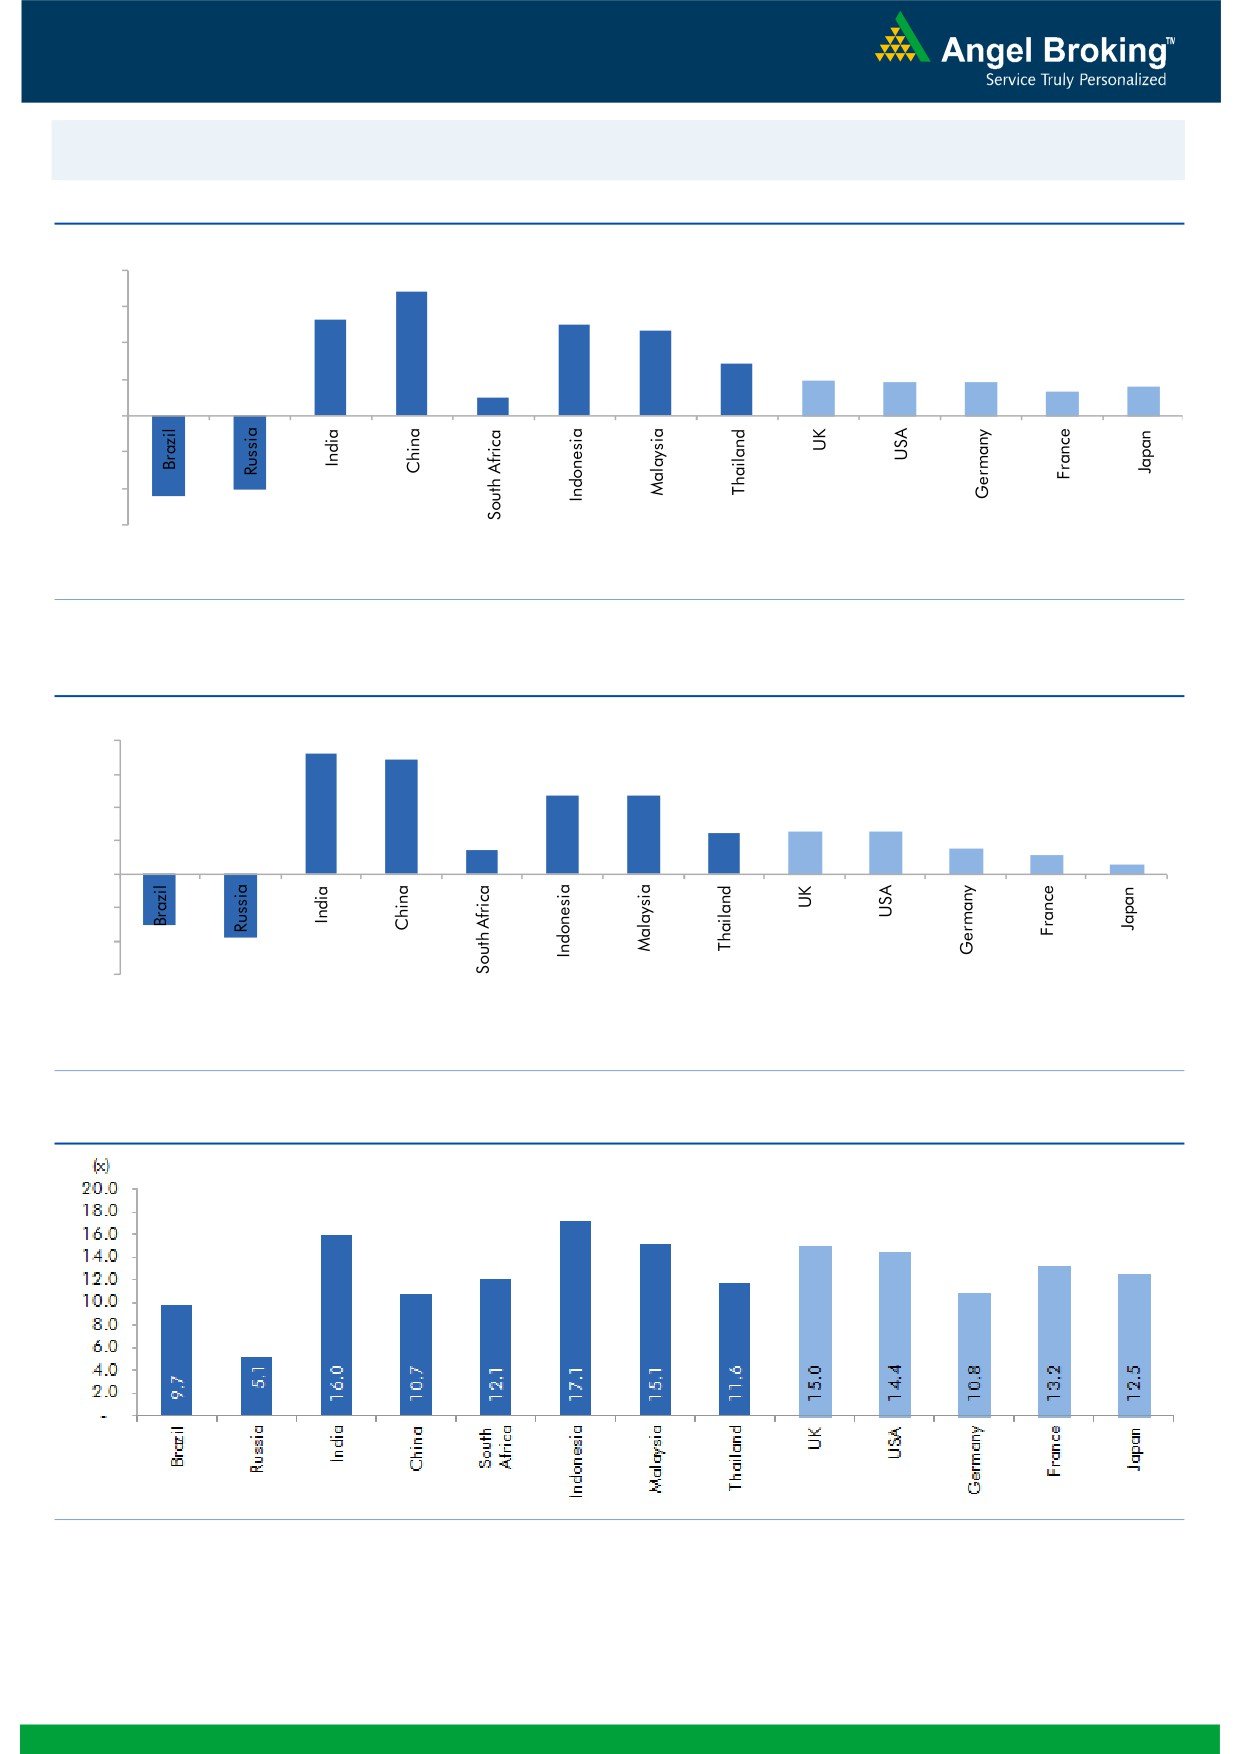
Global watch
Exhibit 1: Latest quarterly GDP Growth (%, yoy) across select developing and developed countries
(%)
8.0
6.8
5.3
6.0
5.0
4.7
4.0
2.9
1.9
1.8
1.8
1.3
1.6
2.0
1.0
(4.5)
(4.1)
-
(2.0)
(4.0)
(6.0)
Source: Bloomberg, Angel Research
Exhibit 2: 2015 GDP Growth projection by IMF (%, yoy) across select developing and developed countries
(%)
7.3
8.0
6.8
6.0
4.7
4.7
4.0
2.5
2.5
2.6
1.4
1.5
2.0
1.2
0.6
(3.0)
(3.8)
-
(2.0)
(4.0)
(6.0)
Source: IMF, Angel Research
Exhibit 3: One year forward P-E ratio across select developing and developed countries
Source: IMF, Angel Research
Market Outlook
February 15, 2016
Exhibit 4: Relative performance of indices across globe
Returns (%)
Country
Name of index
Closing price
1M
3M
1YR
Brazil
Bovespa
39,808
(2.0)
(16.6)
(16.5)
Russia
Micex
1,726
2.4
(1.2)
(2.1)
India
Nifty
6,981
(7.0)
(10.3)
(18.1)
China
Shanghai Composite
2,763
(13.6)
(26.0)
(17.2)
South Africa
Top 40
43,120
(0.7)
(8.8)
(6.8)
Mexico
Mexbol
42,416
3.4
(4.4)
(1.5)
Indonesia
LQ45
825
4.6
8.1
(9.2)
Malaysia
KLCI
1,644
(0.7)
(2.5)
(7.7)
Thailand
SET 50
804
0.1
(10.5)
(24.7)
USA
Dow Jones
15,974
(3.3)
(10.0)
(11.4)
UK
FTSE
5,708
(4.3)
(9.4)
(16.8)
Japan
Nikkei
14,953
(13.2)
(22.4)
(13.7)
Germany
DAX
8,968
(10.0)
(17.2)
(17.9)
France
CAC
3,995
(9.0)
(17.7)
(17.3)
Source: Bloomberg, Angel Research
Stock Watch
February 15, 2016
Company Name
Reco
CMP
Target
Mkt Cap
Sales ( Čcr )
OPM(%)
EPS (Č)
PER(x)
P/BV(x)
RoE(%)
EV/Sales(x)
(Č)
Price ( Č)
( Č cr )
FY16E FY17E
FY16E
FY17E
FY16E
FY17E
FY16E
FY17E
FY16E
FY17E
FY16E
FY17E
FY16E
FY17E
Agri / Agri Chemical
Rallis
Neutral
149
-
2,888
2,097
2,415
14.4
14.4
9.5
11.0
15.6
13.5
3.1
2.7
21.1
21.3
1.4
1.2
United Phosphorus
Buy
381
480
16,308
12,500
14,375
18.3
18.3
29.8
35.9
12.8
10.6
2.4
2.0
20.0
20.3
1.4
1.1
Auto & Auto Ancillary
Ashok Leyland
Buy
83
111
23,678
17,995
21,544
11.4
11.6
3.4
4.7
24.5
17.7
4.3
3.9
17.7
22.2
1.3
1.0
Bajaj Auto
Buy
2,303
2,728
66,640
23,695
27,298
21.3
20.4
134.6
151.5
17.1
15.2
5.4
4.7
31.8
30.6
2.4
2.0
Bharat Forge
Buy
747
943
17,383
7,867
8,881
20.0
20.3
34.4
41.0
21.7
18.2
4.2
3.5
21.1
20.9
2.3
2.0
Eicher Motors
Accumulate
17,994
20,044
48,860
15,556
16,747
15.5
17.3
464.8
597.5
38.7
30.1
14.1
10.4
36.2
34.3
3.1
2.8
Gabriel India
Buy
80
101
1,152
1,415
1,544
8.7
9.0
4.6
5.4
17.4
14.9
3.2
2.8
18.1
18.9
0.8
0.7
Hero Motocorp
Buy
2,487
2,864
49,652
28,244
30,532
15.5
15.9
156.7
168.5
15.9
14.8
6.3
5.4
39.9
36.4
1.6
1.4
Jamna Auto Industries Buy
127
160
1,013
1,281
1,473
11.2
11.5
7.6
9.2
16.7
13.8
4.2
3.5
25.4
25.2
0.8
0.7
L G Balakrishnan & Bros Neutral
404
-
634
1,254
1,394
11.6
11.8
35.9
41.7
11.3
9.7
1.5
1.3
13.5
13.8
0.6
0.5
Mahindra and Mahindra Buy
1,168
1,449
72,568
39,031
44,440
13.8
13.9
57.9
67.6
20.2
17.3
3.3
2.9
16.1
16.6
1.5
1.3
Maruti
Neutral
3,549
-
107,220
57,865
68,104
16.4
16.7
176.3
225.5
20.1
15.7
3.9
3.3
19.4
21.2
1.6
1.3
Minda Industries
Buy
773
1,047
1,226
2,523
2,890
8.7
9.0
55.0
65.4
14.1
11.8
2.7
2.2
19.3
18.7
0.6
0.5
Motherson Sumi
Buy
226
313
29,900
39,343
45,100
8.8
9.1
10.1
12.5
22.4
18.1
7.1
5.6
35.3
34.4
0.8
0.7
Rane Brake Lining
Buy
343
465
271
454
511
11.5
12.0
25.2
31.0
13.6
11.1
2.0
1.8
14.9
16.6
0.7
0.7
Setco Automotive
Neutral
29
-
393
594
741
12.7
13.7
1.7
3.2
17.3
9.2
1.8
1.6
10.4
16.9
1.1
0.9
Tata Motors
Buy
299
409
86,226
266,022
312,667
12.8
13.1
26.3
38.3
11.4
7.8
1.5
1.3
8.4
12.1
0.5
0.4
TVS Motor
Buy
276
330
13,120
11,263
13,122
6.9
8.5
9.2
15.0
30.0
18.4
6.9
5.5
22.7
29.6
1.2
1.0
Amara Raja Batteries
Buy
826
1,040
14,102
4,892
5,871
17.4
17.6
28.8
37.1
28.7
22.3
6.7
5.4
23.4
24.1
2.8
2.3
Exide Industries
Buy
128
162
10,867
6,950
7,784
14.4
14.8
6.6
7.3
19.4
17.5
2.4
2.2
12.6
12.8
1.3
1.1
Apollo Tyres
Buy
148
171
7,539
12,146
12,689
16.8
16.0
21.2
19.0
7.0
7.8
1.2
1.0
16.5
13.0
0.7
0.7
Ceat
Buy
893
1,119
3,612
6,041
6,597
14.1
13.7
99.5
111.9
9.0
8.0
1.8
1.5
19.6
18.5
0.7
0.6
JK Tyres
Neutral
80
-
1,812
7,446
7,669
15.2
14.0
19.6
18.4
4.1
4.3
1.0
0.9
25.2
19.5
0.6
0.5
Swaraj Engines
Buy
785
919
975
552
630
14.2
14.7
44.6
54.1
17.6
14.5
4.1
3.7
23.2
25.6
1.6
1.4
Subros
Neutral
80
-
477
1,293
1,527
11.8
11.9
4.2
6.7
18.9
11.9
1.4
1.3
7.7
11.5
0.7
0.6
Indag Rubber
Neutral
157
-
412
283
329
17.0
17.2
13.0
15.4
12.1
10.2
2.6
2.2
21.8
21.6
1.2
1.0
Capital Goods
ACE
Neutral
34
-
334
660
839
4.7
8.2
1.0
3.9
33.8
8.7
1.1
0.9
3.2
11.3
0.7
0.5
BEML
Neutral
940
-
3,915
3,277
4,006
6.0
8.9
29.2
64.3
32.2
14.6
1.8
1.6
5.7
11.7
1.3
1.0
Bharat Electronics
Buy
1,125
1,414
27,011
7,737
8,634
16.8
17.2
54.0
61.5
20.8
18.3
3.0
2.6
39.3
45.6
2.6
2.2
Stock Watch
February 15, 2016
Company Name
Reco
CMP
Target
Mkt Cap
Sales ( Čcr )
OPM(%)
EPS (Č)
PER(x)
P/BV(x)
RoE(%)
EV/Sales(x)
(Č)
Price ( Č)
( Č cr )
FY16E
FY17E
FY16E
FY17E
FY16E
FY17E
FY16E
FY17E
FY16E
FY17E
FY16E
FY17E
FY16E
FY17E
Capital Goods
Voltas
Buy
229
353
7,589
5,363
5,963
8.0
9.1
11.0
13.8
20.9
16.6
3.2
2.8
16.2
17.9
1.4
1.2
BGR Energy
Neutral
97
-
698
3,615
3,181
9.5
9.4
16.7
12.4
5.8
7.8
0.5
0.5
10.0
7.0
0.6
0.8
BHEL
Neutral
105
-
25,590
33,722
35,272
10.8
11.7
10.5
14.2
10.0
7.4
0.7
0.7
7.0
9.0
0.8
0.8
Blue Star
Buy
332
439
2,984
3,548
3,977
6.3
6.9
13.7
17.2
24.2
19.3
6.1
4.0
26.1
25.4
0.9
0.8
Crompton Greaves
Neutral
120
-
7,524
13,484
14,687
4.9
6.2
4.5
7.1
26.7
16.9
1.9
1.8
7.2
10.8
0.7
0.6
Greaves Cotton
Neutral
120
-
2,919
1,655
1,755
16.6
16.8
7.4
7.8
16.2
15.3
3.2
3.1
21.1
20.6
1.7
1.6
Inox Wind
Buy
245
458
5,444
4,980
5,943
17.0
17.5
26.6
31.6
9.2
7.8
2.8
2.0
35.0
30.0
1.2
1.0
KEC International
Neutral
101
-
2,600
8,791
9,716
6.1
6.8
5.4
8.2
18.7
12.3
1.9
1.7
10.0
14.0
0.5
0.5
Thermax
Neutral
754
-
8,984
6,413
7,525
7.4
8.5
30.5
39.3
24.7
19.2
3.8
3.3
15.0
17.0
1.4
1.1
Cement
ACC
Buy
1,220
1,630
22,909
13,151
14,757
16.4
18.3
63.9
83.4
19.1
14.6
2.5
2.3
13.3
16.1
1.6
1.3
Ambuja Cements
Buy
195
233
30,200
11,564
12,556
19.4
20.7
8.9
10.1
21.9
19.3
2.7
2.6
12.8
13.8
2.3
2.0
HeidelbergCement
Neutral
64
-
1,442
1,772
1,926
13.3
15.4
1.0
3.0
63.7
21.2
1.6
1.5
2.6
7.9
1.4
1.2
India Cements
Buy
71
112
2,175
4,216
4,840
18.0
19.5
4.0
9.9
17.7
7.2
0.7
0.7
4.0
9.5
0.8
0.7
JK Cement
Buy
445
744
3,110
3,661
4,742
10.1
15.8
18.0
61.0
24.7
7.3
1.8
1.6
7.5
22.9
1.3
1.0
J K Lakshmi Cement
Buy
262
430
3,081
2,947
3,616
16.7
19.9
11.5
27.2
22.8
9.6
2.2
1.9
9.8
20.8
1.5
1.2
Mangalam Cements
Neutral
158
-
420
1,053
1,347
10.5
13.3
8.4
26.0
18.8
6.1
0.8
0.7
4.3
12.5
0.8
0.6
Orient Cement
Buy
137
183
2,801
1,854
2,524
21.2
22.2
7.7
11.1
17.8
12.3
2.6
2.2
13.3
15.7
2.3
1.6
Ramco Cements
Neutral
367
-
8,728
4,036
4,545
20.8
21.3
15.1
18.8
24.3
19.5
3.0
2.6
12.9
14.3
2.7
2.3
Shree Cement^
Neutral
10,430
-
36,334
7,150
8,742
26.7
28.6
228.0
345.5
45.7
30.2
6.7
5.7
15.7
20.3
4.8
3.9
UltraTech Cement
Buy
2,769
3,282
75,999
25,021
30,023
19.1
21.6
89.0
132.0
31.1
21.0
3.6
3.1
12.2
15.9
3.1
2.6
Construction
ITNL
Neutral
67
-
2,193
7,360
8,825
34.0
35.9
7.0
9.0
9.5
7.4
0.3
0.3
3.2
3.7
3.7
3.6
KNR Constructions
Buy
446
673
1,255
937
1,470
14.3
14.0
33.5
38.6
13.3
11.6
2.0
1.7
15.4
15.4
1.4
0.9
Larsen & Toubro
Buy
1,054
1,310
98,150
58,870
65,708
8.3
10.3
42.0
53.0
25.1
19.9
1.7
1.6
8.8
11.2
1.9
1.7
Gujarat Pipavav Port
Neutral
148
-
7,131
629
684
51.0
52.2
6.4
5.9
23.1
25.0
3.0
2.8
15.9
12.7
11.0
9.9
MBL Infrastructures
Buy
125
285
518
2,313
2,797
12.2
14.6
19.0
20.0
6.6
6.3
0.7
0.6
11.3
10.6
0.9
0.8
Nagarjuna Const.
Neutral
59
-
3,297
7,892
8,842
8.8
9.1
3.0
5.3
19.8
11.2
1.0
0.9
5.0
8.5
0.7
0.5
PNC Infratech
Accumulate
498
558
2,556
1,873
2,288
13.2
13.5
24.0
32.0
20.8
15.6
2.0
1.8
12.1
12.3
1.5
1.2
Simplex Infra
Neutral
238
-
1,176
5,955
6,829
10.3
10.5
16.0
31.0
14.9
7.7
0.8
0.7
5.3
9.9
0.7
0.6
Power Mech Projects
Neutral
554
-
815
1,539
1,801
12.8
12.7
59.0
72.1
9.4
7.7
1.4
1.2
18.6
16.8
0.5
0.5
Stock Watch
February 15, 2016
Company Name
Reco
CMP
Target
Mkt Cap
Sales ( Čcr )
OPM(%)
EPS (Č)
PER(x)
P/BV(x)
RoE(%)
EV/Sales(x)
(Č)
Price ( Č)
( Č cr )
FY16E
FY17E
FY16E
FY17E
FY16E
FY17E
FY16E
FY17E
FY16E
FY17E
FY16E
FY17E
FY16E
FY17E
Construction
Sadbhav Engineering
Neutral
243
-
4,164
3,481
4,219
10.7
10.8
8.0
12.0
30.3
20.2
2.8
2.5
10.3
13.5
1.5
1.2
NBCC
Buy
838
1,089
10,056
5,816
7,382
6.9
7.7
29.6
39.8
28.3
21.1
5.1
4.0
24.1
26.7
1.5
1.1
MEP Infra
Neutral
39
-
641
1,956
1,876
28.1
30.5
1.3
3.0
30.3
13.1
6.4
4.3
21.2
32.8
1.7
1.7
SIPL
Neutral
72
-
2,534
675
1,042
62.4
64.7
-
-
2.7
3.1
-
-
15.4
10.4
Financials
Allahabad Bank
Neutral
41
-
2,477
8,569
9,392
2.8
2.9
16.3
27.5
2.5
1.5
0.2
0.2
7.6
11.9
-
-
Axis Bank
Buy
391
494
93,015
26,473
31,527
3.5
3.6
35.7
43.5
10.9
9.0
1.8
1.6
17.9
18.9
-
-
Bank of Baroda
Neutral
114
-
26,348
18,485
21,025
1.9
2.0
13.5
21.1
8.5
5.4
0.7
0.6
7.3
10.6
-
-
Bank of India
Neutral
85
-
6,881
15,972
17,271
1.9
2.0
15.3
33.4
5.5
2.5
0.3
0.2
3.6
7.6
-
-
Canara Bank
Neutral
173
-
9,391
15,441
16,945
2.0
2.1
46.6
70.4
3.7
2.5
0.3
0.3
8.0
11.2
-
-
Dena Bank
Neutral
28
-
1,784
3,440
3,840
2.1
2.3
7.3
10.0
3.8
2.8
0.3
0.2
6.1
7.9
-
-
Federal Bank
Neutral
43
-
7,403
3,477
3,999
3.0
3.0
5.0
6.2
8.6
6.9
0.9
0.8
10.6
11.9
-
-
HDFC
Neutral
1,084
-
171,079
10,358
11,852
3.3
3.3
41.1
47.0
26.4
23.0
5.0
4.6
24.7
24.9
-
-
HDFC Bank
Buy
973
1,262
245,877
38,309
47,302
4.3
4.3
49.3
61.1
19.7
15.9
3.4
2.9
18.5
19.7
-
-
ICICI Bank
Buy
194
254
112,883
34,279
39,262
3.3
3.3
21.0
24.4
9.3
8.0
1.6
1.3
14.4
14.7
-
-
IDBI Bank
Neutral
52
-
9,899
9,625
10,455
1.8
1.8
8.5
14.2
6.1
3.7
0.4
0.3
5.9
9.3
-
-
Indian Bank
Neutral
83
-
3,994
6,160
6,858
2.5
2.5
24.5
29.8
3.4
2.8
0.3
0.2
7.7
8.6
-
-
LIC Housing Finance
Buy
409
592
20,621
3,101
3,745
2.5
2.5
33.0
40.2
12.4
10.2
2.3
2.0
19.7
20.5
-
-
Oriental Bank
Neutral
82
-
2,462
7,643
8,373
2.4
2.4
37.2
45.4
2.2
1.8
0.2
0.2
8.2
9.4
-
-
Punjab Natl.Bank
Neutral
74
-
14,531
23,638
26,557
2.8
2.8
17.9
27.2
4.1
2.7
0.4
0.3
8.5
12.0
-
-
South Ind.Bank
Neutral
18
-
2,383
1,965
2,185
2.5
2.5
2.5
3.3
7.1
5.3
0.7
0.6
9.5
11.7
-
-
St Bk of India
Buy
155
202
120,284
82,520
93,299
2.7
2.8
20.0
24.5
7.7
6.3
0.8
0.8
11.5
12.8
-
-
Union Bank
Neutral
110
-
7,572
12,646
14,129
2.3
2.4
31.0
39.1
3.6
2.8
0.4
0.3
9.8
11.4
-
-
Vijaya Bank
Neutral
30
-
2,539
3,536
3,827
1.9
1.9
5.5
6.7
5.4
4.4
0.4
0.4
7.8
8.8
-
-
Yes Bank
Accumulate
727
767
30,517
7,190
9,011
3.2
3.3
58.2
69.7
12.5
10.4
2.2
1.9
19.2
19.6
-
-
FMCG
Asian Paints
Neutral
856
-
82,122
16,553
19,160
16.0
16.2
17.7
21.5
48.4
39.8
12.9
11.6
29.4
31.2
4.8
4.1
Britannia
Neutral
2,569
-
30,821
8,065
9,395
9.6
10.2
47.2
65.5
54.4
39.2
18.1
17.1
38.3
41.2
3.7
3.1
Colgate
Neutral
837
-
22,767
4,836
5,490
19.5
19.7
48.5
53.2
17.3
15.7
12.7
11.0
99.8
97.5
4.6
4.0
Dabur India
Accumulate
247
267
43,486
9,370
10,265
17.1
17.2
7.3
8.1
33.7
30.5
10.2
8.3
33.7
30.6
4.5
4.1
GlaxoSmith Con*
Accumulate
5,760
6,118
24,225
4,919
5,742
17.2
17.4
168.3
191.2
34.2
30.1
9.7
8.3
28.8
28.9
4.5
3.8
Stock Watch
February 15, 2016
Company Name
Reco
CMP
Target
Mkt Cap
Sales ( Čcr )
OPM(%)
EPS (Č)
PER(x)
P/BV(x)
RoE(%)
EV/Sales(x)
(Č)
Price ( Č)
( Č cr )
FY16E FY17E
FY16E
FY17E
FY16E
FY17E
FY16E
FY17E
FY16E
FY17E
FY16E
FY17E
FY16E
FY17E
FMCG
Godrej Consumer
Neutral
1,208
-
41,119
10,168
12,886
16.1
16.1
32.1
38.4
37.6
31.5
7.7
7.1
19.7
21.0
4.1
3.3
HUL
Neutral
811
-
175,479
34,940
38,957
17.5
17.7
20.8
24.7
39.0
32.8
43.4
34.7
110.5
114.2
4.8
4.3
ITC
Buy
300
359
241,349
41,068
45,068
37.8
37.4
13.9
15.9
21.6
18.9
7.2
6.4
34.1
33.8
5.5
5.0
Marico
Neutral
228
-
29,455
6,551
7,766
15.7
16.0
10.4
12.5
22.0
18.3
6.4
5.3
33.2
32.4
4.4
3.7
Nestle*
Buy
5,057
6,646
48,756
11,291
12,847
22.2
22.3
158.9
184.6
31.8
27.4
16.6
15.0
55.0
57.3
4.2
3.6
Tata Global
Buy
104
144
6,583
8,635
9,072
9.8
9.9
6.5
7.6
16.1
13.7
1.6
1.5
6.8
7.4
0.7
0.7
IT
HCL Tech^
Buy
798
1,038
112,506
42,038
47,503
21.2
21.5
51.5
57.7
15.5
13.8
3.4
2.6
21.5
18.8
2.3
1.8
Infosys
Buy
1,084
1,347
248,874
61,850
69,981
27.5
27.5
59.4
65.7
18.2
16.5
3.9
3.3
21.2
20.1
3.3
2.8
TCS
Buy
2,227
2,854
438,716
108,487
122,590
28.3
28.5
122.8
138.4
18.1
16.1
6.9
6.3
38.0
38.9
3.6
3.2
Tech Mahindra
Buy
430
646
41,615
25,566
28,890
16.0
17.0
26.3
31.9
16.4
13.5
2.9
2.5
17.9
18.6
1.4
1.2
Wipro
Buy
517
680
127,773
50,808
56,189
23.7
23.8
37.3
40.7
13.9
12.7
2.6
2.4
19.2
17.7
2.0
1.6
Media
D B Corp
Buy
308
356
5,660
2,241
2,495
27.8
27.9
21.8
25.6
14.2
12.0
3.7
3.3
26.7
28.5
2.5
2.2
HT Media
Neutral
76
-
1,769
2,495
2,603
11.2
11.2
7.3
8.6
10.4
8.8
0.8
0.7
7.4
8.1
0.2
0.2
Jagran Prakashan
Buy
154
189
5,020
2,170
2,355
27.2
26.2
8.9
9.9
17.3
15.5
3.6
3.2
20.9
20.5
2.2
2.0
Sun TV Network
Neutral
330
-
12,993
2,779
3,196
70.2
70.5
22.8
27.3
14.5
12.1
3.6
3.2
26.7
28.3
4.4
3.8
Hindustan Media
Neutral
264
-
1,941
920
1,031
20.0
20.0
19.2
20.9
13.8
12.7
2.3
1.9
16.4
15.3
1.7
1.5
Ventures
Metals & Mining
Coal India
Buy
304
380
191,702
76,167
84,130
19.9
22.3
22.4
25.8
13.5
11.8
4.9
4.8
35.5
41.0
1.8
1.6
Hind. Zinc
Accumulate
158
175
66,887
14,641
14,026
50.4
50.4
17.7
16.0
9.0
9.9
1.4
1.3
16.2
13.2
2.2
2.0
Hindalco
Neutral
61
-
12,596
104,356
111,186
8.7
9.5
6.7
11.1
9.1
5.5
0.3
0.3
3.5
5.9
0.7
0.6
JSW Steel
Neutral
1,006
-
24,306
42,308
45,147
16.4
20.7
(10.3)
49.5
20.3
1.1
1.1
(1.0)
5.6
1.6
1.5
NMDC
Neutral
79
-
31,202
8,237
10,893
46.6
44.5
10.0
11.7
7.9
6.8
0.9
0.8
12.5
13.0
3.6
2.7
SAIL
Neutral
35
-
14,290
45,915
53,954
7.2
10.5
1.5
4.4
23.0
7.9
0.3
0.3
2.3
4.1
1.0
0.9
Vedanta
Neutral
63
-
18,752
71,445
81,910
26.2
26.3
12.9
19.2
4.9
3.3
0.3
0.3
7.2
8.9
0.7
0.5
Tata Steel
Neutral
218
-
21,158
126,760
137,307
8.9
11.3
6.4
23.1
34.2
9.4
0.7
0.7
2.0
7.1
0.7
0.7
Oil & Gas
Cairn India
Neutral
119
-
22,255
11,323
12,490
49.4
51.0
20.7
20.7
5.7
5.8
0.4
0.4
6.4
6.1
1.0
0.4
GAIL
Neutral
326
-
41,314
64,856
70,933
9.1
9.6
24.0
28.9
13.6
11.3
1.2
1.1
8.8
9.6
0.8
0.7
ONGC
Neutral
194
-
165,592
154,564
167,321
36.8
37.4
28.6
32.5
6.8
6.0
0.9
0.8
12.7
13.5
1.3
1.2
Petronet LNG
Neutral
242
-
18,135
29,691
31,188
5.8
6.2
12.8
13.4
18.9
18.0
2.8
2.5
15.8
14.8
0.7
0.6
Indian Oil Corp
Buy
365
455
88,511
359,607
402,760
5.9
6.1
42.5
48.7
8.6
7.5
1.2
1.0
14.1
14.4
0.4
0.3
Stock Watch
February 15, 2016
Company Name
Reco
CMP
Target
Mkt Cap
Sales ( Čcr )
OPM(%)
EPS (Č)
PER(x)
P/BV(x)
RoE(%)
EV/Sales(x)
(Č)
Price ( Č)
( Č cr )
FY16E FY17E
FY16E
FY17E
FY16E
FY17E
FY16E
FY17E
FY16E
FY17E
FY16E
FY17E
FY16E
FY17E
Oil & Gas
Reliance Industries
Buy
906
1,150
293,587
304,775
344,392
12.6
13.4
91.3
102.6
9.9
8.8
1.1
1.0
11.8
12.0
0.9
0.7
Pharmaceuticals
Alembic Pharma
Neutral
589
-
11,112
3,274
3,802
26.9
19.4
35.0
28.7
16.8
20.5
7.5
5.6
55.6
31.2
3.4
2.8
Aurobindo Pharma
Buy
660
856
38,575
14,923
17,162
22.0
23.0
35.7
42.8
18.5
15.4
5.4
4.1
34.0
30.2
3.0
2.5
Aventis*
Neutral
4,155
-
9,569
2,082
2,371
17.4
20.8
118.2
151.5
35.2
27.4
5.1
4.1
19.9
25.5
4.3
3.5
Cadila Healthcare
Accumulate
306
352
31,357
10,224
11,840
21.0
22.0
14.6
17.6
21.0
17.4
5.8
4.5
30.8
29.0
3.1
2.6
Cipla
Buy
529
636
42,464
14,211
16,611
20.6
19.0
27.0
28.9
19.6
18.3
3.3
2.9
18.4
16.8
3.0
2.5
Dr Reddy's
Buy
2,846
3,933
48,542
16,838
19,575
25.0
23.1
167.5
178.8
17.0
15.9
3.6
3.0
23.1
20.4
2.8
2.4
Dishman Pharma
Neutral
304
-
2,452
1,733
1,906
21.5
21.5
17.0
19.9
17.9
15.3
1.8
1.6
10.5
11.2
1.9
1.6
GSK Pharma*
Neutral
3,204
-
27,136
2,870
3,158
20.0
22.1
59.5
68.3
53.8
46.9
15.9
16.3
28.5
34.3
9.0
8.2
Indoco Remedies
Neutral
269
-
2,483
1,033
1,199
15.9
18.2
9.4
13.6
28.7
19.8
4.3
3.6
15.7
19.7
2.5
2.2
Ipca labs
Buy
585
900
7,378
3,363
3,909
12.9
18.6
13.4
28.0
43.6
20.9
3.1
2.7
7.4
14.0
2.5
2.1
Lupin
Neutral
1,751
-
78,888
13,092
16,561
25.0
27.0
50.4
68.3
34.7
25.6
7.2
5.7
22.8
24.7
5.7
4.4
Sun Pharma
Accumulate
848
950
204,164
28,163
32,610
25.8
30.7
17.4
26.9
48.8
31.5
4.6
4.0
13.0
16.6
6.7
5.6
Power
Tata Power
Neutral
57
-
15,335
35,923
37,402
22.6
22.8
4.1
5.2
14.0
11.0
1.1
1.0
7.5
9.3
1.4
1.3
NTPC
Buy
124
157
102,285
87,064
98,846
23.5
23.5
11.7
13.2
10.6
9.4
1.2
1.1
11.4
12.1
2.2
2.0
Power Grid
Buy
138
170
72,301
20,702
23,361
86.7
86.4
12.1
13.2
11.4
10.5
1.7
1.5
15.6
15.1
8.4
7.8
Telecom
Bharti Airtel
Neutral
325
-
130,015
101,748
109,191
32.1
31.7
12.0
12.5
27.1
26.0
1.9
1.8
6.9
6.7
1.9
1.7
Idea Cellular
Neutral
110
-
39,605
34,282
36,941
32.0
31.5
5.9
6.2
18.6
17.7
1.7
1.6
9.9
9.3
1.7
1.6
zOthers
Abbott India
Neutral
4,803
-
10,206
2,715
3,153
14.5
14.1
134.3
152.2
35.8
31.6
8.9
7.4
27.4
25.6
3.5
2.9
Bajaj Electricals
Buy
168
290
1,698
4,719
5,287
5.2
5.8
8.6
12.7
19.7
13.3
2.2
2.0
11.4
14.8
0.4
0.3
Finolex Cables
Neutral
221
-
3,378
2,520
2,883
12.2
12.0
12.7
14.2
17.4
15.6
2.4
2.1
13.6
13.5
1.1
0.9
Goodyear India*
Buy
487
582
1,122
1,800
1,600
11.7
11.5
58.7
52.9
8.3
9.2
1.9
1.6
24.6
18.7
0.4
0.4
Hitachi
Neutral
1,051
-
2,858
1,779
2,081
7.8
8.8
21.8
33.4
48.2
31.4
7.8
6.3
17.4
22.1
1.7
1.4
Jyothy Laboratories
Neutral
264
-
4,781
1,620
1,847
11.5
11.5
7.3
8.5
36.2
31.2
4.7
4.3
13.3
14.4
2.8
2.4
MRF
Buy
31,762
45,575
13,471
20,316
14,488
21.4
21.1
5,488.0
3,798.0
5.8
8.4
2.0
1.6
41.1
21.2
0.6
0.8
Page Industries
Neutral
10,248
-
11,431
1,929
2,450
19.8
20.1
229.9
299.0
44.6
34.3
19.7
13.7
52.1
47.1
6.0
4.7
Relaxo Footwears
Neutral
400
-
4,806
1,767
2,152
12.3
12.5
19.3
25.1
20.8
16.0
5.1
3.9
27.7
27.8
2.8
2.3
Siyaram Silk Mills
Buy
1,002
1,354
939
1,636
1,815
11.5
11.5
89.9
104.1
11.1
9.6
1.8
1.6
17.9
17.8
0.7
0.7
Styrolution ABS India*
Neutral
513
-
902
1,271
1,440
8.6
9.2
32.0
41.1
16.0
12.5
1.6
1.5
10.7
12.4
0.7
0.6
Stock Watch
February 15, 2016
Company Name
Reco
CMP
Target
Mkt Cap
Sales ( Čcr )
OPM(%)
EPS (Č)
PER(x)
P/BV(x)
RoE(%)
EV/Sales(x)
(Č)
Price ( Č)
( Č cr )
FY16E
FY17E
FY16E
FY17E
FY16E
FY17E
FY16E
FY17E
FY16E
FY17E
FY16E
FY17E
FY16E
FY17E
zOthers
TVS Srichakra
Buy
2,229
3,217
1,707
2,035
2,252
15.9
15.3
248.6
268.1
9.0
8.3
3.9
2.8
43.6
33.9
0.9
0.7
HSIL
Buy
245
302
1,773
2,123
2,384
16.1
16.5
15.0
18.9
16.3
13.0
1.3
1.2
8.0
9.4
1.2
1.0
Kirloskar Engines India
Neutral
213
-
3,082
2,403
2,554
8.6
9.9
9.2
10.5
23.2
20.3
2.2
2.1
9.7
10.7
0.9
0.8
Ltd
M M Forgings
Buy
376
614
454
511
615
21.7
21.6
43.1
55.8
8.7
6.7
1.6
1.3
19.9
21.2
1.1
0.8
Banco Products (India) Neutral
101
-
722
1,208
1,353
11.0
12.3
10.8
14.5
9.4
7.0
1.1
1.0
11.9
14.5
0.6
0.5
Competent Automobiles Neutral
121
-
75
1,040
1,137
3.2
3.1
25.7
28.0
4.7
4.3
0.7
0.6
15.0
14.3
0.1
-
Nilkamal
Neutral
1,049
-
1,565
1,871
2,031
10.7
10.5
63.2
69.8
16.6
15.0
2.7
2.3
17.6
16.6
0.9
0.8
Visaka Industries
Buy
91
144
144
1,086
1,197
9.9
10.3
21.5
28.8
4.2
3.2
0.4
0.4
9.6
11.6
0.4
0.3
Transport Corporation of
Neutral
223
-
1,694
2,830
3,350
8.8
9.0
14.4
18.3
15.5
12.2
2.4
2.1
15.4
17.1
0.7
0.6
India
Elecon Engineering
Neutral
50
-
543
1,359
1,482
10.3
13.7
0.8
3.9
62.1
12.8
1.0
1.0
1.6
7.8
0.8
0.7
Surya Roshni
Buy
131
201
572
2,992
3,223
8.1
8.4
14.7
18.3
8.9
7.1
0.8
0.8
9.7
11.0
0.5
0.4
MT Educare
Neutral
143
-
570
286
366
18.3
17.7
7.7
9.4
18.5
15.3
3.9
3.4
20.2
21.1
1.9
1.4
Radico Khaitan
Buy
97
156
1,292
1,517
1,635
12.7
13.4
5.8
7.1
16.7
13.7
1.4
1.3
8.6
9.6
1.3
1.2
Garware Wall Ropes
Buy
294
473
643
862
974
11.2
11.2
24.9
29.6
11.8
9.9
1.8
1.5
15.1
15.4
0.7
0.6
Wonderla Holidays
Neutral
345
-
1,948
206
308
44.0
43.6
9.0
12.9
38.3
26.7
5.2
4.7
13.7
17.8
9.4
6.2
Linc Pen & Plastics
Accumulate
173
185
255
340
371
8.3
8.9
10.8
13.2
16.0
13.1
2.6
2.2
16.0
17.1
0.8
0.7
The Byke Hospitality
Neutral
150
-
603
222
287
20.5
20.5
5.6
7.6
26.7
19.9
5.0
4.1
18.9
20.8
2.7
2.1
Interglobe Aviation
Neutral
780
-
28,095
17,022
21,122
20.7
14.5
63.9
53.7
12.2
14.5
18.3
15.0
149.9
103.2
1.7
1.3
Coffee Day Enterprises
Neutral
222
-
4,583
2,692
2,964
17.0
18.6
-
4.7
-
46.9
2.7
2.6
0.2
5.5
2.1
2.0
Ltd
Navneet Education
Neutral
82
-
1,943
998
1,062
24.1
24.0
5.8
6.1
14.2
13.4
3.1
2.8
22.0
20.6
2.0
1.9
Navkar Corporation
Buy
168
265
2,393
365
436
38.3
37.5
5.6
5.9
29.8
28.6
1.9
1.8
6.3
6.1
7.4
6.3
Source: Company, Angel Research; Note: *December year end; #September year end; &October year end; Price as on February 12, 2016
Market Outlook
February 15, 2016
Research Team Tel: 022 - 39357800
DISCLAIMER
Angel Broking Private Limited (hereinafter referred to as “Angel”) is a registered Member of National Stock Exchange of India Limited,
Bombay Stock Exchange Limited and Metropolitian Stock Exchange of India Limited. It is also registered as a Depository Participant with
CDSL and Portfolio Manager with SEBI. It also has registration with AMFI as a Mutual Fund Distributor. Angel Broking Private Limited is a
registered entity with SEBI for Research Analyst in terms of SEBI (Research Analyst) Regulations, 2014 vide registration number
INH000000164. Angel or its associates has not been debarred/ suspended by SEBI or any other regulatory authority for accessing
/dealing in securities Market. Angel or its associates including its relatives/analyst do not hold any financial interest/beneficial ownership
of more than 1% in the company covered by Analyst. Angel or its associates/analyst has not received any compensation / managed or co
-managed public offering of securities of the company covered by Analyst during the past twelve months. Angel/analyst has not served as
an officer, director or employee of company covered by Analyst and has not been engaged in market making activity of the company
covered by Analyst.
This document is solely for the personal information of the recipient, and must not be singularly used as the basis of any investment
decision. Nothing in this document should be construed as investment or financial advice. Each recipient of this document should make
such investigations as they deem necessary to arrive at an independent evaluation of an investment in the securities of the companies
referred to in this document (including the merits and risks involved), and should consult their own advisors to determine the merits and
risks of such an investment.
Reports based on technical and derivative analysis center on studying charts of a stock's price movement, outstanding positions and
trading volume, as opposed to focusing on a company's fundamentals and, as such, may not match with a report on a company's
fundamentals.
The information in this document has been printed on the basis of publicly available information, internal data and other reliable sources
believed to be true, but we do not represent that it is accurate or complete and it should not be relied on as such, as this document is for
general guidance only. Angel Broking Pvt. Limited or any of its affiliates/ group companies shall not be in any way responsible for any
loss or damage that may arise to any person from any inadvertent error in the information contained in this report. Angel Broking Pvt.
Limited has not independently verified all the information contained within this document. Accordingly, we cannot testify, nor make any
representation or warranty, express or implied, to the accuracy, contents or data contained within this document. While Angel Broking
Pvt. Limited endeavors to update on a reasonable basis the information discussed in this material, there may be regulatory, compliance,
or other reasons that prevent us from doing so.
This document is being supplied to you solely for your information, and its contents, information or data may not be reproduced,
redistributed or passed on, directly or indirectly.
Neither Angel Broking Pvt. Limited, nor its directors, employees or affiliates shall be liable for any loss or damage that may arise from or
in connection with the use of this information.
Note: Please refer to the important ‘Stock Holding Disclosure' report on the Angel website (Research Section). Also, please refer to the
latest update on respective stocks for the disclosure status in respect of those stocks. Angel Broking Pvt. Limited and its affiliates may have
investment positions in the stocks recommended in this report.