Market Outlook
January 15, 2016
Market Cues
Domestic Indices
Chg (%)
(Pts)
(Close)
Indian markets are expected to open on a flat note tracking the SGX Nifty and
BSE Sensex
(0.3)
(81)
24,773
Global markets.
Nifty
(0.3)
(26)
7,537
U.S. stocks rallied sharply Thursday as a rebound in oil prices allowed the main
Mid Cap
(1.0)
(107)
10,629
indexes to claw back much of the steep fall seen in the previous session.
Small Cap
(1.3)
(143)
11,131
European market ended Thursday's session in the red, but pared its losses in late
Bankex
(1.7)
(302)
17,720
trade. The late recovery was sparked by the market reversal in the U.S. after a rally
in the energy sector.
Global Indices
Chg (%)
(Pts)
(Close)
Indian markets pared early losses to end off their day's lows on Thursday after IT
Dow Jones
1.4
228
16,379
heavyweight Infosys beat Street estimates for the third straight quarter and revised
Nasdaq
2.0
89
4,615
dollar revenue growth guidance upwards.
FTSE
(0.7)
(43)
5,918
News & Result Analysis
Nikkei
(2.7)
(475)
17,241
Mahindra & Mahindra to beat diesel ban; develops 1.9 litre engine to go
Hang Seng
(0.6)
(117)
19,817
around SC ruling
Shanghai Com
2.0
58
3,008
Result Review: Infosys
Detailed analysis on Pg2
Advances / Declines
BSE
NSE
Investor’s Ready Reckoner
Advances
785
382
Key Domestic & Global Indicators
Declines
1,924
1,190
Stock Watch: Latest investment recommendations on 150+ stocks
Unchanged
160
47
Refer P6 onwards
Top Picks
Volumes (` Cr)
CMP
Target
Upside
Company
Sector
Rating
BSE
3,152
(`)
(`)
(%)
NSE
18,544
Amara Raja Batteries Auto & Auto Ancillary
Buy
819
1,040
27.0
HCL Tech
IT
Buy
829
1,132
36.5
Larsen & Toubro
Construction
Buy
1,135
1,646
45.0
Net Inflows (` Cr)
Net
Mtd
Ytd
LIC Housing Finance Financials
Buy
485
592
22.0
FII
282
(3,436)
16,923
Navkar Corporation Others
Buy
201
265
32.1
MFs
278
1,640
70,135
More Top Picks on Pg5
Top Gainers
Price (`)
Chg (%)
Key Upcoming Events
Previous
Consensus
Redington
114
6.3
Date
Region
Event Description
Reading
Expectations
Fortis
181
6.0
Jan 15
US
Industrial Production
(0.56)
(0.20)
Niittech
572
4.6
Jan 19
UK
CPI (YoY)
0.10
0.10
Infy
1,129
4.3
China
Industrial Production (YoY)
6.20
6.10
China
Real GDP (YoY)
6.90
6.90
Max
479
4.2
Jan 20
UK
Jobless claims change
3.90
4.00
Top Losers
Price (`)
Chg (%)
Jindalstel
72
(7.2)
Torntpower
220
(7.1)
Ktkbank
99
(7.0)
Abirlanuvo
2,052
(5.9)
Idbi
66
(5.8)
As on January 14, 2015
Market Outlook
January 15, 2016
Mahindra & Mahindra to beat diesel ban; develops 1.9 litre
engine to go around SC ruling
Mahindra & Mahindra (M&M) has found a way to go around the Supreme Court
order suspending registration of vehicles strapped with diesel engines bigger than
2.0 litres. As per industry sources, M&M has made a smaller version of the mHawk
engine that powers the Scorpio and XUV 500. The new engine is of 1.9 litres,
smaller than the 2.2-litre plant that traditionally powers the SUV, bringing it within
the limits set by the court for registration of diesel vehicles. A prototype of the new
Scorpio with the trimmed-down engine has been approved by the Automotive
Research Association of India and it will reach dealerships for sale soon. While the
Scorpio is the first vehicle to get the smaller power plant, the more premium XUV
500 too will get it starting February. The company will offer the new versions of the
popular SUVs across the country, though the three-month suspension of
registration covers only the National Capital Region, comprising Delhi and its
satellite cities.
There is apprehension in the auto industry that the curbs on diesel vehicles could
be extended and expanded. The increasing awareness about the need to lower
emissions and the push towards cleaner fuels, too, could affect sales of big diesel
vehicles, which are the mainstay for M&M. Though the NCR accounts for just 4% of
M&M's passenger vehicle sales, the company is eager to avoid the larger risks.
M&M had done the engine downsizing in-house, though the engine mapping work
was outsourced to a supplier. Despite downsizing the power, the torque is
expected to be maintained at the level offered with the 2.2-litre engine.
A few days after the Supreme Court order, M&M had said the company would
look at the possibility of redesigning the engine. The company had also stated that
it is coming up with a petrol line-up, which will be made available over a period of
time. M&M was the most impacted by the ban as its top selling products — Bolero,
Scorpio, XUV500, Thar and Xylo — all have diesel engines larger than 2 litres.
M&M recently introduced a new family of 1.2-litre diesel and petrol engines called
the mFalcon. The company's KUV100 which would be launched shortly is the first
vehicle to be powered by this engine family. M&M has been able to swiftly find out
a way to comply with the Honourable Supreme Court order and would be ready to
prevent the loss in sales in the event the diesel ban for larger vehicles (more than
2,000 cc) is extended beyond 31st March 2016 in NCR region or in the event the
ban is applied to other cities in India. We maintain our Buy rating on the stock.
Result Review
Infosys (CMP: `1,129/ TP: Under Review: Buy / Upside :)
Contrary to expectations, Infosys has delivered a robust numbers. During
3QFY2016, company posted a 0.6% sequential growth in USD revenues to
US$2,407mn V/s US$2,368mn expected. On constant Currency (CC) terms, the
company posted a 1.1% qoq. In rupee terms, revenues came in at `15,902cr V/s
`15,610cr expected a qoq growth of 1.7% qoq. Volume growth during the quarter
was 3.1% qoq. The volume growth was driven by more onsite which grew by
4.4% qoq, while the offshore volume growth was 2.5% qoq.
Market Outlook
January 15, 2016
In terms of geography, North America posted a 0.5% CC growth, Europe posted a
3.9% qoq CC growth, India posted a 24.3% qoq CC growth and ROW posted a
0.3% qoq CC growth. In terms of Industry, FSI posted a 3.1% qoq CC growth,
MFG posted a 3.2% qoq CC growth, RCL posted a 0.1% qoq CC growth and ECS
posted a 4.6% qoq CC growth.
In terms of client addition, the company added 4 clients in the US$25mn+ and
one in US$50mn+. Overall the client’s active during the quarter was 1045.
Overall the Management is upbeat about the future prospects, with strong order
book position, which is guided towards US$3bn. Also, the management has
guided towards a higher revenue guidance for FY2016, 12.8-13.2% in CC terms
and 16.2-16.6% in ` terms, as on 31st Dec’2015 (`66.16/ US$). The earlier
guidance was 10-12% growth in sales in CC terms for FY2016.
On operating front, the EBITDA margins came in at 27.2% V/s 27.0% expected
with a downtick of 68bp qoq, on back of pricing decline which dipped by qoq
2.5% and lower utilization. The utilization level was 74.2% (including trainee) and
80.6% (excluding trainee). Attrition (annualized consolidated) during the quarter
was 18.1% V/s 19.9% in 2QFY2016. Consequently, PAT came in at `3,465cr V/s
`3,251cr, a growth of 2.0% qoq. We maintain our buy on the stock with price
target to be revised.
Y/E
Sales OPM
PAT
EPS ROE P/E P/BV EV/EBITDA EV/Sales
March
(` cr)
(%)
(` cr)
(`)
(%)
(x)
(x)
(x)
(x)
FY2016E
60,250
27.0
12,955
56.4
20.4
20.1
4.1
13.5
3.6
FY2017E
66,999
28.0
14,629
63.7
19.8
17.8
3.5
11.2
3.1
Quarterly Bloomberg Brokers Consensus Estimate
Zee Entertainment Enterprises Ltd.- January 15, 2016
Particulars (` cr)
3QFY16E
3QFY15
y-o-y (%)
2QFY16
q-o-q (%)
Net sales
1,475
1,363
8.2
1,322
11.6
EBITDA
406
353
15.0
354
14.7
EBITDA margin (%)
27.5
25.9
26.8
Net profit
309
309
0.1
247
24.9
Hindustan Unilever Ltd. - January 15, 2016
Particulars (` cr)
3QFY16E
3QFY15
y-o-y (%)
2QFY16
q-o-q (%)
Net sales
8,090
7,579
6.7
7,820
3.5
EBITDA
1,435
1,331
7.8
1,326
8.2
EBITDA margin (%)
17.7
17.6
17.0
Net profit
1,026
1,252
(18.1)
962
6.7
Market Outlook
January 15, 2016
Economic and Political News
Govt to set up seperate department for transport: Gadkari
Japan banks, cos ready to invest in India's energy sector: Goyal
Goa's economy hit due to mining halt: Laxmikant Parsekar
Corporate News
Maruti Suzuki enhances safety features of Alto brand
Borosil to acquire Hopewell Tableware for `27cr
Talwalkars to acquire 50% stake in Chennai-based yoga chain Zorba
Market Outlook
January 15, 2016
Top Picks ★★★★★
Large Cap
Market Cap
CMP
Target
Upside
Company
Rationale
(` Cr)
(`)
(`)
(%)
To outpace battery industry growth due to better technological
Amara Raja Batteries
13,991
819
1,040
27.0
products leading to market share gains in both the automotive
OEM and replacement segments.
Earnings to grow strongly given the MHCV cyclical upturn.
Ashok Leyland
25,214
89
111
25.3
Focus on exports and LCV's provides additional growth
avenue.
The stock is trading at attractive valuations and is factoring all
HCL Tech
1,16,868
829
1,132
36.5
the bad news.
Strong visibility for a robust 20% earnings trajectory, coupled
HDFC Bank
2,65,020
1,050
1,262
20.3
with high quality of earnings on account of high quality retail
business and strategic focus on highly rated corporates.
Back on the growth trend, expect a long term growth of 14%
Infosys
2,59,256
1,129
1,306
15.7
to be a US$20bn in FY2020.
Well positioned to benefit from such expected gradual
recovery in the overall domestic capex cycle, given its presence
Larsen & Toubro
1,05,684
1,135
1,646
45.0
across various infrastructure segments, its execution
capabilities, and its strong balance sheet.
LICHF continues to grow its retail loan book at a healthy pace
with improvement in asset quality. We expect the company to
LIC Housing Finance
24,476
485
592
22.0
post a healthy loan book which is likely to reflect in a strong
earnings growth.
Source: Company, Angel Research
Mid Cap
Market Cap
CMP
Target
Upside
Company
Rationale
(` Cr)
(`)
(`)
(%)
Favourable outlook for the AC industry to augur well for
Cooling products business which is out pacing the market
Blue Star
3,248
361
439
21.5
growth. EMPPAC division's profitability to improve once
operating environment turns around.
Change in business focus towards high-margin chronic &
Garware Wall Ropes
845
386
473
22.4
lifestyle segments and increasing penetration in Europe and
US
Economic recovery to have favourable impact on advertising &
circulation revenue growth. Further, the acquisition of a radio
Jagran Prakashan
5,296
162
189
16.7
business (Radio City) would also boost the company's revenue
growth.
Massive capacity expansion along with rail advantage at ICD
Navkar Corporation
2,861
201
265
32.1
as well CFS augurs well for the company
Earnings boost on back of stable material prices and
Radico Khaitan
1,483
111
156
40.0
favourable pricing environment. Valuation discount to peers
provides additional comfort
Strong brands and distribution network would boost growth
Siyaram Silk Mills
1,099
1,172
1,354
15.5
going ahead. Stock currently trades at an inexpensive
valuation.
Structural shift in the Lighting industry towards LED lighting will
Surya Roshni
666
152
201
32.4
drive growth.
Source: Company, Angel Research
Market Outlook
January 15, 2016
Key Upcoming Events
Result Calendar
Date
Company
Jan 15, 2016
HUL, NIIT, Tide Water Oil India
Jan 16, 2016
LIC Housing Fin.
Jan 18, 2016
Rallis, Kotak Mah. Bank, Asian Paints, Wipro, Mindtree
Jan 19, 2016
HCL Tech, Hind. Zinc
Jan 20, 2016
UltraTech Cement, Axis Bank, South Ind.Bank, KPIT Cummins
Jan 21, 2016
Exide Industries, Heritage Foods, Alembic Pharma
Jan 22, 2016
Cairn India
Jan 23, 2016
Persistent
Jan 25, 2016
HDFC Bank, Hindustan Media Ventures
Jan 27, 2016
Colgate, Godrej Consumer, HT Media, Kirloskar Engines India Ltd
Jan 28, 2016
ICICI Bank, Dabur India, Jyothy Laboratories
Jan 29, 2016
Blue Star, JSW Steel , Elecon Engineering
Feb 1, 2016
Transport Corporation of India
Source: Bloomberg, Angel Research
Global economic events release calendar
Date
Time
Country
Event Description
Unit
Period
Bloomberg Data
Last Reported Estimated
Jan 15, 2016
7:45PM US
Industrial Production
%
Dec
(0.56)
(0.20)
US
Producer Price Index (mom)
% Change
Dec
0.10
--
Jan 19, 2016
3:00PM UK
CPI (YoY)
% Change
Dec
0.10
0.10
7:30AM China
Industrial Production (YoY)
% Change
Dec
6.20
6.10
7:30AM China
Real GDP (YoY)
% Change
4Q
6.90
6.90
Jan 20, 2016
7:00PM US
Housing Starts
Thousands
Dec
1,173.00
1,194.00
7:00PM US
Building permits
Thousands
Dec
1,282.00
1,200.00
3:00PM UK
Jobless claims change
% Change
Dec
3.90
4.00
7:00PM US
Consumer price index (mom)
% Change
Dec
--
--
Jan 21, 2016
8:30PM Euro Zone
Euro-Zone Consumer Confidence
Value
Jan A
(5.70)
(6.00)
3:30PM Euro Zone
Euro-Zone CPI (YoY)
%
Dec F
0.20
0.20
6:15PM Euro Zone
ECB announces interest rates
%
Jan 21
0.05
0.05
Jan 22, 2016
2:00PM Germany
PMI Services
Value
Jan P
56.00
55.50
2:00PM Germany
PMI Manufacturing
Value
Jan P
53.20
53.00
8:30PM US
Existing home sales
Million
Dec
4.76
5.11
Jan 26, 2016
8:30PM US
Consumer Confidence
S.A./ 1985=100
Jan
96.50
--
Jan 27, 2016
8:30PM US
New home sales
Thousands
Dec
490.00
--
Jan 28, 2016
3:00PM UK
GDP (YoY)
% Change
4Q A
2.10
--
12:30AM US
FOMC rate decision
%
Jan 27
0.50
0.50
Jan 29, 2016
7:00PM US
GDP Qoq (Annualised)
% Change
4Q A
2.00
--
Feb 1, 2016
3:00PM UK
PMI Manufacturing
Value
Jan
51.90
--
6:30AM China
PMI Manufacturing
Value
Jan
49.70
--
Source: Bloomberg, Angel Research
Market Outlook
January 15, 2016
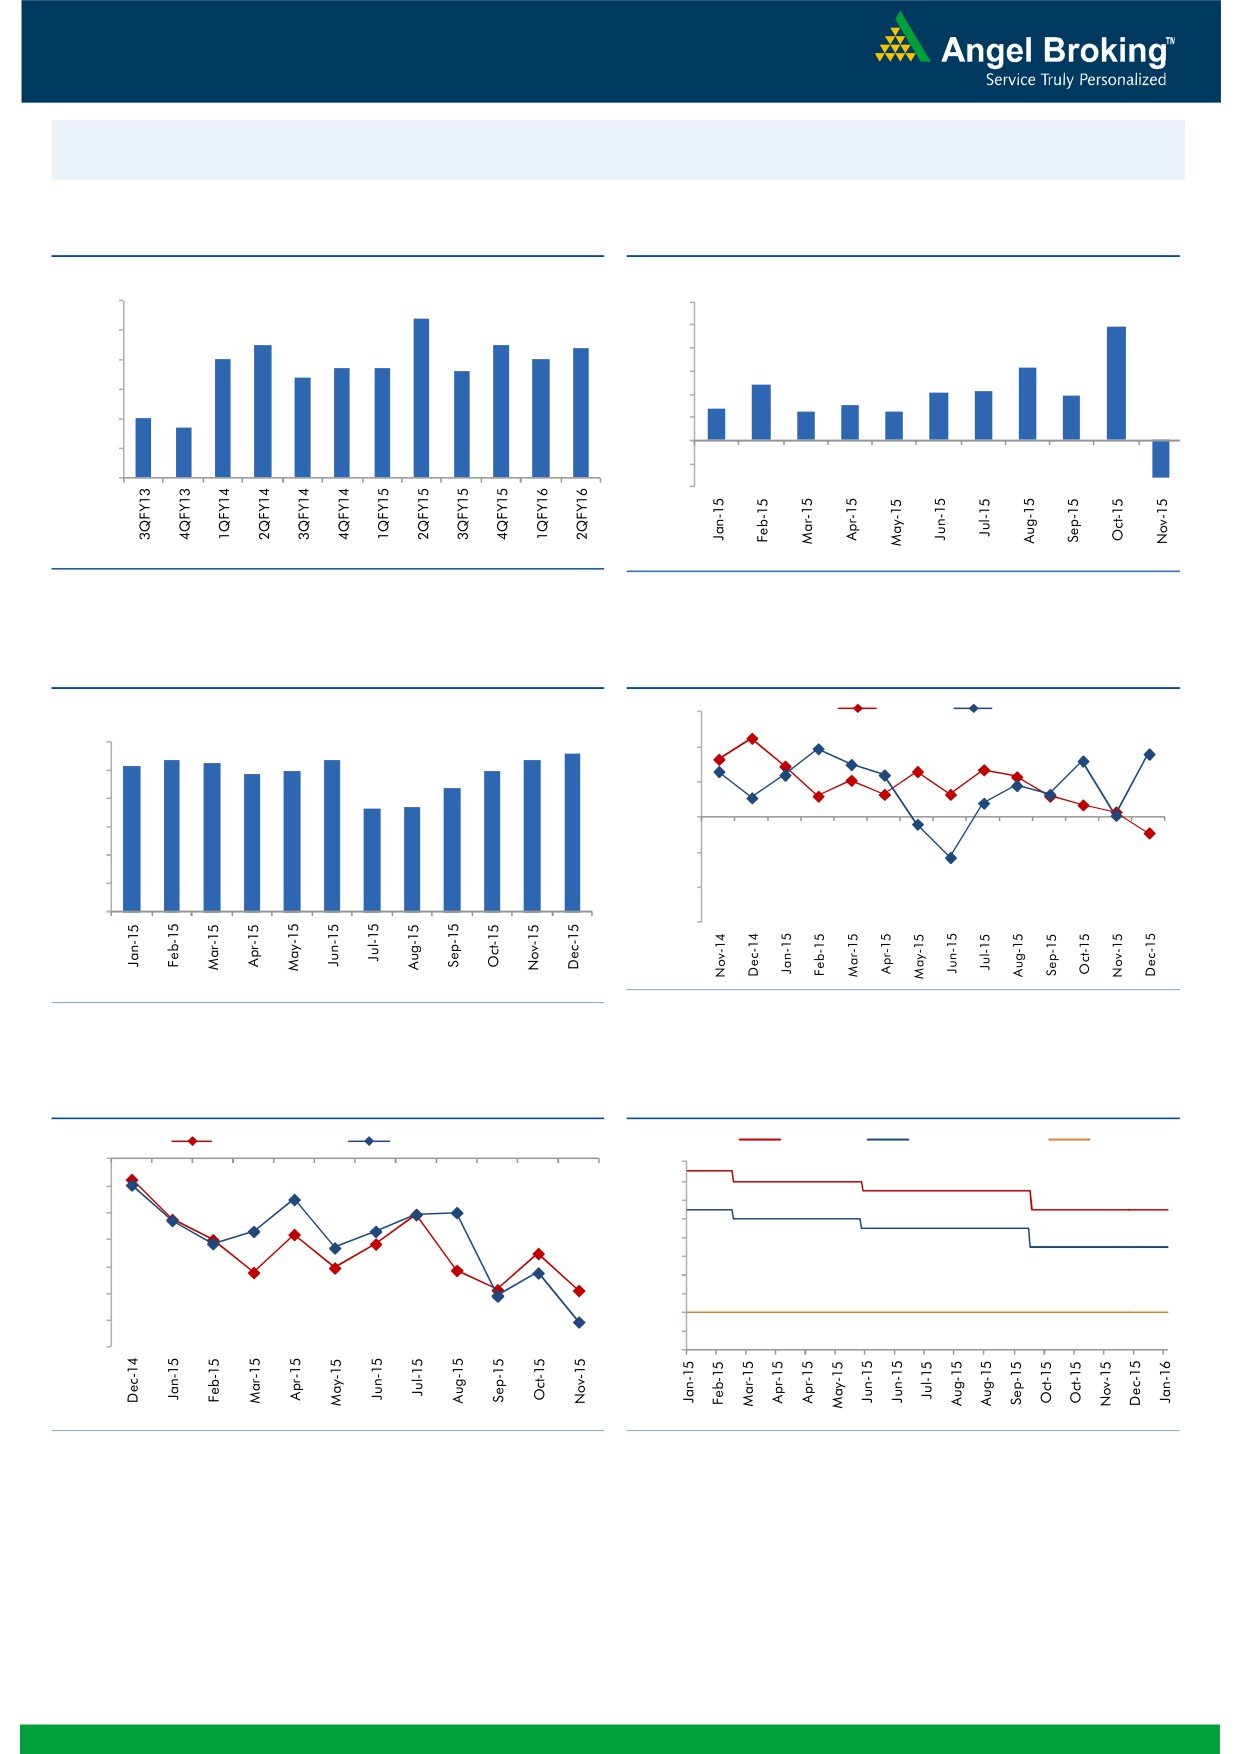
Macro watch
Exhibit 1: Quarterly GDP trends
Exhibit 2: IIP trends
(%)
(%)
9.0
8.4
12.0
9.9
7.5
7.5
10.0
8.0
7.4
7.0
7.0
6.7
6.7
8.0
6.3
6.6
7.0
6.4
6.0
4.8
4.3
4.2
3.8
6.0
3.0
4.0
2.8
2.5
2.5
5.0
4.7
5.0
2.0
-
(3.2)
4.0
(2.0)
3.0
(4.0)
Source: CSO, Angel Research
Source: MOSPI, Angel Research
Exhibit 3: Monthly CPI inflation trends
Exhibit 4: Manufacturing and services PMI
(%)
56.0
Mfg. PMI
Services PMI
5.4
5.4
5.6
6.0
5.2
5.4
5.3
54.0
4.9
5.0
5.0
5.0
4.4
52.0
3.7
3.7
4.0
50.0
3.0
2.0
48.0
1.0
46.0
-
44.0
Source: Market, Angel Research; Note: Level above 50 indicates expansion
Source: MOSPI, Angel Research
Exhibit 5: Exports and imports growth trends
Exhibit 6: Key policy rates
(%)
Exports yoy growth
Imports yoy growth
(%)
Repo rate
Reverse Repo rate
CRR
0.0
8.00
(5.0)
7.50
7.00
(10.0)
6.50
(15.0)
6.00
5.50
(20.0)
5.00
(25.0)
4.50
4.00
(30.0)
3.50
(35.0)
3.00
Source: Bloomberg, Angel Research
Source: RBI, Angel Research
Market Outlook
January 15, 2016
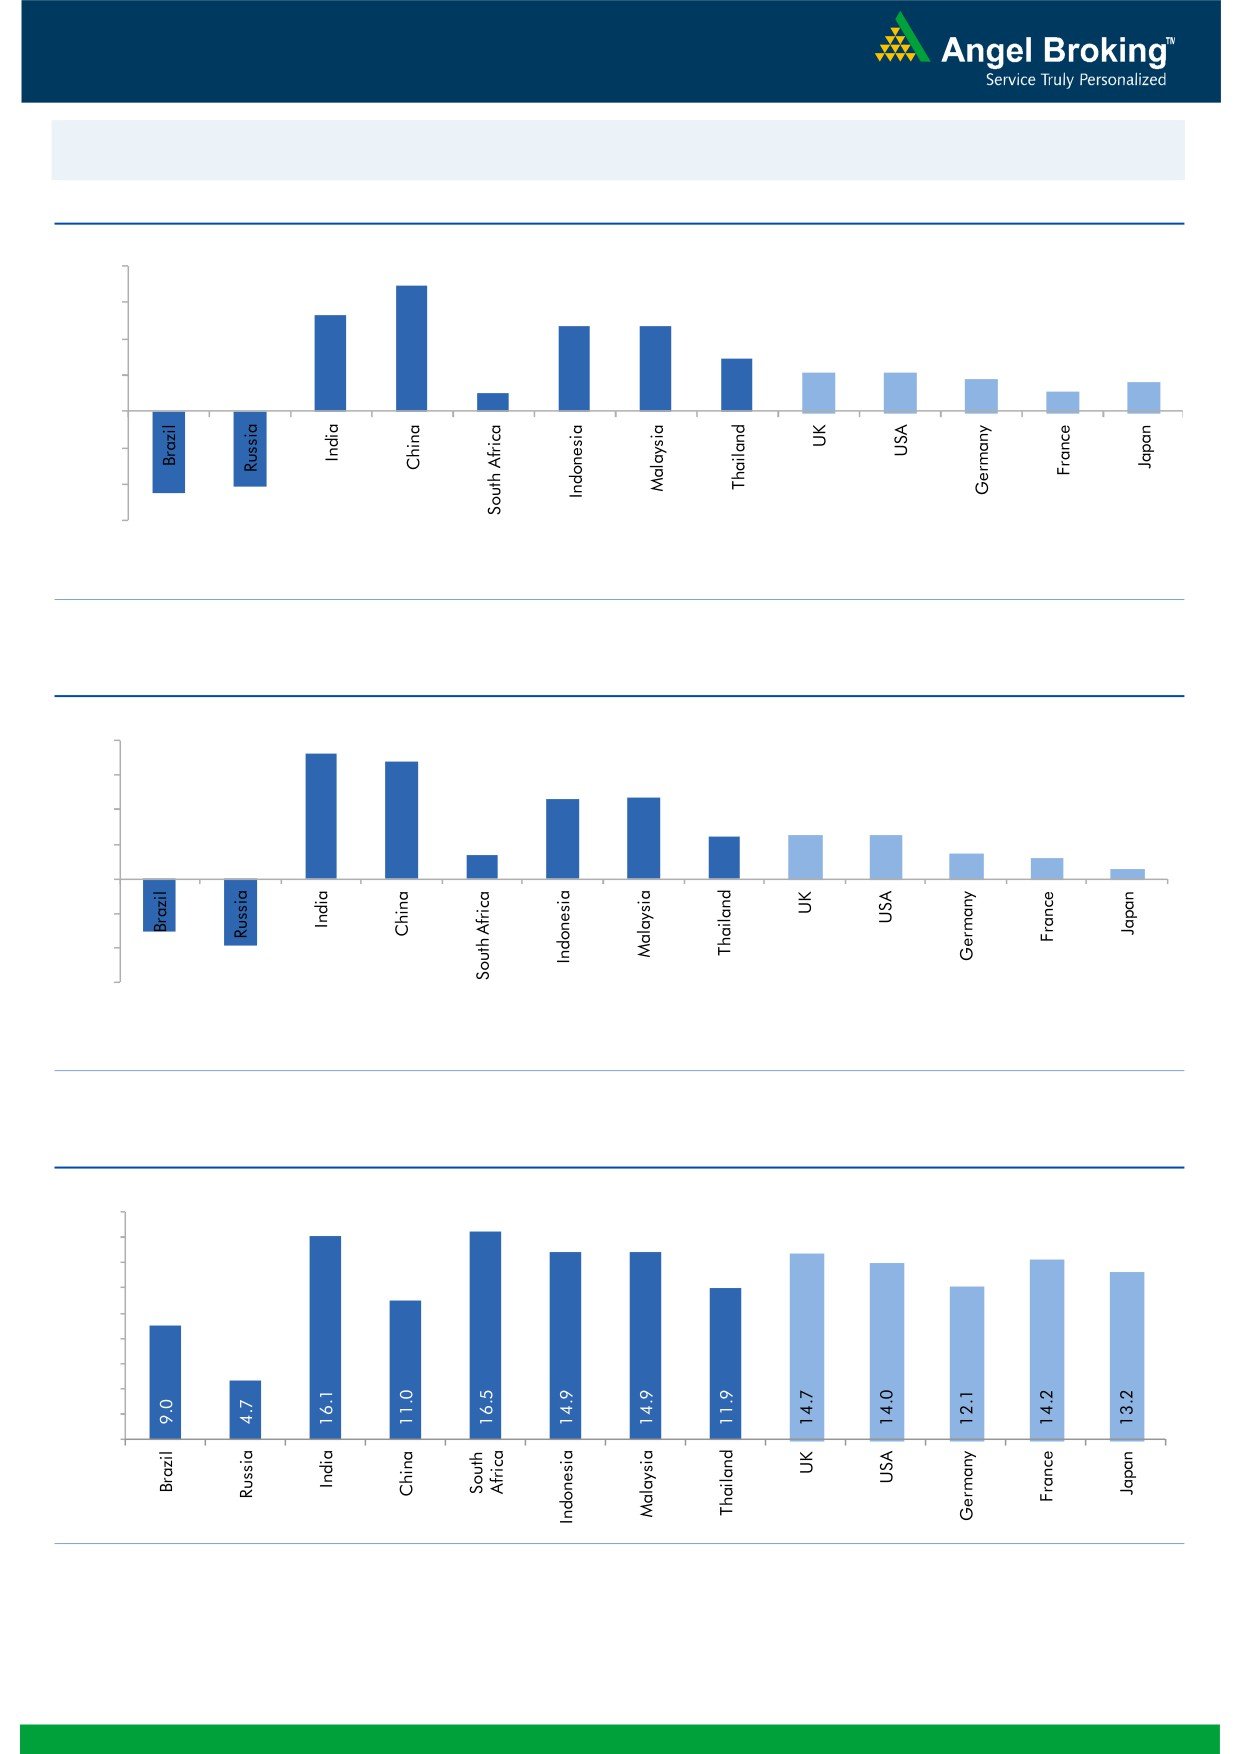
Global watch
Exhibit 1: Latest quarterly GDP Growth (%, yoy) across select developing and developed countries
(%)
8.0
6.9
6.0
5.3
4.7
4.7
4.0
2.9
2.1
2.1
1.8
2.0
1.0
1.1
1.6
-
(2.0)
(4.0)
(4.1)
(4.5)
(6.0)
Source: Bloomberg, Angel Research
Exhibit 2: 2015 GDP Growth projection by IMF (%, yoy) across select developing and developed countries
(%)
7.3
8.0
6.8
6.0
4.7
4.7
4.0
2.5
2.5
2.6
1.4
1.5
2.0
1.2
0.6
-
(2.0)
(4.0)
(3.0)
(3.8)
(6.0)
Source: IMF, Angel Research
Exhibit 3: One year forward P-E ratio across select developing and developed countries
(x)
18.0
16.0
14.0
12.0
10.0
8.0
6.0
4.0
2.0
-
Source: IMF, Angel Research
Market Outlook
January 15, 2016
Exhibit 4: Relative performance of indices across globe
Returns (%)
Country
Name of index
Closing price
1M
3M
1YR
Brazil
Bovespa
39,500
(14.3)
(19.2)
(20.1)
Russia
Micex
1,681
(3.0)
(2.8)
9.6
India
Nifty
7,537
(1.5)
(7.5)
(9.0)
China
Shanghai Composite
3,008
(14.9)
(11.9)
(11.4)
South Africa
Top 40
42,741
(3.4)
(10.3)
1.7
Mexico
Mexbol
41,353
(1.5)
(6.7)
0.9
Indonesia
LQ45
786
2.4
2.3
(12.5)
Malaysia
KLCI
1,633
(0.9)
(4.3)
(4.4)
Thailand
SET 50
790
(3.5)
(14.3)
(20.0)
USA
Dow Jones
16,379
(5.1)
(4.1)
(5.4)
UK
FTSE
5,918
(2.8)
(6.7)
(9.6)
Japan
Nikkei
17,241
(10.7)
(5.9)
(1.0)
Germany
DAX
9,794
(7.5)
(3.2)
(3.7)
France
CAC
4,313
(5.2)
(6.4)
(3.8)
Source: Bloomberg, Angel Research
Stock Watch
January 15, 2016
Company Name
Reco
CMP
Target
Mkt Cap
Sales ( Čcr )
OPM(%)
EPS (Č)
PER(x)
P/BV(x)
RoE(%)
EV/Sales(x)
(Č)
Price ( Č)
( Č cr )
FY16E FY17E
FY16E
FY17E
FY16E
FY17E
FY16E
FY17E
FY16E
FY17E
FY16E
FY17E
FY16E
FY17E
Agri / Agri Chemical
Rallis
Neutral
170
-
3,303
2,097
2,415
14.4
14.4
9.5
11.0
17.9
15.4
3.6
3.1
21.1
21.3
1.6
1.4
United Phosphorus
Buy
398
510
17,063
13,698
15,752
17.6
17.6
32.1
38.5
12.4
10.3
2.4
2.0
21.4
21.3
1.3
1.1
Auto & Auto Ancillary
Ashok Leyland
Buy
89
111
25,214
17,995
21,544
11.4
11.6
3.4
4.7
26.1
18.9
4.6
4.2
17.7
22.2
1.4
1.1
Bajaj Auto
Buy
2,362
2,728
68,353
23,695
27,298
21.3
20.4
134.6
151.5
17.6
15.6
5.6
4.8
31.8
30.6
2.4
2.1
Bharat Forge
Buy
817
943
19,012
7,867
8,881
20.0
20.3
34.4
41.0
23.7
19.9
4.6
3.8
21.1
20.9
2.5
2.2
Eicher Motors
Accumulate
16,988
19,036
46,129
15,379
16,498
15.6
16.6
473.2
574.8
35.9
29.6
13.3
9.9
36.7
33.2
2.9
2.7
Gabriel India
Accumulate
89
101
1,273
1,415
1,544
8.7
9.0
4.6
5.4
19.3
16.4
3.5
3.1
18.1
18.9
0.9
0.8
Hero Motocorp
Accumulate
2,433
2,774
48,586
28,561
31,559
14.7
14.7
151.1
163.2
16.1
14.9
6.2
5.3
38.7
35.6
1.5
1.4
Jamna Auto Industries Neutral
140
-
1,115
1,292
1,486
9.3
9.8
6.0
7.5
23.3
18.6
4.8
4.1
20.7
21.8
0.9
0.8
L G Balakrishnan & Bros Neutral
466
-
731
1,254
1,394
11.6
11.8
35.9
41.7
13.0
11.2
1.8
1.6
13.5
13.8
0.7
0.6
Mahindra and Mahindra Buy
1,188
1,449
73,783
39,031
44,440
13.8
13.9
57.9
67.6
20.5
17.6
3.3
2.9
16.1
16.6
1.5
1.3
Maruti
Neutral
4,250
-
128,373
57,865
68,104
16.4
16.7
176.3
225.5
24.1
18.9
4.7
4.0
19.4
21.2
2.0
1.6
Minda Industries
Accumulate
811
867
1,287
2,567
2,965
8.0
8.3
46.1
57.8
17.6
14.0
2.9
2.4
16.7
17.3
0.6
0.5
Motherson Sumi
Buy
262
313
34,655
39,343
45,100
8.8
9.1
10.1
12.5
25.9
21.0
8.2
6.4
35.3
34.4
1.0
0.8
Rane Brake Lining
Accumulate
320
366
253
454
511
11.1
11.4
23.8
28.1
13.5
11.4
1.9
1.7
14.2
15.3
0.7
0.6
Setco Automotive
Neutral
39
-
521
594
741
12.7
13.7
1.7
3.2
22.9
12.2
2.4
2.1
10.4
16.9
1.3
1.1
Tata Motors
Buy
355
409
102,452
266,022
312,667
12.8
13.1
26.3
38.3
13.5
9.3
1.8
1.5
8.4
12.1
0.6
0.5
TVS Motor
Buy
281
338
13,369
11,569
13,648
7.3
8.7
10.3
16.1
27.3
17.5
6.8
5.3
24.8
30.5
1.1
0.9
Amara Raja Batteries
Buy
819
1,040
13,991
4,892
5,871
17.4
17.6
28.8
37.1
28.4
22.1
6.6
5.3
23.4
24.1
2.8
2.3
Exide Industries
Buy
138
162
11,743
6,950
7,784
14.4
14.8
6.6
7.3
20.9
18.9
2.6
2.4
12.6
12.8
1.4
1.3
Apollo Tyres
Buy
146
171
7,447
12,146
12,689
16.8
16.0
21.2
19.0
6.9
7.7
1.1
1.0
16.5
13.0
0.7
0.7
Ceat
Accumulate
1,002
1,119
4,054
6,041
6,597
14.1
13.7
99.5
111.9
10.1
9.0
2.0
1.7
19.6
18.5
0.8
0.7
JK Tyres
Neutral
98
-
2,215
7,446
7,669
15.2
14.0
19.6
18.4
5.0
5.3
1.3
1.0
25.2
19.5
0.7
0.6
Swaraj Engines
Neutral
910
-
1,130
552
630
14.2
14.7
44.6
54.1
20.4
16.8
4.7
4.3
23.2
25.6
1.9
1.6
Subros
Neutral
99
-
591
1,268
1,488
11.6
11.9
3.7
6.6
26.6
14.9
1.8
1.6
6.8
11.4
0.8
0.6
Indag Rubber
Neutral
182
-
477
283
329
17.0
17.2
13.0
15.4
14.0
11.8
3.1
2.5
21.8
21.6
1.4
1.2
Capital Goods
ACE
Neutral
42
-
413
660
839
4.7
8.2
1.0
3.9
41.7
10.7
1.3
1.2
3.2
11.3
0.8
0.6
BEML
Neutral
1,199
-
4,993
3,277
4,006
6.0
8.9
29.2
64.3
41.1
18.6
2.3
2.1
5.7
11.7
1.6
1.3
Bharat Electronics
Accumulate
1,308
1,414
31,385
7,737
8,634
16.8
17.2
54.0
61.0
24.2
21.4
3.5
3.1
39.3
45.6
3.2
2.7
Stock Watch
January 15, 2016
Company Name
Reco
CMP
Target
Mkt Cap
Sales ( Čcr )
OPM(%)
EPS (Č)
PER(x)
P/BV(x)
RoE(%)
EV/Sales(x)
(Č)
Price ( Č)
( Č cr )
FY16E
FY17E
FY16E
FY17E
FY16E
FY17E
FY16E
FY17E
FY16E
FY17E
FY16E
FY17E
FY16E
FY17E
Capital Goods
Voltas
Buy
289
353
9,558
5,363
5,963
8.0
9.1
11.0
13.8
26.3
20.9
4.0
3.5
16.2
17.9
1.7
1.5
BGR Energy
Neutral
118
-
848
3,615
3,181
9.5
9.4
16.7
12.4
7.0
9.5
0.7
0.7
10.0
7.0
0.6
0.8
BHEL
Neutral
144
-
35,196
33,722
35,272
10.8
11.7
10.5
14.2
13.7
10.1
1.0
1.0
7.0
9.0
1.1
1.1
Blue Star
Buy
361
439
3,248
3,548
3,977
6.3
6.9
13.7
17.2
26.4
21.1
6.6
4.3
26.1
25.4
1.0
0.9
Crompton Greaves
Accumulate
181
204
11,328
13,484
14,687
4.9
6.2
4.5
7.1
40.2
25.5
2.8
2.7
7.2
10.8
1.0
0.9
Inox Wind
Buy
332
458
7,373
4,980
5,943
17.0
17.5
26.6
31.6
12.5
10.5
3.7
2.8
35.0
30.0
1.6
1.3
KEC International
Neutral
133
-
3,426
8,791
9,716
6.1
6.8
5.4
8.2
24.7
16.3
2.5
2.3
10.0
14.0
0.6
0.6
Thermax
Neutral
891
-
10,616
6,413
7,525
7.4
8.5
30.5
39.3
29.2
22.7
4.5
3.9
15.0
17.0
1.6
1.3
Cement
ACC
Buy
1,271
1,630
23,865
13,151
14,757
16.4
18.3
63.9
83.4
19.9
15.2
2.6
2.4
13.3
16.1
1.7
1.4
Ambuja Cements
Buy
198
233
30,782
11,564
12,556
19.4
20.7
8.9
10.1
22.3
19.6
2.8
2.6
12.8
13.8
2.3
2.1
HeidelbergCement
Neutral
72
-
1,626
1,772
1,926
13.3
15.4
1.0
3.0
71.8
23.9
1.8
1.7
2.6
7.9
1.5
1.3
India Cements
Buy
97
112
2,987
4,216
4,840
18.0
19.5
4.0
9.9
24.3
9.8
1.0
0.9
4.0
9.5
1.0
0.8
JK Cement
Buy
513
744
3,584
3,661
4,742
10.1
15.8
18.0
61.0
28.5
8.4
2.1
1.8
7.5
22.9
1.5
1.1
J K Lakshmi Cement
Buy
305
430
3,584
2,947
3,616
16.7
19.9
11.5
27.2
26.5
11.2
2.5
2.2
9.8
20.8
1.6
1.3
Mangalam Cements
Neutral
188
-
501
1,053
1,347
10.5
13.3
8.4
26.0
22.3
7.2
0.9
0.9
4.3
12.5
0.9
0.6
Orient Cement
Buy
147
183
3,005
1,854
2,524
21.2
22.2
7.7
11.1
19.1
13.2
2.7
2.4
13.3
15.7
2.4
1.6
Ramco Cements
Neutral
380
-
9,039
4,036
4,545
20.8
21.3
15.1
18.8
25.1
20.2
3.1
2.7
12.9
14.3
2.7
2.4
Shree Cement^
Neutral
10,155
-
35,378
7,150
8,742
26.7
28.6
228.0
345.5
44.5
29.4
6.6
5.5
15.7
20.3
4.7
3.8
UltraTech Cement
Buy
2,627
3,282
72,092
25,021
30,023
19.1
21.6
89.0
132.0
29.5
19.9
3.4
3.0
12.2
15.9
2.9
2.5
Construction
ITNL
Neutral
82
-
2,711
7,360
8,825
34.0
35.9
7.0
9.0
11.8
9.2
0.4
0.4
3.2
3.7
3.7
3.6
KNR Constructions
Buy
509
673
1,432
937
1,470
14.3
14.0
33.5
38.6
15.2
13.2
2.3
2.0
15.4
15.4
1.6
1.0
Larsen & Toubro
Buy
1,135
1,646
105,684
65,065
77,009
11.5
11.7
61.5
65.6
18.5
17.3
1.9
1.7
13.4
14.0
1.8
1.6
Gujarat Pipavav Port
Neutral
153
-
7,387
629
684
51.0
52.2
6.4
5.9
23.9
25.9
3.1
2.9
15.9
12.7
11.4
10.3
MBL Infrastructures
Buy
201
285
833
2,313
2,797
12.2
14.6
19.0
20.0
10.6
10.0
1.1
1.0
11.3
10.6
1.1
0.9
Nagarjuna Const.
Neutral
68
-
3,797
7,892
8,842
8.8
9.1
3.0
5.3
22.8
12.9
1.1
1.1
5.0
8.5
0.7
0.6
PNC Infratech
Accumulate
516
558
2,645
1,873
2,288
13.2
13.5
24.0
32.0
21.5
16.1
2.1
1.9
12.1
12.3
1.5
1.3
Simplex Infra
Neutral
300
-
1,486
5,955
6,829
10.3
10.5
16.0
31.0
18.8
9.7
1.0
0.9
5.3
9.9
0.8
0.6
Power Mech Projects
Neutral
650
-
956
1,539
1,801
12.8
12.7
59.0
72.1
11.0
9.0
1.7
1.4
18.6
16.8
0.6
0.5
Sadbhav Engineering
Neutral
298
-
5,114
3,481
4,219
10.7
10.8
8.0
12.0
37.3
24.9
3.5
3.0
10.3
13.5
1.7
1.4
Stock Watch
January 15, 2016
Company Name
Reco
CMP
Target
Mkt Cap
Sales ( Čcr )
OPM(%)
EPS (Č)
PER(x)
P/BV(x)
RoE(%)
EV/Sales(x)
(Č)
Price ( Č)
( Č cr )
FY16E
FY17E
FY16E
FY17E
FY16E
FY17E
FY16E
FY17E
FY16E
FY17E
FY16E
FY17E
FY16E
FY17E
Construction
NBCC
Accumulate
974
1,089
11,690
7,382
9,506
7.7
8.6
39.8
54.4
24.5
17.9
5.9
4.7
26.7
29.1
1.3
1.0
MEP Infra
Neutral
43
-
694
1,956
1,876
28.1
30.5
1.3
3.0
32.9
14.2
6.9
4.6
21.2
32.8
1.8
1.8
SIPL
Neutral
93
-
3,281
675
1,042
62.4
64.7
-
-
3.5
4.0
-
-
16.5
11.1
Financials
Allahabad Bank
Neutral
58
-
3,456
8,569
9,392
2.8
2.9
16.3
27.5
3.5
2.1
0.3
0.3
7.6
11.9
-
-
Axis Bank
Buy
391
531
92,910
26,473
31,527
3.5
3.6
35.7
43.5
10.9
9.0
2.1
1.8
17.9
18.9
-
-
Bank of Baroda
Neutral
131
-
30,219
18,485
21,025
1.9
2.0
13.5
21.1
9.8
6.2
0.8
0.7
7.3
10.6
-
-
Bank of India
Neutral
98
-
7,792
15,972
17,271
1.9
2.0
15.3
33.4
6.4
3.0
0.3
0.3
3.6
7.6
-
-
Canara Bank
Neutral
191
-
10,382
15,441
16,945
2.0
2.1
46.6
70.4
4.1
2.7
0.4
0.3
8.0
11.2
-
-
Dena Bank
Neutral
38
-
2,426
3,440
3,840
2.1
2.3
7.3
10.0
5.2
3.8
0.4
0.3
6.1
7.9
-
-
Federal Bank
Neutral
48
-
8,252
3,477
3,999
3.0
3.0
5.0
6.2
9.6
7.7
1.0
0.9
10.6
11.9
-
-
HDFC
Neutral
1,159
-
183,038
10,358
11,852
3.3
3.3
41.1
47.0
28.2
24.7
5.4
4.9
24.7
24.9
-
-
HDFC Bank
Buy
1,050
1,262
265,020
38,309
47,302
4.3
4.3
49.3
61.1
21.3
17.2
3.7
3.2
18.5
19.7
-
-
ICICI Bank
Buy
235
304
136,762
34,279
39,262
3.3
3.3
21.0
24.4
11.2
9.7
1.9
1.6
14.4
14.7
-
-
IDBI Bank
Neutral
66
-
10,602
9,625
10,455
1.8
1.8
8.5
14.2
7.8
4.7
0.5
0.4
5.9
9.3
-
-
Indian Bank
Neutral
95
-
4,558
6,160
6,858
2.5
2.5
24.5
29.8
3.9
3.2
0.3
0.3
7.7
8.6
-
-
LIC Housing Finance
Buy
485
592
24,476
3,101
3,745
2.5
2.5
33.0
40.2
14.7
12.1
2.8
2.3
19.7
20.5
-
-
Oriental Bank
Neutral
112
-
3,366
7,643
8,373
2.4
2.4
37.2
45.4
3.0
2.5
0.3
0.2
8.2
9.4
-
-
Punjab Natl.Bank
Neutral
98
-
19,214
23,638
26,557
2.8
2.8
17.9
27.2
5.5
3.6
0.5
0.5
8.5
12.0
-
-
South Ind.Bank
Neutral
19
-
2,586
1,965
2,185
2.5
2.5
2.5
3.3
7.7
5.8
0.8
0.7
9.5
11.7
-
-
St Bk of India
Buy
196
237
151,995
82,520
93,299
2.7
2.8
20.0
24.5
9.8
8.0
1.1
0.9
11.5
12.8
-
-
Union Bank
Neutral
123
-
8,483
12,646
14,129
2.3
2.4
31.0
39.1
4.0
3.2
0.4
0.4
9.8
11.4
-
-
Vijaya Bank
Neutral
32
-
2,706
3,536
3,827
1.9
1.9
5.5
6.7
5.7
4.7
0.5
0.4
7.8
8.8
-
-
Yes Bank
Buy
673
825
28,216
7,190
9,011
3.2
3.3
58.2
69.7
11.6
9.7
2.1
1.8
19.2
19.6
-
-
FMCG
Asian Paints
Neutral
890
-
85,388
16,553
19,160
16.0
16.2
17.7
21.5
50.4
41.4
13.4
12.0
29.4
31.2
5.0
4.3
Britannia
Neutral
2,904
-
34,837
8,065
9,395
9.6
10.2
47.2
65.5
61.5
44.3
20.4
19.3
38.3
41.2
4.2
3.6
Colgate
Neutral
942
-
25,609
4,836
5,490
19.5
19.7
48.5
53.2
19.4
17.7
14.2
12.4
99.8
97.5
5.2
4.6
Dabur India
Neutral
260
-
45,729
9,370
10,265
17.1
17.2
7.3
8.1
35.4
32.1
10.7
8.7
33.7
30.6
4.8
4.4
GlaxoSmith Con*
Neutral
6,009
-
25,271
4,919
5,742
17.2
17.4
168.3
191.2
35.7
31.4
10.1
8.6
28.8
28.9
4.7
4.0
Godrej Consumer
Neutral
1,283
-
43,692
10,168
12,886
16.1
16.1
32.1
38.4
40.0
33.4
8.1
7.5
19.7
21.0
4.4
3.5
Stock Watch
January 15, 2016
Company Name
Reco
CMP
Target
Mkt Cap
Sales ( Čcr )
OPM(%)
EPS (Č)
PER(x)
P/BV(x)
RoE(%)
EV/Sales(x)
(Č)
Price ( Č)
( Č cr )
FY16E FY17E
FY16E
FY17E
FY16E
FY17E
FY16E
FY17E
FY16E
FY17E
FY16E
FY17E
FY16E
FY17E
FMCG
HUL
Neutral
826
-
178,833
34,940
38,957
17.5
17.7
20.8
24.7
39.7
33.5
44.2
35.3
110.5
114.2
4.9
4.4
ITC
Buy
317
382
254,924
41,068
45,068
37.8
37.4
13.9
15.9
22.8
20.0
7.6
6.7
34.1
33.8
5.8
5.3
Marico
Neutral
225
-
29,061
6,551
7,766
15.7
16.0
10.4
12.5
21.7
18.0
6.3
5.2
33.2
32.4
4.4
3.7
Nestle*
Buy
5,621
6,646
54,191
11,291
12,847
22.2
22.3
158.9
184.6
35.4
30.5
18.5
16.6
55.0
57.3
4.6
4.0
Tata Global
Accumulate
134
144
8,460
8,635
9,072
9.8
9.9
6.5
7.6
20.6
17.6
2.1
2.0
6.8
7.4
0.9
0.9
IT
HCL Tech^
Buy
829
1,132
116,868
42,038
47,503
23.2
23.5
55.8
62.9
14.9
13.2
3.4
2.6
23.0
19.8
2.4
1.9
Infosys
Buy
1,129
1,306
259,256
60,250
66,999
27.0
28.0
56.4
63.7
20.0
17.7
4.1
3.5
20.4
19.8
3.6
3.1
TCS
Buy
2,279
3,165
449,051
111,274
126,852
28.4
28.7
125.4
143.9
18.2
15.8
7.2
6.6
39.9
42.2
3.6
3.1
Tech Mahindra
Buy
514
646
49,696
25,566
28,890
16.0
17.0
26.3
31.9
19.5
16.1
3.5
3.0
17.9
18.6
1.7
1.5
Wipro
Buy
545
719
134,736
50,808
58,713
23.7
23.8
37.3
42.3
14.6
12.9
2.8
2.5
19.0
17.9
2.2
1.8
Media
D B Corp
Accumulate
318
356
5,835
2,241
2,495
27.8
27.9
21.8
25.6
14.6
12.4
3.8
3.4
26.7
28.5
2.5
2.3
HT Media
Neutral
83
-
1,939
2,495
2,603
11.2
11.2
7.3
8.6
11.4
9.7
0.9
0.8
7.4
8.1
0.3
0.3
Jagran Prakashan
Buy
162
189
5,296
2,170
2,355
27.2
26.2
8.9
9.9
18.2
16.4
3.8
3.3
20.9
20.5
2.3
2.2
Sun TV Network
Neutral
394
-
15,509
2,779
3,196
70.2
70.5
22.8
27.3
17.3
14.4
4.3
3.9
26.7
28.3
5.3
4.6
Hindustan Media
Neutral
283
-
2,074
920
1,031
20.0
20.0
19.2
20.9
14.7
13.5
2.4
2.1
16.4
15.3
1.8
1.6
Ventures
Metals & Mining
Coal India
Buy
319
380
201,303
76,167
84,130
19.9
22.3
22.4
25.8
14.2
12.3
5.1
5.0
35.5
41.0
2.0
1.8
Hind. Zinc
Buy
141
175
59,725
14,641
14,026
50.4
50.4
17.7
16.0
8.0
8.8
1.2
1.1
16.2
13.2
1.7
1.5
Hindalco
Neutral
75
-
15,415
104,356
111,186
8.7
9.5
6.7
11.1
11.1
6.8
0.4
0.4
3.5
5.9
0.7
0.6
JSW Steel
Neutral
1,003
-
24,241
42,308
45,147
16.4
20.7
(10.3)
49.5
20.3
1.1
1.1
(1.0)
5.6
1.6
1.5
NMDC
Neutral
87
-
34,652
8,237
10,893
46.6
44.5
10.0
11.7
8.8
7.5
1.0
0.9
12.5
13.0
4.0
3.0
SAIL
Neutral
45
-
18,379
45,915
53,954
7.2
10.5
1.5
4.4
29.5
10.2
0.4
0.4
2.3
4.1
1.0
0.9
Vedanta
Neutral
79
-
23,525
71,445
81,910
26.2
26.3
12.9
19.2
6.2
4.1
0.4
0.4
7.2
8.9
0.8
0.6
Tata Steel
Neutral
239
-
23,183
126,760
137,307
8.9
11.3
6.4
23.1
37.5
10.3
0.8
0.7
2.0
7.1
0.8
0.7
Oil & Gas
Cairn India
Neutral
125
-
23,501
11,323
12,490
49.4
51.0
20.7
20.7
6.1
6.1
0.4
0.4
6.4
6.1
1.1
0.5
GAIL
Neutral
358
-
45,367
64,856
70,933
9.1
9.6
24.0
28.9
14.9
12.4
1.3
1.2
8.8
9.6
0.9
0.8
ONGC
Neutral
225
-
192,199
154,564
167,321
36.8
37.4
28.6
32.5
7.9
6.9
1.0
0.9
12.7
13.5
1.4
1.4
Petronet LNG
Neutral
256
-
19,226
29,691
31,188
5.8
6.2
12.8
13.4
20.1
19.1
3.0
2.7
15.8
14.8
0.7
0.7
Indian Oil Corp
Neutral
435
-
105,713
359,607
402,760
5.9
6.1
42.5
48.7
10.3
8.9
1.4
1.2
14.1
14.4
0.4
0.4
Reliance Industries
Accumulate
1,061
1,150
343,745
304,775
344,392
12.6
13.4
91.3
102.6
11.6
10.3
1.3
1.2
11.8
12.0
1.1
0.9
Stock Watch
January 15, 2016
Company Name
Reco
CMP
Target
Mkt Cap
Sales ( Čcr )
OPM(%)
EPS (Č)
PER(x)
P/BV(x)
RoE(%)
EV/Sales(x)
(Č)
Price ( Č)
( Č cr )
FY16E FY17E
FY16E
FY17E
FY16E
FY17E
FY16E
FY17E
FY16E
FY17E
FY16E
FY17E
FY16E
FY17E
Pharmaceuticals
Alembic Pharma
Neutral
658
-
12,397
2,658
3,112
24.1
20.2
24.6
23.9
26.7
27.5
9.6
7.3
42.5
30.2
4.7
3.9
Aurobindo Pharma
Neutral
837
-
48,860
14,923
17,162
22.0
23.0
35.7
42.8
23.4
19.6
6.9
5.2
34.0
30.2
3.6
3.1
Aventis*
Neutral
4,246
-
9,778
2,082
2,371
17.4
20.8
118.2
151.5
35.9
28.0
5.3
4.2
19.9
25.5
4.4
3.6
Cadila Healthcare
Accumulate
315
352
32,289
10,224
11,840
21.0
22.0
14.6
17.6
21.6
17.9
5.9
4.6
30.8
29.0
3.2
2.7
Cipla
Neutral
614
-
49,311
14,211
16,611
20.6
19.0
27.0
28.9
22.7
21.2
3.9
3.3
18.4
16.8
3.5
2.9
Dr Reddy's
Buy
2,915
3,933
49,715
16,838
19,575
25.0
23.1
167.5
178.8
17.4
16.3
3.7
3.1
23.1
20.4
2.9
2.4
Dishman Pharma
Neutral
334
-
2,692
1,733
1,906
21.5
21.5
17.0
19.9
19.6
16.8
2.0
1.8
10.5
11.2
2.1
1.8
GSK Pharma*
Neutral
3,241
-
27,456
2,870
3,158
20.0
22.1
59.5
68.3
54.5
47.5
16.1
16.5
28.5
34.3
9.1
8.3
Indoco Remedies
Neutral
311
-
2,865
1,033
1,199
15.9
18.2
9.4
13.6
33.1
22.9
4.9
4.2
15.7
19.7
2.9
2.5
Ipca labs
Buy
643
900
8,113
3,363
3,909
12.9
18.6
13.4
28.0
48.0
23.0
3.4
3.0
7.4
14.0
2.7
2.3
Lupin
Neutral
1,718
-
77,393
13,092
16,561
25.0
27.0
50.4
68.3
34.1
25.2
7.0
5.6
22.8
24.7
5.6
4.3
Sun Pharma
Buy
791
950
190,351
28,163
32,610
25.8
30.7
17.4
26.9
45.5
29.4
4.3
3.7
13.0
16.6
6.2
5.2
Power
Tata Power
Neutral
65
-
17,512
35,923
37,402
22.6
22.8
4.1
5.2
16.0
12.6
1.2
1.1
7.5
9.3
1.4
1.3
NTPC
Accumulate
143
157
118,034
87,064
98,846
23.5
23.5
11.7
13.2
12.2
10.8
1.4
1.3
11.4
12.1
2.4
2.1
Power Grid
Buy
143
170
74,655
20,702
23,361
86.7
86.4
12.1
13.2
11.8
10.8
1.7
1.6
15.6
15.1
8.5
7.9
Telecom
Bharti Airtel
Neutral
309
-
123,520
101,748
109,191
32.1
31.7
12.0
12.5
25.8
24.7
1.8
1.7
6.9
6.7
1.9
1.7
Idea Cellular
Neutral
119
-
42,988
34,282
36,941
32.0
31.5
5.9
6.2
20.2
19.3
1.9
1.7
9.9
9.3
1.8
1.7
zOthers
Abbott India
Neutral
5,379
-
11,430
2,715
3,153
14.5
14.1
134.3
152.2
40.1
35.3
10.0
8.2
27.4
25.6
3.9
3.3
Bajaj Electricals
Buy
190
290
1,913
4,719
5,287
5.2
5.8
8.6
12.7
22.2
15.0
2.5
2.2
11.4
14.8
0.4
0.4
Finolex Cables
Neutral
240
-
3,673
2,520
2,883
12.2
12.0
12.7
14.2
19.0
16.9
2.6
2.3
13.6
13.5
1.2
1.0
Goodyear India*
Buy
521
622
1,201
1,888
1,680
12.1
11.9
62.2
56.6
8.4
9.2
2.0
1.7
25.9
19.7
0.4
0.4
Hitachi
Neutral
1,159
-
3,151
1,779
2,081
7.8
8.8
21.8
33.4
53.2
34.7
8.6
6.9
17.4
22.1
1.8
1.6
Jyothy Laboratories
Neutral
295
-
5,335
1,620
1,847
11.5
11.5
7.3
8.5
40.4
34.8
5.2
4.8
13.3
14.4
3.2
2.7
MRF
Buy
38,256
45,575
16,225
20,316
14,488
21.4
21.1
5,488.0
3,798.0
7.0
10.1
2.4
1.9
41.1
21.2
0.7
1.0
Page Industries
Neutral
13,092
-
14,603
1,929
2,450
19.8
20.1
229.9
299.0
57.0
43.8
25.1
17.5
52.1
47.1
7.6
6.0
Relaxo Footwears
Neutral
448
-
5,373
1,767
2,152
12.3
12.5
19.3
25.1
23.3
17.9
5.7
4.4
27.7
27.8
3.1
2.5
Siyaram Silk Mills
Buy
1,172
1,354
1,099
1,636
1,815
11.5
11.5
89.9
104.1
13.0
11.3
2.2
1.9
17.9
17.8
0.8
0.7
Styrolution ABS India*
Neutral
701
-
1,232
1,271
1,440
8.6
9.2
32.0
41.1
21.9
17.1
2.2
2.0
10.7
12.4
0.9
0.8
TVS Srichakra
Buy
2,570
3,240
1,968
2,101
2,338
15.7
15.0
248.6
270.0
10.3
9.5
4.5
3.2
43.6
34.0
1.0
0.8
Stock Watch
January 15, 2016
Company Name
Reco
CMP
Target
Mkt Cap
Sales ( Čcr )
OPM(%)
EPS (Č)
PER(x)
P/BV(x)
RoE(%)
EV/Sales(x)
(Č)
Price ( Č)
( Č cr )
FY16E
FY17E
FY16E
FY17E
FY16E
FY17E
FY16E
FY17E
FY16E
FY17E
FY16E
FY17E
FY16E
FY17E
zOthers
HSIL
Accumulate
284
302
2,053
2,123
2,384
16.1
16.5
15.0
18.9
18.9
15.1
1.5
1.4
8.0
9.4
1.3
1.2
Kirloskar Engines India
Neutral
240
-
3,471
2,471
2,826
8.8
10.4
9.1
13.3
26.3
18.0
2.5
2.3
9.7
13.4
1.1
0.9
Ltd
M M Forgings
Buy
526
614
635
511
615
21.7
21.6
43.1
55.8
12.2
9.4
2.2
1.8
19.9
21.2
1.4
1.1
Banco Products (India) Neutral
132
-
947
1,208
1,353
11.0
12.3
10.8
14.5
12.3
9.2
1.4
1.3
11.9
14.5
0.7
0.7
Competent Automobiles Neutral
149
-
92
1,040
1,137
3.2
3.1
25.7
28.0
5.8
5.3
0.9
0.8
15.0
14.3
0.1
0.1
Nilkamal
Neutral
1,357
-
2,024
1,910
2,083
10.5
10.3
63.3
69.2
21.4
19.6
3.5
3.0
17.6
16.5
1.1
1.0
Visaka Industries
Buy
109
144
173
1,086
1,197
9.9
10.3
21.5
28.8
5.1
3.8
0.5
0.4
9.6
11.6
0.4
0.3
Transport Corporation of
Neutral
279
-
2,119
2,830
3,350
8.8
9.0
14.4
18.3
19.4
15.2
3.0
2.6
15.4
17.1
0.9
0.8
India
Elecon Engineering
Buy
73
85
796
1,369
1,533
13.7
14.9
3.3
6.1
22.0
12.1
1.4
1.3
6.6
11.4
0.9
0.8
Surya Roshni
Buy
152
201
666
2,992
3,223
8.1
8.4
14.7
18.3
10.3
8.3
1.0
0.9
9.7
11.0
0.5
0.5
MT Educare
Neutral
181
-
722
286
366
18.3
17.7
7.7
9.4
23.5
19.3
4.9
4.3
20.2
21.1
2.4
1.8
Radico Khaitan
Buy
111
156
1,483
1,565
1,687
12.2
13.0
5.7
7.1
19.6
15.7
1.6
1.5
8.3
9.6
1.4
1.3
Garware Wall Ropes
Buy
386
473
845
862
974
11.2
11.2
24.9
29.6
15.5
13.1
2.3
2.0
15.1
15.4
1.0
0.8
Wonderla Holidays
Neutral
371
-
2,098
206
308
44.0
43.6
9.0
12.9
41.3
28.8
5.6
5.1
13.7
17.8
10.1
6.7
Linc Pen & Plastics
Neutral
215
-
318
340
371
8.3
8.9
10.8
13.2
19.9
16.3
3.2
2.8
16.0
17.1
1.0
0.9
The Byke Hospitality
Neutral
150
-
603
222
287
20.5
20.5
5.6
7.6
26.7
19.9
5.0
4.1
18.9
20.8
2.7
2.1
Interglobe Aviation
Neutral
1,200
-
43,243
17,022
21,122
20.7
14.5
63.9
53.7
18.8
22.4
28.1
23.1
149.9
103.2
2.6
2.1
Coffee Day Enterprises
Neutral
256
-
5,265
2,692
2,964
17.0
18.6
-
4.7
-
53.9
3.1
3.0
0.2
5.5
2.4
2.2
Ltd
Navneet Education
Neutral
88
-
2,092
998
1,062
24.1
24.0
5.8
6.1
15.3
14.4
3.4
3.0
22.0
20.6
2.2
2.0
Navkar Corporation
Buy
201
265
2,861
365
436
38.3
37.5
5.6
5.9
35.6
34.1
2.2
2.1
6.3
6.1
8.7
7.4
Source: Company, Angel Research; Note: *December year end; #September year end; &October year end; Price as on January 14, 2016
Market Outlook
January 15, 2016
Research Team Tel: 022 - 39357800
DISCLAIMER
Angel Broking Private Limited (hereinafter referred to as “Angel”) is a registered Member of National Stock Exchange of India Limited,
Bombay Stock Exchange Limited and Metropolitian Stock Exchange of India Limited. It is also registered as a Depository Participant with
CDSL and Portfolio Manager with SEBI. It also has registration with AMFI as a Mutual Fund Distributor. Angel Broking Private Limited is a
registered entity with SEBI for Research Analyst in terms of SEBI (Research Analyst) Regulations, 2014 vide registration number
INH000000164. Angel or its associates has not been debarred/ suspended by SEBI or any other regulatory authority for accessing
/dealing in securities Market. Angel or its associates including its relatives/analyst do not hold any financial interest/beneficial ownership
of more than 1% in the company covered by Analyst. Angel or its associates/analyst has not received any compensation / managed or co
-managed public offering of securities of the company covered by Analyst during the past twelve months. Angel/analyst has not served as
an officer, director or employee of company covered by Analyst and has not been engaged in market making activity of the company
covered by Analyst.
This document is solely for the personal information of the recipient, and must not be singularly used as the basis of any investment
decision. Nothing in this document should be construed as investment or financial advice. Each recipient of this document should make
such investigations as they deem necessary to arrive at an independent evaluation of an investment in the securities of the companies
referred to in this document (including the merits and risks involved), and should consult their own advisors to determine the merits and
risks of such an investment.
Reports based on technical and derivative analysis center on studying charts of a stock's price movement, outstanding positions and
trading volume, as opposed to focusing on a company's fundamentals and, as such, may not match with a report on a company's
fundamentals.
The information in this document has been printed on the basis of publicly available information, internal data and other reliable sources
believed to be true, but we do not represent that it is accurate or complete and it should not be relied on as such, as this document is for
general guidance only. Angel Broking Pvt. Limited or any of its affiliates/ group companies shall not be in any way responsible for any
loss or damage that may arise to any person from any inadvertent error in the information contained in this report. Angel Broking Pvt.
Limited has not independently verified all the information contained within this document. Accordingly, we cannot testify, nor make any
representation or warranty, express or implied, to the accuracy, contents or data contained within this document. While Angel Broking
Pvt. Limited endeavors to update on a reasonable basis the information discussed in this material, there may be regulatory, compliance,
or other reasons that prevent us from doing so.
This document is being supplied to you solely for your information, and its contents, information or data may not be reproduced,
redistributed or passed on, directly or indirectly.
Neither Angel Broking Pvt. Limited, nor its directors, employees or affiliates shall be liable for any loss or damage that may arise from or
in connection with the use of this information.
Note: Please refer to the important ‘Stock Holding Disclosure' report on the Angel website (Research Section). Also, please refer to the
latest update on respective stocks for the disclosure status in respect of those stocks. Angel Broking Pvt. Limited and its affiliates may have
investment positions in the stocks recommended in this report.