Market Outlook
October 14, 2015
Market Cues
Domestic Indices
Chg (%)
(Pts)
(Close)
Indian markets are expected to open negatively tracking the SGX Nifty and its Asian
BSE Sensex
(0.2)
(58)
26,847
peers.
Nifty
(0.1)
(12)
8,132
US stocks closed in the red snapping the seven day uptrend. Decline in oil prices
Mid Cap
0.0
2
10,957
and further indications of slowdown in the Chinese economy weighed on the
Small Cap
0.4
46
11,396
investor sentiments.
Bankex
(0.2)
(37)
20,036
European indices declined for the second consecutive trading session. Poor Chinese
data took a toll on commodity and luxury goods shares.
Global Indices
Chg (%)
(Pts)
(Close)
Indian markets closed marginally in the red led by metal and telecom stocks. Metal
Dow Jones
(0.3)
(50)
17,082
heavyweights such as Tata Steel, Vedanta and Hindalco were under pressure (losing
about 3%) owing to weak trade data from major consumer China. Oil marketing
Nasdaq
(0.9)
(42)
4,797
companies such as BPCL, HPCL and IOL rose due to lower crude prices helping to
FTSE
(0.5)
(29)
6,342
arrest decline in the indices.
Nikkei
(1.1)
(204)
18,235
Hang Seng
(0.6)
(131)
22,600
News & Result Analysis
Shanghai Com
0.2
6
3,293
S&P assigns investment grade rating to M&M with stable outlook
Result Review: TCS
Detailed analysis on Pg2
Advances / Declines
Bse
Nse
Advances
1,519
1,019
Investor’s Ready Reckoner
Declines
1,258
482
Key Domestic & Global Indicators
Unchanged
107
68
Stock Watch: Latest investment recommendations on 150+ stocks
Refer Pg4 onwards
Volumes (` Cr)
Top Picks
BSE
2,779
CMP
Target
Upside
Company
Sector
Rating
NSE
14,493
(`)
(`)
(%)
Axis Bank
Financials
Buy
491
701
42.8
ICICI Bank
Financials
Buy
287
370
28.9
Net Inflows (` Cr)
Net
Mtd
Ytd
Power Grid
Power
Buy
133
170
27.8
FII
488
1,873
119,938
TCS
IT
Buy
2,597
3,168
22.0
MFs
136
743
79,748
Aurobindo Pharma Pharmaceuticals Accumulate
782
872
11.5
More Top Picks on Pg3
Top Gainers
Price (`)
Chg (%)
Key Upcoming Events
Coromandel
185
11.9
Previous
Consensus
Date
Region
Event Description
Kailash
29
10.5
Reading
Expectations
Oct 14
India
Monthly Wholesale Prices YoY%
(4.95)
--
Vedl
111
7.0
Oct 15
India
Imports
(9.95)
Hindalco
89
6.0
Oct 15
India
Exports
(20.66)
Jpassociat
13
5.5
Oct 15
US
Initial jobless claims
263.00
270.00
Top Losers
Price (`)
Chg (%)
Renuka
11
(6.3)
Sreinfra
51
(4.6)
Infratel
386
(4.4)
Emamiltd
1,105
(4.4)
Infy
1,123
(3.9)
As on October 12, 2015
Market Outlook
October 14, 2015
S&P assigns investment grade rating to M&M with stable outlook
Global ratings agency S&P assigned an investment grade, long term corporate
credit rating of BBB—, to homegrown auto major Mahindra & Mahindra with a
stable outlook. As per S&P, its rating reflects the company’s leading market
position in tractor and utility vehicle (UV) segments, strong financial ratios, and
financial flexibility arising out of significant investments in group companies.
Besides, the rating is also reflective of M&M’s conservative leverage policies,
healthy cashflow generation, risk mitigation through presence in various
businesses with a pan-India footprint and a good mix of rural and urban
customers.
The rating is equivalent to India’s sovereign rating. Last week M&M was assigned
Baa3 ratings by Moody’s.
With S&P’s and Moody’s ratings, M&M will now enjoy dual investment grade
ratings which are equivalent to India’s investment grade sovereign ratings from
both the above agencies. The ratings give M&M an additional option to borrow
through international bonds with tenure ranging from 10—30 years at much lower
rates. Earlier, the company’s options were limited to domestic borrowings and
through ECBs of tenure of up to 5 years.
M&M current debt:equity ratio at 0.2x is lowest amongst the automotive OEM’s.
We currently have Accumulate rating on the stock.
Result Review
TCS (CMP: `2,597 / TP: `3,168 /Upside: 21.9%)
TCS, posted results below expectation on sales front and net profit, while the EBIT
margins remained in line with expectations. On sales front, the company posted a
3.0% sequential growth in USD revenues to US$4,156mn V/s US$4,177mn
expected. On Constant currency (CC), the company posted a 3.9% qoq rise in
sales. In rupee terms, revenues came in at `27,165cr V/s `27,244cr expected, up
5.8% qoq.
In terms of geography, US grew by 3.1% qoq CC growth, Latin America grew by
6.2% qoq CC growth. In Europe the UK region grew by 4.6% qoq CC growth and
Continental Europe grew by 2.0% qoq CC growth. India, grew by 7.8% qoq CC
growth, Asia Pacific grew by 4.1% qoq CC growth, while MEA grew by 12.9% qoq
CC growth.
In terms of domains, the key outperforming domains were Assurance services,
which posted a qoq 6.1% CC growth, while Asset leveraged Solutions, posted a
32.8% qoq CC growth. Other key domains like Application development &
Maintenance 3.1% qoq CC growth, while Enterprises solutions grew by 3.4% qoq
CC growth.
EBIT margins came in at 27.1% V/s 27.2% expected and 26.3% in 1QFY2016, a
qoq expansion of
~78bps, mainly lead by currency depreciation
(60bps).
Consequently, PAT came in at
`6,093cr V/s
`6,213cr expected, a rise of
6.1% qoq.
Market Outlook
October 14, 2015
On the operating front, the utilization rate came in at 86.0% (ex- trainees) and
82.3% (inl. Trainees), while the attrition rate came in at 16.2%. In terms of the
client wins, company added 13 wins, adding 3 clients in the US$100mn and 6
clients in the US $10mn. This along with the strong employee net additions during
the quarter of 10,685 and order book which company has mentioned is 30%
higher than its best book ever, indicates and bodes well for company’s
performance going forward. We maintain our buy rating on the stock with a target
price of `3,168.
Y/E
Sales OPM
PAT
EPS ROE P/E P/BV EV/EBITDA EV/Sales
March
(` cr)
(%)
(` cr)
(`)
(%)
(x)
(x)
(x)
(x)
FY2015E
1,08,420
28.8
24,891
127.2
39.9
20.4
4.3
14.9
4.3
FY2016E
1,23,599
28.7
28,155
143.9
41.8
18.0
3.7
13.0
3.7
Economic and Political News
Raw sugar export subsidy ruled out for now, focus on white exports
Truck, bus tyre import nearly doubles
Growth to accelerate in coming months: FICCI
Corporate News
Pfizer India MD Aijaz Tobaccowalla resigns
Airtel to offer `15,000 freebies with iPhones
Videocon loan conversion enabling resolution passed at EGM
Market Outlook
October 14, 2015
Top Picks ★★★★★
Large Cap
Market Cap
CMP
Target
Upside
Company
Rationale
(` Cr)
(`)
(`)
(%)
Robust US sales along with the acquisations, will aid the growth
Aurobindo
45,666
782
872
11.5
and stable margins.
Healthy pace of branch expansion, backed by distribution
Axis Bank
116,717
491
701
42.8
network.
Robust franchise and capital adequacy position will help the
ICICI Bank
166,913
287
370
28.9
bank to outperform the industry average.
Back on the growth trend; expect a long term growth of 14% to
Infosys
252,354
1,099
1,306
18.8
be a US$20bn in FY2020.
Government thrust on Renewable sector and strong order book
Inox Wind
8,492
383
505
31.9
would drive future growth.
LICHF continues to grow its retail loan book at a healthy pace
LIC HFL
24,045
476
570
19.7
with improvement in asset quality.
Direct beneficiary of the huge investments lined up in the power
Power Grid
69,449
133
170
27.8
transmission sector.
Growth to pick up from 2HFY2017, attractive given the risk-
TCS
511,799
2,597
3,168
22.0
reward.
Tech Mahindra
53,698
558
646
15.8
Acquisitions, to drive growth, normalised valuations attractive.
An improving liability franchise, capital adequacy well above
Yes Bank
30,729
734
953
29.8
Basel III requirements and lowest NPA ratio in the industry.
Source: Company, Angel Research
Mid Cap
Market Cap
CMP
Target
Upside
Company
Rationale
(` Cr)
(`)
(`)
(%)
Bajaj Electricals
2,479
246
341
38.6
Visible turnaround in E&P business to drive the earnings.
Garware Wall Ropes
843
355
390
9.9
Higher exports & easing material prices to drive profitability.
Comfortable balance sheet to support strong growth; this
MBL Infrastructures
987
238
360
51.3
coupled with attractive valuation to lead to rerating.
New product introductions and increased sourcing by clients to
Minda Industries
802
506
652
28.9
enable outpace industry growth.
Strong brand & quality teaching with innovative technologies &
MT Educare
532
134
169
26.1
higher government educational spending to boost growth.
Earnings boost on back of stable material prices and favorable
Radico Khaitan
1,131
85
112
31.8
pricing environment. Valuation discount to peers provides
additional comfort.
Structural shift in the Lighting industry towards LED lighting will
Surya Roshni
630
144
183
27.1
drive growth.
Tree House
1,232
291
449
54.3
Robust expansion plan for pre-schools to drive growth.
Source: Company, Angel Research
Market Outlook
October 14, 2015
Quarterly Bloomberg Brokers Consensus Estimate
Hindustan Unilever Ltd - October 14, 2015
Particulars (` cr)
2QFY16E
2QFY15
y-o-y (%)
1QFY16
q-o-q (%)
Net sales
7,979
7,466
6.9
7,973
0.1
EBITDA
1,437
1,242
15.7
1,506
(4.6)
EBITDA margin (%)
18.0
16.6
18.9
Net profit
1,043
988
5.6
1,059
(1.5)
LIC Housing Finance Ltd - October 15, 2015
Particulars (` cr)
2QFY16E
2QFY15
y-o-y (%)
1QFY16
q-o-q (%)
PAT
406
341
19.0
382
6.3
Reliance Industries Ltd - October 16, 2015
Particulars (` cr)
2QFY16E
2QFY15
y-o-y (%)
1QFY16
q-o-q (%)
Net sales
62,343
96,486
(35.4)
65,817
(5.3)
EBITDA
8,580
8,235
4.2
9,307
(7.8)
EBITDA margin (%)
13.8
8.5
14.1
Net profit
5,900
5,742
2.8
6,318
(6.6)
Market Outlook
October 14, 2015
Key Upcoming Events
Result Calendar
Date
Company
Oct 14, 2015
HUL
Oct 15, 2015
LIC Housing Fin., Mindtree, Infotech Enterprises, D B Corp
Oct 16, 2015
Reliance Industries
Oct 17, 2015
South Ind.Bank
Oct 18, 2015
Oct 19, 2015
UltraTech Cement, HCL Tech, Hind. Zinc, Petronet LNG, Heritage Foods
Oct 20, 2015
Hero Motocorp, ACC, Federal Bank, Mphasis, Jyothy Laboratories, Aventis
Oct 21, 2015
M&M, Bajaj Auto, HDFC Bank, Wipro, KPIT Cummins, NIIT, JSW Steel , Cairn India
Oct 22, 2015
Cadila Healthcare
Oct 23, 2015
Asian Paints
Oct 24, 2015
Godrej Consumer, Persistent
Oct 25, 2015
Oct 26, 2015
Blue Star, HDFC, Hindustan Media Ventures, Hitachi
Oct 27, 2015
Thermax, Axis Bank
Oct 28, 2015
Amara Raja Batteries, Ambuja Cements, Dabur India, HT Media, Kirloskar Engines India Ltd, Elecon Engineering
Oct 29, 2015
Nestle, Colgate, L G Balakrishnan & Bros, Dr Reddy's, Dishman Pharma
Oct 30, 2015
Apollo Tyres, Subros, ICICI Bank, Kotak Mah. Bank, Indoco Remedies
Oct 31, 2015
IDFC, GSK Pharma
Source: Bloomberg, Angel Research
Global economic events release calendar
Date
Time
Country
Event Description
Unit
Period
Bloomberg Data
Last Reported Estimated
Oct 14, 2015 2:00PM UK
Jobless claims change
% Change
Sep
1.20
(2.15)
12:00PM India
Monthly Wholesale Prices YoY%
% Change
Sep
(4.95)
(4.42)
7:00AM China
Consumer Price Index (YoY)
% Change
Sep
2.00
1.80
Oct 15, 2015
India
Imports YoY%
% Change
Sep
(9.95)
--
India
Exports YoY%
% Change
Sep
(20.66)
--
6:00PM US
Initial Jobless claims
Thousands
Oct 8
263.00
270.00
6:00PM US
Consumer price index (mom)
% Change
Sep
(0.10)
(0.20)
Oct 16, 2015 6:45PM US
Industrial Production
%
Sep
(0.38)
(0.30)
2:30PM Euro Zone
Euro-Zone CPI (YoY)
%
Sep F
(0.10)
(0.10)
Oct 19, 2015 7:30AM China
Industrial Production (YoY)
% Change
Sep
6.10
6.00
7:30AM China
Real GDP (YoY)
% Change
3Q
7.00
6.80
Oct 20, 2015 6:00PM US
Housing Starts
Thousands
Sep
1,126.00
1,130.00
6:00PM US
Building permits
Thousands
Sep
1,170.00
1,155.00
Oct 22, 2015 7:30PM Euro Zone
Euro-Zone Consumer Confidence
Value
Oct A
(7.10)
--
7:30PM US
Existing home sales
Million
Sep
5.31
5.34
5:15PM Euro Zone
ECB announces interest rates
%
Oct 22
0.05
--
Oct 23, 2015 1:00PM Germany
PMI Services
Value
Oct P
54.10
--
1:00PM Germany
PMI Manufacturing
Value
Oct P
52.30
--
Oct 26, 2015 7:30PM US
New home sales
Thousands
Sep
552.00
--
Oct 27, 2015 3:00PM UK
GDP (YoY)
% Change
3Q A
2.40
--
7:30PM US
Consumer Confidence
S.A./ 1985=100
Oct
103.04
--
Oct 28, 2015 11:30PM US
FOMC rate decision
%
Oct 28
0.25
0.25
Oct 29, 2015 2:25PM Germany
Unemployment change (000's)
Thousands
Oct
2.00
--
6:00PM US
GDP Qoq (Annualised)
% Change
3Q A
3.90
--
Market Outlook
October 14, 2015
Key Upcoming Events
Source: Bloomberg, Angel Research
Market Outlook
October 14, 2015
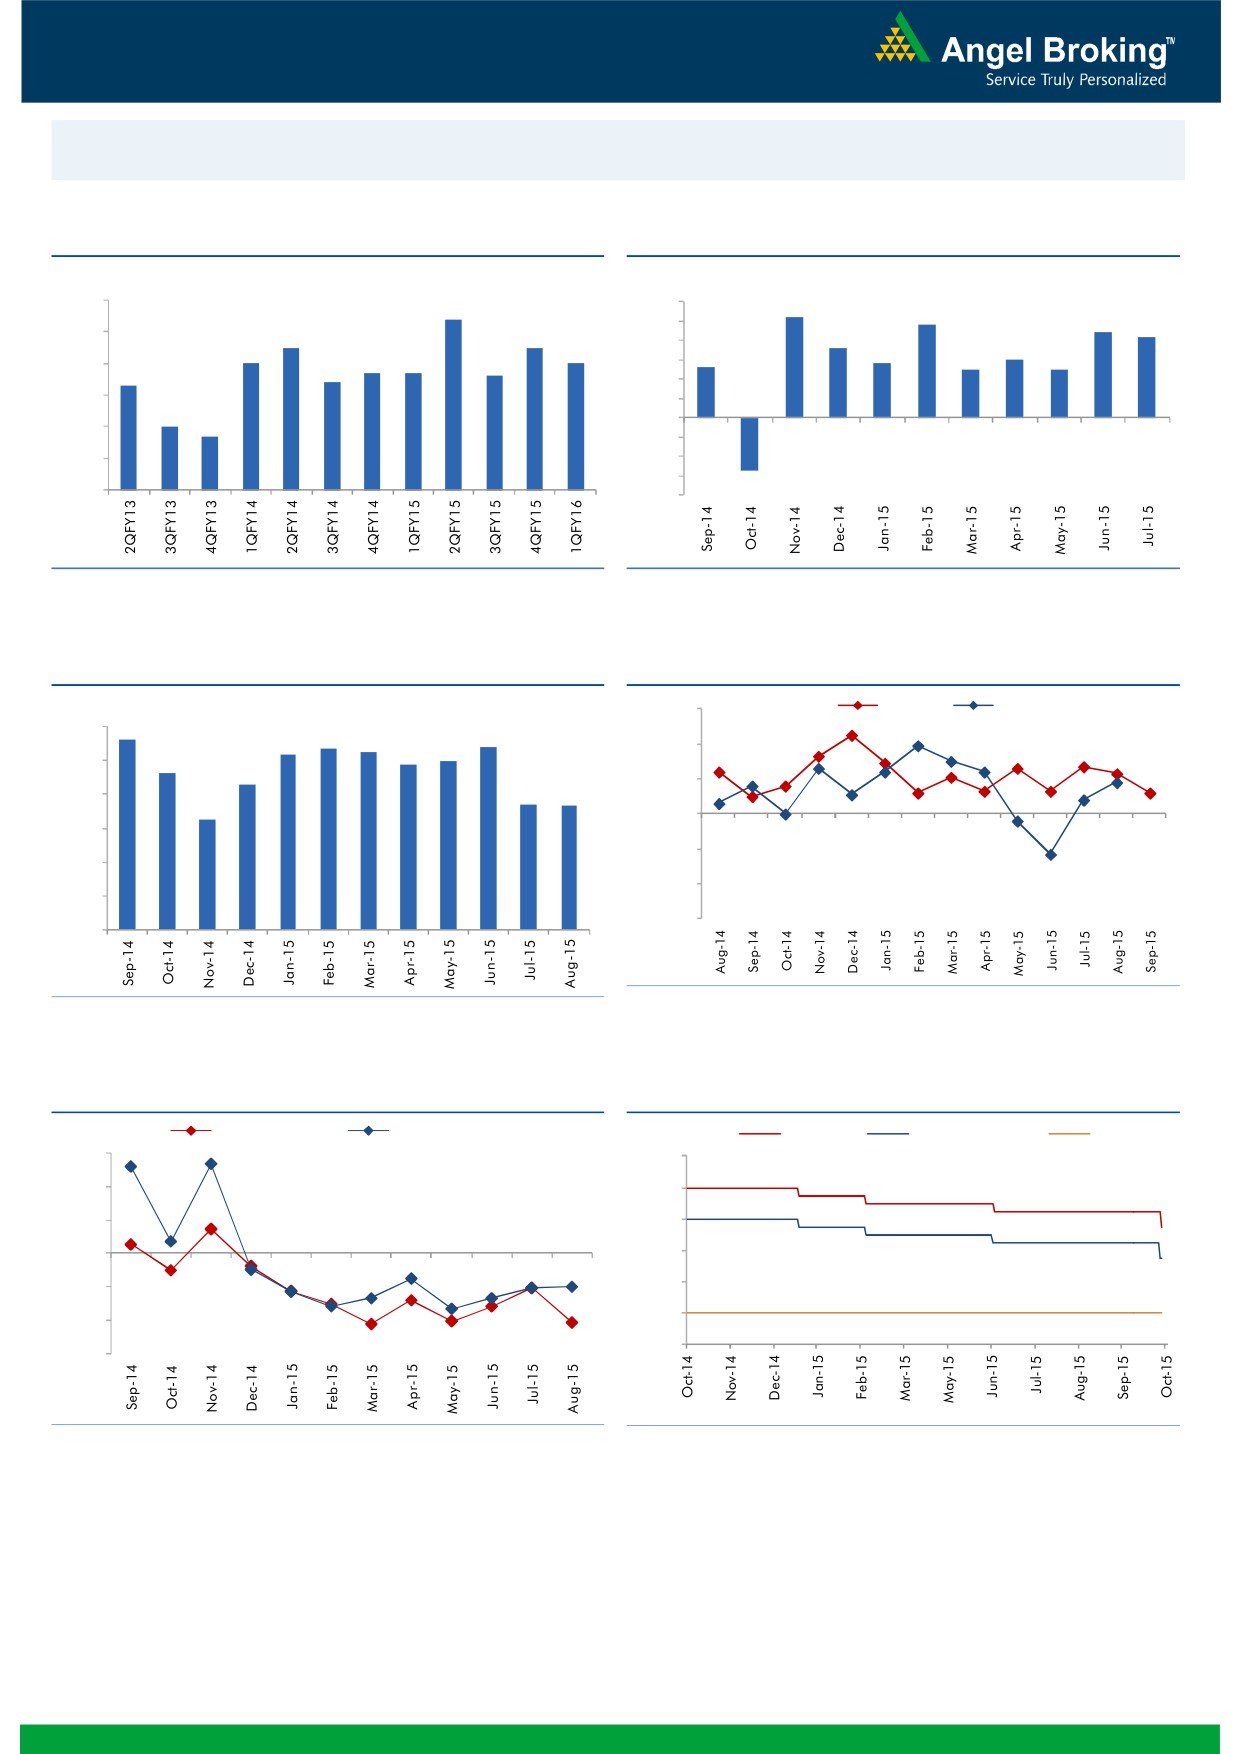
Macro watch
Exhibit 1: Quarterly GDP trends
Exhibit 2: IIP trends
(%)
(%)
9.0
8.4
6.0
5.2
4.8
5.0
4.4
4.2
8.0
7.5
7.5
3.6
4.0
3.0
7.0
7.0
2.6
2.8
6.7
6.7
2.5
2.5
7.0
6.4
6.6
3.0
6.3
2.0
6.0
1.0
5.0
4.7
-
5.0
(1.0)
4.0
(2.0)
(3.0)
3.0
(2.7)
(4.0)
Source: CSO, Angel Research
Source: MOSPI, Angel Research
Exhibit 3: Monthly CPI inflation trends
Exhibit 4: Manufacturing and services PMI
(%)
56.0
Mfg. PMI
Services PMI
6.0
5.6
5.4
5.2
5.4
5.3
4.9
5.0
54.0
5.0
4.6
4.3
52.0
3.7
3.7
4.0
3.3
50.0
3.0
48.0
2.0
46.0
1.0
44.0
-
Source: Market, Angel Research; Note: Level above 50 indicates expansion
Source: MOSPI, Angel Research
Exhibit 5: Exports and imports growth trends
Exhibit 6: Key policy rates
(%)
Exports yoy growth
Imports yoy growth
(%)
Repo rate
Reverse Repo rate
CRR
30.0
9.00
20.0
8.00
10.0
7.00
0.0
6.00
5.00
(10.0)
4.00
(20.0)
3.00
(30.0)
Source: Bloomberg, Angel Research
Source: RBI, Angel Research
Market Outlook
October 14, 2015
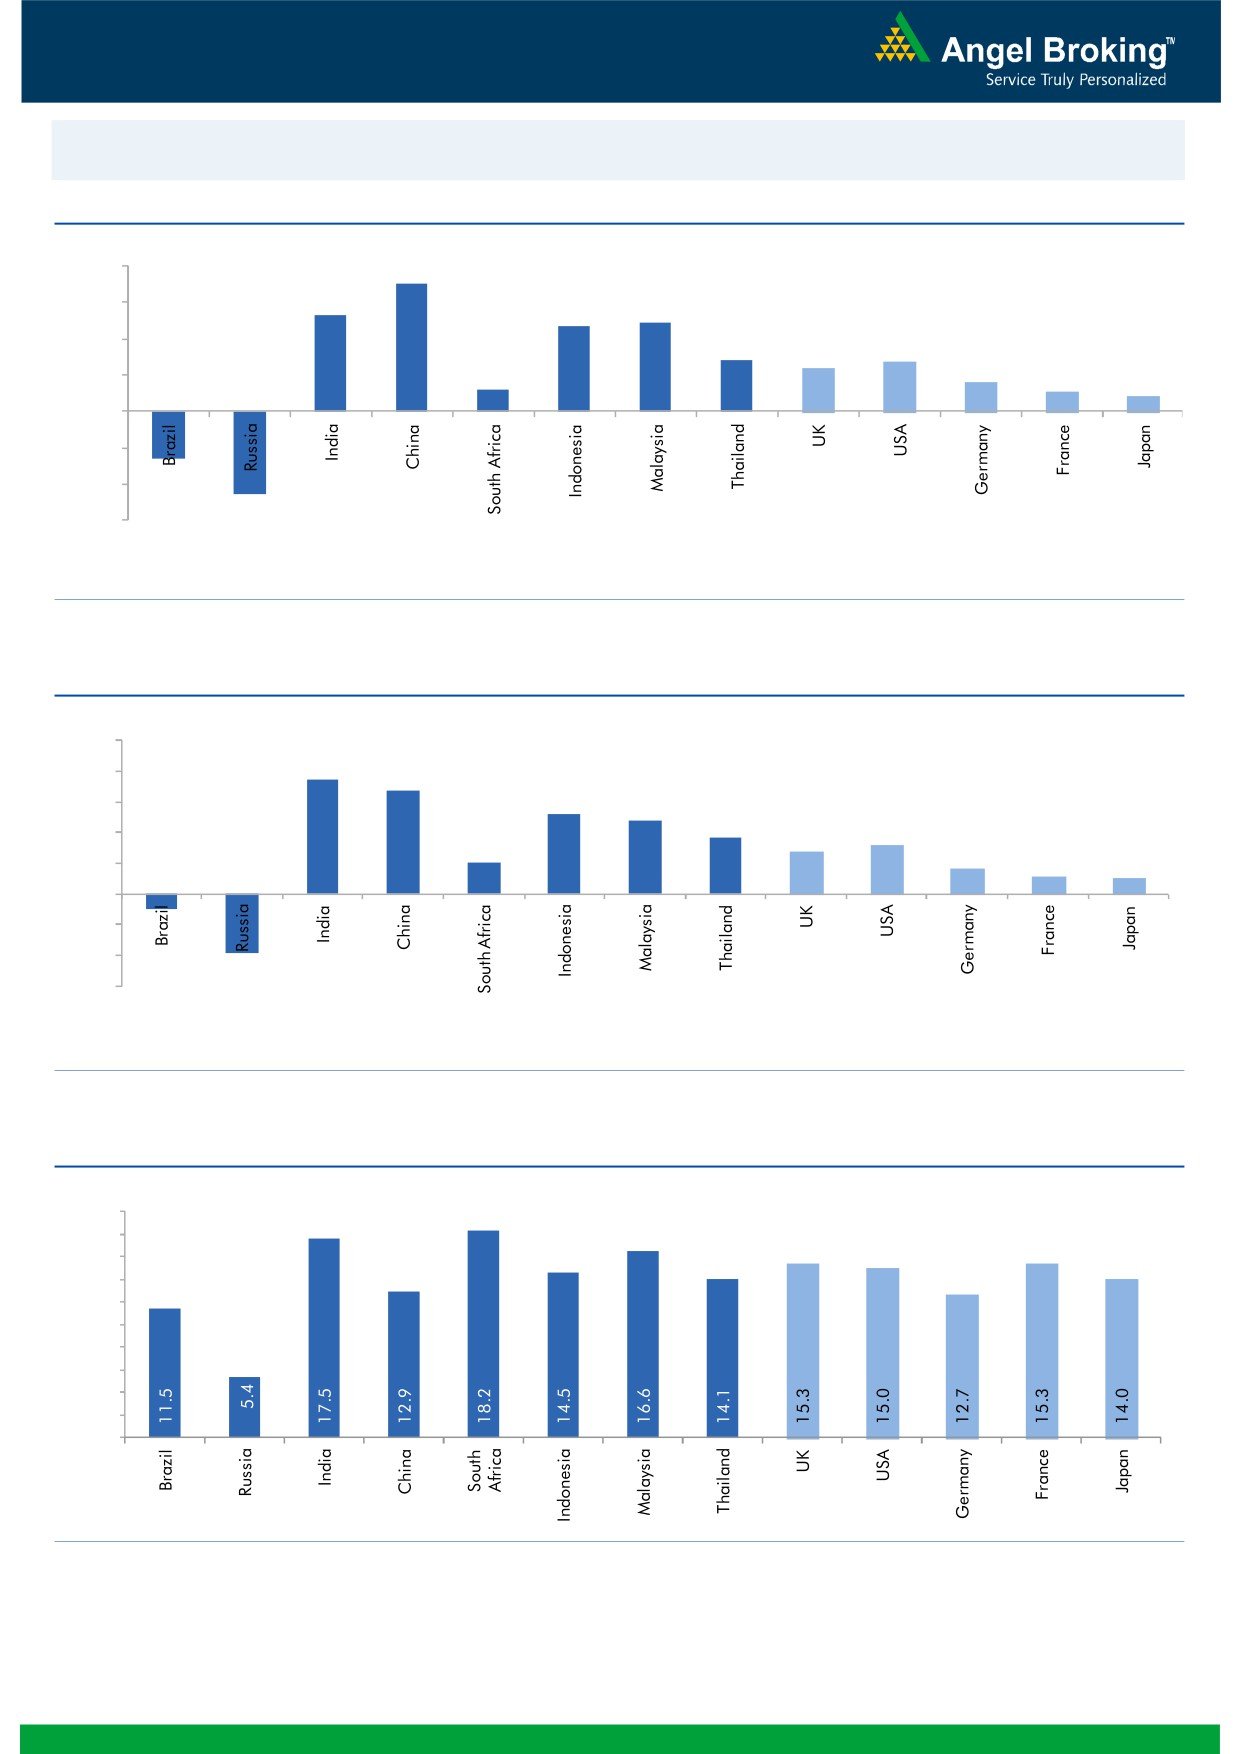
Global watch
Exhibit 1: Latest quarterly GDP Growth (%, yoy) across select developing and developed countries
(%)
8.0
7.0
6.0
5.3
4.9
4.7
4.0
2.8
2.7
2.4
1.6
2.0
1.2
1.1
0.8
-
(2.0)
(2.6)
(4.0)
(4.6)
(6.0)
Source: Bloomberg, Angel Research
Exhibit 2: 2015 GDP Growth projection by IMF (%, yoy) across select developing and developed countries
(%)
10.0
7.5
8.0
6.8
5.2
6.0
4.8
3.7
3.1
4.0
2.7
2.0
1.6
1.2
1.0
2.0
-
(2.0)
(4.0)
(1.0)
(3.8)
(6.0)
Source: IMF, Angel Research
Exhibit 3: One year forward P-E ratio across select developing and developed countries
(x)
20.0
18.0
16.0
14.0
12.0
10.0
8.0
6.0
4.0
2.0
-
Source: IMF, Angel Research
Market Outlook
October 14, 2015
Exhibit 4: Relative performance of indices across globe
Returns (%)
Country
Name of index
Closing price
1M
3M
1YR
Brazil
Bovespa
47,363
1.8
(10.8)
(17.5)
Russia
Micex
1,721
0.2
4.8
26.1
India
Nifty
8,132
5.8
(2.7)
3.6
China
Shanghai Composite
3,293
6.4
(12.1)
39.6
South Africa
Top 40
47,644
8.2
1.6
13.7
Mexico
Mexbol
44,318
3.3
(1.8)
2.9
Indonesia
LQ45
763
4.3
(9.1)
(9.7)
Malaysia
KLCI
1,711
6.7
0.6
(6.2)
Thailand
SET 50
916
2.1
(6.5)
(13.4)
USA
Dow Jones
17,082
3.9
(5.4)
4.7
UK
FTSE
6,342
3.7
(6.1)
2.1
Japan
Nikkei
18,235
2.1
(7.6)
13.4
Germany
DAX
10,033
(0.9)
(13.1)
13.7
France
CAC
4,643
2.1
(8.0)
15.1
Source: Bloomberg, Angel Research
Stock Watch
October 14, 2015
Company Name
Reco
CMP
Target
Mkt Cap
Sales ( Čcr )
OPM(%)
EPS (Č)
PER(x)
P/BV(x)
RoE(%)
EV/Sales(x)
(Č)
Price ( Č)
( Č cr )
FY16E FY17E
FY16E
FY17E
FY16E
FY17E
FY16E
FY17E
FY16E
FY17E
FY16E
FY17E
FY16E
FY17E
Agri / Agri Chemical
Rallis
Neutral
214
-
4,152
2,075
2,394
14.4
14.4
9.5
11.0
22.5
19.4
4.5
3.9
21.1
21.3
2.0
1.8
United Phosphorus
Accumulate
475
510
20,361
13,698
15,752
17.6
17.6
32.1
38.5
14.8
12.3
2.9
2.4
21.4
21.3
1.6
1.3
Auto & Auto Ancillary
Ashok Leyland
Accumulate
94
102
26,765
18,763
22,357
11.1
11.2
3.6
4.8
26.1
19.6
4.8
4.4
18.7
22.6
1.4
1.1
Bajaj Auto
Neutral
2,461
-
71,206
23,544
27,245
19.8
19.8
127.0
143.4
19.4
17.2
5.9
5.0
30.3
29.4
2.6
2.2
Eicher Motors
Buy
17,820
22,859
48,369
11,681
15,550
15.3
16.9
358.5
564.3
49.7
31.6
14.9
11.1
29.8
34.9
4.0
3.0
Hero Motocorp
Accumulate
2,539
2,672
50,698
28,500
32,764
14.1
14.3
146.9
167.0
17.3
15.2
6.5
5.6
37.8
36.5
1.6
1.4
L G Balakrishnan & Bros Neutral
435
-
683
1,254
1,394
11.6
11.8
35.9
41.7
12.1
10.5
1.6
1.5
13.5
13.8
0.6
0.6
Mahindra and Mahindra Accumulate
1,281
1,357
79,574
37,986
42,660
12.8
13.2
51.6
61.9
24.8
20.7
3.6
3.2
14.6
15.6
1.7
1.5
Maruti
Buy
4,275
4,960
129,150
58,102
68,587
16.7
16.9
182.0
225.5
23.5
19.0
4.7
4.0
19.9
21.0
2.0
1.6
Minda Industries
Buy
510
652
809
2,567
2,965
7.3
8.0
38.8
54.3
13.2
9.4
1.9
1.6
14.4
16.8
0.4
0.3
Rane Brake Lining
Buy
304
366
241
454
511
11.1
11.4
23.8
28.1
12.8
10.8
1.8
1.7
14.2
15.3
0.7
0.6
Setco Automotive
Neutral
230
-
615
594
741
12.7
13.7
8.4
15.8
27.4
14.6
2.8
2.5
10.4
16.9
1.5
1.2
Tata Motors
Accumulate
361
395
104,214
264,038
297,882
13.8
13.9
34.5
38.9
10.5
9.3
1.8
1.5
17.6
16.8
0.6
0.5
TVS Motor
Neutral
242
-
11,504
11,702
13,713
6.8
7.7
10.1
14.5
24.0
16.7
5.9
4.7
24.5
28.3
1.0
0.8
Amara Raja Batteries
Neutral
999
-
17,061
5,101
6,224
17.8
17.6
31.1
39.2
32.1
25.5
8.0
6.3
24.8
24.8
3.3
2.7
Exide Industries
Accumulate
151
159
12,839
7,363
8,247
13.7
14.5
6.6
7.7
22.9
19.6
2.9
2.6
12.6
13.3
1.5
1.3
Apollo Tyres
Neutral
191
-
9,699
12,576
12,978
16.8
16.1
22.3
19.9
8.5
9.6
1.5
1.3
17.2
13.4
0.8
0.9
Ceat
Neutral
1,219
-
4,931
6,041
6,597
14.3
14.2
101.5
116.6
12.0
10.5
2.4
2.0
20.0
19.1
1.0
0.8
JK Tyres
Neutral
103
-
2,332
7,446
7,669
15.2
14.0
19.6
18.4
5.2
5.6
1.3
1.1
25.2
19.5
0.7
0.6
Swaraj Engines
Accumulate
849
912
1,054
593
677
14.5
14.8
51.2
60.8
16.6
14.0
3.9
3.5
23.3
24.8
1.6
1.4
Subros
Neutral
82
-
490
1,268
1,488
11.6
11.9
3.7
6.6
22.1
12.4
1.5
1.4
6.8
11.4
0.7
0.6
Indag Rubber
Neutral
183
-
479
283
329
17.0
17.2
13.0
15.4
14.1
11.8
3.1
2.6
21.8
21.6
1.4
1.2
Capital Goods
ACE
Neutral
41
-
401
660
839
4.7
8.2
1.0
3.9
40.5
10.4
1.3
1.1
3.2
11.3
0.8
0.6
BEML
Neutral
1,222
-
5,087
3,277
4,006
6.0
8.9
29.2
64.3
41.8
19.0
2.3
2.1
5.7
11.7
1.6
1.3
BGR Energy
Neutral
115
-
832
3,615
3,181
9.5
9.4
16.7
12.4
6.9
9.3
0.7
0.6
10.0
7.0
0.6
0.8
BHEL
Neutral
208
-
51,020
33,722
35,272
10.8
11.7
10.5
14.2
19.9
14.7
1.5
1.4
7.0
9.0
1.6
1.5
Blue Star
Accumulate
355
387
3,196
3,649
4,209
5.0
5.9
9.2
14.7
38.9
24.1
7.0
6.6
9.1
17.5
1.0
0.8
Crompton Greaves
Accumulate
179
204
11,209
13,484
14,687
4.9
6.2
4.5
7.1
39.7
25.2
2.8
2.6
7.2
10.8
1.0
0.9
Inox Wind
Buy
382
505
8,476
4,980
5,943
17.0
17.5
26.6
31.6
14.4
12.1
4.3
3.2
35.0
30.0
1.9
1.5
Stock Watch
October 14, 2015
Company Name
Reco
CMP
Target
Mkt Cap
Sales ( Čcr )
OPM(%)
EPS (Č)
PER(x)
P/BV(x)
RoE(%)
EV/Sales(x)
(Č)
Price ( Č)
( Č cr )
FY16E
FY17E
FY16E
FY17E
FY16E
FY17E
FY16E
FY17E
FY16E
FY17E
FY16E
FY17E
FY16E
FY17E
Capital Goods
KEC International
Neutral
145
-
3,733
8,791
9,716
6.1
6.8
5.4
8.2
26.9
17.7
2.7
2.5
10.0
14.0
0.6
0.6
Thermax
Neutral
858
-
10,218
6,413
7,525
7.4
8.5
30.5
39.3
28.1
21.8
4.3
3.8
15.0
17.0
1.6
1.3
Cement
ACC
Accumulate
1,352
1,548
25,383
11,856
14,092
14.5
17.8
47.6
76.1
28.4
17.8
2.9
2.7
10.6
15.7
2.0
1.6
Ambuja Cements
Accumulate
210
233
32,582
10,569
12,022
20.7
22.2
8.7
10.7
24.1
19.6
3.1
2.9
13.0
15.2
2.7
2.4
India Cements
Buy
78
112
2,410
4,716
5,133
15.9
16.9
3.7
7.5
21.2
10.5
0.8
0.7
3.8
7.3
0.8
0.7
JK Cement
Buy
633
767
4,428
4,056
4,748
14.5
17.0
22.6
41.1
28.0
15.4
2.5
2.2
9.3
15.3
1.5
1.3
J K Lakshmi Cement
Accumulate
383
430
4,510
2,947
3,616
16.7
19.9
11.5
27.2
33.3
14.1
3.2
2.7
9.8
20.8
1.9
1.5
Mangalam Cements
Neutral
225
-
601
1,053
1,347
10.5
13.3
8.4
26.0
26.8
8.7
1.1
1.0
4.3
12.5
0.9
0.7
Orient Cement
Neutral
175
-
3,581
1,854
2,524
21.2
22.2
7.7
11.1
22.7
15.8
3.3
2.8
13.3
15.7
2.7
1.9
Ramco Cements
Neutral
334
-
7,940
4,036
4,545
20.8
21.3
15.1
18.8
22.1
17.7
2.7
2.4
12.9
14.3
2.5
2.1
Shree Cement^
Neutral
12,227
-
42,596
7,150
8,742
26.7
28.6
228.0
345.5
53.6
35.4
7.9
6.6
15.7
20.3
5.7
4.6
UltraTech Cement
Accumulate
2,904
3,282
79,694
27,562
31,548
20.4
22.3
111.9
143.3
26.0
20.3
3.7
3.2
15.2
16.8
3.0
2.5
Construction
ITNL
Neutral
92
-
3,012
7,360
8,825
34.0
35.9
1.0
5.0
91.6
18.3
0.4
0.4
0.3
1.4
3.8
3.7
KNR Constructions
Neutral
570
-
1,604
915
1,479
14.3
13.9
20.3
37.2
28.1
15.3
2.6
2.2
9.6
15.6
1.9
1.2
Larsen & Toubro
Buy
1,543
2,013
143,624
68,920
82,446
10.9
11.5
57.0
73.0
27.1
21.1
2.5
2.3
13.6
15.5
2.3
1.9
Gujarat Pipavav Port
Neutral
187
-
9,016
721
784
53.1
53.6
8.2
9.1
22.7
20.5
3.7
3.0
20.0
18.3
12.1
10.7
MBL Infrastructures
Buy
238
360
987
2,313
2,797
12.2
14.6
19.0
20.0
12.5
11.9
1.3
1.2
11.3
10.6
1.1
1.0
Nagarjuna Const.
Neutral
81
-
4,500
7,892
8,842
8.3
9.1
2.4
5.3
33.7
15.3
1.4
1.3
4.2
8.6
0.8
0.7
PNC Infratech
Neutral
523
-
2,685
1,798
2,132
13.2
13.5
22.0
30.0
23.8
17.5
2.1
1.9
11.5
11.4
1.6
1.3
Simplex Infra
Neutral
340
-
1,682
6,241
7,008
10.4
10.7
20.0
36.0
17.0
9.4
1.4
1.3
6.8
11.1
0.8
0.7
Financials
Allahabad Bank
Neutral
78
-
4,663
8,438
9,521
2.8
2.8
21.9
27.0
3.6
2.9
0.4
0.3
10.2
11.5
-
-
Axis Bank
Buy
491
701
116,717
26,941
32,298
3.5
3.6
37.4
46.4
13.1
10.6
2.7
2.3
18.7
20.0
-
-
Bank of Baroda
Neutral
176
-
40,576
19,027
21,737
1.9
2.0
16.9
24.5
10.4
7.2
1.0
0.9
9.1
12.1
-
-
Bank of India
Neutral
142
-
11,265
16,438
18,706
1.9
2.0
19.2
40.9
7.4
3.5
0.4
0.4
4.5
9.1
-
-
Canara Bank
Neutral
298
-
16,154
15,491
17,269
2.0
2.0
61.6
70.9
4.8
4.2
0.5
0.5
10.5
11.1
-
-
Dena Bank
Neutral
43
-
2,393
3,498
3,977
2.1
2.3
7.8
10.7
5.5
4.0
0.4
0.4
6.5
8.4
-
-
Federal Bank
Neutral
65
-
11,114
3,527
4,135
3.0
3.1
5.2
6.7
12.5
9.7
1.3
1.2
10.8
12.7
-
-
HDFC
Neutral
1,277
-
201,509
10,883
12,799
3.5
3.4
43.0
50.6
29.7
25.2
5.9
5.3
25.9
26.7
-
-
HDFC Bank
Buy
1,077
1,255
271,172
38,059
46,851
4.4
4.5
50.0
62.7
21.5
17.2
3.8
3.2
18.8
20.2
-
-
Stock Watch
October 14, 2015
Company Name
Reco
CMP
Target
Mkt Cap
Sales ( Čcr )
OPM(%)
EPS (Č)
PER(x)
P/BV(x)
RoE(%)
EV/Sales(x)
(Č)
Price ( Č)
( Č cr )
FY16E
FY17E
FY16E
FY17E
FY16E
FY17E
FY16E
FY17E
FY16E
FY17E
FY16E
FY17E
FY16E
FY17E
Financials
ICICI Bank
Buy
287
370
166,913
35,810
41,871
3.4
3.5
22.0
26.2
13.1
11.0
2.3
1.9
15.0
15.6
-
-
IDBI Bank
Neutral
77
-
12,399
9,860
10,978
1.8
1.9
9.3
15.6
8.3
5.0
0.6
0.5
6.4
10.1
-
-
Indian Bank
Neutral
139
-
6,678
6,267
7,171
2.4
2.5
25.4
32.1
5.5
4.3
0.5
0.4
8.0
9.3
-
-
LIC Housing Finance
Buy
476
570
24,045
2,934
3,511
2.3
2.3
30.9
36.8
15.4
13.0
2.5
2.2
16.8
17.5
-
-
Oriental Bank
Neutral
144
-
4,304
7,730
8,595
2.4
2.5
38.8
47.4
3.7
3.0
0.3
0.3
8.6
9.8
-
-
Punjab Natl.Bank
Neutral
137
-
25,361
23,446
26,624
2.8
2.9
17.8
27.5
7.7
5.0
0.8
0.6
8.5
12.1
-
-
South Ind.Bank
Neutral
22
-
3,031
1,930
2,215
2.4
2.4
2.6
3.6
8.6
6.2
0.9
0.8
9.9
12.5
-
-
St Bk of India
Buy
243
307
188,946
83,847
96,307
2.8
2.8
20.1
25.1
12.1
9.7
1.3
1.2
11.5
13.1
-
-
Union Bank
Neutral
180
-
11,450
12,755
14,439
2.3
2.4
31.5
39.9
5.7
4.5
0.6
0.5
9.9
11.6
-
-
Vijaya Bank
Neutral
36
-
3,093
3,594
3,969
1.8
1.9
5.8
7.1
6.2
5.1
0.5
0.5
8.2
9.3
-
-
Yes Bank
Buy
734
953
30,729
7,204
9,078
3.2
3.2
57.8
69.5
12.7
10.6
2.3
1.9
19.6
22.6
-
-
FMCG
Asian Paints
Neutral
866
-
83,033
16,553
19,160
16.0
16.2
17.7
21.5
49.0
40.3
13.0
11.7
29.4
31.2
4.9
4.2
Britannia
Neutral
3,115
-
37,374
8,065
9,395
9.6
10.2
47.2
65.5
66.0
47.6
21.9
20.7
38.3
41.2
4.5
3.8
Colgate
Neutral
919
-
24,993
4,836
5,490
19.5
19.7
48.5
53.2
19.0
17.3
13.9
12.1
99.8
97.5
5.1
4.5
Dabur India
Neutral
271
-
47,601
9,370
10,265
17.1
17.2
7.3
8.1
36.9
33.5
11.2
9.1
33.7
30.6
5.0
4.5
GlaxoSmith Con*
Neutral
6,037
-
25,388
4,919
5,742
17.2
17.4
168.3
191.2
35.9
31.6
10.2
8.7
28.8
28.9
4.7
4.0
Godrej Consumer
Neutral
1,238
-
42,141
10,168
12,886
16.1
16.1
32.1
38.4
38.6
32.2
7.8
7.2
19.7
21.0
4.2
3.3
HUL
Neutral
812
-
175,793
34,940
38,957
17.5
17.7
20.8
24.7
39.1
32.9
43.4
34.7
110.5
114.2
4.8
4.3
ITC
Buy
344
409
276,152
41,068
45,068
37.8
37.4
13.9
15.9
24.7
21.6
8.3
7.3
34.1
33.8
6.4
5.8
Marico
Neutral
390
-
25,184
6,551
7,766
15.7
16.0
10.4
12.5
37.6
31.2
10.9
9.1
33.2
32.4
3.8
3.2
Nestle*
Accumulate
6,158
6,646
59,372
11,291
12,847
22.2
22.3
158.9
184.6
38.8
33.4
20.3
18.2
55.0
57.3
5.1
4.4
Tata Global
Accumulate
132
144
8,343
8,635
9,072
9.8
9.9
6.5
7.6
20.4
17.4
2.0
1.9
6.8
7.4
0.9
0.9
IT
HCL Tech^
Buy
830
1,132
116,645
42,038
47,503
23.5
23.5
56.4
62.9
14.7
13.2
3.4
2.6
23.2
19.8
2.4
1.9
Infosys
Buy
1,099
1,306
252,354
60,250
66,999
28.0
28.0
58.3
63.7
18.8
17.3
4.0
3.4
20.9
19.7
3.5
3.0
TCS
Buy
2,597
3,168
511,799
108,420
123,559
28.8
28.7
127.2
143.9
20.4
18.1
8.1
7.6
39.9
41.8
4.3
3.7
Tech Mahindra
Buy
561
646
53,960
25,566
28,890
16.0
17.0
26.3
31.9
21.3
17.6
3.8
3.3
17.9
18.6
1.9
1.6
Wipro
Buy
585
719
144,588
52,414
58,704
23.7
23.8
38.4
42.3
15.2
13.8
3.0
2.7
19.5
18.0
2.3
1.9
Media
D B Corp
Buy
309
356
5,683
2,241
2,495
27.8
27.9
21.8
25.6
14.2
12.1
3.7
3.3
26.7
28.5
2.5
2.2
HT Media
Neutral
85
-
1,968
2,495
2,603
11.2
11.2
7.3
8.6
11.6
9.8
0.9
0.8
7.4
8.1
0.3
0.3
Stock Watch
October 14, 2015
Company Name
Reco
CMP
Target
Mkt Cap
Sales ( Čcr )
OPM(%)
EPS (Č)
PER(x)
P/BV(x)
RoE(%)
EV/Sales(x)
(Č)
Price ( Č)
( Č cr )
FY16E FY17E
FY16E
FY17E
FY16E
FY17E
FY16E
FY17E
FY16E
FY17E
FY16E
FY17E
FY16E
FY17E
Media
Jagran Prakashan
Accumulate
141
156
4,619
1,939
2,122
26.0
26.0
8.3
9.2
17.0
15.4
2.9
2.6
17.5
17.1
2.3
2.1
Sun TV Network
Neutral
366
-
14,435
2,779
3,196
70.2
70.5
22.8
27.3
16.1
13.4
4.0
3.6
26.7
28.3
4.9
4.3
Hindustan Media
Neutral
281
-
2,063
920
1,031
20.0
20.0
19.2
20.9
14.6
13.5
2.4
2.1
16.4
15.3
1.8
1.6
Ventures
Metals & Mining
Coal India
Buy
341
400
215,072
72,015
78,415
21.2
21.5
21.7
25.3
15.7
13.5
5.3
5.2
33.1
39.1
2.2
2.1
Hind. Zinc
Neutral
153
-
64,499
15,258
16,495
44.2
45.6
17.6
19.2
8.7
8.0
1.3
1.2
15.9
15.3
1.9
1.4
Hindalco
Neutral
86
-
17,759
104,356
111,186
8.7
9.5
6.7
11.1
12.8
7.8
0.5
0.4
3.5
5.9
0.7
0.6
JSW Steel
Neutral
918
-
22,189
48,125
53,595
18.8
21.0
46.9
97.5
19.6
9.4
1.0
0.9
4.4
9.5
1.3
1.1
NMDC
Neutral
99
-
39,290
8,237
10,893
46.6
44.5
10.0
11.7
10.0
8.5
1.1
1.0
12.5
13.0
4.6
3.5
SAIL
Neutral
56
-
23,232
45,915
53,954
7.2
10.5
1.5
4.4
37.3
12.9
0.5
0.5
2.3
4.1
1.2
1.0
Vedanta
Neutral
108
-
31,945
71,445
81,910
26.2
26.3
12.9
19.2
8.4
5.6
0.6
0.5
7.2
8.9
0.9
0.7
Tata Steel
Neutral
245
-
23,814
136,805
149,228
11.3
11.9
26.4
36.8
9.3
6.7
0.7
0.7
6.0
8.0
0.7
0.6
Oil & Gas
Cairn India
Neutral
165
-
30,954
11,323
12,490
49.4
51.0
20.7
20.7
8.0
8.0
0.5
0.5
6.4
6.1
1.8
1.1
GAIL
Neutral
315
-
39,976
64,856
70,933
9.1
9.6
24.0
28.9
13.2
10.9
1.1
1.1
8.8
9.6
0.8
0.7
ONGC
Neutral
254
-
217,523
154,564
167,321
36.8
37.4
28.6
32.5
8.9
7.8
1.1
1.0
12.7
13.5
1.6
1.5
Petronet LNG
Accumulate
183
210
13,706
39,007
40,785
3.8
4.2
9.2
11.0
20.0
16.7
2.2
2.0
11.6
12.7
0.4
0.4
Indian Oil Corp
Accumulate
400
455
97,106
359,607
402,760
5.9
6.1
42.5
48.7
9.4
8.2
1.3
1.1
14.1
14.4
0.4
0.3
Reliance Industries
Neutral
893
-
289,046
313,085
362,904
13.1
13.8
78.4
92.9
11.4
9.6
1.2
1.1
10.8
11.6
1.4
1.2
Pharmaceuticals
Alembic Pharma
Neutral
717
-
13,524
2,601
3,115
21.2
20.2
20.8
23.9
34.5
30.0
11.1
8.4
37.2
31.8
5.2
4.3
Aurobindo Pharma
Accumulate
782
872
45,666
14,923
17,162
23.0
23.0
38.2
43.6
20.5
17.9
6.3
4.8
36.0
30.2
3.4
2.9
Aventis*
Neutral
3,958
-
9,115
2,156
2,455
15.1
16.8
109.7
133.9
36.1
29.6
5.0
4.0
18.4
22.5
3.9
3.3
Cadila Healthcare
Neutral
420
-
42,972
10,224
11,840
20.0
21.0
71.0
85.6
5.9
4.9
1.6
1.3
30.1
28.5
4.3
3.6
Cipla
Neutral
678
-
54,475
14,359
16,884
21.3
19.7
28.4
30.5
23.9
22.2
4.2
3.6
19.3
17.5
3.8
3.1
Dr Reddy's
Neutral
4,225
-
72,045
18,213
21,214
22.6
22.7
163.0
192.5
25.9
22.0
5.3
4.4
22.5
20.0
3.9
3.3
Dishman Pharma
Neutral
357
-
2,883
1,716
1,888
20.2
20.2
16.3
21.6
21.9
16.5
2.1
1.8
9.7
11.7
1.9
1.6
GSK Pharma*
Neutral
3,308
-
28,018
2,870
3,158
20.0
22.1
59.5
68.3
55.6
48.4
16.4
16.9
28.5
34.3
9.3
8.5
Indoco Remedies
Neutral
326
-
3,005
1,088
1,262
18.2
18.2
13.1
15.5
24.9
21.0
4.9
4.1
21.2
21.1
2.8
2.4
Ipca labs
Accumulate
736
800
9,281
3,507
4,078
17.6
18.6
25.8
32.0
28.5
23.0
3.7
3.2
13.8
14.9
2.9
2.5
Lupin
Neutral
2,023
-
91,090
14,864
17,244
26.9
26.9
62.1
71.1
32.6
28.5
7.9
6.3
27.4
24.6
5.9
4.9
Sun Pharma
Accumulate
882
950
212,356
28,163
32,610
25.8
30.7
17.4
26.9
50.7
32.8
4.8
4.2
13.0
16.6
7.0
5.8
Stock Watch
October 14, 2015
Company Name
Reco
CMP
Target
Mkt Cap
Sales ( Čcr )
OPM(%)
EPS (Č)
PER(x)
P/BV(x)
RoE(%)
EV/Sales(x)
(Č)
Price ( Č)
( Č cr )
FY16E FY17E
FY16E
FY17E
FY16E
FY17E
FY16E
FY17E
FY16E
FY17E
FY16E
FY17E
FY16E
FY17E
Power
Tata Power
Neutral
70
-
18,973
35,923
37,402
22.6
22.8
4.1
5.2
17.3
13.6
1.3
1.2
7.5
9.3
1.5
1.4
NTPC
Buy
127
157
105,047
87,064
98,846
23.5
23.5
11.7
13.2
10.9
9.7
1.2
1.1
11.4
12.1
2.2
2.0
Power Grid
Buy
133
170
69,449
20,702
23,361
86.7
86.4
12.1
13.2
11.0
10.1
1.6
1.4
15.6
15.1
8.3
7.7
Telecom
Bharti Airtel
Neutral
345
-
138,090
101,748
109,191
32.1
31.7
12.0
12.5
28.8
27.6
2.0
1.9
6.9
6.7
2.0
1.8
Idea Cellular
Neutral
153
-
54,948
34,282
36,941
32.0
31.5
5.9
6.2
25.9
24.6
2.4
2.2
9.9
9.3
2.2
2.1
zOthers
Abbott India
Neutral
5,697
-
12,105
2,715
3,153
14.5
14.1
134.3
152.2
42.4
37.4
10.6
8.7
27.4
25.6
4.2
3.5
Bajaj Electricals
Buy
246
341
2,479
4,719
5,287
5.2
5.8
8.6
12.7
28.7
19.4
3.3
2.9
11.4
14.8
0.5
0.5
Finolex Cables
Neutral
249
-
3,811
2,728
3,036
10.8
11.0
14.4
16.8
17.3
14.9
2.6
2.3
15.2
15.3
1.1
1.0
Goodyear India*
Buy
555
655
1,280
1,953
1,766
12.4
12.0
67.4
59.6
8.2
9.3
2.1
1.7
27.7
20.2
0.4
0.4
Hitachi
Neutral
1,491
-
4,053
1,806
2,112
9.0
9.2
28.6
29.1
52.1
51.3
13.0
10.5
28.1
22.6
2.3
2.0
Jyothy Laboratories
Neutral
315
-
5,711
1,620
1,847
11.5
11.5
7.3
8.5
43.3
37.2
5.6
5.2
13.3
14.4
3.4
2.9
MRF
Accumulate
41,173
43,575
17,462
20,727
14,841
19.3
18.6
4,905.8
3,351.9
8.4
12.3
2.7
2.2
37.6
19.6
0.8
1.1
Page Industries
Neutral
14,327
-
15,981
1,929
2,450
19.8
20.1
229.9
299.0
62.3
47.9
27.5
19.1
52.1
47.1
8.3
6.5
Relaxo Footwears
Neutral
538
-
6,452
1,767
2,152
12.3
12.5
19.3
25.1
27.9
21.5
6.9
5.3
27.7
27.8
3.7
3.0
Siyaram Silk Mills
Buy
975
1,221
914
1,653
1,873
11.7
12.2
99.3
122.1
9.8
8.0
1.8
1.5
19.5
20.2
0.7
0.6
Styrolution ABS India*
Neutral
753
-
1,325
1,271
1,440
8.6
9.2
32.0
41.1
23.5
18.4
2.4
2.2
10.7
12.4
1.0
0.9
Tree House
Buy
292
449
1,235
259
324
56.8
56.8
17.0
21.7
17.2
13.5
1.7
1.6
10.1
11.5
4.7
3.9
TVS Srichakra
Accumulate
2,877
3,210
2,203
2,127
2,388
15.2
14.9
237.7
267.5
12.1
10.8
5.2
3.7
51.7
39.8
1.1
0.9
HSIL
Accumulate
286
302
2,065
2,182
2,404
16.3
16.5
15.8
18.9
18.1
15.1
1.5
1.4
8.4
9.4
1.3
1.1
Kirloskar Engines India
Accumulate
283
297
4,090
2,634
3,252
10.1
12.0
10.9
17.4
25.9
16.2
2.9
2.6
11.4
16.8
1.2
0.9
Ltd
M M Forgings
Buy
542
797
655
563
671
22.1
22.9
51.0
66.5
10.6
8.2
2.2
1.8
23.1
24.1
1.3
1.1
Banco Products (India)
Neutral
141
-
1,007
1,208
1,353
11.0
12.3
10.8
14.5
13.1
9.7
1.5
1.3
11.9
14.5
0.8
0.7
Competent Automobiles Neutral
144
-
88
1,007
1,114
3.1
3.1
23.7
28.2
6.1
5.1
0.9
0.7
13.9
14.6
0.1
0.1
Nilkamal
Neutral
976
-
1,457
1,948
2,147
10.6
10.3
60.0
67.0
16.3
14.6
2.5
2.2
16.8
16.1
0.8
0.7
Visaka Industries
Accumulate
149
166
236
1,158
1,272
8.6
9.5
23.7
32.7
6.3
4.6
0.6
0.6
10.1
12.5
0.4
0.3
Transport Corporation of
Neutral
286
-
2,178
2,830
3,350
8.8
9.0
14.4
18.3
19.9
15.6
3.1
2.7
15.4
17.1
0.9
0.8
India
Elecon Engineering
Buy
73
87
799
1,452
1,596
14.0
14.7
4.4
6.2
16.6
11.8
1.4
1.3
8.6
11.2
0.9
0.7
Surya Roshni
Buy
143
183
629
2,992
3,223
8.3
8.5
14.7
18.3
9.8
7.9
0.9
0.8
9.8
11.0
0.5
0.5
MT Educare
Buy
133
169
531
286
366
18.3
17.7
7.7
9.4
17.3
14.2
3.6
3.2
20.2
21.1
1.8
1.3
Stock Watch
October 14, 2015
Company Name
Reco
CMP
Target Mkt Cap
Sales ( Čcr )
OPM(%)
EPS (Č)
PER(x)
P/BV(x)
RoE(%)
EV/Sales(x)
(Č)
Price ( Č)
( Č cr )
FY16E FY17E FY16E FY17E FY16E FY17E FY16E FY17E FY16E FY17E FY16E FY17E FY16E FY17E
zOthers
Radico Khaitan
Buy
85
112
1,135
1,565
1,687
11.9
12.4
5.4
6.6
15.8
13.0
1.3
1.2
8.0
9.0
1.2
1.2
Garware Wall Ropes
Accumulate
355
390
777
875
983
10.4
10.6
23.1
27.8
15.4
12.8
2.2
1.9
14.1
14.8
0.9
0.8
Wonderla Holidays
Accumulate
301
322
1,703
206
308
44.0
43.6
9.0
12.9
33.5
23.4
4.6
4.2
13.7
17.8
8.2
5.4
Linc Pen & Plastics
Buy
160
185
237
340
371
8.3
8.9
10.8
13.2
14.8
12.1
2.4
2.1
16.0
17.1
0.7
0.7
The Byke Hospitality
Accumulate
161
181
646
222
287
20.5
20.5
5.6
7.6
28.6
21.3
5.4
4.4
18.9
20.8
2.9
2.3
Source: Company, Angel Research; Note: *December year end; #September year end; &October year end; Price as on October 13, 2015
Market Outlook
October 14, 2015
Research Team Tel: 022 - 39357800
DISCLAIMER
Angel Broking Private Limited (hereinafter referred to as “Angel”) is a registered Member of National Stock Exchange of India Limited,
Bombay Stock Exchange Limited and Metropolitian Stock Exchange of India Limited. It is also registered as a Depository Participant with
CDSL and Portfolio Manager with SEBI. It also has registration with AMFI as a Mutual Fund Distributor. Angel Broking Private Limited is a
registered entity with SEBI for Research Analyst in terms of SEBI (Research Analyst) Regulations, 2014 vide registration number
INH000000164. Angel or its associates has not been debarred/ suspended by SEBI or any other regulatory authority for accessing
/dealing in securities Market. Angel or its associates including its relatives/analyst do not hold any financial interest/beneficial ownership
of more than 1% in the company covered by Analyst. Angel or its associates/analyst has not received any compensation / managed or co
-managed public offering of securities of the company covered by Analyst during the past twelve months. Angel/analyst has not served as
an officer, director or employee of company covered by Analyst and has not been engaged in market making activity of the company
covered by Analyst.
This document is solely for the personal information of the recipient, and must not be singularly used as the basis of any investment
decision. Nothing in this document should be construed as investment or financial advice. Each recipient of this document should make
such investigations as they deem necessary to arrive at an independent evaluation of an investment in the securities of the companies
referred to in this document (including the merits and risks involved), and should consult their own advisors to determine the merits and
risks of such an investment.
Reports based on technical and derivative analysis center on studying charts of a stock's price movement, outstanding positions and
trading volume, as opposed to focusing on a company's fundamentals and, as such, may not match with a report on a company's
fundamentals.
The information in this document has been printed on the basis of publicly available information, internal data and other reliable sources
believed to be true, but we do not represent that it is accurate or complete and it should not be relied on as such, as this document is for
general guidance only. Angel Broking Pvt. Limited or any of its affiliates/ group companies shall not be in any way responsible for any
loss or damage that may arise to any person from any inadvertent error in the information contained in this report. Angel Broking Pvt.
Limited has not independently verified all the information contained within this document. Accordingly, we cannot testify, nor make any
representation or warranty, express or implied, to the accuracy, contents or data contained within this document. While Angel Broking
Pvt. Limited endeavors to update on a reasonable basis the information discussed in this material, there may be regulatory, compliance,
or other reasons that prevent us from doing so.
This document is being supplied to you solely for your information, and its contents, information or data may not be reproduced,
redistributed or passed on, directly or indirectly.
Neither Angel Broking Pvt. Limited, nor its directors, employees or affiliates shall be liable for any loss or damage that may arise from or
in connection with the use of this information.
Note: Please refer to the important ‘Stock Holding Disclosure' report on the Angel website (Research Section). Also, please refer to the
latest update on respective stocks for the disclosure status in respect of those stocks. Angel Broking Pvt. Limited and its affiliates may have
investment positions in the stocks recommended in this report.