Market Outlook
August 14, 2015
Dealer’s Diary
Domestic Indices
Chg (%)
(Pts)
(Close)
BSE Sensex
0.1
37
27,550
Indian markets are expected to open positive tracking SGX Nifty.
Nifty
0.1
6
8,356
Dow index closed on flat note, stocks showed a lack of direction throughout the
MID CAP
(0.2)
(26)
11,190
trading session. The choppy trading came as traders seemed reluctant to make
SMALL CAP
(0.8)
(97)
11,568
significant moves following recent volatility.
BSE HC
0.8
139
17,715
BSE PSU
0.2
14
7,319
European stocks recovered from its earlier losses and close on positive note,
with markets in Germany and France trimming steep weekly losses.
BANKEX
0.7
141
20,852
AUTO
0.4
81
19,006
Indian stocks staged a tentative rebound on Thursday as the yuan's fall slowed and
METAL
(2.8)
(218)
7,701
investors cheered better-than-expected domestic data on consumer inflation and
OIL & GAS
(0.0)
(0)
9,428
industrial output. Gains, however, were capped due to persisting weakness in the
BSE IT
(0.1)
(8)
11,561
rupee and concerns over the fate of GST Bill as monsoon session ended without
Global Indices
Chg (%)
(Pts)
(Close)
approving the bill.
Dow Jones
0.0
6
17,408
News & Result Analysis
NASDAQ
(0.2)
(11)
5,034
HCL Technologies wins five-year IT Managed Services Contract with SAI Global
FTSE
(0.0)
(3)
6,568
Result Review: Page Industries, Surya Roshni
Nikkei
1.0
203
20,596
Result Preview: Cipla
Hang Sang
0.4
103
24,019
Refer detailed news & result analysis on the following page
Straits Times
1.0
30
3,092
Markets Today
Shanghai Com
1.8
68
3,955
The trend deciding level for the day is 27,612 / 8,375 levels. If NIFTY trades above
this level during the first half-an-hour of trade then we may witness a further rally up
Indian ADR
Chg (%)
(Pts)
(Close)
to 27,728 - 27,907 / 8,410 - 8,465 levels. However, if NIFTY trades below
INFY
1.0
0.2
$18.0
27,612 / 8,375 levels for the first half-an-hour of trade then it may correct towards
WIT
(1.3)
(0.2)
$12.5
27,434 - 27,317 / 8,321 - 8,285 levels.
IBN
(1.1)
(0.1)
$9.7
Indices
S2
S1
PIVOT
R1
R2
HDB
(0.3)
(0.2)
$62.8
SENSEX
27,317
27,434
27,612
27,728
27,907
NIFTY
8,285
8,321
8,375
8,410
8,465
Advances / Declines
BSE
NSE
Advances
978
450
Net Inflows (August 12, 2015)
Declines
1,891
1,059
` cr
Purch
Sales
Net
MTD
YTD
Unchanged
88
56
FII
3,776
5,571
(1,794)
(459)
140,511
MFs
1,485
949
536
217
58,165
Volumes (` cr)
BSE
3,083
FII Derivatives (August 13, 2015)
NSE
18,194
` cr
Purch
Sales
Net
Open Interest
Index Futures
864
1,100
(236)
14,810
Stock Futures
2,832
2,639
193
50,869
Gainers / Losers
Gainer
Loser
Company
Price (`)
chg (%)
Company
Price (`)
chg (%)
JETAIRWAYS
371
4.3
JINDALSTEL
68
(11.1)
ADANIPORTS
335
4.0
NATIONALUM
33
(9.7)
OBEROIRLTY
242
3.8
RCOM
60
(9.4)
SKSMICRO
527
3.6
VEDL
103
(9.3)
CEATLTD
1,002
3.4
WELCORP
121
(7.5)
Market Outlook
August 14, 2015
HCL Technologies wins five-year IT Managed Services Contract
with SAI Global
HCL Technologies, announced, been appointed as the strategic IT partner to SAI
Global. Under the terms of the five-year partner agreement, HCL Technologies will
provide SAI Global with IT Managed Application Services and Projects. HCL
Technologies was awarded the contract following a competitive tender evaluation
to assist the company in delivering its newly integrated Global Sales and
Marketing capability and the organisation’s Strategic Future Projects. The contract
is expected to save SAI Global around US$27mn. The order win is positive for the
company. We maintain our buy with a price target of `1132.
Result Review
Page Industries (CMP: `14,040/ TP: -/ Upside: -)
Page Industries (Page) reported a good set of numbers on the top-line and
bottom-line front for 1QFY2016. The company's top-line grew by 15.9% yoy to
`438cr. The EBIDTA was higher by 10.8% yoy and came in at `93cr. The EBIDTA
margins declined by 98bp yoy and came in at 21.3%, led by higher other
expenses as a percentage of sales which increased by 212bp yoy to 15.3%.
However, raw material and employee expenses declined by 91bp yoy and 23bp
yoy to 47.9% and 15.6% of sales respectively. The other income during the quarter
increased significantly by 94.9% yoy to `13cr and consequently, PAT grew by
16.4% yoy to `63cr.
On the valuation front, it is currently trading at an expensive P/E multiple of 46.3x
on FY2017E earnings. Hence, on account of higher valuations we recommend a
Neutral rating on the stock.
Y/E
Sales
OPM
PAT EPS ROE P/E P/BV EV/EBITDA EV/Sales
March
(` cr)
(%)
(` cr)
(`)
(%)
(x)
(x)
(x)
(x)
FY2016E
1,945
21.0
265
237.9 56.7 59.0 28.6
38.6
8.1
FY2017E
2,463
21.4
338
303.1 51.0 46.3 20.1
29.9
6.4
Surya Roshni (CMP: `131/ TP: `182/ Upside: 39%)
For 1QFY2016, Surya Roshni reported numbers that were broadly in-line with our
estimates. The top-line for the quarter improved by 8.8% yoy to `731cr which was
in-line with our estimate of `712cr. The raw material cost as a percentage of sales
declined by 77bp yoy to 72.3% of sales while the employee and other expenses
increased by 34bp yoy and 108bp yoy to 6.1% and 14.0% of sales, respectively.
As a result, the EBITDA margin contracted by 65bp yoy to 7.6% which is slightly
lower than our estimate of 8.1%. Interest expense for the quarter declined by
14.3% yoy to `25cr while depreciation and other income remained flat on yoy
basis. Consequently, the net profit increased by 5.3% yoy to `12 cr, vis-à-vis our
expectation of `15cr.
The Lighting division posted robust growth of 22.4% on yoy basis to `318cr. The
Steel division posted volume growth of 11.0% but the same was negated by
declining steel prices resulting in flat steel revenues of `466cr. As for segment
margins, the Lighting division margin contracted by 117bp yoy to 9.7% but they
Market Outlook
August 14, 2015
grew by 32bp on qoq basis. Steel division margins contracted by 80bp yoy to
2.2% but grew by 11bp on qoq basis.
We are positive on the long term prospects of the company considering that it is in
good position to leverage upon its strong dealer network by capitalizing on the
structural shift in the Indian Lighting Industry towards LEDs. Additionally, the
company has started manufacturing square and rectangular Section GI pipes
which are extensively used in civil structures, furniture, frames, etc. and is seeing
positive movement for the same.
At current market price, the stock is trading at 7.2x its FY2017E earnings. We
maintain our Buy recommendation on the stock and have revised our target to
`182.
Y/E
Sales OPM
PAT
EPS ROE P/E P/BV EV/EBITDA EV/Sales
March
(` cr)
(%)
(` cr)
(`)
(%)
(x)
(x)
(x)
(x)
FY2016E
2,992
8.3
64
14.7
9.7
8.9
0.8
5.8
0.5
FY2017E
3,223
8.5
80
18.2
11.0
7.2
0.8
5.2
0.4
Result Preview
Cipla (CMP: `726/ TP: / Upside :)
For 1QFY2016 Cipla is expected to post robust results. On sales front, the
company is expected to post sales of `3390cr V/s `2647cr in 1QFY2015, a yoy
growth of 28.1%. The sales growth is expected to come on account of exports and
domestic markets. On the operating front, the gross margins are expected to come
in at 63.4% V/s 61.3% in 1QFY2015. The OPM consequently, is expected to come
in at 19.5% in 1QFY2016 V/s 17.7% in 1QFY2015. On the net profit front, the
company posted Adj net profit of `420cr V/s `295cr in 1QFY2015, a yoy growth
of 42.5%. We recommend a neutral on the stock.
Y/E
Sales OPM PAT EPS
ROE
P/E
P/BV EV/Sales EV/EBITDA
Mar
(` cr)
(%)
(` cr)
(`)
(%)
(x)
(x)
(x)
(x)
FY2016E
14,051
18.9
2,019
25.1
17.2
28.1
4.6
4.2
22.0
FY2017E
16,515
18.7
2,317
28.9
16.9
25.1
3.9
3.5
18.5
Quarterly Bloomberg Brokers Consensus Estimate
Reliance Capital Ltd Consol - August 14, 2015
Particulars (` cr)
1QFY16E
1QFY15
y-o-y (%)
4QFY15
q-o-q (%)
Net profit
215
164
31.3
407
(47.1)
Power Finance Corp Ltd - August 14, 2015
Particulars (` cr)
1QFY16E
1QFY15
y-o-y (%)
4QFY15
q-o-q (%)
Net sales
2,527
5,918
(57.3)
6,388
(60.4)
EBITDA
2,497
5,866
(57.4)
6,365
(60.8)
EBITDA margin (%)
98.8
99.1
99.6
Net profit
1,615
1,448
11.5
1,561
3.5
Market Outlook
August 14, 2015
Bharat Petroleum Corp Ltd - August 14, 2015
Particulars (` cr)
1QFY16E
1QFY15
y-o-y (%)
4QFY15
q-o-q (%)
Net sales
54,532
66,750
(18.3)
51,304
6.3
EBITDA
2,639
1,520
73.6
4,496
(41.3)
EBITDA margin (%)
4.8
2.3
8.8
Net profit
1,573
1,216
29.3
2,853
(44.9)
Steel Authority of India Ltd - August 14, 2015
Particulars (` cr)
1QFY16E
1QFY15
y-o-y (%)
4QFY15
q-o-q (%)
Net sales
10,150
11,196
(9.3)
11,469
(11.5)
EBITDA
638
1,130
(43.5)
930
(31.3)
EBITDA margin (%)
6.3
10.1
8.1
Net profit
(63)
530
0.0
334
0.0
Cipla Ltd/India - August 14, 2015
Particulars (` cr)
1QFY16E
1QFY15
y-o-y (%)
4QFY15
q-o-q (%)
Net sales
2,783
2,402
15.9
2,607
6.7
EBITDA
544
533
2.2
393
38.4
EBITDA margin (%)
19.6
22.2
15.1
Net profit
300
332
(9.6)
214
40.4
Hindalco Industries Ltd - August 14, 2015
Particulars (` cr)
1QFY16E
1QFY15
y-o-y (%)
4QFY15
q-o-q (%)
Net sales
9,055
7,931
14.2
9,219
(1.8)
EBITDA
711
748
(5.0)
848
(16.1)
EBITDA margin (%)
7.9
9.4
9.2
Net profit
162
328
(50.6)
160
1.5
Economic and Political News
Chinese devaluation could worsen local textile sector woes
Coal mine auction restarts; ACC, Jaypee Cement in race
Consumer demand for gold in India drops 25% in Q2
Corporate News
Ashok Leyland to set up assembling facility in African countries
Symphony Ltd acquires Chinese air cooler company
GVK likely to raise `4,000 crore for the airport vertical
Market Outlook
August 14, 2015
Top Picks
Large Cap
Market
CMP
Target
Upside
Company
Sector
Rating
Cap (` Cr)
(`)
(`)
(%)
Axis Bank
Financials
1,34,635
Buy
567
716
26.4
ICICI Bank
Financials
1,69,419
Buy
292
370
26.8
Inox Wind
Capital Goods
8,315
Buy
375
505
34.8
LIC Housing Fin. Financials
24,802
Buy
491
590
20.1
Power Grid
Power
72,144
Buy
138
170
23.3
TCS
IT
5,16,595
Buy
2,637
3,168
20.1
Tech Mahindra IT
52,941
Buy
550
646
17.4
Yes Bank
Financials
31,941
Buy
764
989
29.5
Infosys
IT
2,65,722 Accumulate
1,157
1,306
12.9
Sun Pharma
Pharmaceuticals
2,11,526 Accumulate
879
950
8.1
Source: Angel Research, Bloomberg
Mid Cap
Market
CMP
Target
Upside
Company
Sector
Rating
Cap (` Cr)
(`)
(`)
(%)
Bajaj Electricals
Others
2,629
Buy
261
341
30.8
Garware Wall Ropes Others
633
Buy
289
390
34.9
Hindustan Media
Media
1,754
Buy
239
292
22.2
JK Tyre
Auto Ancillary
2,345
Buy
103
147
42.2
MBL Infrastructures
Construction
989
Buy
239
395
65.4
Radico Khaitan
Others
1,224
Buy
92
112
21.7
Surya Roshni
Others
577
Buy
132
193
46.5
Minda Industries
Auto Ancillary
933
Buy
588
652
10.8
MT Educare
Others
496 Accumulate
125
141
13.2
Source: Angel Research, Bloomberg
Market Outlook
August 14, 2015
Result Calendar
Date
Company
Amara Raja Batteries, Power Fin.Corpn., Reliance Capital, SAIL, Hindalco, Bhushan Steel, Monnet Ispat, BPCL,
August 14, 2015
Cravatex, Elecon Engineering, Cipla, GIPCL
Source: Bloomberg, Angel Research
Global economic events release calendar
Date
Time
Country Event Description
Unit
Period
Bloomberg Data
Last Reported Estimated
August 14, 2015
India
Imports YoY%
% Change
Jul
(13.40)
--
India
Exports YoY%
% Change
Jul
(15.80)
--
2:30PM Euro Zone Euro-Zone CPI (YoY)
%
Jul F
0.20
0.20
6:45PM US
Industrial Production
%
Jul
0.23
0.30
12:00PM India
Monthly Wholesale Prices YoY%
% Change
Jul
(2.40)
(2.90)
2:30PM Euro Zone Euro-Zone GDP s.a. (QoQ)
% Change
2Q A
0.40
0.40
11:30AM Germany GDP nsa (YoY)
% Change
2Q P
1.10
1.60
August 18, 2015
6:00PM US
Building permits
Thousands
Jul
1,337.00
1,217.00
6:00PM US
Housing Starts
Thousands
Jul
1,174.00
1,190.00
2:00PM UK
CPI (YoY)
% Change
Jul
--
--
August 19, 2015
6:00PM US
Consumer price index (mom)
% Change
Jul
0.30
0.10
August 20, 2015
7:30PM US
Existing home sales
Million
Jul
5.49
5.41
August 21, 2015
7:30PM Euro Zone Euro-Zone Consumer Confidence
Value
Aug A
(7.10)
--
August 24, 2015
1:00PM Germany PMI Services
Value
Aug P
53.80
--
1:00PM Germany PMI Manufacturing
Value
Aug P
51.80
--
August 25, 2015
7:30PM US
New home sales
Thousands
Jul
482.00
--
7:30PM US
Consumer Confidence
S.A./ 1985=100
Aug
90.91
--
August 27, 2015
6:00PM US
GDP Qoq (Annualised)
% Change
2Q S
2.30
--
August 28, 2015
2:00PM UK
GDP (YoY)
% Change
2Q P
2.60
--
September 1, 2015
1:25PM Germany Unemployment change (000's)
Thousands
Aug
9.00
--
6:30AM China PMI Manufacturing
Value
Aug
50.00
--
2:00PM UK
PMI Manufacturing
Value
Aug
51.90
--
September 3, 2015
5:15PM Euro Zone ECB announces interest rates
%
Sep 3
0.05
--
Source: Bloomberg, Angel Research
Market Outlook
August 14, 2015
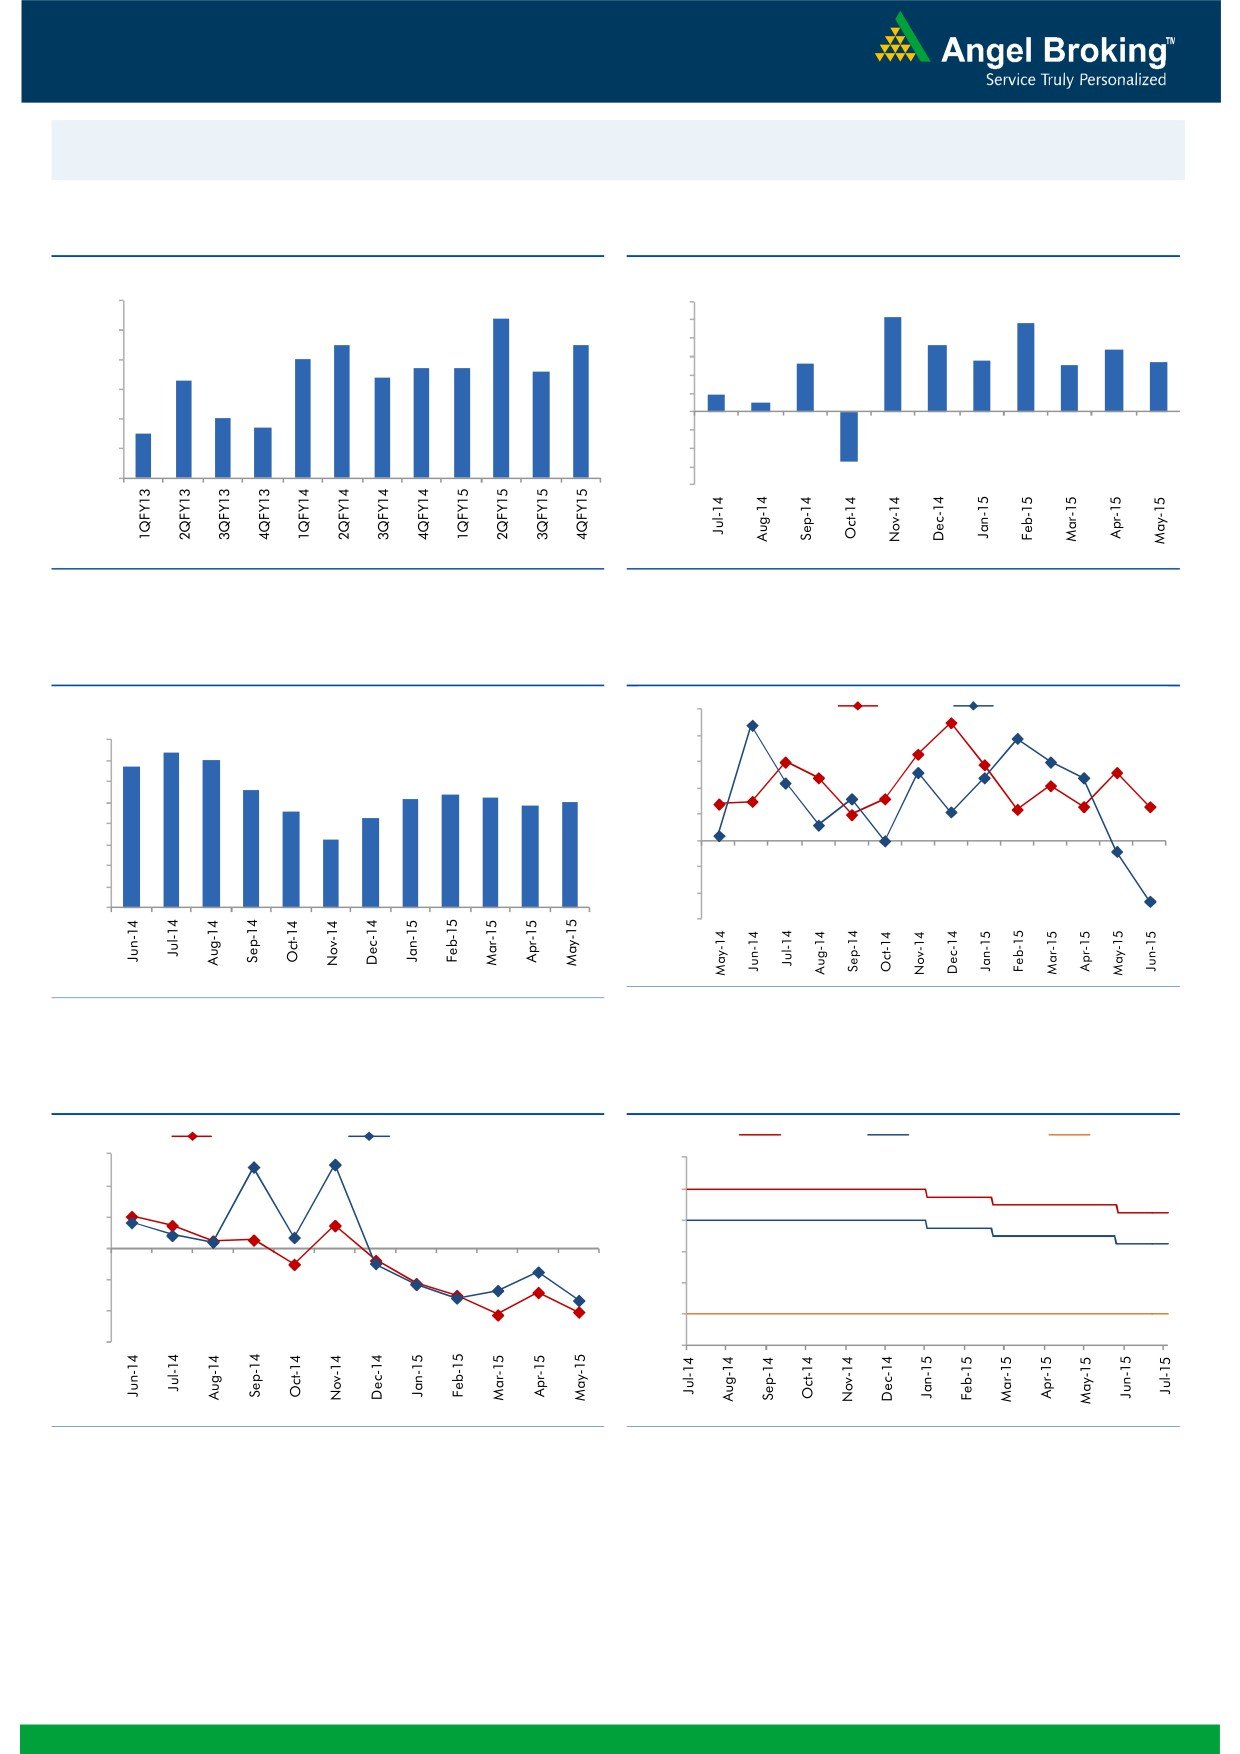
Macro watch
Exhibit 1: Quarterly GDP trends
Exhibit 2: IIP trends
(%)
(%)
9.0
8.4
6.0
5.2
4.8
5.0
8.0
7.5
7.5
3.6
4.0
3.4
7.0
2.8
2.7
6.7
6.7
6.6
2.6
2.5
7.0
6.3
6.4
3.0
2.0
0.9
6.0
0.5
1.0
5.0
4.7
-
5.0
4.5
(1.0)
4.0
(2.0)
(3.0)
3.0
(2.7)
(4.0)
Source: CSO, Angel Research
Source: MOSPI, Angel Research
Exhibit 3: Monthly CPI inflation trends
Exhibit 4: Manufacturing and services PMI
(%)
55.0
Mfg. PMI
Services PMI
8.0
7.4
54.0
7.0
6.8
7.0
53.0
5.6
5.2
5.4
5.3
6.0
4.9
5.0
52.0
4.6
5.0
4.3
51.0
4.0
3.3
3.0
50.0
2.0
49.0
1.0
48.0
-
47.0
Source: Market, Angel Research; Note: Level above 50 indicates expansion
Source: MOSPI, Angel Research
Exhibit 5: Exports and imports growth trends
Exhibit 6: Key policy rates
(%)
Exports yoy growth
Imports yoy growth
(%)
Repo rate
Reverse Repo rate
CRR
30.0
9.00
20.0
8.00
10.0
7.00
0.0
6.00
(10.0)
5.00
(20.0)
4.00
(30.0)
3.00
Source: Bloomberg, Angel Research
Source: RBI, Angel Research
Market Outlook
August 14, 2015
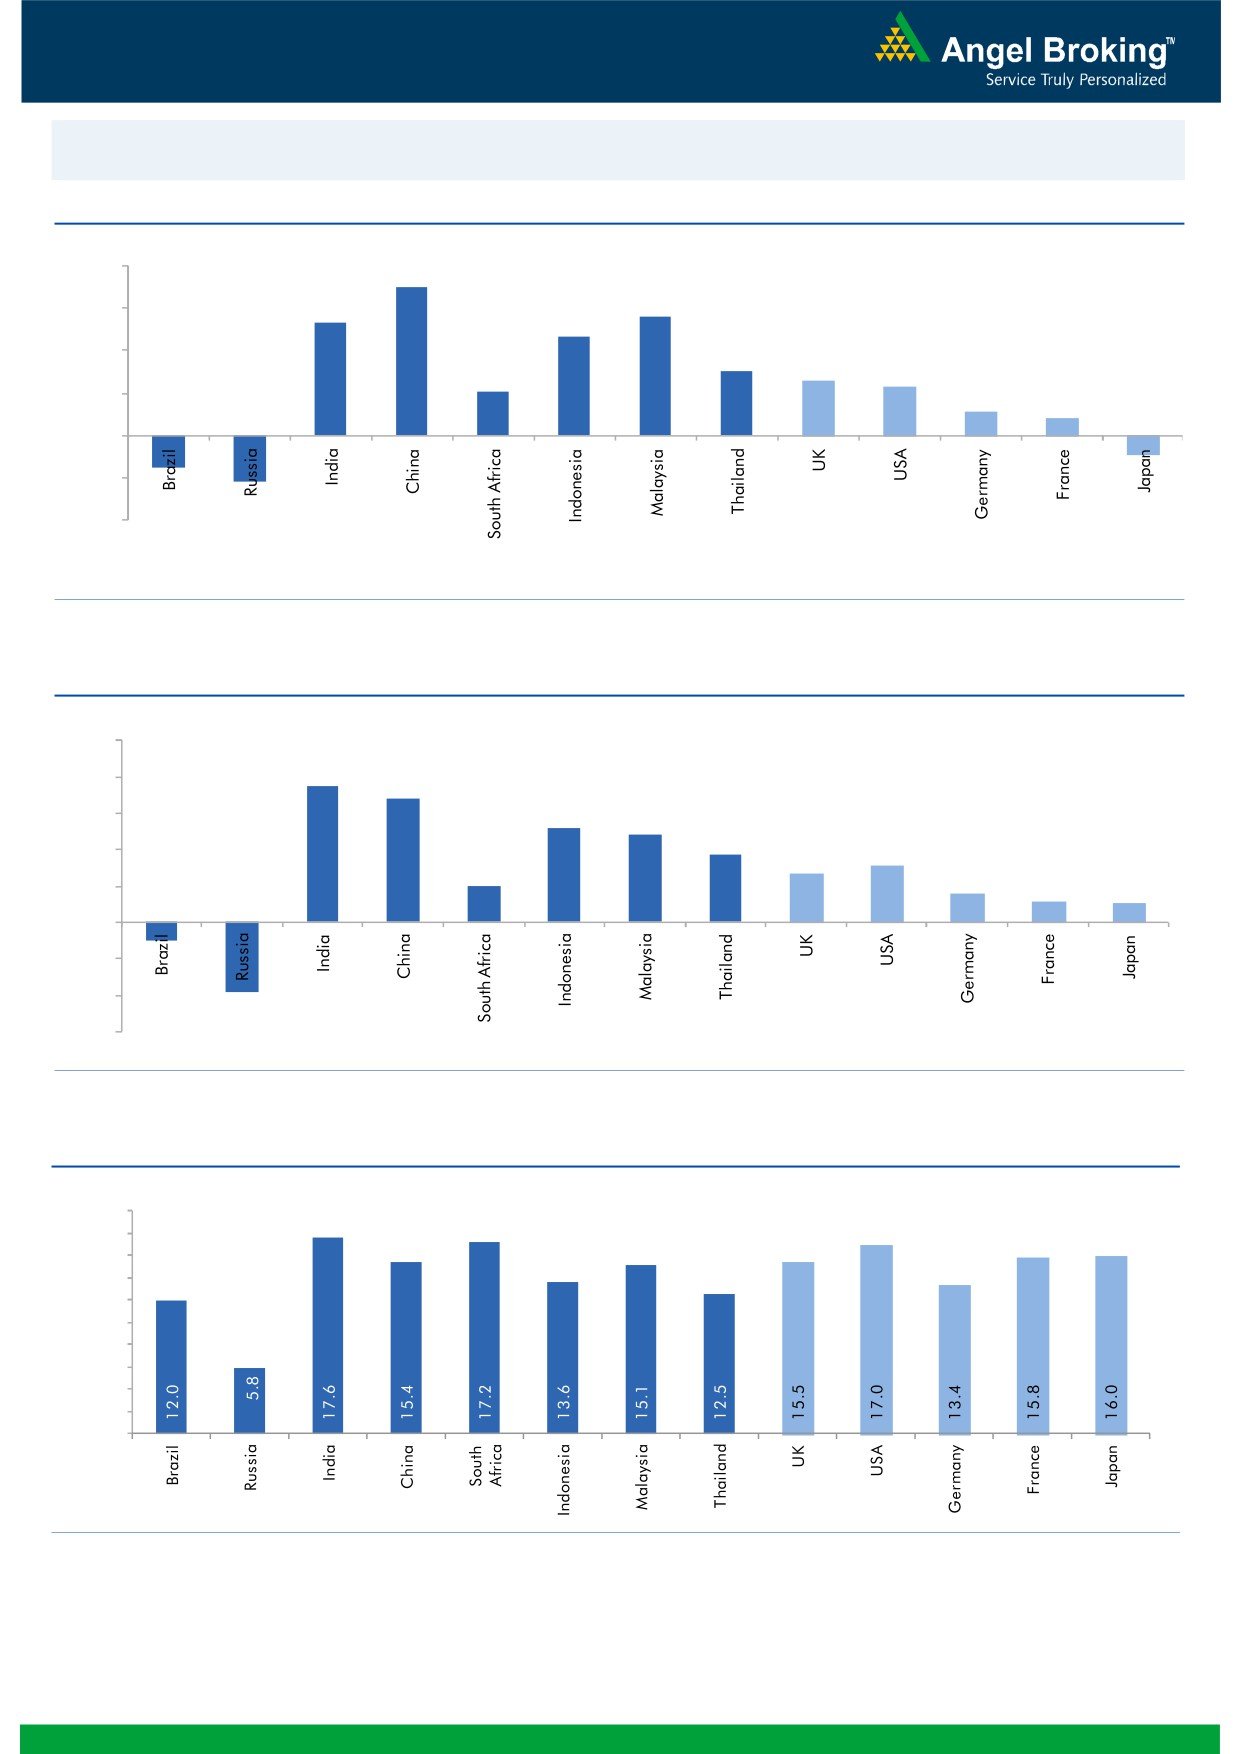
Global watch
Exhibit 1: Latest quarterly GDP Growth (%, yoy) across select developing and developed countries
(%)
8.0
7.0
5.6
6.0
5.3
4.7
4.0
3.0
2.6
2.1
2.3
2.0
1.1
0.8
(1.6)
(2.2)
(0.9)
-
(2.0)
(4.0)
Source: Bloomberg, Angel Research
Exhibit 2: 2015 GDP Growth projection by IMF (%, yoy) across select developing and developed countries
(%)
10.0
7.5
8.0
6.8
6.0
5.2
4.8
3.7
4.0
3.1
2.7
2.0
1.6
2.0
1.2
1.0
(1.0)
(3.8)
-
(2.0)
(4.0)
(6.0)
Source: IMF, Angel Research
Exhibit 3: One year forward P-E ratio across select developing and developed countries
(x)
20.0
18.0
16.0
14.0
12.0
10.0
8.0
6.0
4.0
2.0
-
Source: Bloomberg, Angel Research
Market Outlook
August 14, 2015
Exhibit 4: Relative performance of indices across globe
Returns (%)
Country
Name of index
Closing price
1M
3M
1YR
Brazil
Bovespa
48,010
(4.1)
(12.4)
(11.7)
Russia
Micex
1,704
3.8
(2.3)
23.4
India
Nifty
8,356
0.9
4.8
10.8
China
Shanghai Composite
3,955
6.1
(11.5)
70.6
South Africa
Top 40
45,878
5.8
(0.6)
2.2
Mexico
Mexbol
43,871
(0.2)
(0.5)
1.1
Indonesia
LQ45
775
(4.0)
(6.2)
(7.2)
Malaysia
KLCI
1,622
(1.9)
(7.0)
(10.4)
Thailand
SET 50
919
(3.2)
(6.8)
(9.4)
USA
Dow Jones
17,408
(2.0)
(2.4)
6.4
UK
FTSE
6,568
4.9
(2.0)
2.7
Japan
Nikkei
20,596
1.2
6.4
31.8
Germany
DAX
11,015
8.5
1.6
26.9
France
CAC
4,987
12.8
2.0
24.7
Source: Bloomberg, Angel Research
Market Outlook
August 14, 2015
Stock Watch
Company Name
Reco
CMP
Target
Mkt Cap
Sales ( Čcr )
OPM(%)
EPS (Č)
PER(x)
P/BV(x)
RoE(%)
EV/Sales(x)
(Č)
Price ( Č)
( Č cr )
FY16E FY17E
FY16E
FY17E
FY16E
FY17E
FY16E
FY17E
FY16E
FY17E
FY16E
FY17E
FY16E
FY17E
Agri / Agri Chemical
Rallis
Neutral
226
-
4,385
2,075
2,394
14.4
14.4
9.5
11.0
23.7
20.5
4.7
4.1
21.1
21.3
2.2
1.9
United Phosphorus
Neutral
552
-
23,661
13,698
15,752
17.6
17.6
32.1
38.5
17.2
14.3
3.4
2.8
21.4
21.3
1.8
1.5
Auto & Auto Ancillary
Ashok Leyland
Neutral
88
-
25,172
17,394
20,318
9.6
10.7
2.8
4.4
31.6
20.1
4.4
4.1
14.3
20.4
1.4
1.2
Bajaj Auto
Neutral
2,489
-
72,025
23,842
27,264
19.8
19.6
128.4
144.4
19.4
17.2
5.9
5.1
30.5
29.5
2.6
2.2
Eicher Motors
Accumulate
19,903
21,843
54,021
11,681
15,550
15.3
16.9
358.5
564.3
55.5
35.3
16.7
12.4
29.8
34.9
4.5
3.4
Hero Motocorp
Neutral
2,644
-
52,794
28,500
33,028
13.8
14.1
144.2
166.3
18.3
15.9
6.7
5.7
36.7
36.0
1.7
1.4
L G Balakrishnan & Bros Neutral
465
-
730
1,254
1,394
11.6
11.8
35.9
41.7
13.0
11.2
1.8
1.6
13.5
13.8
0.7
0.6
Mahindra and Mahindra Accumulate
1,340
1,493
83,245
40,088
45,176
13.8
14.0
59.6
70.4
22.5
19.0
3.7
3.3
16.6
17.2
1.7
1.5
Maruti
Accumulate
4,490
4,735
135,625
58,102
68,587
16.7
16.9
182.0
225.5
24.7
19.9
4.9
4.2
19.9
21.0
2.1
1.7
Minda Industries
Buy
588
652
933
2,567
2,965
7.3
8.0
38.8
54.3
15.2
10.8
2.2
1.8
14.4
16.8
0.5
0.4
Rane Brake Lining
Buy
307
366
243
454
511
11.1
11.4
23.8
28.1
12.9
10.9
1.8
1.7
14.2
15.3
0.7
0.6
Setco Automotive
Neutral
232
-
620
594
741
12.7
13.7
8.4
15.9
27.6
14.6
2.9
2.5
10.4
17.0
1.5
1.2
Tata Motors
Buy
349
455
100,879
267,464
311,225
13.7
13.7
34.6
41.8
10.1
8.4
1.3
1.1
13.2
13.9
0.6
0.5
TVS Motor
Accumulate
226
255
10,716
11,839
13,985
7.0
8.0
10.8
15.9
20.9
14.2
5.3
4.2
25.5
29.7
0.9
0.7
Amara Raja Batteries
Neutral
938
-
16,015
5,355
6,641
17.4
17.8
31.8
40.9
29.5
22.9
7.4
5.9
25.2
25.5
2.9
2.3
Exide Industries
Neutral
156
-
13,230
7,363
8,247
13.7
14.5
6.6
7.7
23.6
20.2
3.0
2.7
12.6
13.3
1.5
1.4
Apollo Tyres
Neutral
187
-
9,539
12,428
13,262
16.8
16.4
21.9
21.1
8.6
8.9
1.5
1.3
17.0
14.1
0.8
0.9
Ceat
Accumulate
1,002
1,059
4,052
6,041
6,770
14.3
13.9
101.5
117.7
9.9
8.5
2.0
1.6
20.0
19.2
0.8
0.7
JK Tyres
Buy
103
147
2,345
7,446
7,942
15.2
14.7
19.6
21.0
5.3
4.9
1.3
1.1
25.2
21.7
0.7
0.6
Swaraj Engines
Neutral
957
-
1,189
593
677
14.5
14.8
51.2
60.8
18.7
15.8
4.4
3.9
23.3
24.8
1.9
1.6
Subros
Neutral
87
-
524
1,268
1,488
11.6
11.9
3.7
6.6
23.6
13.2
1.6
1.4
6.8
11.4
0.7
0.6
Indag Rubber
Buy
200
247
525
283
329
17.0
17.2
13.0
15.4
15.4
13.0
3.4
2.8
21.8
21.6
1.6
1.3
Capital Goods
ACE
Buy
44
54
439
660
839
4.7
8.2
1.0
3.9
44.4
11.4
1.4
1.2
3.2
11.3
0.8
0.6
BEML
Buy
1,377
1,607
5,734
3,277
4,006
6.0
8.9
29.2
64.3
47.2
21.4
2.6
2.4
5.7
11.7
1.8
1.5
BGR Energy
Neutral
129
-
931
3,615
3,181
9.5
9.4
16.7
12.4
7.7
10.4
0.7
0.7
10.0
7.0
0.7
0.8
BHEL
Neutral
258
-
63,222
33,722
35,272
10.8
11.7
10.5
14.2
24.6
18.2
1.8
1.7
7.0
9.0
2.0
1.9
Blue Star
Neutral
371
-
3,338
3,649
4,209
5.0
5.9
9.2
14.7
40.6
25.2
7.3
6.9
9.1
17.5
1.0
0.9
Crompton Greaves
Accumulate
183
204
11,476
13,484
14,687
4.9
6.2
4.5
7.1
40.7
25.8
2.9
2.7
7.2
10.8
1.0
0.9
Inox Wind
Buy
375
505
8,315
4,980
5,943
17.0
17.5
26.6
31.6
14.1
11.9
4.2
3.1
35.0
30.0
1.8
1.5
Market Outlook
August 14, 2015
Stock Watch
Company Name
Reco
CMP
Target
Mkt Cap
Sales ( Čcr )
OPM(%)
EPS (Č)
PER(x)
P/BV(x)
RoE(%)
EV/Sales(x)
(Č)
Price ( Č)
( Č cr )
FY16E
FY17E
FY16E
FY17E
FY16E
FY17E
FY16E
FY17E
FY16E
FY17E
FY16E
FY17E
FY16E
FY17E
Capital Goods
KEC International
Neutral
138
-
3,557
8,791
9,716
6.1
6.8
5.4
8.2
25.6
16.9
2.6
2.3
10.0
14.0
0.6
0.6
Thermax
Neutral
1,018
-
12,127
6,413
7,525
7.4
8.5
30.5
39.3
33.4
25.9
5.1
4.5
15.0
17.0
1.9
1.5
Cement
ACC
Accumulate
1,364
1,548
25,610
11,856
14,092
14.5
17.8
47.6
76.1
28.7
17.9
2.9
2.7
10.6
15.7
2.0
1.6
Ambuja Cements
Neutral
222
-
34,460
10,569
12,022
20.7
22.2
8.7
10.7
25.5
20.8
3.2
3.1
13.0
15.2
2.9
2.5
India Cements
Buy
81
132
2,502
4,716
5,133
14.9
15.8
1.0
4.5
81.5
18.1
0.8
0.8
1.0
4.5
0.9
0.8
JK Cement
Buy
621
767
4,341
4,056
4,748
14.5
17.0
22.6
41.1
27.5
15.1
2.5
2.2
9.3
15.3
1.5
1.2
J K Lakshmi Cement
Buy
343
443
4,034
3,004
3,618
17.6
19.9
13.9
27.2
24.7
12.6
2.8
2.4
11.8
20.5
1.7
1.4
Mangalam Cements
Buy
227
349
605
1,111
1,336
12.2
15.1
16.3
34.6
13.9
6.6
1.1
1.0
8.2
16.0
0.8
0.6
Orient Cement
Accumulate
166
183
3,391
1,854
2,524
21.2
22.2
7.7
11.1
21.5
14.9
3.1
2.7
13.3
15.7
2.6
1.8
Ramco Cements
Accumulate
331
350
7,874
4,036
4,545
20.8
21.3
15.1
18.8
21.9
17.6
2.7
2.4
12.9
14.3
2.5
2.1
Shree Cement^
Neutral
11,005
-
38,339
7,150
8,742
26.7
28.6
228.0
345.5
48.3
31.9
7.1
6.0
15.7
20.3
5.1
4.1
UltraTech Cement
Accumulate
3,071
3,282
84,273
27,562
31,548
20.4
22.3
111.9
143.3
27.5
21.4
3.9
3.4
15.2
16.8
3.1
2.7
Construction
ITNL
Accumulate
121
130
2,979
7,360
8,825
34.0
35.9
1.0
5.0
120.8
24.2
0.5
0.5
0.3
1.4
3.8
3.7
KNR Constructions
Accumulate
562
582
1,484
915
1,479
14.3
13.9
20.3
37.2
27.7
15.1
2.5
2.2
9.6
15.6
1.7
1.1
Larsen & Toubro
Accumulate
1,761
2,013
163,845
68,920
82,446
10.9
11.5
57.0
73.0
30.9
24.1
2.8
2.6
13.6
15.5
2.6
2.2
Gujarat Pipavav Port
Buy
203
237
9,828
740
843
53.1
53.6
8.0
10.0
25.4
20.3
4.0
3.2
20.4
19.4
12.8
10.9
MBL Infrastructures
Buy
239
395
989
2,507
2,986
12.4
14.4
21.5
20.5
11.1
11.6
1.3
1.2
12.6
12.7
1.2
1.0
PNC Infratech
Buy
445
522
2,285
1,798
2,132
13.2
13.5
22.0
30.0
20.2
14.8
1.8
1.6
11.5
11.4
1.4
1.2
Financials
Allahabad Bank
Neutral
86
-
4,905
8,859
9,817
3.0
3.0
23.7
30.1
3.6
2.9
0.4
0.4
10.6
12.3
-
-
Axis Bank
Buy
567
716
134,635
26,522
31,625
3.6
3.6
36.2
45.4
15.7
12.5
3.1
2.7
18.2
19.6
-
-
Bank of Baroda
Neutral
177
-
39,099
18,934
21,374
2.0
2.0
13.2
15.1
13.4
11.7
1.0
0.9
7.1
7.7
-
-
Bank of India
Neutral
158
-
10,492
17,402
20,003
2.0
2.1
40.3
50.7
3.9
3.1
0.4
0.3
9.0
10.4
-
-
Canara Bank
Neutral
289
-
14,874
15,805
17,745
2.0
2.2
64.3
73.5
4.5
3.9
0.5
0.5
10.8
11.3
-
-
Dena Bank
Neutral
43
-
2,419
3,580
4,040
2.1
2.2
8.4
10.9
5.2
4.0
0.5
0.4
6.8
8.4
-
-
Federal Bank
Neutral
65
-
11,061
3,522
4,045
3.2
3.2
12.2
14.1
5.3
4.6
0.7
0.6
12.9
13.4
-
-
HDFC
Accumulate
1,257
1,343
198,159
11,198
13,321
3.5
3.5
45.1
53.7
27.9
23.4
5.8
5.2
27.2
28.2
-
-
HDFC Bank
Buy
1,076
1,255
270,593
38,629
47,500
4.5
4.7
52.6
66.4
20.5
16.2
3.7
3.2
19.6
21.2
-
-
ICICI Bank
Buy
292
370
169,419
36,037
41,647
3.5
3.6
22.9
26.7
12.7
10.9
2.1
1.9
15.7
15.9
-
-
IDBI Bank
Neutral
63
-
10,057
9,806
11,371
1.7
1.9
10.0
16.3
6.3
3.9
0.5
0.4
6.8
10.4
-
-
Market Outlook
August 14, 2015
Stock Watch
Company Name
Reco
CMP
Target
Mkt Cap
Sales ( Čcr )
OPM(%)
EPS (Č)
PER(x)
P/BV(x)
RoE(%)
EV/Sales(x)
(Č)
Price ( Č)
( Č cr )
FY16E FY17E
FY16E
FY17E
FY16E
FY17E
FY16E
FY17E
FY16E
FY17E
FY16E
FY17E
FY16E
FY17E
Financials
Indian Bank
Neutral
141
-
6,770
6,454
7,321
2.5
2.6
26.4
33.3
5.4
4.2
0.5
0.4
8.1
9.6
-
-
LIC Housing Finance
Buy
491
590
24,802
2,934
3,511
2.3
2.3
30.9
36.8
15.9
13.4
2.6
2.2
16.8
17.5
-
-
Oriental Bank
Neutral
159
-
4,756
7,930
8,852
2.5
2.5
51.8
57.1
3.1
2.8
0.4
0.3
9.3
9.5
-
-
Punjab Natl.Bank
Neutral
153
-
28,347
24,160
27,777
2.9
3.0
18.5
24.6
8.3
6.2
0.8
0.7
8.8
10.8
-
-
South Ind.Bank
Neutral
23
-
3,051
1,999
2,249
2.4
2.4
3.5
4.0
6.5
5.6
0.8
0.7
12.6
13.1
-
-
St Bk of India
Accumulate
259
285
196,268
86,900
100,550
3.1
3.1
22.1
27.7
11.8
9.4
1.5
1.3
12.7
14.3
-
-
Union Bank
Neutral
197
-
12,518
12,995
14,782
2.4
2.4
32.3
40.9
6.1
4.8
0.7
0.6
10.7
12.3
-
-
Vijaya Bank
Neutral
38
-
3,265
3,474
3,932
1.8
1.9
5.9
7.2
6.5
5.3
0.6
0.5
8.1
9.3
-
-
Yes Bank
Buy
764
989
31,941
7,006
8,825
3.1
3.3
61.4
77.1
12.4
9.9
2.3
1.9
20.1
21.3
-
-
FMCG
Asian Paints
Neutral
874
-
83,843
16,553
19,160
16.0
16.2
17.7
21.5
49.5
40.7
13.1
11.8
29.4
31.2
4.9
4.2
Britannia
Neutral
3,397
-
40,758
8,065
9,395
9.6
10.2
47.2
65.5
72.0
51.9
23.9
22.6
38.3
41.2
4.9
4.2
Colgate
Neutral
1,994
-
27,118
4,836
5,490
19.5
19.7
48.5
53.2
41.1
37.5
30.1
26.2
99.8
97.5
5.5
4.8
Dabur India
Neutral
292
-
51,352
9,370
10,265
17.1
17.2
7.3
8.1
39.9
36.1
12.0
9.8
33.7
30.6
5.4
4.9
GlaxoSmith Con*
Neutral
6,310
-
26,537
4,919
5,742
17.2
17.4
168.3
191.2
37.5
33.0
10.6
9.1
28.8
28.9
5.0
4.2
Godrej Consumer
Neutral
1,298
-
44,201
10,168
12,886
16.1
16.1
32.1
38.4
40.4
33.8
8.2
7.6
19.7
21.0
4.4
3.5
HUL
Neutral
868
-
187,776
34,940
38,957
17.5
17.7
20.8
24.7
41.7
35.1
46.4
37.1
110.5
114.2
5.2
4.6
ITC
Buy
316
409
253,822
41,068
45,068
37.8
37.4
13.9
15.9
22.7
19.9
7.6
6.7
34.1
33.8
5.8
5.3
Marico
Neutral
422
-
27,197
6,551
7,766
15.7
16.0
10.4
12.5
40.6
33.7
11.8
9.8
33.2
32.4
4.1
3.4
Nestle*
Neutral
6,357
-
61,289
11,291
12,847
22.2
22.3
158.9
184.6
40.0
34.4
20.9
18.8
55.0
57.3
5.3
4.6
Tata Global
Buy
130
152
8,198
8,635
9,072
9.8
9.9
6.5
7.6
20.0
17.1
2.0
1.9
6.8
7.4
0.9
0.8
IT
HCL Tech^
Buy
966
1,132
135,747
42,038
47,503
23.5
23.5
56.4
62.9
17.1
15.4
4.0
3.0
23.2
19.8
2.8
2.3
Infosys
Accumulate
1,157
1,306
265,722
60,250
66,999
28.0
28.0
58.3
63.7
19.8
18.2
4.2
3.6
20.9
19.7
3.7
3.2
TCS
Buy
2,637
3,168
516,595
108,420
123,559
28.8
28.7
127.2
143.9
20.7
18.3
8.3
7.7
39.9
41.8
4.4
3.8
Tech Mahindra
Buy
550
646
52,941
25,566
28,890
16.0
17.0
26.3
31.9
20.9
17.3
3.8
3.2
17.9
18.6
1.8
1.6
Wipro
Buy
571
719
140,975
52,414
58,704
23.7
23.8
38.4
42.3
14.9
13.5
2.9
2.6
19.5
18.0
2.3
1.9
Media
D B Corp
Accumulate
326
356
5,989
2,241
2,495
27.8
27.9
21.8
25.6
15.0
12.7
3.9
3.5
26.7
28.5
2.6
2.3
HT Media
Neutral
84
-
1,955
2,495
2,603
11.2
11.2
7.3
8.6
11.5
9.8
0.9
0.8
7.4
8.1
0.3
0.3
Jagran Prakashan
Accumulate
137
156
4,485
1,939
2,122
26.0
26.0
8.3
9.2
16.5
14.9
2.8
2.6
17.5
17.1
2.3
2.1
Sun TV Network
Neutral
332
-
13,080
2,779
3,196
70.2
70.5
22.8
27.3
14.6
12.2
3.6
3.2
26.7
28.3
4.5
3.9
Market Outlook
August 14, 2015
Stock Watch
Company Name
Reco
CMP
Target
Mkt Cap
Sales ( Čcr )
OPM(%)
EPS (Č)
PER(x)
P/BV(x)
RoE(%)
EV/Sales(x)
(Č)
Price ( Č)
( Č cr )
FY16E FY17E
FY16E
FY17E
FY16E
FY17E
FY16E
FY17E
FY16E
FY17E
FY16E
FY17E
FY16E
FY17E
Media
Hindustan Media
Buy
239
292
1,754
920
1,031
20.0
20.0
19.2
20.9
12.5
11.5
2.0
1.8
16.4
15.3
1.4
1.3
Ventures
Metals & Mining
Coal India
Buy
377
450
238,190
77,595
89,628
22.9
24.4
27.6
30.0
13.7
12.6
5.9
5.9
33.9
33.2
2.4
2.1
Hind. Zinc
Neutral
145
-
61,077
15,546
16,821
47.5
49.0
19.7
20.3
7.3
7.1
1.2
1.1
17.2
16.6
1.7
1.2
Hindalco
Neutral
91
-
18,771
112,328
119,817
7.7
7.9
16.3
20.1
5.6
4.5
0.4
0.4
8.0
8.5
0.6
0.5
JSW Steel
Neutral
857
-
20,706
48,125
53,595
18.8
21.0
46.9
97.5
18.3
8.8
0.9
0.8
4.4
9.5
1.2
1.1
NMDC
Neutral
97
-
38,517
12,544
13,330
59.5
59.7
16.3
16.5
6.0
5.9
1.1
1.0
5.1
9.9
1.8
1.8
SAIL
Neutral
56
-
23,170
56,365
63,383
6.9
8.0
7.1
8.2
7.9
6.9
0.5
0.5
7.0
7.1
1.0
0.9
Vedanta
Neutral
103
-
30,655
81,842
88,430
30.6
32.8
20.2
25.7
5.1
4.0
0.4
0.3
7.5
8.5
0.8
0.6
Tata Steel
Neutral
234
-
22,688
136,805
149,228
11.3
11.9
26.4
36.8
8.9
6.4
0.7
0.7
6.0
8.0
0.7
0.6
Oil & Gas
Cairn India
Neutral
154
-
28,957
12,617
14,513
33.7
40.0
25.5
27.7
6.1
5.6
0.5
0.4
7.4
7.7
1.0
0.8
GAIL
Neutral
333
-
42,183
75,595
85,554
8.6
8.0
31.8
36.1
10.5
9.2
1.1
1.1
10.7
11.4
0.7
0.6
ONGC
Neutral
270
-
230,827
174,773
192,517
22.7
24.8
34.6
38.2
7.8
7.1
1.1
1.0
14.2
14.9
1.4
1.3
Petronet LNG
Accumulate
188
210
14,126
39,007
40,785
3.8
4.2
9.2
11.0
20.6
17.2
2.3
2.1
11.6
12.7
0.4
0.4
Reliance Industries
Accumulate
935
1,050
302,734
339,083
384,014
7.8
9.5
75.7
94.5
12.4
9.9
1.2
1.2
10.7
12.2
1.2
1.1
Pharmaceuticals
Alembic Pharma
Neutral
677
-
12,765
2,601
3,115
21.2
20.2
20.8
23.9
32.6
28.3
10.5
7.9
37.2
31.8
4.9
4.1
Aurobindo Pharma
Accumulate
736
824
42,989
14,435
16,600
22.6
22.6
36.1
41.2
20.4
17.9
6.1
4.6
34.5
29.3
3.3
2.8
Aventis*
Neutral
4,075
-
9,385
2,156
2,455
15.1
16.8
109.7
133.9
37.2
30.4
5.1
4.2
18.4
22.5
4.1
3.4
Cadila Healthcare
Neutral
1,952
-
39,967
10,224
11,840
19.7
20.0
69.8
81.0
28.0
24.1
7.4
5.9
26.8
25.3
4.0
3.4
Cipla
Neutral
726
-
58,269
14,051
16,515
18.9
18.7
25.1
28.9
28.9
25.1
4.6
4.0
17.2
16.9
4.1
3.5
Dr Reddy's
Neutral
4,290
-
73,144
17,903
20,842
22.7
22.8
160.5
189.5
26.7
22.6
5.4
4.5
22.2
21.7
4.0
3.4
Dishman Pharma
Buy
199
278
1,603
1,716
1,888
20.2
20.2
16.3
21.6
12.2
9.2
1.1
1.0
9.7
11.7
1.1
0.9
GSK Pharma*
Neutral
3,605
-
30,533
2,870
3,158
20.0
22.1
59.5
68.3
60.6
52.8
17.9
18.4
28.5
34.3
10.1
9.3
Indoco Remedies
Neutral
343
-
3,165
1,088
1,262
18.2
18.2
13.1
15.5
26.2
22.2
5.1
4.3
21.2
21.1
3.0
2.6
Ipca labs
Neutral
771
-
9,733
3,507
4,078
17.6
18.6
25.8
32.0
29.9
24.1
3.9
3.4
13.8
14.9
3.0
2.6
Lupin
Neutral
1,757
-
79,053
14,864
17,244
26.9
26.9
62.1
71.1
28.3
24.7
6.9
5.4
27.4
24.6
5.1
4.2
Sun Pharma
Accumulate
879
950
211,526
28,163
32,610
25.8
30.7
17.4
26.9
50.5
32.7
4.8
4.2
13.0
16.6
7.0
5.8
Power
Tata Power
Neutral
69
-
18,703
38,302
38,404
14.1
13.1
5.1
6.0
13.5
11.6
1.3
1.2
9.2
10.3
1.4
1.4
NTPC
Buy
128
157
105,212
87,064
98,846
23.5
23.5
11.7
13.2
10.9
9.7
1.2
1.1
11.4
12.1
2.2
2.0
Power Grid
Buy
138
170
72,144
20,702
23,361
86.7
86.4
12.1
13.2
11.4
10.4
1.7
1.5
15.6
15.1
8.4
7.8
Market Outlook
August 14, 2015
Stock Watch
Company Name
Reco
CMP
Target
Mkt Cap
Sales ( Čcr )
OPM(%)
EPS (Č)
PER(x)
P/BV(x)
RoE(%)
EV/Sales(x)
(Č)
Price ( Č)
( Č cr )
FY16E FY17E
FY16E
FY17E
FY16E
FY17E
FY16E
FY17E
FY16E
FY17E
FY16E
FY17E
FY16E
FY17E
Telecom
Bharti Airtel
Neutral
384
-
153,640
101,748
109,191
32.1
31.7
12.0
12.5
32.0
30.8
2.2
2.1
6.9
6.7
2.1
1.9
Idea Cellular
Accumulate
158
171
56,680
34,282
36,941
32.0
31.5
5.9
6.2
26.7
25.4
2.5
2.2
9.9
9.3
2.2
2.1
zOthers
Abbott India
Neutral
4,803
-
10,206
2,713
3,141
13.7
13.5
127.8
145.7
37.6
33.0
8.8
7.1
25.9
23.9
3.5
2.9
Bajaj Electricals
Buy
261
341
2,629
4,719
5,287
5.2
5.8
8.6
12.7
30.5
20.6
3.5
3.1
11.4
14.8
0.6
0.5
Finolex Cables
Neutral
250
-
3,823
2,728
3,036
10.8
11.0
14.4
16.8
17.4
14.9
2.6
2.3
15.2
15.3
1.1
1.0
Goodyear India*
Neutral
594
-
1,369
1,536
1,683
9.6
10.0
41.8
48.0
14.2
12.4
2.4
2.1
18.2
18.3
0.6
0.5
Hitachi
Neutral
1,316
-
3,579
1,806
2,112
9.0
9.2
28.6
29.1
46.0
45.3
11.4
9.2
28.1
22.6
2.1
1.7
Jyothy Laboratories
Neutral
327
-
5,918
1,620
1,847
11.5
11.5
7.3
8.5
44.8
38.6
5.8
5.4
13.3
14.4
3.5
3.0
MRF
Neutral
41,847
-
17,748
20,727
14,841
19.3
18.6
4,905.8
3,351.9
8.5
12.5
2.7
2.2
37.6
19.6
0.8
1.1
Page Industries
Neutral
14,040
-
15,660
1,929
2,450
19.8
20.1
229.9
299.0
61.1
47.0
26.9
18.7
52.1
47.1
8.1
6.4
Relaxo Footwears
Neutral
536
-
6,428
1,767
2,152
12.3
12.5
19.3
25.1
27.8
21.4
6.8
5.3
27.7
27.8
3.7
3.0
Siyaram Silk Mills
Accumulate
1,078
1,221
1,010
1,653
1,873
11.7
12.2
99.3
122.1
10.9
8.8
2.0
1.6
19.5
20.2
0.8
0.7
Styrolution ABS India*
Neutral
795
-
1,398
1,271
1,440
8.6
9.2
32.0
41.1
24.8
19.4
2.5
2.3
10.7
12.4
1.1
0.9
Tree House
Accumulate
393
433
1,662
259
324
56.8
56.8
17.0
21.7
23.1
18.1
2.3
2.1
10.1
11.5
6.3
5.2
TVS Srichakra
Neutral
2,834
-
2,170
2,112
2,389
11.9
12.1
168.5
202.5
16.8
14.0
5.8
4.3
39.6
35.5
1.1
1.0
HSIL
Buy
276
434
1,992
2,085
2,436
18.5
18.6
21.7
28.9
12.7
9.5
1.3
1.2
10.0
12.1
1.1
0.9
Kirloskar Engines India
Accumulate
274
297
3,957
2,634
3,252
10.1
12.0
10.9
17.4
25.1
15.7
2.8
2.5
11.4
16.8
1.1
0.9
Ltd
M M Forgings
Buy
661
797
798
563
671
22.1
22.9
51.0
66.5
13.0
10.0
2.7
2.2
23.1
24.1
1.6
1.3
Banco Products (India)
Neutral
126
-
898
1,208
1,353
11.0
12.3
10.8
14.5
11.7
8.7
1.3
1.2
11.9
14.5
0.7
0.6
Competent Automobiles Neutral
180
-
111
1,007
1,114
3.1
3.1
23.7
28.2
7.6
6.4
1.1
0.9
13.9
14.6
0.1
0.1
Nilkamal
Neutral
1,048
-
1,564
1,948
2,147
10.6
10.3
60.0
67.0
17.5
15.7
2.7
2.4
16.8
16.1
0.9
0.7
Visaka Industries
Accumulate
156
166
248
1,158
1,272
8.6
9.5
23.7
32.7
6.6
4.8
0.7
0.6
10.1
12.5
0.4
0.3
Transport Corporation of
Accumulate
267
293
2,019
2,830
3,350
8.8
9.0
14.4
18.3
18.6
14.6
2.9
2.5
15.4
17.1
0.8
0.7
India
Elecon Engineering
Accumulate
77
87
834
1,452
1,596
13.7
14.7
4.2
6.2
18.5
12.3
1.5
1.3
8.1
11.2
0.9
0.7
Surya Roshni
Buy
132
193
577
2,992
3,223
8.4
8.7
15.2
19.3
8.7
6.8
0.8
0.8
10.1
11.5
0.5
0.4
MT Educare
Accumulate
125
141
496
275
355
18.3
17.3
7.4
8.8
16.8
14.1
3.4
3.0
20.2
21.1
1.7
1.3
Radico Khaitan
Buy
92
112
1,224
1,565
1,687
11.9
12.4
5.4
6.6
17.0
14.0
1.4
1.3
8.0
9.0
1.3
1.2
Garware Wall Ropes
Buy
298
390
652
875
983
10.4
10.6
23.1
27.8
12.9
10.7
1.8
1.6
14.1
14.8
0.7
0.6
Source: Company, Angel Research; Note: *December year end; #September year end; &October year end; Price as on August 13, 2015
Market Outlook
August 14, 2015
Research Team Tel: 022 - 39357800
DISCLAIMER
Angel Broking Private Limited (hereinafter referred to as “Angel”) is a registered Member of National Stock Exchange of India Limited,
Bombay Stock Exchange Limited and MCX Stock Exchange Limited. It is also registered as a Depository Participant with CDSL and
Portfolio Manager with SEBI. It also has registration with AMFI as a Mutual Fund Distributor. Angel Broking Private Limited is a registered
entity with SEBI for Research Analyst in terms of SEBI (Research Analyst) Regulations, 2014 vide registration number INH000000164.
Angel or its associates has not been debarred/ suspended by SEBI or any other regulatory authority for accessing /dealing in securities
Market. Angel or its associates including its relatives/analyst do not hold any financial interest/beneficial ownership of more than 1% in
the company covered by Analyst. Angel or its associates/analyst has not received any compensation / managed or co-managed public
offering of securities of the company covered by Analyst during the past twelve months. Angel/analyst has not served as an officer,
director or employee of company covered by Analyst and has not been engaged in market making activity of the company covered by
Analyst.
This document is solely for the personal information of the recipient, and must not be singularly used as the basis of any investment
decision. Nothing in this document should be construed as investment or financial advice. Each recipient of this document should make
such investigations as they deem necessary to arrive at an independent evaluation of an investment in the securities of the companies
referred to in this document (including the merits and risks involved), and should consult their own advisors to determine the merits and
risks of such an investment.
Reports based on technical and derivative analysis center on studying charts of a stock's price movement, outstanding positions and
trading volume, as opposed to focusing on a company's fundamentals and, as such, may not match with a report on a company's
fundamentals.
The information in this document has been printed on the basis of publicly available information, internal data and other reliable sources
believed to be true, but we do not represent that it is accurate or complete and it should not be relied on as such, as this document is for
general guidance only. Angel Broking Pvt. Limited or any of its affiliates/ group companies shall not be in any way responsible for any
loss or damage that may arise to any person from any inadvertent error in the information contained in this report. Angel Broking Pvt.
Limited has not independently verified all the information contained within this document. Accordingly, we cannot testify, nor make any
representation or warranty, express or implied, to the accuracy, contents or data contained within this document. While Angel Broking
Pvt. Limited endeavors to update on a reasonable basis the information discussed in this material, there may be regulatory, compliance,
or other reasons that prevent us from doing so.
This document is being supplied to you solely for your information, and its contents, information or data may not be reproduced,
redistributed or passed on, directly or indirectly.
Neither Angel Broking Pvt. Limited, nor its directors, employees or affiliates shall be liable for any loss or damage that may arise from or
in connection with the use of this information.
Note: Please refer to the important ‘Stock Holding Disclosure' report on the Angel website (Research Section). Also, please refer to the
latest update on respective stocks for the disclosure status in respect of those stocks. Angel Broking Pvt. Limited and its affiliates may have
investment positions in the stocks recommended in this report.