Market Outlook
June 14, 2016
Market Cues
Domestic Indices
Chg (%)
(Pts)
(Close)
Indian markets are expected to opened down after CPI inflation came in higher
BSE Sensex
(0.9)
(239)
26,397
than expected. Surge in inflation is likely to weigh on the bond market in the
near term and which in turn will have an impact on the overall equity markets in
Nifty
(0.7)
(59)
8,111
India. The SGX NIFTY is also trading in negative and global markets closed on a
Mid Cap
(0.5)
(57)
11,320
weak note.
Small Cap
(0.4)
(51)
11,312
The US market remained weak for the day and overall trading throughout the
Bankex
(1.3)
(264)
20,163
day remained lackluster and closed in negative zone. Global concerns together
with upcoming Fed meet weighed on the markets and seems kept traders away
Global Indices
Chg (%)
(Pts)
(Close)
from the markets.
Dow Jones
(0.7)
(133)
17,732
The European market ended lower and ended at their lowest level in over two
Nasdaq
(0.8)
(46)
4,848
months. Potential Brexit and weakness in the Asian markets were the reasons for
the continuous weakness in the markets across Eurozone. The German index
FTSE
(1.2)
(71)
6,045
DAX ended sharply down by 147 points while the French Index CAC was down
Nikkei
(3.5)
(582)
16,019
by 66 points. It seems that the overall markets in the Europe is likely to remain
Hang Seng
(2.5)
(530)
20,513
volatile with a negative bias till the outcome of Britain’s referendum.
Shanghai Com
(3.2)
(94)
2,833
The Indian markets opened gap down Monday tracking global cues and selling
gained momentum during the day. Selling pressure was seen across sector
during the first half, however there was smart covering in the markets during
Advances / Declines
BSE
NSE
latter half of the session, led by Pharma companies.
Advances
1,084
720
Declines
1,517
856
News Analysis
Unchanged
157
65
CPI inflation shoots up to 5.77%.
Detailed analysis on Pg2
Volumes (` Cr)
Investor’s Ready Reckoner
BSE
2,619
NSE
14,996
Key Domestic & Global Indicators
Stock Watch: Latest investment recommendations on 150+ stocks
Refer Pg4 onwards
Net Inflows (` Cr)
Net
Mtd
Ytd
FII
219
4,190
18,558
Top Picks
MFs
127
(489)
8,941
CMP
Target
Upside
Company
Sector
Rating
(`)
(`)
(%)
Amara Raja
Auto/Auto Ancillary
Buy
851
1,076
26.5
Top Gainers
Price (`)
Chg (%)
HCL Tech
IT
Buy
753
1,000
32.8
Unitech
5
16.9
LIC Housing
Financials
Buy
471
592
25.7
Renuka
17
14.8
Bharat Electronics
Capital Goods
Accumulate
1,246
1,414
13.5
Jpassociat
7
13.2
Navkar Corporation Others
Buy
196
265
35.4
Mcleodruss
198
6.3
More Top Picks on Pg3
Gati
170
5.9
Key Upcoming Events
Previous
Consensus
Date
Region
Event Description
Reading
Expectations
Top Losers
Price (`)
Chg (%)
June 14 China
Industrial Production (YoY)
6.0
6.0
Iifl
219
(4.6)
June 14 UK
CPI (YoY)
0.3
0.4
Cairn
140
(4.3)
June 15 UK
Jobeless claims change
-2.4
--
Fsl
46
(4.0)
June 15 US
Industrial Production YoY
0.7
--
6.(
Torntpower
177
(3.9)
More Events on Pg4
Jindalstel
62
(3.7)
As on June 11, 2016
Market Outlook
June 14, 2016
CPI inflations shoot up to 5.76% in May:
CPI inflation negatively surprised once again in two consecutive months rising
to 5.76% for the Month of May 2016 compared to 5.39% in April 2016. The
sharp rise in CPI inflation was driven by spurt in food inflation to 7.55% vs
6.40% in April. Vegetable inflation saw a rise of 10.77% compared to 4.82%
and this seems to have added to the sharp increase in food inflation.
The RBI’s had earlier indicated that there is an upward pressure in inflation
projections; however it retained its target at 5% for January 2017. A bigger
part of the rise in inflation during May has come from food inflation and post
monsoon we expect the same to moderate. The IMD has forecast an above
normal monsoon and this lends a prospect for better output of food articles
and hence believe overall inflations to moderate from here on.
Economic and Political News
Foxconn looks at Odisha’s Gopalpur for setting up unit
Sterlite Grid eyes Rs 3000 cr funds via infra trust
Microsoft buys LinkedInd for $ 26 Bn
Telcos fail third call drop case
Interlinking of highways on the anvil
Opec hints at oil demand exceeding production.
Corporate News
Maruti Suzuki resumes production after maintenance closure
Havells to increase stake in Promptec Renewable
OBC to raise Rs 1000 cr via issuing bonds
NTPC trades surplus power from its 4 stations.
Market Outlook
June 14, 2016
Top Picks
Large Cap
M
arket Cap
CM
P
T
arget
Upsid
e
Company
Rationale
(` Cr)
(`)
(`)
(%)
To outpace battery industry growth due to better technological
Amara Raja Batteries
14,532
851
1,076
26.5
products leading to market share gains in both the automotive
OEM and replacement segments.
Uptick in defense capex by government, coupled with BELs
Bharat Electronics
29,902
1,246
1,414
13.5
strong market positioning, indicate good times ahead for BEL.
HCL Tech
1,06,187
753
1,000
32.8
Stock is trading at attractive valuations & factors all bad news.
Strong visibility for a robust 20% earnings trajectory, coupled
HDFC Bank
2,91,973
1,153
1,262
9.4
with high quality of earnings on account of high quality retail
business and strategic focus on highly rated corporates.
Back on the growth trend, expect a long term growth of 14% to
Infosys
2,71,625
1,183
1,374
16.2
be a US$20bn in FY2020.
Continues to grow its retail loan book at healthy pace with
LIC Housing Finance
23,757
471
592
25.7
improvement in asset quality. Expect LICHF to post a healthy
loan book which is likely to reflect in a strong earnings growth.
Huge bid pipeline of re-development works at Delhi and other
NBCC
11,235
187
220
17.5
State Governments and opportunity from Smart City, positions
NBCC to report strong growth, going forward.
Strong market positioning within the domestic AC markets to
Voltas
10,669
322
407
26.2
continue, EMP business set to revive
Source: Company, Angel Research
Mid Cap
M
arket Cap
CM
P
T
arget
Upsid
e
Company
Rationale
(` Cr)
(`)
(`)
(%)
Among the top 4 players in the consumer durables segment.
Bajaj Electricals
2,306
228
268
17.4
Improved profitability backed by turn around in E&P segment.
Strong order book lends earnings visibility.
Favourable outlook for AC industry to augur well for Cooling
Blue Star
3,876
431
495
14.9
products business. EMPPAC division's profitability to improve
once operating environment turns around.
With a focus on the low and medium income (LMI) consumer
Dewan Housing
5,915
203
270
33.2
segment, the company has increased its presence in tier-II & III
cities where the growth opportunity is immense.
Strong loan growth backed by diversified loan portfolio and
Equitas Holdings
5,825
174
235
35.3
adequate CAR. ROE & ROA likely to remain decent as risk of
dilution remains low. Attractive valuations considering growth.
Commencement of new projects, downtrend in the interest rate
IL&FS Transport
2,411
73
93
26.9
cycle, to lead to stock re-rating
Economic recovery to have favourable impact on advertising &
circulation revenue growth. Further, the acquisition of a radio
Jagran Prakashan
5,548
170
205
20.8
business (Radio City) would also boost the company's revenue
growth.
Speedier execution and speedier sales, strong revenue visibility
Mahindra Lifespace
1,852
451
554
22.7
in short-to-long run, attractive valuations
Massive capacity expansion along with rail advantage at ICD
Navkar Corporation
2,790
196
265
35.4
as well CFS augurs well for the company
Earnings boost on back of stable material prices and
Radico Khaitan
1,213
91
125
37.1
favourable pricing environment. Valuation discount to peers
provides additional comfort
Strong brands and distribution network would boost growth
Siyaram Silk Mills
957
1,021
1,347
31.9
going ahead. Stock currently trades at an inexpensive
valuation.
Source: Company, Angel Research
Market Outlook
June 14, 2016
Key Upcoming Events
Global economic events release calendar
Bloomberg Data
Date
Time
Country Event Description
Unit
Period
Last Reported
Estimated
Jun 14, 2016
7:30 AM
China
Industrial Production (YoY)
% Change May
6.00
6.00
2:00 PM
UK
CPI (YoY)
% Change May
0.30
0.40
Jun 15, 2016
6:45 PM
US
Industrial Production
% May
0.66
(0.20)
2:00 PM
UK
Jobless claims change
% Change May
-2.40
-
US
Producer Price Index (mom)
% Change May
0.20
11:30 PM
US
FOMC rate decision
% Jun 15
0.50
0.50
June 16, 2016
6:00 PM
US
Initial Jobless claims
Thousands Jun 11
264.00
12:00 AM
2:30 PM Euro Zone
Euro-Zone CPI (YoY)
% May F
-0.10
-0.10
6:00 PM
US
Consumer price index (mom)
% Change May
0.40
7:12 AM
4:30 PM
UK
BOE Announces rates
% Ratio Jun 16
0.50
0.50
Jun 17, 2016
6:00 PM
US
Housing Starts
Thousands May
1172.00
1,150.00
6:00 PM
US
Building permits
Thousands May
1130.00
1,145.00
Jun 22, 2016
7:30 PM Euro Zone Euro-Zone Consumer Confidence
Value Jun A
(7.00)
7:30 PM
US
Existing home sales
Million
May
5.45
5.50
Jun 23, 2016
1:00 PM Germany
PMI Manufacturing
Value Jun P
52.10
1:00 PM Germany
PMI Services
Value Jun P
55.20
7:30 PM
US
New home sales
Thousands May
619.00
560.00
Jun 28, 2016
7:30 PM
US
Consumer ConfidenceS.A./ 1985=100 Jun
92.60
6:00 PM
US
GDP Qoq (Annualised)
% Change 1Q T
0.80
Jun 30, 2016
1:25 PM Germany Unemployment change (000's)
Thousands
Jun
(11.00)
2:00 PM
UK
GDP (YoY)
% Change 1Q F
2.10
Source: Bloomberg, Angel Research
Market Outlook
June 14, 2016
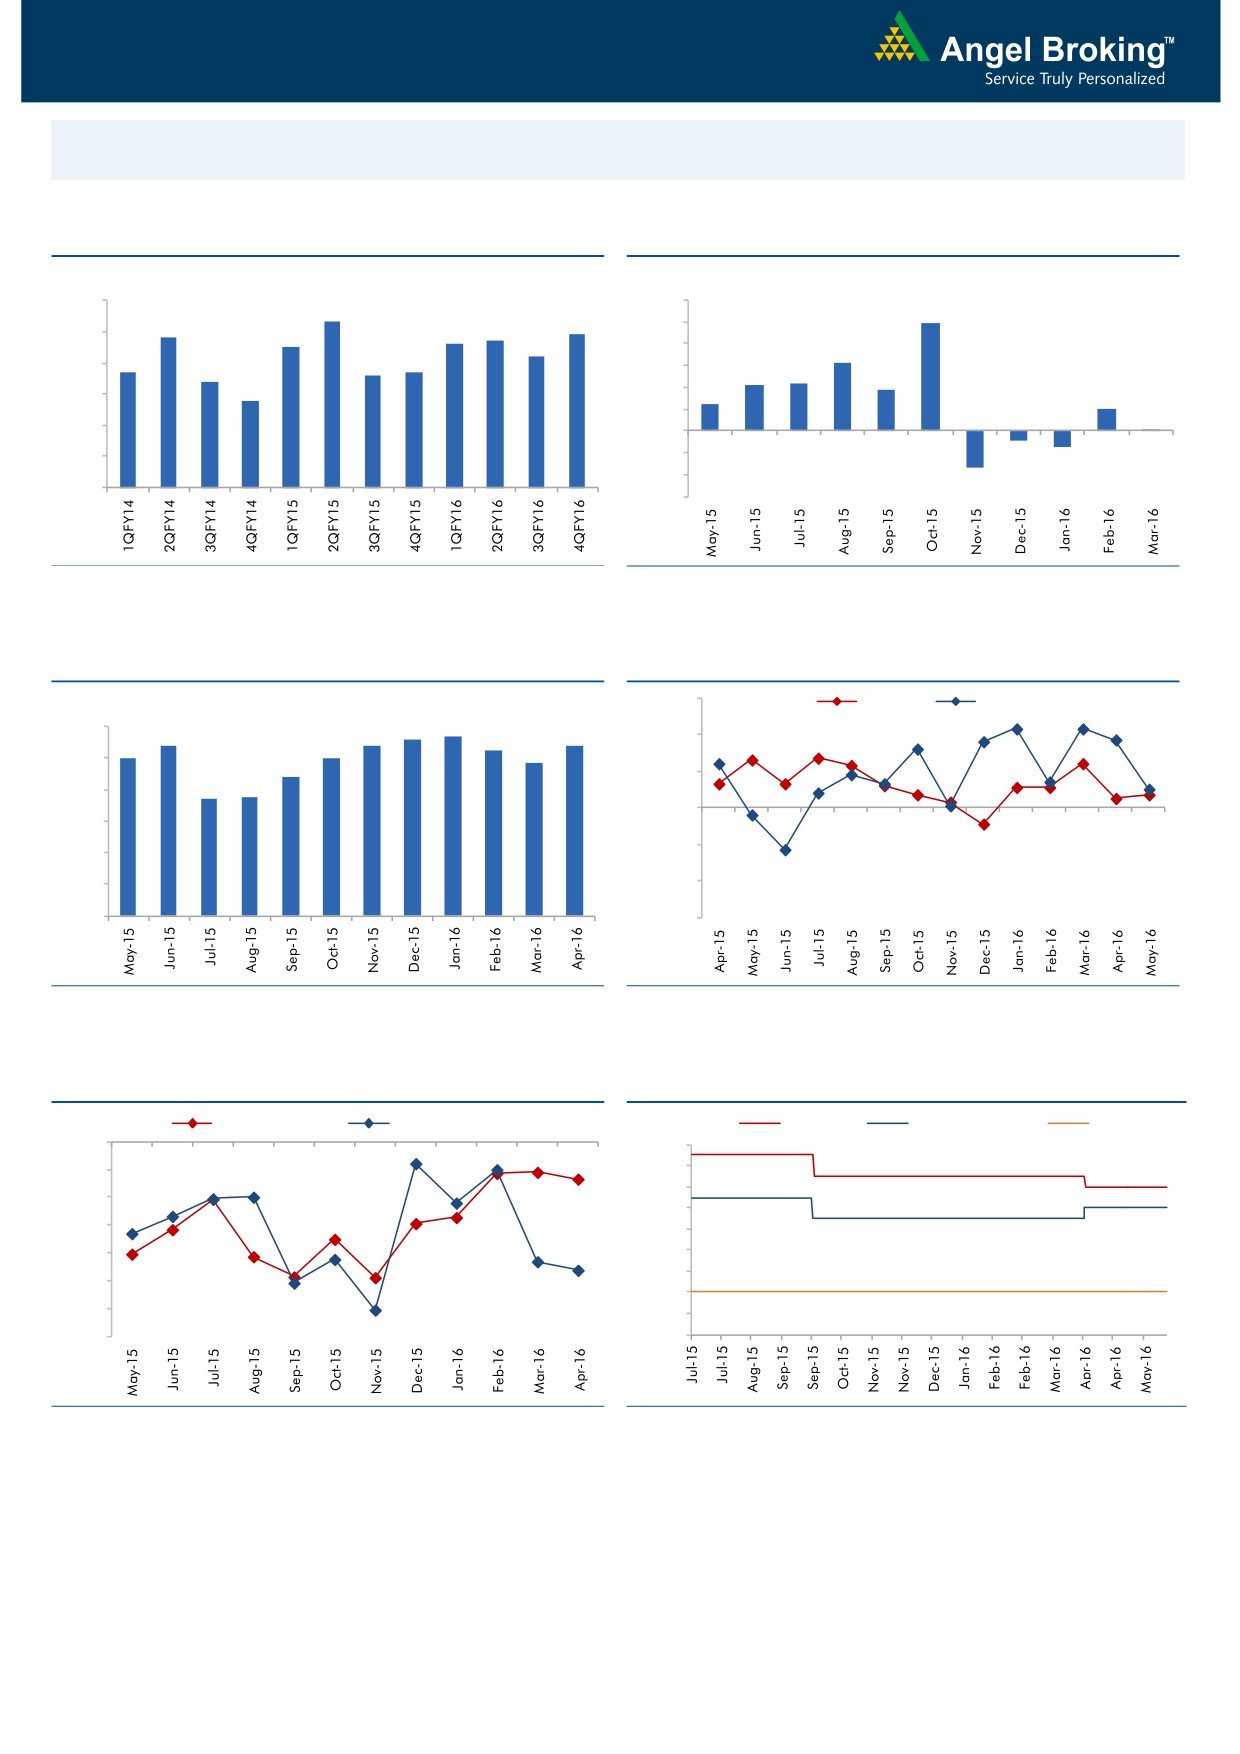
Macro watch
Exhibit 1: Quarterly GDP trends
Exhibit 2: IIP trends
(%)
(%)
9.0
8.3
12.0
9.9
7.8
7.7
7.9
10.0
8.0
7.5
7.6
7.2
8.0
6.3
6.7
6.6
6.7
7.0
6.4
6.0
4.2
4.3
3.7
5.8
4.0
2.5
6.0
2.0
2.0
0.1
5.0
-
4.0
(2.0)
(0.9)
(1.5)
(4.0)
3.0
(3.4)
(6.0)
Source: CSO, Angel Research
Source: MOSPI, Angel Research
Exhibit 3: Monthly CPI inflation trends
Exhibit 4: Manufacturing and services PMI
56.0
Mfg. PMI
Services PMI
(%)
5.6
5.7
6.0
5.4
5.4
5.4
5.3
54.0
5.0
5.0
4.8
5.0
4.4
52.0
3.7
3.7
4.0
50.0
3.0
48.0
2.0
1.0
46.0
-
44.0
Source: MOSPI, Angel Research
Source: Market, Angel Research; Note: Level above 50 indicates expansion
Exhibit 5: Exports and imports growth trends
Exhibit 6: Key policy rates
(%)
Exports yoy growth
Imports yoy growth
(%)
Repo rate
Reverse Repo rate
CRR
0.0
7.50
(5.0)
7.00
6.50
(10.0)
6.00
(15.0)
5.50
(20.0)
5.00
4.50
(25.0)
4.00
(30.0)
3.50
(35.0)
3.00
Source: Bloomberg, Angel Research
Source: RBI, Angel Research
Market Outlook
June 14, 2016
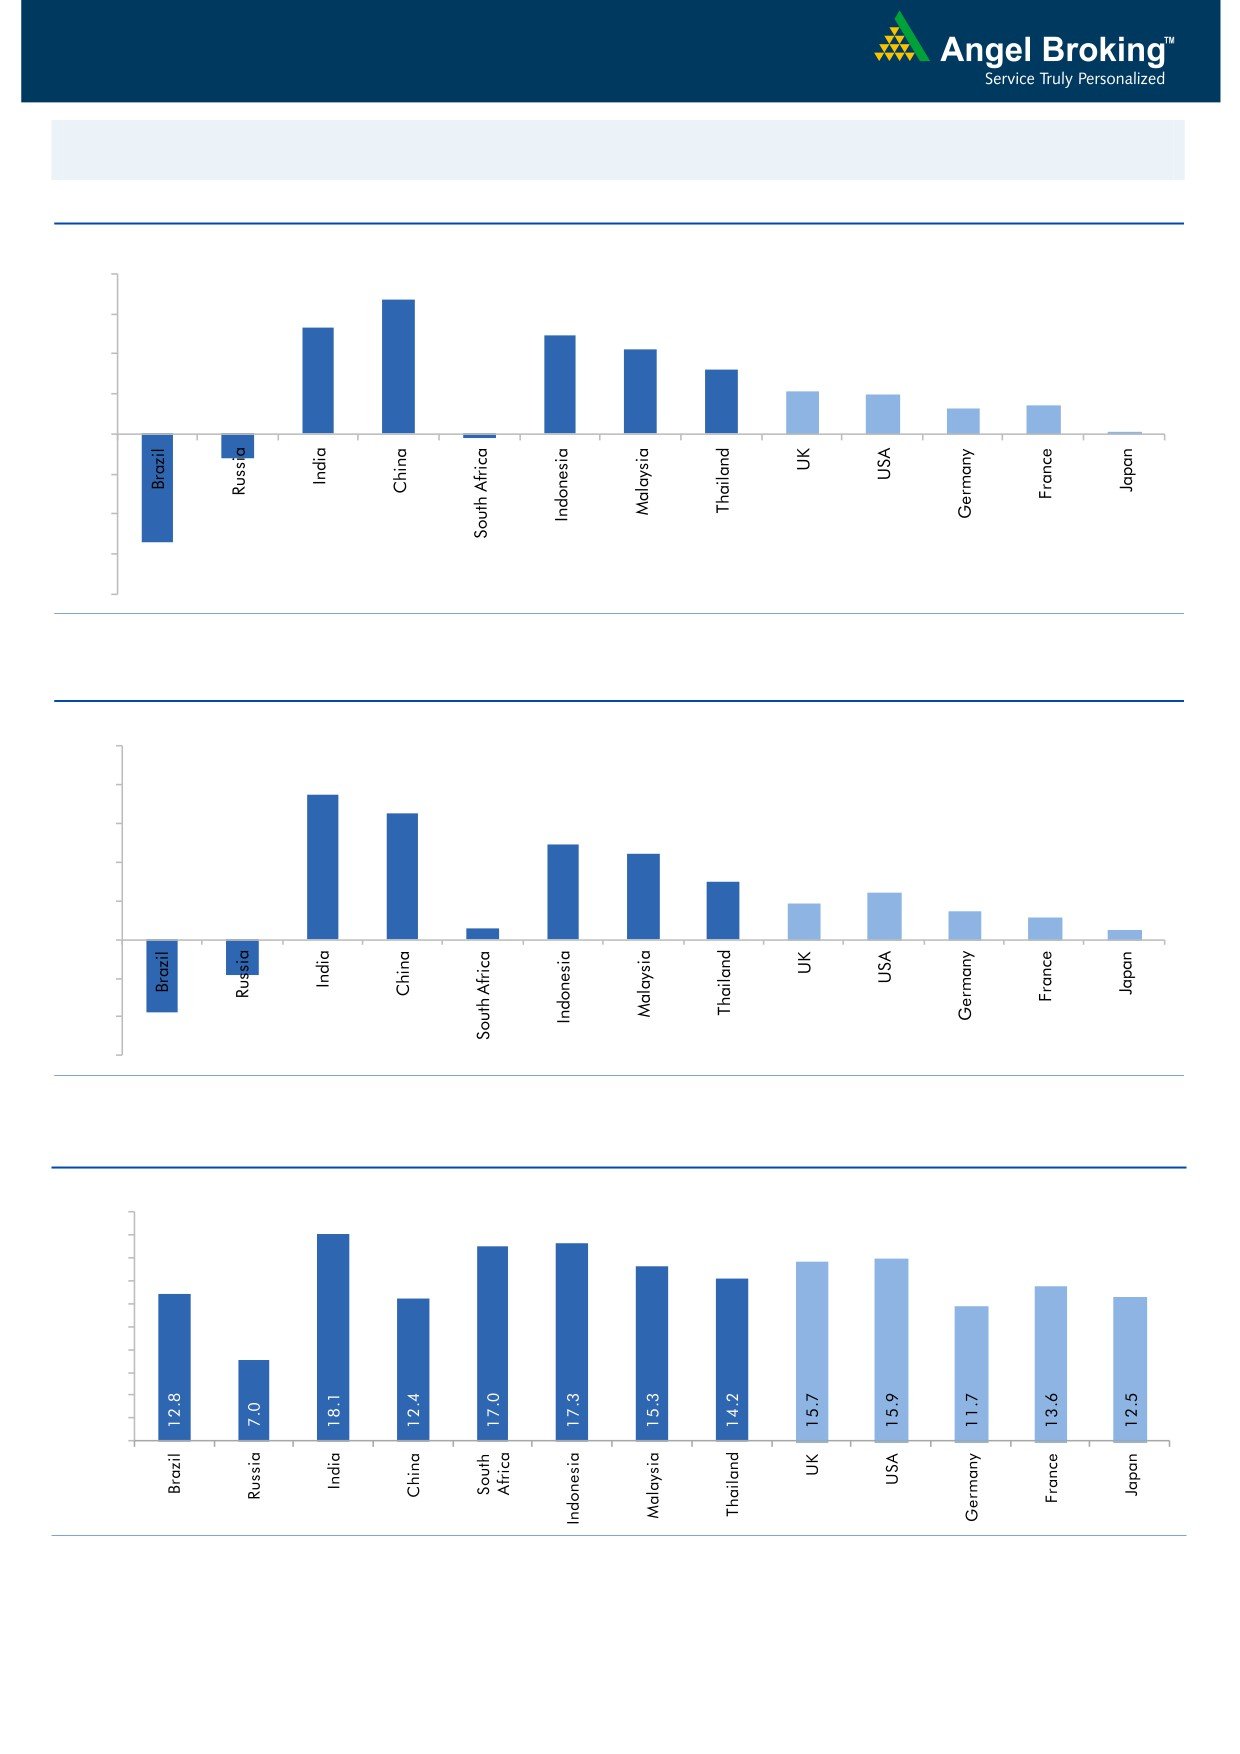
Global watch
Exhibit 1: Latest quarterly GDP Growth (%, yoy) across select developing and developed countries
(%)
8.0
6.7
6.0
5.3
4.9
4.2
4.0
3.2
2.1
2.0
1.3
1.4
2.0
0.1
-
(0.2)
(2.0)
(4.0)
(1.2)
(6.0)
(5.4)
(8.0)
Source: Bloomberg, Angel Research
Exhibit 2: 2016 GDP Growth projection by IMF (%, yoy) across select developing and developed countries
(%)
10.0
7.5
8.0
6.5
6.0
4.9
4.4
4.0
3.0
2.4
1.9
1.5
2.0
1.1
0.6
0.5
(3.8)
(1.8)
-
(2.0)
(4.0)
(6.0)
Source: IMF, Angel Research
Exhibit 3: One year forward P-E ratio across select developing and developed countries
(x)
20.0
18.0
16.0
14.0
12.0
10.0
8.0
6.0
4.0
2.0
-
Source: IMF, Angel Research
Market Outlook
June 14, 2016
Exhibit 4: Relative performance of indices across globe
Returns (%)
Country
Name of index
Closing price
1M
3M
1YR
Brazil
Bovespa
49,661
(5.9)
0.2
(6.3)
Russia
Micex
1,904
(0.3)
1.1
15.2
India
Nifty
8,111
2.7
8.4
0.8
China
Shanghai Composite
2,833
0.1
1.2
(42.2)
South Africa
Top 40
46,432
2.7
0.4
0.6
Mexico
Mexbol
44,930
(1.7)
1.3
1.2
Indonesia
LQ45
820
0.9
(1.7)
(6.2)
Malaysia
KLCI
1,630
(1.2)
(4.1)
(6.3)
Thailand
SET 50
902
3.2
1.3
(7.5)
USA
Dow Jones
17,732
0.1
3.0
(0.3)
UK
FTSE
6,045
(1.9)
(1.6)
(9.9)
Japan
Nikkei
16,019
(3.8)
(4.6)
(21.8)
Germany
DAX
9,657
(3.2)
1.7
(12.0)
France
CAC
4,227
(1.5)
(5.9)
(15.4)
Source: Bloomberg, Angel Research
Stock Watch
June 14, 2016
Company Name
Reco
CMP
Target
Mkt Cap
Sales ( Čcr )
OPM(%)
EPS (Č)
PER(x)
P/BV(x)
RoE(%)
EV/Sales(x)
(Č)
Price ( Č)
( Č cr )
FY16E FY17E
FY16E
FY17E
FY16E
FY17E
FY16E
FY17E
FY16E
FY17E
FY16E
FY17E
FY16E
FY17E
Agri / Agri Chemical
Rallis
Neutral
209
-
4,055
1,612
1,911
13.3
13.3
7.4
9.5
28.2
22.0
4.5
4.0
16.7
18.4
2.6
2.2
United Phosphorus
Buy
587
684
25,157
13,083
15,176
18.5
18.5
31.5
37.4
18.6
15.7
3.7
3.1
21.4
21.4
2.1
1.8
Auto & Auto Ancillary
Ashok Leyland
Neutral
105
-
29,910
17,995
21,544
11.4
11.6
3.4
4.7
30.9
22.4
5.4
5.0
17.7
22.2
1.7
1.3
Bajaj Auto
Neutral
2,587
-
74,865
22,709
25,860
20.9
20.1
129.0
143.6
20.1
18.0
6.2
5.3
30.7
29.4
2.8
2.5
Bharat Forge
Accumulate
744
875
17,326
7,351
8,318
19.9
19.7
31.2
36.5
23.9
20.4
4.3
3.6
19.3
19.2
2.5
2.2
Eicher Motors
Accumulate
18,448
20,044
50,106
15,556
16,747
15.5
17.3
464.8
597.5
39.7
30.9
14.5
10.7
36.2
34.3
3.2
2.9
Gabriel India
Accumulate
88
101
1,260
1,415
1,544
8.7
9.0
4.6
5.4
19.1
16.2
3.5
3.1
18.1
18.9
0.9
0.8
Hero Motocorp
Neutral
3,039
-
60,689
28,244
30,532
15.5
15.9
156.7
168.5
19.4
18.0
7.7
6.6
39.9
36.4
2.0
1.8
Jamna Auto Industries Neutral
157
-
1,255
1,281
1,473
11.2
11.5
7.6
9.2
20.7
17.1
5.2
4.3
25.4
25.2
1.1
0.9
L G Balakrishnan & Bros Neutral
465
-
730
1,254
1,394
11.6
11.8
35.9
41.7
13.0
11.2
1.8
1.6
13.5
13.8
0.7
0.6
Mahindra and Mahindra Neutral
1,357
-
84,301
38,416
42,904
13.7
13.9
54.8
63.4
24.8
21.4
3.8
3.4
15.4
15.8
1.9
1.6
Maruti
Neutral
4,136
-
124,925
57,865
68,104
16.4
16.7
176.3
225.5
23.5
18.3
4.6
3.9
19.4
21.2
2.0
1.6
Minda Industries
Neutral
1,165
-
1,848
2,523
2,890
8.7
9.0
55.0
65.4
21.2
17.8
4.1
3.3
19.3
18.7
0.8
0.7
Motherson Sumi
Accumulate
287
313
37,897
39,343
45,100
8.8
9.1
10.1
12.5
28.4
22.9
9.0
7.0
35.3
34.4
1.1
0.9
Rane Brake Lining
Buy
375
465
297
454
511
11.5
12.0
25.2
31.0
14.9
12.1
2.2
2.0
14.9
16.6
0.8
0.7
Setco Automotive
Neutral
45
-
601
594
741
12.7
13.7
1.7
3.2
26.4
14.1
2.8
2.4
10.4
16.9
1.5
1.2
Tata Motors
Neutral
444
-
128,264
259,686
273,957
13.0
13.4
25.9
29.5
17.2
15.1
2.3
2.0
8.0
9.0
0.7
0.7
TVS Motor
Accumulate
288
330
13,680
11,263
13,122
6.9
8.5
9.2
15.0
31.3
19.2
7.2
5.7
22.7
29.6
1.2
1.0
Amara Raja Batteries
Buy
851
1,076
14,532
4,690
5,429
17.5
17.5
28.5
35.3
29.9
24.1
6.9
5.7
23.1
25.9
3.1
2.6
Exide Industries
Neutral
158
-
13,392
6,950
7,784
14.4
14.8
6.6
7.3
23.9
21.6
3.0
2.7
12.6
12.8
1.7
1.5
Apollo Tyres
Buy
148
183
7,534
12,056
12,714
17.2
16.4
23.0
20.3
6.4
7.3
1.1
1.0
17.7
13.6
0.7
0.7
Ceat
Buy
877
1,119
3,546
6,041
6,597
14.1
13.7
99.5
111.9
8.8
7.8
1.7
1.5
19.6
18.5
0.8
0.6
JK Tyres
Neutral
90
-
2,035
7,446
7,669
15.2
14.0
19.6
18.4
4.6
4.9
1.2
1.0
25.2
19.5
0.7
0.6
Swaraj Engines
Neutral
1,100
-
1,366
552
630
14.2
14.7
44.6
54.1
24.7
20.3
5.7
5.2
23.2
25.6
2.4
2.0
Subros
Neutral
93
-
556
1,293
1,527
11.8
11.9
4.2
6.7
22.1
13.8
1.7
1.5
7.7
11.5
0.8
0.6
Indag Rubber
Neutral
187
-
491
283
329
17.0
17.2
13.0
15.4
14.5
12.1
3.2
2.6
21.8
21.6
1.4
1.2
Capital Goods
ACE
Neutral
41
-
406
660
839
4.7
8.2
1.0
3.9
41.0
10.5
1.3
1.1
3.2
11.3
0.8
0.6
BEML
Buy
852
1,157
3,547
3,277
4,006
6.0
8.9
36.2
64.3
23.5
13.2
1.6
1.5
5.7
11.7
1.2
0.9
Bharat Electronics
Accumulate
1,246
1,414
29,902
7,295
8,137
20.0
16.8
56.5
58.7
22.1
21.2
3.3
2.9
42.1
44.6
3.4
2.9
Stock Watch
June 14, 2016
Company Name
Reco
CMP
Target
Mkt Cap
Sales ( Čcr )
OPM(%)
EPS (Č)
PER(x)
P/BV(x)
RoE(%)
EV/Sales(x)
(Č)
Price ( Č)
( Č cr )
FY16E
FY17E
FY16E
FY17E
FY16E
FY17E
FY16E
FY17E
FY16E
FY17E
FY16E
FY17E
FY16E
FY17E
Capital Goods
Voltas
Buy
322
407
10,669
5,857
6,511
7.5
7.9
11.7
12.9
27.6
25.0
4.5
3.9
17.1
16.7
1.9
1.7
BGR Energy
Neutral
116
-
837
3,615
3,181
9.5
9.4
16.7
12.4
7.0
9.4
0.7
0.6
10.0
7.0
0.6
0.8
BHEL
Neutral
120
-
29,457
33,722
35,272
10.8
11.7
10.5
14.2
11.5
8.5
0.9
0.8
7.0
9.0
1.0
0.9
Blue Star
Accumulate
431
495
3,876
3,770
4,351
5.7
6.4
11.4
17.2
37.7
25.1
5.9
5.5
18.4
23.1
1.1
1.0
Crompton Greaves
Neutral
69
-
4,343
13,484
14,687
4.9
6.2
4.5
7.1
15.4
9.8
1.1
1.0
7.2
10.8
0.5
0.4
Greaves Cotton
Neutral
140
-
3,409
1,655
1,755
16.6
16.8
7.4
7.8
18.9
17.9
3.8
3.6
21.1
20.6
2.0
1.9
Inox Wind
Buy
243
286
5,401
4,406
5,605
15.5
15.7
20.4
24.8
11.9
9.8
2.7
2.0
27.9
25.9
1.4
1.1
KEC International
Neutral
136
-
3,499
8,791
9,716
6.1
6.8
5.4
8.2
25.2
16.6
2.5
2.3
10.0
14.0
0.6
0.6
Thermax
Neutral
815
-
9,712
6,413
7,525
7.4
8.5
30.5
39.3
26.7
20.7
4.1
3.6
15.0
17.0
1.4
1.2
VATech Wabag
Neutral
603
-
3,285
2,722
3,336
7.9
8.1
19.5
24.6
30.9
24.5
3.2
2.9
11.1
12.4
1.4
1.1
Cement
ACC
Neutral
1,549
-
29,086
13,151
14,757
16.4
18.3
63.9
83.4
24.2
18.6
3.1
2.9
13.3
16.1
2.0
1.7
Ambuja Cements
Neutral
236
-
36,578
11,564
12,556
19.4
20.7
8.9
10.1
26.5
23.3
3.3
3.1
12.8
13.8
2.8
2.5
HeidelbergCement
Neutral
111
-
2,513
1,772
1,926
13.3
15.4
1.0
3.0
110.9
37.0
2.8
2.6
2.6
7.9
2.0
1.8
India Cements
Neutral
100
-
3,072
4,216
4,840
18.0
19.5
4.0
9.9
25.0
10.1
1.0
0.9
4.0
9.5
1.0
0.8
JK Cement
Neutral
609
-
4,261
3,661
4,742
10.1
15.8
7.5
28.5
81.2
21.4
2.4
2.2
7.5
22.9
1.7
1.2
J K Lakshmi Cement
Neutral
362
-
4,255
2,947
3,616
16.7
19.9
11.5
27.2
31.4
13.3
3.0
2.6
9.8
20.8
1.8
1.5
Mangalam Cements
Neutral
289
-
771
1,053
1,347
10.5
13.3
8.4
26.0
34.4
11.1
1.5
1.3
4.3
12.5
1.1
0.8
Orient Cement
Neutral
168
-
3,443
1,854
2,524
21.2
22.2
7.7
11.1
21.8
15.1
3.1
2.7
13.3
15.7
2.6
1.8
Ramco Cements
Neutral
532
-
12,656
4,036
4,545
20.8
21.3
15.1
18.8
35.2
28.3
4.3
3.8
12.9
14.3
3.7
3.2
Shree Cement^
Neutral
13,513
-
47,074
7,150
8,742
26.7
28.6
228.0
345.5
59.3
39.1
8.7
7.3
15.7
20.3
6.3
5.1
UltraTech Cement
Neutral
3,389
-
93,011
24,669
29,265
18.2
20.6
82.0
120.0
41.3
28.2
4.4
3.9
11.3
14.7
3.8
3.2
Construction
ITNL
Buy
73
93
2,411
7,360
8,682
34.0
32.2
7.0
8.6
10.5
8.5
0.4
0.4
3.2
2.5
3.7
3.5
KNR Constructions
Accumulate
553
603
1,556
937
1,470
14.3
14.0
44.2
38.6
12.5
14.3
2.5
2.2
15.4
15.4
1.8
1.2
Larsen & Toubro
Accumulate
1,465
1,700
136,530
58,870
65,708
8.3
10.3
42.0
53.0
34.9
27.6
2.4
2.2
8.8
11.2
2.6
2.3
Gujarat Pipavav Port
Neutral
156
-
7,539
629
684
51.0
52.2
6.4
5.9
24.4
26.4
3.2
3.0
15.9
12.7
11.9
10.8
MBL Infrastructures
Buy
120
285
497
2,313
2,797
12.2
14.6
19.0
20.0
6.3
6.0
0.7
0.6
11.3
10.6
0.9
0.8
Nagarjuna Const.
Neutral
73
-
4,053
7,892
8,842
8.8
9.1
3.0
5.3
24.3
13.8
1.2
1.1
5.0
8.5
0.8
0.7
PNC Infratech
Accumulate
554
647
2,841
1,873
2,288
13.2
13.5
24.0
32.0
23.1
17.3
2.2
2.0
12.1
12.3
1.6
1.4
Simplex Infra
Neutral
273
-
1,351
5,955
6,829
10.3
10.5
16.0
31.0
17.1
8.8
0.9
0.8
5.3
9.9
0.7
0.6
Stock Watch
June 14, 2016
Company Name
Reco
CMP
Target
Mkt Cap
Sales ( Čcr )
OPM(%)
EPS (Č)
PER(x)
P/BV(x)
RoE(%)
EV/Sales(x)
(Č)
Price ( Č)
( Č cr )
FY16E
FY17E
FY16E
FY17E
FY16E
FY17E
FY16E
FY17E
FY16E
FY17E
FY16E
FY17E
FY16E
FY17E
Construction
Power Mech Projects
Neutral
578
-
850
1,539
1,801
12.8
12.7
59.0
72.1
9.8
8.0
1.5
1.3
18.6
16.8
0.5
0.5
Sadbhav Engineering
Neutral
285
-
4,888
3,186
3,598
10.2
10.3
8.0
9.0
35.6
31.7
3.3
2.9
9.4
9.9
1.9
1.7
NBCC
Buy
187
220
11,235
5,838
7,428
6.0
7.9
5.2
8.2
36.0
22.8
1.1
0.9
21.9
28.2
1.7
1.2
MEP Infra
Neutral
37
-
607
1,956
1,876
28.1
30.5
1.3
3.0
28.7
12.5
6.0
4.1
21.2
32.8
1.7
1.7
SIPL
Neutral
103
-
3,610
675
1,042
62.4
64.7
-
-
3.8
4.4
-
-
16.7
11.3
Engineers India
Neutral
191
-
6,449
1,667
1,725
13.5
16.0
9.7
11.4
19.7
16.8
2.3
2.2
11.7
13.4
2.7
2.7
Financials
Allahabad Bank
Neutral
52
-
3,763
8,569
9,392
2.8
2.9
16.3
27.5
3.2
1.9
0.3
0.2
7.6
11.9
-
-
Axis Bank
Neutral
532
-
126,837
26,204
29,738
3.6
3.5
34.5
35.4
15.4
15.0
2.4
2.2
16.8
14.9
-
-
Bank of Baroda
Neutral
146
-
33,618
18,802
21,088
2.0
2.2
(7.4)
13.0
11.2
1.2
0.9
(4.2)
7.3
-
-
Bank of India
Neutral
88
-
8,173
15,972
17,271
1.9
2.0
15.3
33.4
5.7
2.6
0.3
0.2
3.6
7.6
-
-
Canara Bank
Neutral
193
-
10,453
15,441
16,945
2.0
2.1
46.6
70.4
4.1
2.7
0.4
0.3
8.0
11.2
-
-
Dena Bank
Neutral
30
-
1,971
3,440
3,840
2.1
2.3
7.3
10.0
4.1
2.9
0.3
0.3
6.1
7.9
-
-
Dewan Housing Finance Buy
203
270
5,915
1,828
2,225
2.9
3.0
24.9
29.7
8.2
6.8
1.3
1.1
15.1
16.1
-
-
Equitas Holdings
Buy
174
235
5,825
679
1,076
12.4
11.7
6.2
6.7
28.1
25.9
3.5
2.5
13.3
12.5
-
-
Federal Bank
Neutral
57
-
9,742
3,279
3,787
2.8
2.9
3.9
5.5
14.4
10.3
1.2
1.1
8.4
10.8
-
-
HDFC
Neutral
1,207
-
190,794
10,358
11,852
3.3
3.3
41.1
47.0
29.4
25.7
5.6
5.1
24.7
24.9
-
-
HDFC Bank
Accumulate
1,153
1,262
291,973
38,606
47,696
4.4
4.5
48.8
61.4
23.6
18.8
4.0
3.5
18.7
20.0
-
-
ICICI Bank
Neutral
244
-
141,975
34,279
39,262
3.3
3.3
21.0
24.4
11.6
10.0
2.0
1.7
14.4
14.7
-
-
IDBI Bank
Neutral
67
-
13,722
9,625
10,455
1.8
1.8
8.5
14.2
7.8
4.7
0.5
0.4
5.9
9.3
-
-
Indian Bank
Neutral
105
-
5,060
6,160
6,858
2.5
2.5
24.5
29.8
4.3
3.5
0.3
0.3
7.7
8.6
-
-
LIC Housing Finance
Buy
471
592
23,757
3,179
3,758
2.6
2.6
32.9
40.6
14.3
11.6
2.6
2.2
19.6
20.7
-
-
Oriental Bank
Neutral
89
-
3,084
7,643
8,373
2.4
2.4
37.2
45.4
2.4
2.0
0.2
0.2
8.2
9.4
-
-
Punjab Natl.Bank
Neutral
83
-
16,288
23,122
26,022
2.8
2.8
7.0
21.6
11.9
3.8
0.6
0.5
3.4
10.0
-
-
South Ind.Bank
Neutral
21
-
2,768
1,965
2,185
2.5
2.5
2.5
3.3
8.2
6.2
0.8
0.7
9.5
11.7
-
-
St Bk of India
Neutral
202
-
156,963
79,958
86,061
2.6
2.6
13.4
20.7
15.1
9.8
1.2
1.2
11.5
12.8
-
-
Union Bank
Neutral
119
-
8,153
12,646
14,129
2.3
2.4
31.0
39.1
3.8
3.0
0.4
0.4
9.8
11.4
-
-
Vijaya Bank
Neutral
31
-
3,131
3,536
3,827
1.9
1.9
5.5
6.7
5.7
4.7
0.5
0.4
7.8
8.8
-
-
Yes Bank
Neutral
1,065
-
44,807
7,190
9,011
3.2
3.3
58.2
69.7
18.3
15.3
3.3
2.8
19.2
19.6
-
-
FMCG
Asian Paints
Neutral
995
-
95,397
15,534
17,445
17.7
16.8
18.4
19.6
54.2
50.7
19.1
18.1
34.6
35.6
6.0
5.4
Stock Watch
June 14, 2016
Company Name
Reco
CMP
Target
Mkt Cap
Sales ( Čcr )
OPM(%)
EPS (Č)
PER(x)
P/BV(x)
RoE(%)
EV/Sales(x)
(Č)
Price ( Č)
( Č cr )
FY16E FY17E
FY16E
FY17E
FY16E
FY17E
FY16E
FY17E
FY16E
FY17E
FY16E
FY17E
FY16E
FY17E
FMCG
Britannia
Neutral
2,678
-
32,128
8,481
9,795
14.0
14.1
65.5
78.3
40.9
34.2
19.4
15.9
38.3
41.2
3.8
3.3
Colgate
Neutral
865
-
23,524
4,136
4,632
22.5
23.3
22.2
25.3
39.0
34.2
23.7
21.1
68.6
67.5
5.5
4.9
Dabur India
Neutral
303
-
53,355
9,370
10,265
17.6
17.3
7.3
8.1
41.4
37.4
10.7
9.8
31.7
30.6
5.5
5.0
GlaxoSmith Con*
Accumulate
5,630
6,118
23,677
4,519
5,142
19.6
19.8
164.3
191.2
34.3
29.5
9.5
8.1
30.8
29.9
4.7
4.1
Godrej Consumer
Neutral
1,490
-
50,724
9,003
10,335
18.1
18.7
34.1
41.8
43.7
35.6
9.4
8.1
23.9
24.8
5.9
5.2
HUL
Neutral
874
-
189,185
33,299
35,497
17.1
17.1
18.9
20.0
46.3
43.7
40.6
35.3
87.6
80.8
5.5
5.2
ITC
Accumulate
350
380
281,612
36,837
39,726
38.8
38.7
12.2
13.5
28.6
26.0
8.0
7.0
27.8
26.9
7.2
6.7
Marico
Neutral
253
-
32,616
6,151
6,966
17.2
17.3
5.4
6.4
46.8
39.5
14.7
11.6
33.2
32.4
5.1
4.5
Nestle*
Neutral
6,529
-
62,950
9,393
10,507
22.2
22.3
106.8
121.8
61.1
53.6
21.5
19.3
34.8
36.7
6.4
5.7
Tata Global
Accumulate
128
137
8,088
8,635
9,072
9.8
9.9
5.8
7.2
22.1
17.8
2.0
1.9
6.8
7.4
1.0
0.9
Procter & Gamble
Buy
6,229
7,369
20,220
2,588
2,939
23.3
23.2
130.2
146.2
47.8
42.6
95.4
91.5
27.6
25.3
7.4
6.4
Hygiene
IT
HCL Tech^
Buy
753
1,000
106,187
37,061
30,781
21.5
20.5
51.4
40.0
14.7
18.8
3.8
2.8
20.1
20.3
2.6
2.8
Infosys
Buy
1,183
1,374
271,625
62,441
70,558
27.5
27.5
59.0
65.3
20.0
18.1
4.0
3.7
22.2
22.4
3.8
3.3
TCS
Buy
2,552
3,004
502,843
108,646
122,770
28.3
28.3
123.7
141.0
20.6
18.1
6.8
6.3
33.1
34.6
4.2
3.7
Tech Mahindra
Buy
535
700
51,903
26,494
30,347
16.3
17.0
32.2
37.5
16.6
14.3
3.6
3.1
21.7
21.8
1.7
1.4
Wipro
Buy
541
680
133,554
50,808
56,189
23.7
23.8
37.3
40.7
14.5
13.3
2.8
2.5
19.2
17.7
2.1
1.8
Media
D B Corp
Neutral
371
-
6,823
2,025
2,187
27.4
27.4
17.4
18.9
21.3
19.7
4.8
4.4
22.9
23.7
3.4
3.1
HT Media
Neutral
79
-
1,838
2,495
2,673
12.9
13.2
6.8
7.2
11.6
11.0
0.9
0.9
7.5
7.8
0.3
0.3
Jagran Prakashan
Buy
170
205
5,548
2,107
2,355
33.5
28.0
10.1
10.8
16.9
15.7
3.9
3.4
23.3
21.7
2.8
2.4
Sun TV Network
Neutral
365
-
14,374
2,510
2,763
71.8
71.5
21.9
24.8
16.7
14.7
3.9
3.6
22.8
24.3
5.1
4.6
Hindustan Media
Neutral
273
-
2,003
914
1,016
21.7
21.5
21.9
23.3
12.5
11.7
2.2
1.9
18.0
16.2
1.6
1.4
Ventures
Metals & Mining
Coal India
Buy
308
380
194,734
76,167
84,130
19.9
22.3
22.4
25.8
13.8
11.9
5.0
4.8
35.5
41.0
1.9
1.7
Hind. Zinc
Neutral
176
-
74,429
14,641
14,026
50.4
50.4
17.7
16.0
10.0
11.0
1.5
1.4
16.2
13.2
2.7
2.6
Hindalco
Neutral
115
-
23,665
104,356
111,186
8.7
9.5
6.7
11.1
17.1
10.4
0.6
0.6
3.5
5.9
0.8
0.7
JSW Steel
Neutral
1,403
-
33,922
42,308
45,147
16.4
20.7
(10.3)
49.5
28.4
1.6
1.5
(1.0)
5.6
1.9
1.7
NMDC
Neutral
90
-
35,801
8,237
10,893
46.6
44.5
10.0
11.7
9.1
7.7
1.0
0.9
12.5
13.0
4.2
3.2
SAIL
Neutral
44
-
18,152
45,915
53,954
7.2
10.5
1.5
4.4
29.2
10.0
0.4
0.4
2.3
4.1
1.0
0.9
Vedanta
Neutral
114
-
33,783
71,445
81,910
26.2
26.3
12.9
19.2
8.9
5.9
0.6
0.6
7.2
8.9
0.9
0.7
Tata Steel
Neutral
324
-
31,448
126,760
137,307
8.9
11.3
6.4
23.1
50.9
14.0
1.0
1.0
2.0
7.1
0.8
0.8
Stock Watch
June 14, 2016
Company Name
Reco
CMP
Target
Mkt Cap
Sales ( Čcr )
OPM(%)
EPS (Č)
PER(x)
P/BV(x)
RoE(%)
EV/Sales(x)
(Č)
Price ( Č)
( Č cr )
FY16E FY17E
FY16E
FY17E
FY16E
FY17E
FY16E
FY17E
FY16E
FY17E
FY16E
FY17E
FY16E
FY17E
Oil & Gas
Cairn India
Neutral
140
-
26,211
11,323
12,490
49.4
51.0
20.7
20.7
6.8
6.8
0.4
0.4
6.4
6.1
1.5
0.8
GAIL
Neutral
371
-
47,048
64,856
70,933
9.1
9.6
24.0
28.9
15.5
12.9
1.3
1.2
8.8
9.6
0.9
0.8
ONGC
Neutral
213
-
182,531
154,564
145,998
36.8
37.4
20.8
22.6
10.3
9.4
1.0
0.9
10.1
9.7
1.4
1.6
Petronet LNG
Neutral
274
-
20,554
29,691
31,188
5.8
6.2
12.8
13.4
21.4
20.4
3.2
2.9
15.8
14.8
0.8
0.7
Indian Oil Corp
Accumulate
416
455
101,027
359,607
402,760
5.9
6.1
42.5
48.7
9.8
8.5
1.3
1.2
14.1
14.4
0.4
0.3
Reliance Industries
Buy
979
1,150
317,533
304,775
344,392
12.6
13.4
91.3
102.6
10.7
9.5
1.2
1.1
11.8
12.0
1.0
0.8
Pharmaceuticals
Alembic Pharma
Neutral
559
-
10,531
3,145
3,483
31.9
16.2
38.2
18.7
14.6
29.9
6.6
5.6
57.9
20.1
3.3
3.0
Aurobindo Pharma
Neutral
750
-
43,861
13,651
15,702
21.7
21.7
33.9
38.4
22.1
19.5
6.2
4.8
32.5
27.7
3.5
3.1
Aventis*
Accumulate
4,202
4,738
9,677
2,049
2,375
15.4
17.3
115.4
153.5
36.4
27.4
5.9
4.6
19.3
25.8
4.5
3.8
Cadila Healthcare
Buy
320
400
32,714
9,469
11,246
21.2
22.0
14.9
17.1
21.5
18.7
6.1
4.8
28.8
26.6
3.4
2.8
Cipla
Neutral
469
-
37,695
13,372
15,378
16.4
17.4
19.6
18.8
23.9
25.0
3.1
2.8
13.1
13.8
2.9
2.8
Dr Reddy's
Accumulate
3,086
3,476
52,632
15,471
17,479
24.6
24.6
138.2
152.4
22.3
20.3
4.1
3.5
19.7
18.7
3.3
3.0
Dishman Pharma
Neutral
144
-
2,326
1,733
1,906
21.5
21.5
10.1
10.0
14.3
14.4
1.7
1.5
10.5
11.2
1.9
1.6
GSK Pharma*
Neutral
3,513
-
29,754
2,870
3,158
20.0
22.1
59.5
68.3
59.0
51.4
17.4
17.9
28.5
34.3
9.8
9.0
Indoco Remedies
Neutral
280
-
2,579
1,033
1,199
15.9
18.2
9.4
13.6
29.8
20.6
4.4
3.8
15.7
19.7
2.6
2.3
Ipca labs
Buy
459
750
5,790
3,363
3,909
12.9
18.6
13.4
28.0
34.3
16.4
2.5
2.1
7.4
14.0
2.0
1.7
Lupin
Buy
1,453
1,809
65,501
13,702
15,912
23.7
26.4
50.5
58.1
28.8
25.0
6.0
4.9
22.9
21.4
5.2
4.1
Sun Pharma
Buy
746
950
179,551
28,163
32,610
25.8
30.7
17.4
26.9
42.9
27.7
4.1
3.5
13.0
16.6
5.8
4.8
Power
Tata Power
Neutral
76
-
20,461
35,923
37,402
22.6
22.8
4.1
5.2
18.7
14.7
1.4
1.3
7.5
9.3
1.5
1.4
NTPC
Neutral
149
-
122,651
87,271
99,297
23.5
23.5
11.8
13.3
12.7
11.2
1.4
1.3
11.5
12.2
2.4
2.2
Power Grid
Accumulate
152
170
79,494
20,702
23,361
86.7
86.4
12.1
13.2
12.6
11.5
1.9
1.7
15.6
15.1
8.8
8.2
Real Estate
MLIFE
Buy
451
554
1,852
826
1,011
20.1
21.9
22.7
30.7
19.9
14.7
1.2
1.1
6.0
7.4
4.2
3.1
Telecom
Bharti Airtel
Neutral
342
-
136,871
101,748
109,191
32.1
31.7
12.0
12.5
28.5
27.4
2.0
1.8
6.9
6.7
2.0
1.8
Idea Cellular
Neutral
100
-
35,988
34,282
36,941
32.0
31.5
5.9
6.2
16.9
16.1
1.6
1.4
9.9
9.3
1.7
1.6
zOthers
Abbott India
Neutral
4,469
-
9,496
2,715
3,153
14.5
14.1
134.3
152.2
33.3
29.4
8.3
6.8
27.4
25.6
3.2
2.7
Bajaj Electricals
Buy
228
268
2,306
4,612
5,351
5.6
5.7
23.4
18.0
9.7
12.7
3.0
2.7
12.5
14.4
0.5
0.4
Finolex Cables
Neutral
348
-
5,324
2,520
2,883
12.2
12.0
12.7
14.2
27.5
24.5
3.7
3.3
13.6
13.5
1.9
1.6
Goodyear India*
Buy
517
631
1,193
1,800
1,600
11.7
11.5
58.7
52.9
8.8
9.8
2.0
1.7
24.6
18.7
0.4
0.4
Hitachi
Neutral
1,245
-
3,384
1,779
2,081
7.8
8.8
21.8
33.4
57.1
37.2
9.2
7.5
17.4
22.1
2.0
1.7
Stock Watch
June 14, 2016
Company Name
Reco
CMP
Target
Mkt Cap
Sales ( Čcr )
OPM(%)
EPS (Č)
PER(x)
P/BV(x)
RoE(%)
EV/Sales(x)
(Č)
Price ( Č)
( Č cr )
FY16E
FY17E
FY16E
FY17E
FY16E
FY17E
FY16E
FY17E
FY16E
FY17E
FY16E
FY17E
FY16E
FY17E
zOthers
Jyothy Laboratories
Neutral
284
-
5,137
1,620
1,847
11.5
11.5
7.3
8.5
38.9
33.5
5.0
4.7
13.3
14.4
3.1
2.6
MRF
Buy
31,973
45,575
13,560
20,316
14,488
21.4
21.1
5,488.0
3,798.0
5.8
8.4
2.0
1.6
41.1
21.2
0.6
0.8
Page Industries
Neutral
13,603
-
15,172
1,929
2,450
19.8
20.1
229.9
299.0
59.2
45.5
26.1
18.1
52.1
47.1
8.1
6.3
Relaxo Footwears
Neutral
453
-
5,437
1,767
2,152
12.3
12.5
19.3
25.1
23.5
18.1
5.8
4.4
27.7
27.8
3.2
2.6
Siyaram Silk Mills
Buy
1,021
1,347
957
1,619
1,799
11.6
11.6
93.5
104.9
10.9
9.7
1.9
1.6
17.1
16.4
0.8
0.8
Styrolution ABS India* Neutral
630
-
1,108
1,271
1,440
8.6
9.2
32.0
41.1
19.7
15.4
2.0
1.8
10.7
12.4
0.8
0.7
TVS Srichakra
Buy
2,352
2,932
1,801
2,035
2,252
15.9
15.3
248.6
268.1
9.5
8.8
4.1
3.0
43.6
33.9
0.9
0.8
HSIL
Buy
265
310
1,914
2,123
2,384
16.1
16.5
15.0
18.9
17.6
14.0
1.4
1.3
8.0
9.4
1.2
1.1
Kirloskar Engines India
Neutral
253
-
3,652
2,403
2,554
8.6
9.9
9.2
10.5
27.5
24.1
2.6
2.5
9.7
10.7
1.2
1.1
Ltd
M M Forgings
Buy
433
546
523
511
615
21.7
21.6
43.1
55.8
10.0
7.8
1.8
1.5
19.9
21.2
1.2
0.9
Banco Products (India) Neutral
139
-
995
1,208
1,353
11.0
12.3
10.8
14.5
12.9
9.6
1.5
1.3
11.9
14.5
0.8
0.7
Competent Automobiles Neutral
145
-
89
1,040
1,137
3.2
3.1
25.7
28.0
5.6
5.2
0.8
0.7
15.0
14.3
0.1
0.1
Nilkamal
Neutral
1,181
-
1,763
1,871
2,031
10.7
10.5
63.2
69.8
18.7
16.9
3.0
2.6
17.6
16.6
1.0
0.9
Visaka Industries
Neutral
154
-
244
1,020
1,120
8.7
9.1
13.9
20.1
11.0
7.6
0.7
0.7
6.4
8.7
0.5
0.4
Transport Corporation of
Neutral
319
-
2,446
2,830
3,350
8.8
9.0
14.4
18.3
22.2
17.5
3.4
3.0
15.4
17.1
0.9
0.8
India
Elecon Engineering
Neutral
61
-
665
1,359
1,482
10.3
13.7
0.8
3.9
76.0
15.7
1.3
1.2
1.6
7.8
0.9
0.8
Surya Roshni
Buy
163
201
716
2,992
3,223
8.1
8.4
14.7
18.3
11.1
8.9
1.0
0.9
9.7
11.0
0.5
0.5
MT Educare
Neutral
174
-
693
286
366
18.3
17.7
7.7
9.4
22.5
18.6
4.7
4.2
20.2
21.1
2.3
1.8
Radico Khaitan
Buy
91
125
1,213
1,543
1,659
12.6
13.0
5.8
6.3
15.8
14.4
1.3
1.2
8.5
8.6
1.3
1.2
Garware Wall Ropes
Buy
340
460
744
828
898
11.2
10.3
28.3
29.0
12.0
11.7
2.0
1.7
16.8
14.9
0.9
0.8
Wonderla Holidays
Neutral
390
-
2,203
206
308
44.0
43.6
9.0
12.9
43.3
30.2
5.9
5.4
13.7
17.8
10.7
7.1
Linc Pen & Plastics
Accumulate
204
235
301
344
382
9.1
9.1
12.4
13.1
16.5
15.6
3.0
2.6
18.0
16.7
1.0
0.9
The Byke Hospitality
Neutral
165
-
660
222
287
20.5
20.5
5.6
7.6
29.2
21.8
5.5
4.5
18.9
20.8
3.1
2.4
Interglobe Aviation
Neutral
980
-
35,319
17,022
21,122
20.7
14.5
63.9
53.7
15.3
18.3
23.0
18.8
149.9
103.2
2.2
1.7
Coffee Day Enterprises
Neutral
253
-
5,221
2,692
2,964
17.0
18.6
-
4.7
-
53.5
3.1
2.9
0.2
5.5
2.4
2.2
Ltd
Navneet Education
Neutral
90
-
2,137
998
1,062
24.1
24.0
5.8
6.1
15.6
14.7
3.4
3.0
22.0
20.6
2.2
2.1
Navkar Corporation
Buy
196
265
2,790
347
408
43.2
42.9
6.7
6.8
29.3
28.9
2.2
2.0
7.3
6.9
8.6
7.8
UFO Moviez
Neutral
534
-
1,474
558
619
32.0
33.2
22.5
30.0
23.7
17.8
2.9
2.5
12.0
13.8
2.5
2.1
VRL Logistics
Neutral
311
-
2,835
1,725
1,902
16.5
16.7
12.2
14.6
25.5
21.3
5.3
4.7
20.8
21.9
1.8
1.6
Stock Watch
June 14, 2016
Company Name
Reco
CMP
Target Mkt Cap
Sales ( Čcr )
OPM(%)
EPS (Č)
PER(x)
P/BV(x)
RoE(%)
EV/Sales(x)
(Č)
Price ( Č)
( Č cr )
FY16E FY17E FY16E FY17E FY16E FY17E FY16E FY17E FY16E FY17E FY16E FY17E FY16E FY17E
zOthers
Team Lease Serv.
Neutral
886
-
1,515
2,565
3,229
1.3
1.5
15.2
22.8
58.4
38.9
4.7
4.2
8.0
10.7
0.5
0.4
S H Kelkar & Co.
Neutral
216
-
3,122
928
1,036
15.3
15.1
4.9
6.1
43.7
35.4
4.1
3.8
9.4
10.7
3.3
3.0
Quick Heal
Neutral
253
-
1,769
339
408
27.8
27.3
7.1
7.7
35.7
32.6
3.0
3.0
8.5
9.3
3.9
3.3
Narayana Hrudaya
Neutral
317
-
6,476
1,603
1,873
10.9
11.5
1.0
2.6
332.7
119.8
8.0
7.4
2.4
6.1
4.1
3.5
Manpasand Bever.
Neutral
546
-
2,733
540
836
19.9
19.6
10.2
16.9
53.3
32.3
4.3
3.9
8.1
12.0
4.8
3.1
Source: Company, Angel Research; Note: *December year end; #September year end; &October year end; Price as on June 13, 2016
Market Outlook
June 14, 2016
Research Team Tel: 022 - 39357800
DISCLAIMER
Angel Broking Private Limited (hereinafter referred to as “Angel”) is a registered Member of National Stock Exchange of India Limited,
Bombay Stock Exchange Limited and Metropolitian Stock Exchange of India Limited. It is also registered as a Depository Participant with
CDSL and Portfolio Manager with SEBI. It also has registration with AMFI as a Mutual Fund Distributor. Angel Broking Private Limited is a
registered entity with SEBI for Research Analyst in terms of SEBI (Research Analyst) Regulations, 2014 vide registration number
INH000000164. Angel or its associates has not been debarred/ suspended by SEBI or any other regulatory authority for accessing
/dealing in securities Market. Angel or its associates including its relatives/analyst do not hold any financial interest/beneficial ownership
of more than 1% in the company covered by Analyst. Angel or its associates/analyst has not received any compensation / managed or co
-managed public offering of securities of the company covered by Analyst during the past twelve months. Angel/analyst has not served as
an officer, director or employee of company covered by Analyst and has not been engaged in market making activity of the company
covered by Analyst.
This document is solely for the personal information of the recipient, and must not be singularly used as the basis of any investment
decision. Nothing in this document should be construed as investment or financial advice. Each recipient of this document should make
such investigations as they deem necessary to arrive at an independent evaluation of an investment in the securities of the companies
referred to in this document (including the merits and risks involved), and should consult their own advisors to determine the merits and
risks of such an investment.
Reports based on technical and derivative analysis center on studying charts of a stock's price movement, outstanding positions and
trading volume, as opposed to focusing on a company's fundamentals and, as such, may not match with a report on a company's
fundamentals.
The information in this document has been printed on the basis of publicly available information, internal data and other reliable sources
believed to be true, but we do not represent that it is accurate or complete and it should not be relied on as such, as this document is for
general guidance only. Angel Broking Pvt. Limited or any of its affiliates/ group companies shall not be in any way responsible for any
loss or damage that may arise to any person from any inadvertent error in the information contained in this report. Angel Broking Pvt.
Limited has not independently verified all the information contained within this document. Accordingly, we cannot testify, nor make any
representation or warranty, express or implied, to the accuracy, contents or data contained within this document. While Angel Broking
Pvt. Limited endeavors to update on a reasonable basis the information discussed in this material, there may be regulatory, compliance,
or other reasons that prevent us from doing so.
This document is being supplied to you solely for your information, and its contents, information or data may not be reproduced,
redistributed or passed on, directly or indirectly.
Neither Angel Broking Pvt. Limited, nor its directors, employees or affiliates shall be liable for any loss or damage that may arise from or
in connection with the use of this information.
Note: Please refer to the important ‘Stock Holding Disclosure' report on the Angel website (Research Section). Also, please refer to the
latest update on respective stocks for the disclosure status in respect of those stocks. Angel Broking Pvt. Limited and its affiliates may have
investment positions in the stocks recommended in this report.