Market Outlook
March 14, 2016
Market Cues
Domestic Indices
Chg (%)
(Pts)
(Close)
Indian markets are expected to open positive tracking SGX Nifty and Asian markets.
BSE Sensex
0.4
95
24,718
Nifty
0.3
24
7,510
Oil prices were up on Friday, following International Energy Agency’s report that
Mid Cap
0.1
9
10,271
said oil prices have bottomed. Baker Hughes data showed U.S. rigs declined by 6.
US markets closed sharply-up on Friday as oil prices rose and investors took more
Small Cap
(0.2)
(17)
10,278
positive view of Thursday’s European Central Bank announcement on stimulus.
Bankex
(0.2)
(32)
17,248
Drillers, refiners and energy companies rose sharply on Friday.
U.K. goods trade deficit dropped to seasonally adjusted £10.29bn from deficit of
Global Indices
Chg (%)
(Pts)
(Close)
£10.45bn in December. Plans by ECB to provide ultra cheap loans to banks and
Dow Jones
1.3
218
17,213
slightly better than expected trade deficit numbers, lifted the Banking sector stocks.
Nasdaq
1.9
86
4,748
Insurance firm Aviva for second day in a row was top index gainer. Mining shares
FTSE
1.7
103
6,140
had risen in early trade on gains in the commodity prices, but the sector then lost
Nikkei
0.5
87
16,939
ground in later part of trading session.
Hang Seng
1.1
216
20,200
Markets witnessed good run-up on the back of ECB stimulus announcement and on
Shanghai Com
0.2
6
2,810
expectations of possible rate cut. Amongst the key induces, Bankex was down 0.2%.
News & Result Analysis
Advances / Declines
BSE
NSE
India Jan IIP at -1.5% MoM
Advances
1,086
642
India to harness 50,000kms waterfront, raise `70k cr: Gadkari
Declines
1,484
899
Detailed analysis on Pg2
Unchanged
155
80
Investor’s Ready Reckoner
Volumes (` Cr)
Key Domestic & Global Indicators
BSE
2,420
Stock Watch: Latest investment recommendations on 150+ stocks
NSE
15,621
Refer Pg4 onwards
Top Picks
Net Inflows (` Cr)
Net
Mtd
Ytd
CMP
Target
Upside
Company
Sector
Rating
FII
1,177
9,566
(24,515)
(`)
(`)
(%)
Amara Raja Batteries Auto & Auto Ancillary
Buy
893
1,040
16.5
MFs
(475)
(2,430)
78,609
HCL Tech
IT
Buy
822
1,038
26.2
LIC Housing Finance Financials
Buy
462
592
28.0
Top Gainers
Price (`)
Chg (%)
Bharat Electronics
Capital Goods
Buy
1,087
1,414
30.1
Wabag
519
5.4
Navkar Corporation Others
Buy
162
265
63.1
Welcorp
98
4.7
More Top Picks on Pg3
Monsanto
1,740
4.7
Key Upcoming Events
Cairn
147
4.6
Previous
Consensus
Date
Region
Event Description
Godrejcp
1,298
4.1
Reading
Expectations
Mar 14 India
Monthly Wholesale Prices (YoY)
(0.90%)
(0.27%)
Mar 15 US
Retail Sales (MoM)
0.2%
(0.1%)
Top Losers
Price (`)
Chg (%)
Mar 16 US
Housing Stats
1.099M
1.150M
Jindalstel
63
(4.6)
Mar 16 GBP
Unemployment Rate (Jan)
5.1%
5.1%
Balramchin
92
(3.8)
Jpinfratec
9
(3.5)
Rajeshexpo
665
(3.4)
Gdl
256
(3.3)
As on March 10, 2016
Market Outlook
March 14, 2016
India Jan IIP at -1.5% MoM; Dec data revised to -1.2%
India's Index of Industrial Production (IIP) for the month of Jan-2016 has come at -
1.5%, missing economists’ expectation of -0.15%. This is the 3rd consecutive month
of decline, led by manufacturing (accounts for over 75% of the index) which
slipped to -2.8% v/s -2.4% month-on-month (MoM) and slower off-take in Capital
Goods. Capital Goods segment showed signs of contraction with 20.4% decline in
Jan-2016 in comparison to 12.4% growth in same period year ago. 10 of the 22
industry groups in manufacturing sector showed negative growth during Jan-2016
as compared to corresponding month of the previous year.
Output of Electricity (Power Generation) sector came in at 6.6% v/s 3.2% (MoM).
Mining sector also showed some signs of growth, as it reported 1.2% growth in the
month, as against a contraction of 1.8% in same month year ago.
Further, the Dec-2016 IIP was revised to -1.2% against -1.3% reported earlier.
The Apr-Jan IIP data has slipped to 2.7% against 3.1% (YoY).
India to harness 50,000kms waterfront, raise `70k cr: Gadkari
Union Minister, Nitin Gadkari said that government would harness 50,000kms of
sea and river fronts as waterways and pursue innovative ways of financing to raise
~`70,000cr towards development of these stretches under Phase-I.
Parliament paved way for development of 111 rivers across the country into
national waterways, by passing Inland waterways bill last week. Currently, only 5
river stretches are declared as national waterways.
In addition to `800cr budgetary allocation, funding alternatives like, tax free
bonds (worth `800cr), multilateral funds, public-private-partnership route, market
borrowings, National Clean Energy Fund and Central Road Fund would be
explored.
Implementation of this water transportation project would be good for the country,
as it currently costs `1.5/km to carry cargo from road, `1/km from rail, whereas,
through waterways it is expected to be ~`0.25/km. On a whole, water transport
as an alternative in the long run would gain increasing prominence over the years,
and bring down the overall logistics costs.
Economic and Political News
FCI to start procurement of 50,000tn pulses from farmers
Annual loss of discoms mount to over `60,000 cr in UP: CAG
Maha paid `798cr for closure of toll plazas
Centre to fastrack implementation of 3 hydro plants in Sikkim
Govt to computerise all ration shops by March 2017: Paswan
Corporate News
NMDC hikes iron ore price by up to `150, peanuts say other miners
RJio to make FY17 tough for telcos, say rating agencies
New gas price for undeveloped discoveries to be $7/MMBtu: ONGC
Coal Ministry slaps show cause notice on GMR for payment delay
Bhushan Steel gets green nod for `3,000cr project in Odisha
Market Outlook
March 14, 2016
Top Picks
Large Cap
M
arket Cap
CM
P
T
arget
Upsid
e
Company
Rationale
(` Cr)
(`)
(`)
(%)
To outpace battery industry growth due to better technological
Amara Raja Batteries
15,249
893
1,040
16.5
products leading to market share gains in both the automotive
OEM and replacement segments.
Earnings to grow strongly given the MHCV cyclical upturn.
Ashok Leyland
27,605
97
111
14.4
Focus on exports and LCV's provides additional growth
avenue.
Uptick in defense capex by government when coupled with
Bharat Electronics
26,083
1,087
1,414
30.1
BELs strong market positioning, indicate that good times are
ahead for BEL.
The stock is trading at attractive valuations and is factoring all
HCL Tech
1,15,969
822
1,038
26.2
the bad news.
Strong visibility for a robust 20% earnings trajectory, coupled
HDFC Bank
2,59,796
1,028
1,262
22.7
with high quality of earnings on account of high quality retail
business and strategic focus on highly rated corporates.
Back on the growth trend, expect a long term growth of 14%
Infosys
2,63,283
1,143
1,347
17.9
to be a US$20bn in FY2020.
LICHF continues to grow its retail loan book at a healthy pace
with improvement in asset quality. We expect the company to
LIC Housing Finance
23,328
462
592
28.0
post a healthy loan book which is likely to reflect in a strong
earnings growth.
Huge bid pipeline of re-development works at Delhi and other
NBCC
11,203
934
1,089
16.6
State Governments and opportunity from Smart City, positions
NBCC to report strong growth, going forward.
New launches to enable outpace industry growth; margins
TVS Motors
13,683
288
330
14.6
expansion to boost earnings.
Source: Company, Angel Research
Mid Cap
M
arket Cap
CM
P
T
arget
Upsid
e
Company
Rationale
(` Cr)
(`)
(`)
(%)
Favourable outlook for the AC industry to augur well for
Cooling products business which is out pacing the market
Blue Star
3,003
334
439
31.5
growth. EMPPAC division's profitability to improve once
operating environment turns around.
Commencement of new projects, downtrend in the interest rate
IL&FS Transport
2,434
74
93
25.7
cycle, to lead to stock re-rating
Economic recovery to have favourable impact on advertising &
circulation revenue growth. Further, the acquisition of a radio
Jagran Prakashan
4,961
152
189
24.5
business (Radio City) would also boost the company's revenue
growth.
Speedier execution and speedier sales, strong revenue visibilty
Mahindra Lifespace
1,738
424
554
30.8
in short-to-long run, attractive valuations
Massive capacity expansion along with rail advantage at ICD
Navkar Corporation
2,317
162
265
63.1
as well CFS augurs well for the company
Earnings boost on back of stable material prices and
Radico Khaitan
1,330
100
156
56.1
favourable pricing environment. Valuation discount to peers
provides additional comfort
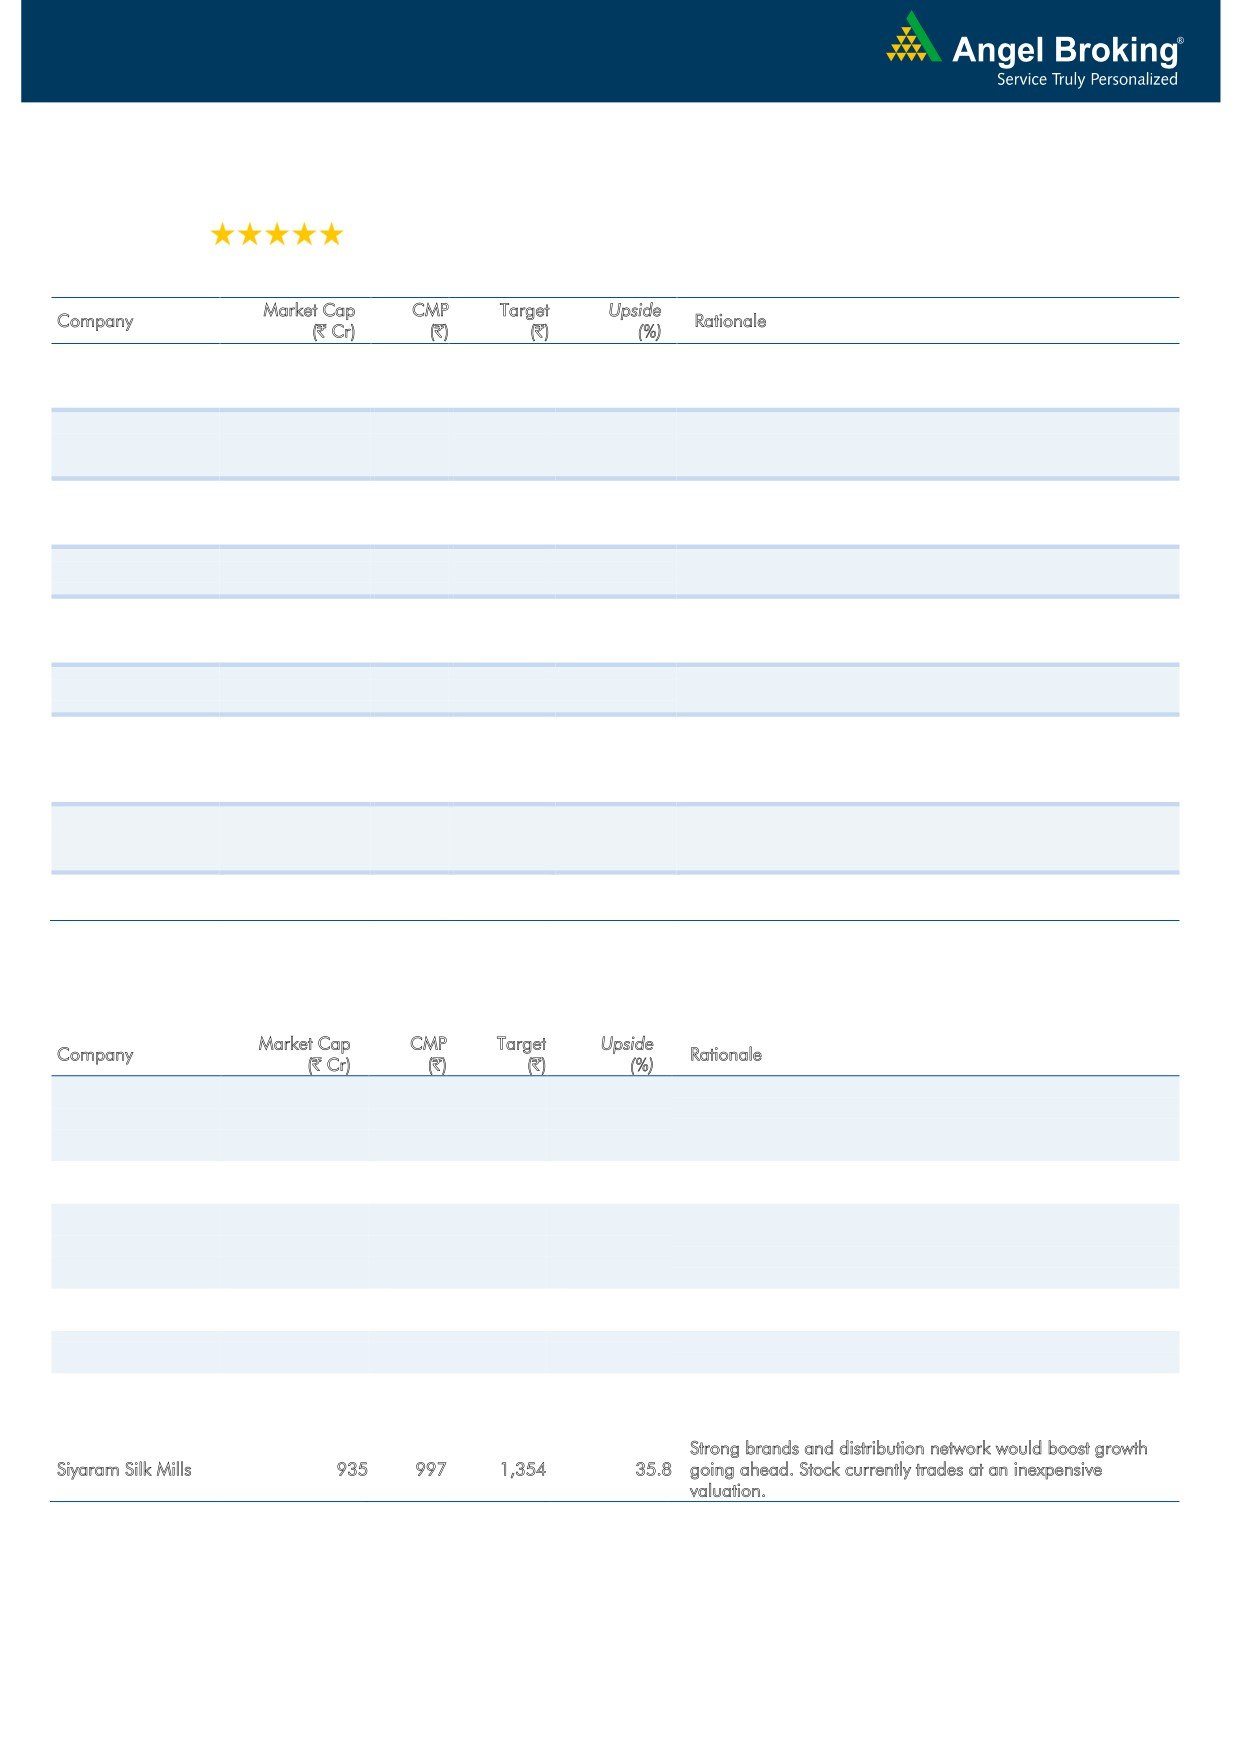
Strong brand
s and
d
istribution network would
boost growth
Siyaram Silk M
ills
935
997
1,354
35.8
going ahead
. Stock currently trad
es at an inexpensive
valuation.
Source: Company, Angel Research
Market Outlook
March 14, 2016
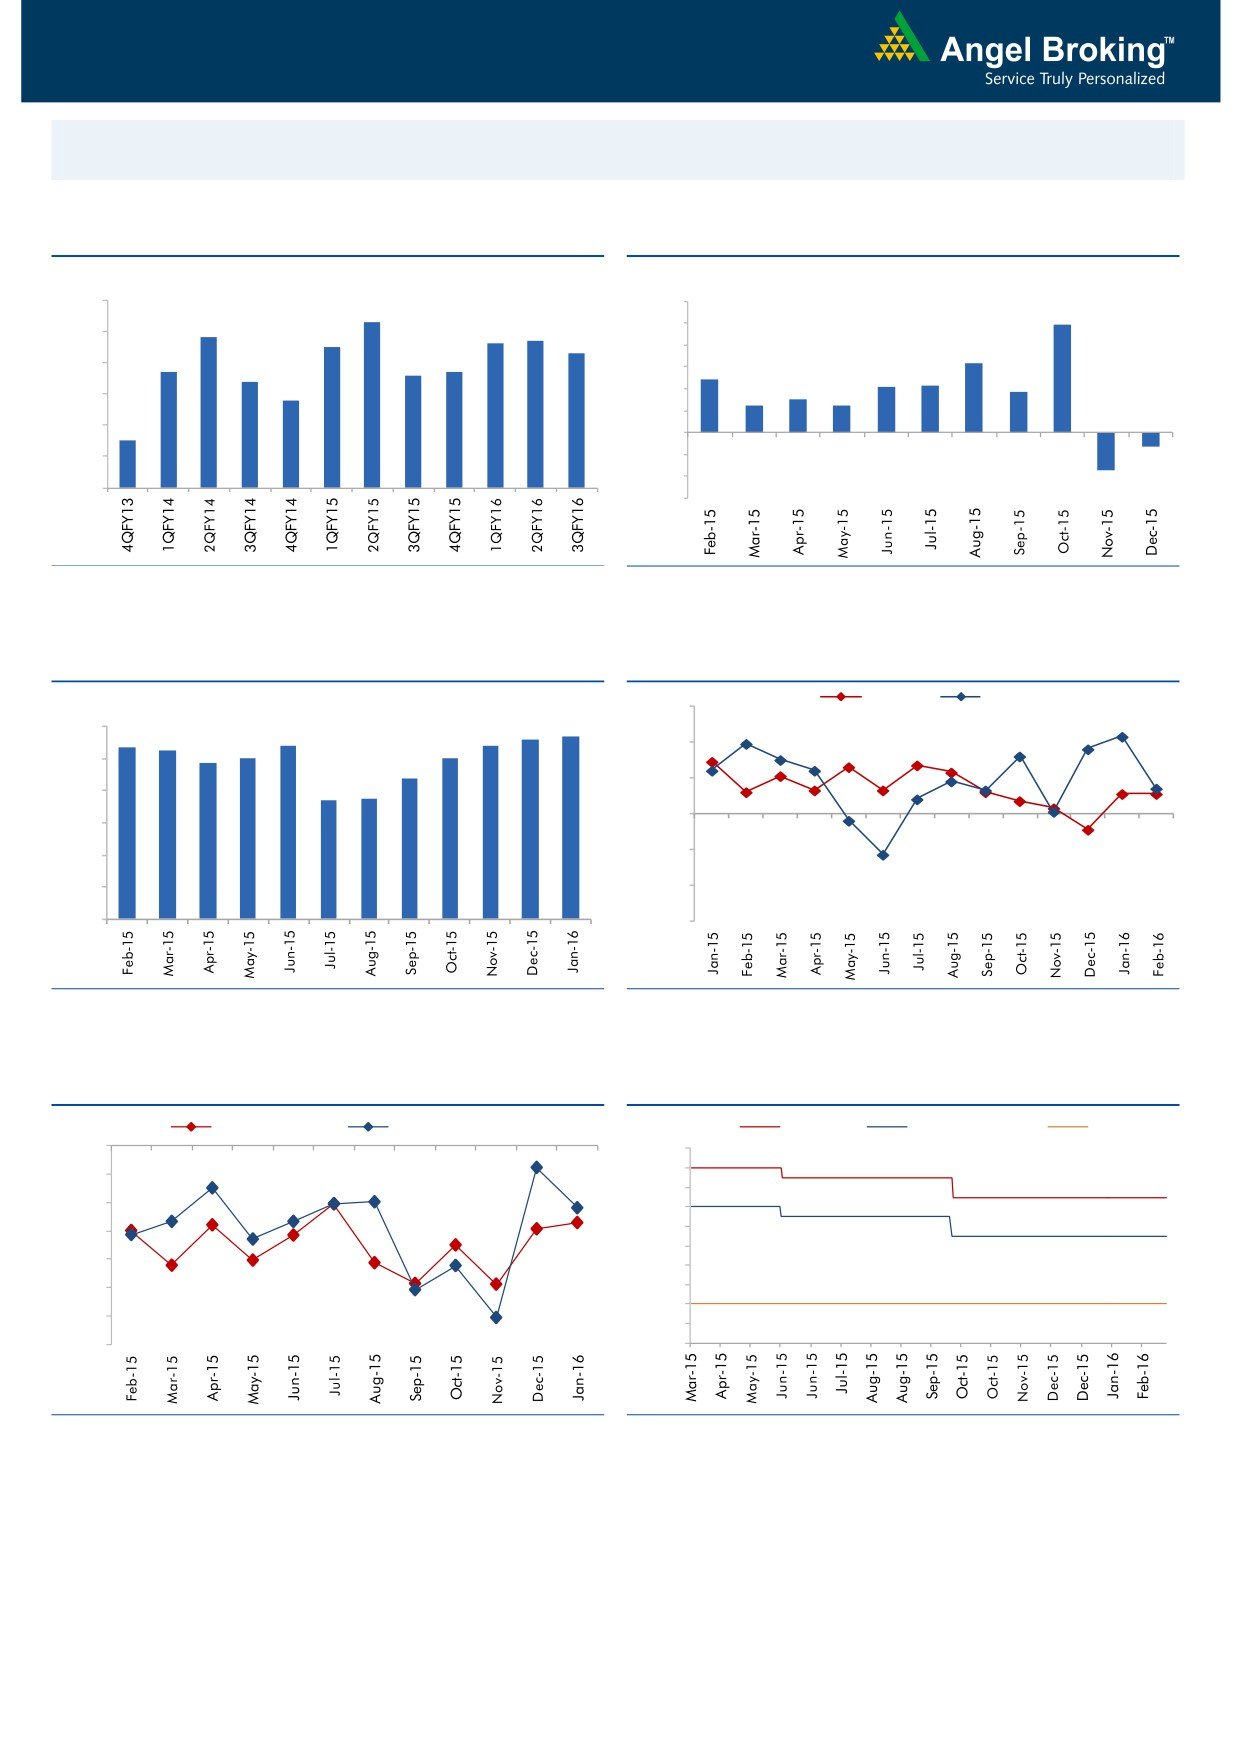
Macro watch
Exhibit 1: Quarterly GDP trends
Exhibit 2: IIP trends
(%)
(%)
9.0
12.0
8.3
9.9
7.8
7.6
7.7
10.0
8.0
7.5
7.3
8.0
6.3
6.7
6.6
6.7
7.0
6.4
4.8
6.0
4.2
4.3
3.7
5.8
3.0
4.0
2.5
2.5
6.0
2.0
5.0
4.5
-
4.0
(2.0)
(1.3)
(4.0)
3.0
(3.4)
(6.0)
Source: CSO, Angel Research
Source: MOSPI, Angel Research
Exhibit 3: Monthly CPI inflation trends
Exhibit 4: Manufacturing and services PMI
Mfg. PMI
Services PMI
(%)
56.0
5.6
5.7
6.0
5.4
5.4
5.4
5.3
4.9
5.0
5.0
54.0
5.0
4.4
3.7
3.7
52.0
4.0
50.0
3.0
48.0
2.0
1.0
46.0
-
44.0
Source: MOSPI, Angel Research
Source: Market, Angel Research; Note: Level above 50 indicates expansion
Exhibit 5: Exports and imports growth trends
Exhibit 6: Key policy rates
(%)
Exports yoy growth
Imports yoy growth
(%)
Repo rate
Reverse Repo rate
CRR
0.0
8.00
7.50
(5.0)
7.00
(10.0)
6.50
6.00
(15.0)
5.50
(20.0)
5.00
(25.0)
4.50
4.00
(30.0)
3.50
(35.0)
3.00
Source: Bloomberg, Angel Research
Source: RBI, Angel Research
Market Outlook
March 14, 2016
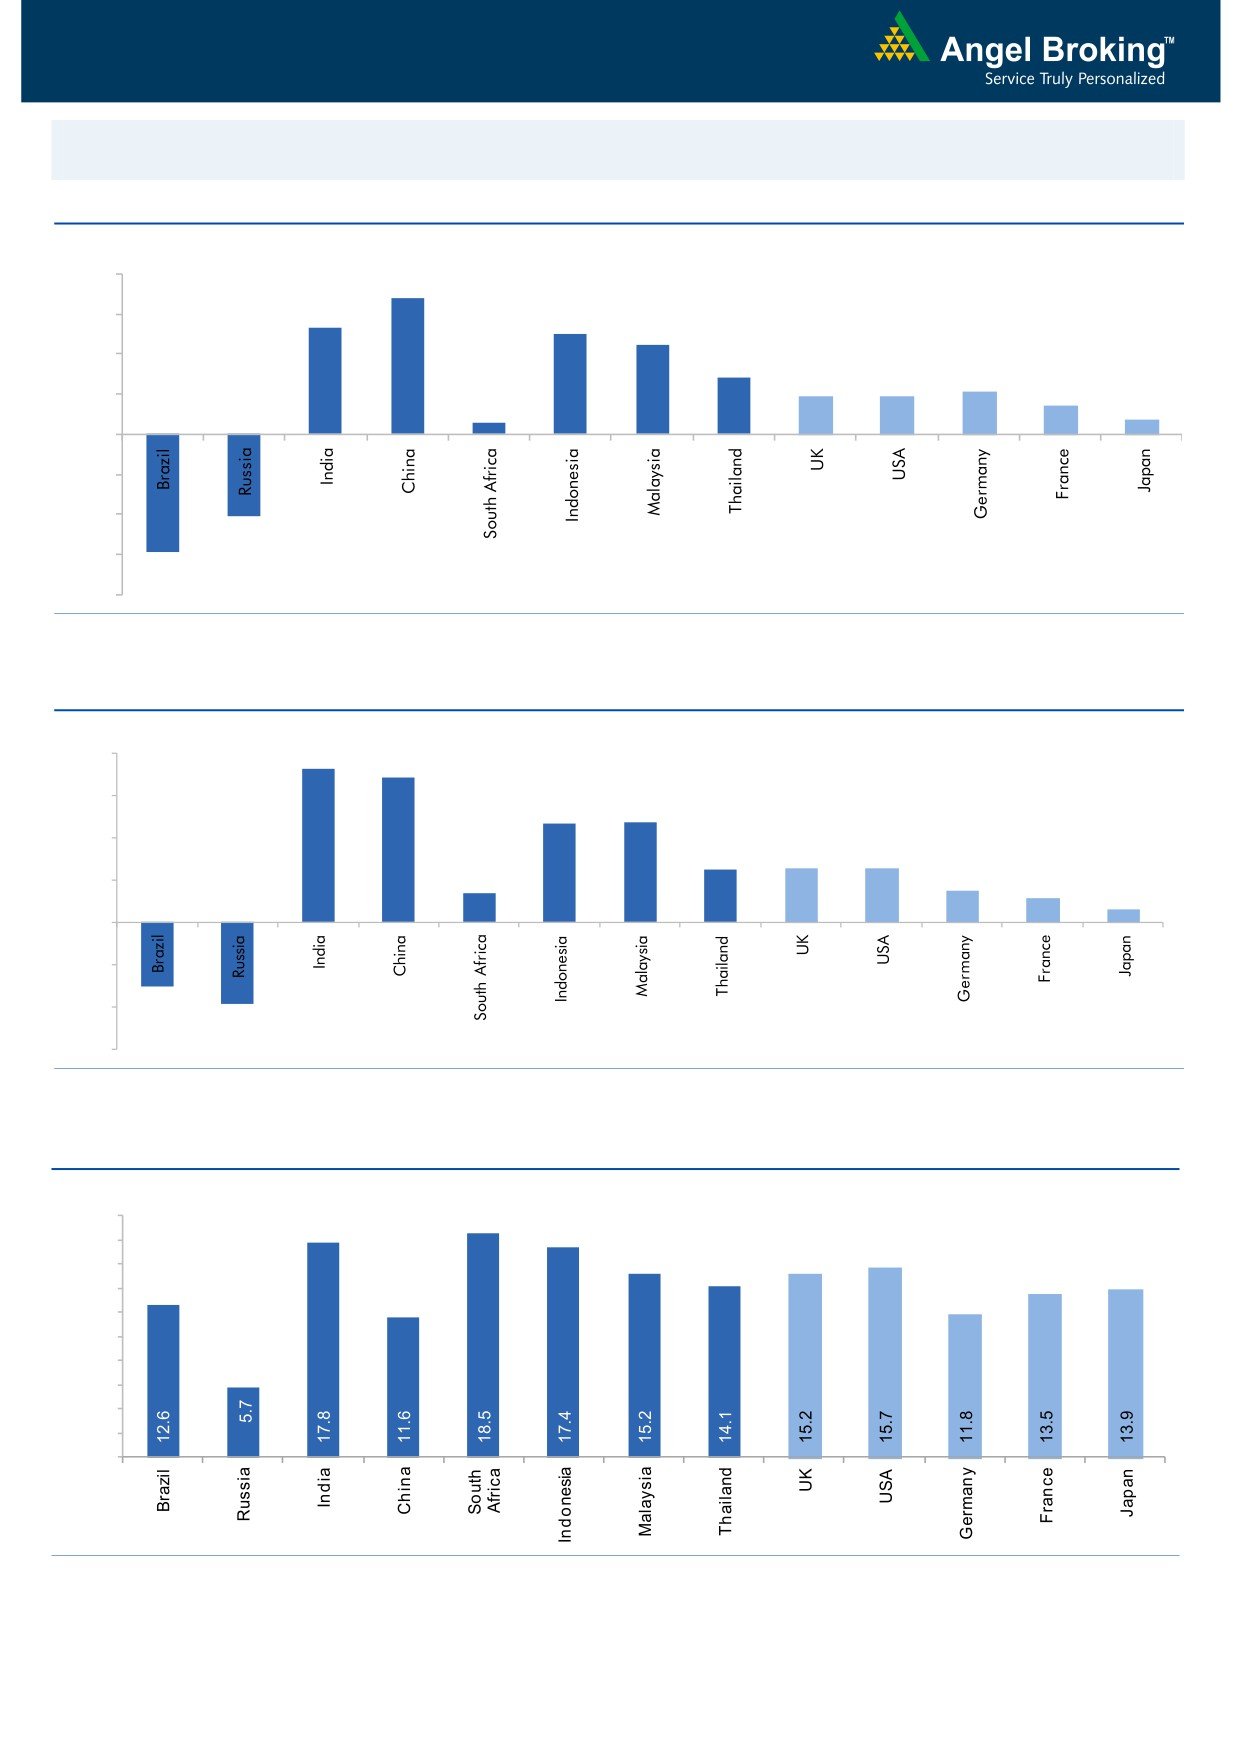
Global watch
Exhibit 1: Latest quarterly GDP Growth (%, yoy) across select developing and developed countries
(%)
8.0
6.8
6.0
5.3
5.0
4.5
4.0
2.8
1.9
1.9
2.1
1.4
2.0
0.6
0.7
-
(2.0)
(4.0)
(4.1)
(6.0)
(5.9)
(8.0)
Source: Bloomberg, Angel Research
Exhibit 2: 2015 GDP Growth projection by IMF (%, yoy) across select developing and developed countries
(%)
8.0
7.3
6.8
6.0
4.7
4.7
4.0
2.5
2.5
2.6
1.4
1.5
2.0
1.2
0.6
-
(2.0)
(3.0)
(4.0)
(3.8)
(6.0)
Source: IMF, Angel Research
Exhibit 3: One year forward P-E ratio across select developing and developed countries
(x)
20.0
18.0
16.0
14.0
12.0
10.0
8.0
6.0
4.0
2.0
-
Source: IMF, Angel Research
Market Outlook
March 14, 2016
Exhibit 4: Relative performance of indices across globe
Returns (%)
Country
Name of index
Closing price
1M
3M
1YR
Brazil
Bovespa
49,639
22.9
7.0
(1.6)
Russia
Micex
1,877
7.6
6.9
12.3
India
Nifty
7,510
2.9
(1.3)
(14.2)
China
Shanghai Composite
2,810
2.7
(19.2)
(12.1)
South Africa
Top 40
45,761
6.4
2.7
(1.2)
Mexico
Mexbol
44,736
5.2
5.5
1.5
Indonesia
LQ45
839
1.7
8.5
(11.5)
Malaysia
KLCI
1,697
3.2
1.4
(6.1)
Thailand
SET 50
900
9.5
7.4
(13.4)
USA
Dow Jones
17,213
7.5
(2.0)
(3.0)
UK
FTSE
6,140
8.2
0.2
(9.8)
Japan
Nikkei
16,939
5.3
(14.0)
(9.4)
Germany
DAX
9,831
9.0
(7.9)
(19.2)
France
CAC
4,493
10.6
(3.1)
(10.8)
Source: Bloomberg, Angel Research
Stock Watch
March 14, 2016
Company Name
Reco
CMP
Target
Mkt Cap
Sales ( Čcr )
OPM(%)
EPS (Č)
PER(x)
P/BV(x)
RoE(%)
EV/Sales(x)
(Č)
Price ( Č)
( Č cr )
FY16E FY17E
FY16E
FY17E
FY16E
FY17E
FY16E
FY17E
FY16E
FY17E
FY16E
FY17E
FY16E
FY17E
Agri / Agri Chemical
Rallis
Neutral
157
-
3,057
2,097
2,415
14.4
14.4
9.5
11.0
16.6
14.3
3.3
2.8
21.1
21.3
1.5
1.3
United Phosphorus
Accumulate
439
480
18,811
12,500
14,375
18.3
18.3
29.8
35.9
14.7
12.2
2.7
2.3
20.0
20.3
1.6
1.3
Auto & Auto Ancillary
Ashok Leyland
Accumulate
97
111
27,605
17,995
21,544
11.4
11.6
3.4
4.7
28.5
20.6
5.0
4.6
17.7
22.2
1.5
1.2
Bajaj Auto
Accumulate
2,326
2,585
67,301
22,709
25,860
20.9
20.1
129.0
143.6
18.0
16.2
5.5
4.8
30.7
29.4
2.5
2.2
Bharat Forge
Accumulate
818
875
19,036
7,351
8,318
19.9
19.7
31.2
36.5
26.2
22.4
4.7
4.0
19.3
19.2
2.7
2.4
Eicher Motors
Neutral
20,004
-
54,333
15,556
16,747
15.5
17.3
464.8
597.5
43.0
33.5
15.7
11.6
36.2
34.3
3.4
3.1
Gabriel India
Buy
86
101
1,240
1,415
1,544
8.7
9.0
4.6
5.4
18.8
16.0
3.4
3.0
18.1
18.9
0.9
0.8
Hero Motocorp
Neutral
2,811
-
56,122
28,244
30,532
15.5
15.9
156.7
168.5
17.9
16.7
7.2
6.1
39.9
36.4
1.8
1.7
Jamna Auto Industries Buy
136
160
1,088
1,281
1,473
11.2
11.5
7.6
9.2
17.9
14.8
4.5
3.7
25.4
25.2
0.9
0.8
L G Balakrishnan & Bros Neutral
427
-
670
1,254
1,394
11.6
11.8
35.9
41.7
11.9
10.2
1.6
1.4
13.5
13.8
0.6
0.6
Mahindra and Mahindra Accumulate
1,220
1,364
75,770
38,416
42,904
13.7
13.9
54.8
63.4
22.3
19.2
3.4
3.1
15.4
15.8
1.6
1.4
Maruti
Neutral
3,639
-
109,916
57,865
68,104
16.4
16.7
176.3
225.5
20.6
16.1
4.0
3.4
19.4
21.2
1.7
1.4
Minda Industries
Accumulate
914
1,047
1,450
2,523
2,890
8.7
9.0
55.0
65.4
16.6
14.0
3.2
2.6
19.3
18.7
0.7
0.6
Motherson Sumi
Buy
245
313
32,354
39,343
45,100
8.8
9.1
10.1
12.5
24.2
19.6
7.7
6.0
35.3
34.4
0.9
0.8
Rane Brake Lining
Buy
378
465
299
454
511
11.5
12.0
25.2
31.0
15.0
12.2
2.2
2.0
14.9
16.6
0.8
0.7
Setco Automotive
Neutral
30
-
404
594
741
12.7
13.7
1.7
3.2
17.8
9.5
1.9
1.6
10.4
16.9
1.1
0.9
Tata Motors
Neutral
354
-
102,207
259,686
273,957
13.0
13.4
25.9
29.5
13.7
12.0
1.8
1.6
8.0
9.0
0.6
0.6
TVS Motor
Accumulate
288
330
13,683
11,263
13,122
6.9
8.5
9.2
15.0
31.3
19.2
7.2
5.7
22.7
29.6
1.2
1.0
Amara Raja Batteries
Buy
893
1,040
15,249
4,892
5,871
17.4
17.6
28.8
37.1
31.0
24.1
7.2
5.8
23.4
24.1
3.1
2.5
Exide Industries
Buy
132
162
11,216
6,950
7,784
14.4
14.8
6.6
7.3
20.0
18.1
2.5
2.3
12.6
12.8
1.3
1.2
Apollo Tyres
Accumulate
168
183
8,531
12,056
12,714
17.2
16.4
23.0
20.3
7.3
8.3
1.3
1.1
17.7
13.6
0.8
0.8
Ceat
Accumulate
1,056
1,119
4,272
6,041
6,597
14.1
13.7
99.5
111.9
10.6
9.4
2.1
1.8
19.6
18.5
0.9
0.7
JK Tyres
Neutral
81
-
1,845
7,446
7,669
15.2
14.0
19.6
18.4
4.2
4.4
1.0
0.9
25.2
19.5
0.6
0.6
Swaraj Engines
Accumulate
852
919
1,058
552
630
14.2
14.7
44.6
54.1
19.1
15.8
4.4
4.0
23.2
25.6
1.8
1.5
Subros
Neutral
86
-
518
1,293
1,527
11.8
11.9
4.2
6.7
20.6
12.9
1.6
1.4
7.7
11.5
0.7
0.6
Indag Rubber
Neutral
170
-
445
283
329
17.0
17.2
13.0
15.4
13.1
11.0
2.9
2.4
21.8
21.6
1.3
1.1
Capital Goods
ACE
Neutral
37
-
366
660
839
4.7
8.2
1.0
3.9
37.0
9.5
1.2
1.0
3.2
11.3
0.7
0.6
BEML
Accumulate
1,036
1,157
4,313
3,277
4,006
6.0
8.9
36.2
64.3
28.6
16.1
2.0
1.8
5.7
11.7
1.4
1.1
Bharat Electronics
Buy
1,087
1,414
26,083
7,737
8,634
16.8
17.2
54.0
61.5
20.1
17.7
2.9
2.6
39.3
45.6
2.5
2.1
Stock Watch
March 14, 2016
Company Name
Reco
CMP
Target
Mkt Cap
Sales ( Čcr )
OPM(%)
EPS (Č)
PER(x)
P/BV(x)
RoE(%)
EV/Sales(x)
(Č)
Price ( Č)
( Č cr )
FY16E
FY17E
FY16E
FY17E
FY16E
FY17E
FY16E
FY17E
FY16E
FY17E
FY16E
FY17E
FY16E
FY17E
Capital Goods
Voltas
Buy
247
353
8,184
5,363
5,963
8.0
9.1
11.0
13.8
22.5
17.9
3.5
3.0
16.2
17.9
1.5
1.3
BGR Energy
Neutral
103
-
741
3,615
3,181
9.5
9.4
16.7
12.4
6.2
8.3
0.6
0.6
10.0
7.0
0.6
0.8
BHEL
Neutral
104
-
25,369
33,722
35,272
10.8
11.7
10.5
14.2
9.9
7.3
0.7
0.7
7.0
9.0
0.8
0.8
Blue Star
Buy
334
439
3,003
3,548
3,977
6.3
6.9
13.7
17.2
24.4
19.5
6.1
4.0
26.1
25.4
0.9
0.8
Crompton Greaves
Neutral
146
-
9,172
13,484
14,687
4.9
6.2
4.5
7.1
32.5
20.6
2.3
2.2
7.2
10.8
0.8
0.7
Greaves Cotton
Neutral
125
-
3,062
1,655
1,755
16.6
16.8
7.4
7.8
17.0
16.1
3.4
3.2
21.1
20.6
1.8
1.7
Inox Wind
Buy
259
458
5,737
4,980
5,943
17.0
17.5
26.6
31.6
9.7
8.2
2.9
2.1
35.0
30.0
1.3
1.0
KEC International
Neutral
117
-
3,014
8,791
9,716
6.1
6.8
5.4
8.2
21.7
14.3
2.2
2.0
10.0
14.0
0.6
0.5
Thermax
Neutral
759
-
9,042
6,413
7,525
7.4
8.5
30.5
39.3
24.9
19.3
3.8
3.3
15.0
17.0
1.4
1.1
Cement
ACC
Neutral
1,227
-
23,039
13,151
14,757
16.4
18.3
63.9
83.4
19.2
14.7
2.5
2.3
13.3
16.1
1.6
1.3
Ambuja Cements
Neutral
201
-
31,154
11,564
12,556
19.4
20.7
8.9
10.1
22.6
19.9
2.8
2.7
12.8
13.8
2.3
2.1
HeidelbergCement
Neutral
73
-
1,643
1,772
1,926
13.3
15.4
1.0
3.0
72.5
24.2
1.8
1.7
2.6
7.9
1.5
1.3
India Cements
Neutral
75
-
2,298
4,216
4,840
18.0
19.5
4.0
9.9
18.7
7.6
0.8
0.7
4.0
9.5
0.9
0.7
JK Cement
Neutral
582
-
4,069
3,661
4,742
10.1
15.8
7.5
28.5
77.6
20.4
2.3
2.1
7.5
22.9
1.6
1.2
J K Lakshmi Cement
Neutral
298
-
3,512
2,947
3,616
16.7
19.9
11.5
27.2
26.0
11.0
2.5
2.1
9.8
20.8
1.6
1.3
Mangalam Cements
Neutral
181
-
484
1,053
1,347
10.5
13.3
8.4
26.0
21.6
7.0
0.9
0.8
4.3
12.5
0.8
0.6
Orient Cement
Neutral
139
-
2,850
1,854
2,524
21.2
22.2
7.7
11.1
18.1
12.5
2.6
2.2
13.3
15.7
2.3
1.6
Ramco Cements
Neutral
381
-
9,060
4,036
4,545
20.8
21.3
15.1
18.8
25.2
20.2
3.1
2.7
12.9
14.3
2.8
2.4
Shree Cement^
Neutral
11,276
-
39,281
7,150
8,742
26.7
28.6
228.0
345.5
49.5
32.6
7.3
6.1
15.7
20.3
5.2
4.2
UltraTech Cement
Neutral
2,991
-
82,068
24,669
29,265
18.2
20.6
82.0
120.0
36.5
24.9
3.9
3.4
11.3
14.7
3.4
2.9
Construction
ITNL
Buy
74
93
2,434
7,360
8,825
34.0
35.9
7.0
9.0
10.6
8.2
0.4
0.3
3.2
3.7
3.7
3.6
KNR Constructions
Buy
517
603
1,455
937
1,470
14.3
14.0
44.2
38.6
11.7
13.4
2.3
2.0
15.4
15.4
1.6
1.1
Larsen & Toubro
Accumulate
1,186
1,310
110,455
58,870
65,708
8.3
10.3
42.0
53.0
28.2
22.4
2.0
1.8
8.8
11.2
2.1
1.9
Gujarat Pipavav Port
Neutral
159
-
7,670
629
684
51.0
52.2
6.4
5.9
24.8
26.9
3.3
3.0
15.9
12.7
11.8
10.7
MBL Infrastructures
Buy
138
285
570
2,313
2,797
12.2
14.6
19.0
20.0
7.2
6.9
0.8
0.7
11.3
10.6
1.0
0.9
Nagarjuna Const.
Neutral
68
-
3,775
7,892
8,842
8.8
9.1
3.0
5.3
22.6
12.8
1.1
1.0
5.0
8.5
0.7
0.6
PNC Infratech
Accumulate
491
558
2,517
1,873
2,288
13.2
13.5
24.0
32.0
20.4
15.3
2.0
1.8
12.1
12.3
1.5
1.2
Simplex Infra
Neutral
211
-
1,045
5,955
6,829
10.3
10.5
16.0
31.0
13.2
6.8
0.7
0.6
5.3
9.9
0.7
0.6
Power Mech Projects
Neutral
577
-
849
1,539
1,801
12.8
12.7
59.0
72.1
9.8
8.0
1.5
1.3
18.6
16.8
0.6
0.5
Stock Watch
March 14, 2016
Company Name
Reco
CMP
Target
Mkt Cap
Sales ( Čcr )
OPM(%)
EPS (Č)
PER(x)
P/BV(x)
RoE(%)
EV/Sales(x)
(Č)
Price ( Č)
( Č cr )
FY16E
FY17E
FY16E
FY17E
FY16E
FY17E
FY16E
FY17E
FY16E
FY17E
FY16E
FY17E
FY16E
FY17E
Construction
Sadbhav Engineering
Buy
246
289
4,226
3,481
4,219
10.7
10.8
8.2
11.7
30.0
21.1
2.9
2.5
10.3
13.5
1.5
1.2
NBCC
Buy
934
1,089
11,203
5,816
7,382
6.9
7.7
29.6
39.8
31.5
23.5
5.7
4.5
24.1
26.7
1.7
1.3
MEP Infra
Neutral
39
-
639
1,956
1,876
28.1
30.5
1.3
3.0
30.2
13.1
6.3
4.3
21.2
32.8
1.7
1.7
SIPL
Neutral
90
-
3,168
675
1,042
62.4
64.7
-
-
3.4
3.8
-
-
16.4
11.0
Financials
Allahabad Bank
Neutral
51
-
3,048
8,569
9,392
2.8
2.9
16.3
27.5
3.1
1.9
0.3
0.2
7.6
11.9
-
-
Axis Bank
Buy
412
494
98,215
26,473
31,527
3.5
3.6
35.7
43.5
11.5
9.5
1.9
1.7
17.9
18.9
-
-
Bank of Baroda
Neutral
141
-
32,431
18,485
21,025
1.9
2.0
13.5
21.1
10.5
6.7
0.8
0.7
7.3
10.6
-
-
Bank of India
Neutral
93
-
7,587
15,972
17,271
1.9
2.0
15.3
33.4
6.1
2.8
0.3
0.2
3.6
7.6
-
-
Canara Bank
Neutral
182
-
9,901
15,441
16,945
2.0
2.1
46.6
70.4
3.9
2.6
0.3
0.3
8.0
11.2
-
-
Dena Bank
Neutral
28
-
1,826
3,440
3,840
2.1
2.3
7.3
10.0
3.9
2.8
0.3
0.2
6.1
7.9
-
-
Federal Bank
Neutral
49
-
8,340
3,477
3,999
3.0
3.0
5.0
6.2
9.7
7.8
1.0
0.9
10.6
11.9
-
-
HDFC
Neutral
1,159
-
183,005
10,358
11,852
3.3
3.3
41.1
47.0
28.2
24.6
5.4
4.9
24.7
24.9
-
-
HDFC Bank
Buy
1,028
1,262
259,796
38,309
47,302
4.3
4.3
49.3
61.1
20.9
16.9
3.6
3.1
18.5
19.7
-
-
ICICI Bank
Buy
214
254
124,296
34,279
39,262
3.3
3.3
21.0
24.4
10.2
8.8
1.7
1.5
14.4
14.7
-
-
IDBI Bank
Neutral
65
-
12,369
9,625
10,455
1.8
1.8
8.5
14.2
7.6
4.6
0.5
0.4
5.9
9.3
-
-
Indian Bank
Neutral
101
-
4,827
6,160
6,858
2.5
2.5
24.5
29.8
4.1
3.4
0.3
0.3
7.7
8.6
-
-
LIC Housing Finance
Buy
462
592
23,328
3,101
3,745
2.5
2.5
33.0
40.2
14.0
11.5
2.6
2.2
19.7
20.5
-
-
Oriental Bank
Neutral
88
-
2,624
7,643
8,373
2.4
2.4
37.2
45.4
2.4
1.9
0.2
0.2
8.2
9.4
-
-
Punjab Natl.Bank
Neutral
82
-
16,082
23,638
26,557
2.8
2.8
17.9
27.2
4.6
3.0
0.5
0.4
8.5
12.0
-
-
South Ind.Bank
Neutral
17
-
2,356
1,965
2,185
2.5
2.5
2.5
3.3
7.0
5.3
0.7
0.6
9.5
11.7
-
-
St Bk of India
Neutral
180
-
140,002
79,958
86,061
2.6
2.6
13.4
20.7
13.5
8.7
1.1
1.0
11.5
12.8
-
-
Union Bank
Neutral
124
-
8,541
12,646
14,129
2.3
2.4
31.0
39.1
4.0
3.2
0.4
0.4
9.8
11.4
-
-
Vijaya Bank
Neutral
32
-
2,715
3,536
3,827
1.9
1.9
5.5
6.7
5.7
4.8
0.5
0.4
7.8
8.8
-
-
Yes Bank
Neutral
800
-
33,606
7,190
9,011
3.2
3.3
58.2
69.7
13.7
11.5
2.5
2.1
19.2
19.6
-
-
FMCG
Asian Paints
Neutral
896
-
85,959
16,553
19,160
16.0
16.2
17.7
21.5
50.7
41.7
13.5
12.1
29.4
31.2
5.0
4.3
Britannia
Neutral
2,816
-
33,781
8,481
9,795
14.0
14.1
65.5
78.3
43.0
36.0
20.3
16.7
38.3
41.2
3.9
3.3
Colgate
Neutral
813
-
22,102
4,836
5,490
19.5
19.7
48.5
53.2
16.8
15.3
12.3
10.7
99.8
97.5
4.5
3.9
Dabur India
Accumulate
250
267
43,926
9,370
10,265
17.1
17.2
7.3
8.1
34.0
30.8
10.3
8.4
33.7
30.6
4.6
4.2
GlaxoSmith Con*
Accumulate
5,690
6,118
23,930
4,919
5,742
17.2
17.4
168.3
191.2
33.8
29.8
9.6
8.2
28.8
28.9
4.4
3.8
Stock Watch
March 14, 2016
Company Name
Reco
CMP
Target
Mkt Cap
Sales ( Čcr )
OPM(%)
EPS (Č)
PER(x)
P/BV(x)
RoE(%)
EV/Sales(x)
(Č)
Price ( Č)
( Č cr )
FY16E FY17E
FY16E
FY17E
FY16E
FY17E
FY16E
FY17E
FY16E
FY17E
FY16E
FY17E
FY16E
FY17E
FMCG
Godrej Consumer
Neutral
1,300
-
44,259
10,168
12,886
16.1
16.1
32.1
38.4
40.5
33.9
8.2
7.6
19.7
21.0
4.5
3.5
HUL
Neutral
849
-
183,745
34,940
38,957
17.5
17.7
20.8
24.7
40.8
34.4
45.4
36.3
110.5
114.2
5.1
4.5
ITC
Accumulate
321
359
258,109
36,804
38,776
37.9
37.9
12.2
12.9
26.3
24.9
7.3
6.4
27.7
25.8
6.6
6.2
Marico
Neutral
246
-
31,693
6,551
7,766
15.7
16.0
10.4
12.5
23.7
19.7
6.9
5.7
33.2
32.4
4.8
4.0
Nestle*
Buy
5,176
6,646
49,906
11,291
12,847
22.2
22.3
158.9
184.6
32.6
28.0
17.0
15.3
55.0
57.3
4.3
3.7
Tata Global
Buy
116
144
7,312
8,635
9,072
9.8
9.9
6.5
7.6
17.8
15.2
1.8
1.7
6.8
7.4
0.8
0.7
IT
HCL Tech^
Buy
822
1,038
115,969
42,038
47,503
21.2
21.5
51.5
57.7
16.0
14.3
3.5
2.7
21.5
18.8
2.4
1.9
Infosys
Buy
1,143
1,347
263,283
61,850
69,981
27.5
27.5
59.4
65.7
19.2
17.4
4.1
3.5
21.2
20.1
3.5
3.0
TCS
Buy
2,366
2,854
466,203
108,487
122,590
28.3
28.5
122.8
138.4
19.3
17.1
7.3
6.7
38.0
38.9
3.9
3.4
Tech Mahindra
Buy
458
530
44,340
26,524
29,177
16.2
17.0
28.8
33.6
15.9
13.6
3.1
2.6
19.3
19.1
1.4
1.2
Wipro
Buy
541
680
133,636
50,808
56,189
23.7
23.8
37.3
40.7
14.5
13.3
2.8
2.5
19.2
17.7
2.1
1.7
Media
D B Corp
Accumulate
322
356
5,914
2,241
2,495
27.8
27.9
21.8
25.6
14.8
12.6
3.9
3.4
26.7
28.5
2.6
2.3
HT Media
Neutral
82
-
1,897
2,495
2,603
11.2
11.2
7.3
8.6
11.2
9.5
0.9
0.8
7.4
8.1
0.3
0.2
Jagran Prakashan
Buy
152
189
4,961
2,170
2,355
27.2
26.2
8.9
9.9
17.1
15.3
3.6
3.1
20.9
20.5
2.2
2.0
Sun TV Network
Neutral
343
-
13,523
2,779
3,196
70.2
70.5
22.8
27.3
15.1
12.6
3.7
3.4
26.7
28.3
4.6
4.0
Hindustan Media
Neutral
255
-
1,873
920
1,031
20.0
20.0
19.2
20.9
13.3
12.2
2.2
1.9
16.4
15.3
1.6
1.4
Ventures
Metals & Mining
Coal India
Buy
319
380
201,524
76,167
84,130
19.9
22.3
22.4
25.8
14.2
12.4
5.1
5.0
35.5
41.0
2.0
1.8
Hind. Zinc
Neutral
169
-
71,598
14,641
14,026
50.4
50.4
17.7
16.0
9.6
10.6
1.5
1.3
16.2
13.2
2.5
2.4
Hindalco
Neutral
83
-
17,232
104,356
111,186
8.7
9.5
6.7
11.1
12.4
7.6
0.4
0.4
3.5
5.9
0.7
0.6
JSW Steel
Neutral
1,183
-
28,604
42,308
45,147
16.4
20.7
(10.3)
49.5
23.9
1.3
1.3
(1.0)
5.6
1.7
1.6
NMDC
Neutral
93
-
36,832
8,237
10,893
46.6
44.5
10.0
11.7
9.3
8.0
1.0
0.9
12.5
13.0
4.3
3.3
SAIL
Neutral
43
-
17,615
45,915
53,954
7.2
10.5
1.5
4.4
28.3
9.7
0.4
0.4
2.3
4.1
1.0
0.9
Vedanta
Neutral
87
-
25,897
71,445
81,910
26.2
26.3
12.9
19.2
6.8
4.6
0.5
0.4
7.2
8.9
0.8
0.6
Tata Steel
Neutral
294
-
28,597
126,760
137,307
8.9
11.3
6.4
23.1
46.3
12.8
0.9
0.9
2.0
7.1
0.8
0.8
Oil & Gas
Cairn India
Neutral
147
-
27,589
11,323
12,490
49.4
51.0
20.7
20.7
7.1
7.1
0.5
0.4
6.4
6.1
1.5
0.9
GAIL
Neutral
340
-
43,103
64,856
70,933
9.1
9.6
24.0
28.9
14.2
11.8
1.2
1.1
8.8
9.6
0.9
0.8
ONGC
Neutral
205
-
175,473
154,564
167,321
36.8
37.4
28.6
32.5
7.2
6.3
0.9
0.8
12.7
13.5
1.3
1.3
Petronet LNG
Neutral
251
-
18,795
29,691
31,188
5.8
6.2
12.8
13.4
19.6
18.7
2.9
2.6
15.8
14.8
0.7
0.7
Indian Oil Corp
Buy
386
455
93,695
359,607
402,760
5.9
6.1
42.5
48.7
9.1
7.9
1.2
1.1
14.1
14.4
0.4
0.3
Stock Watch
March 14, 2016
Company Name
Reco
CMP
Target
Mkt Cap
Sales ( Čcr )
OPM(%)
EPS (Č)
PER(x)
P/BV(x)
RoE(%)
EV/Sales(x)
(Č)
Price ( Č)
( Č cr )
FY16E FY17E
FY16E
FY17E
FY16E
FY17E
FY16E
FY17E
FY16E
FY17E
FY16E
FY17E
FY16E
FY17E
Oil & Gas
Reliance Industries
Accumulate
1,016
1,150
329,082
304,775
344,392
12.6
13.4
91.3
102.6
11.1
9.9
1.3
1.1
11.8
12.0
1.0
0.8
Pharmaceuticals
Alembic Pharma
Neutral
617
-
11,634
3,274
3,802
26.9
19.4
35.0
28.7
17.6
21.5
7.8
5.9
55.6
31.2
3.5
3.0
Aurobindo Pharma
Buy
733
856
42,856
14,923
17,162
22.0
23.0
35.7
42.8
20.5
17.1
6.0
4.5
34.0
30.2
3.2
2.8
Aventis*
Neutral
4,397
-
10,127
2,082
2,371
17.4
20.8
118.2
151.5
37.2
29.0
5.4
4.4
19.9
25.5
4.5
3.8
Cadila Healthcare
Neutral
344
-
35,247
10,224
11,840
21.0
22.0
14.6
17.6
23.6
19.6
6.5
5.1
30.8
29.0
3.5
2.9
Cipla
Accumulate
535
605
42,956
13,979
16,447
20.2
18.6
25.7
27.5
20.8
19.4
3.4
2.9
17.6
16.1
3.1
2.5
Dr Reddy's
Buy
3,212
3,933
54,774
16,838
19,575
25.0
23.1
167.5
178.8
19.2
18.0
4.0
3.4
23.1
20.4
3.2
2.7
Dishman Pharma
Neutral
361
-
2,910
1,733
1,906
21.5
21.5
17.0
19.9
21.2
18.1
2.1
1.9
10.5
11.2
2.2
1.9
GSK Pharma*
Neutral
3,240
-
27,442
2,870
3,158
20.0
22.1
59.5
68.3
54.5
47.4
16.1
16.5
28.5
34.3
9.1
8.3
Indoco Remedies
Neutral
280
-
2,583
1,033
1,199
15.9
18.2
9.4
13.6
29.8
20.6
4.4
3.8
15.7
19.7
2.6
2.2
Ipca labs
Buy
540
900
6,815
3,363
3,909
12.9
18.6
13.4
28.0
40.3
19.3
2.9
2.5
7.4
14.0
2.3
2.0
Lupin
Neutral
1,858
-
83,694
13,092
16,561
25.0
27.0
50.4
68.3
36.9
27.2
7.6
6.0
22.8
24.7
6.1
4.7
Sun Pharma
Accumulate
868
950
208,839
28,163
32,610
25.8
30.7
17.4
26.9
49.9
32.3
4.7
4.1
13.0
16.6
6.9
5.7
Power
Tata Power
Neutral
59
-
15,957
35,923
37,402
22.6
22.8
4.1
5.2
14.6
11.5
1.1
1.0
7.5
9.3
1.4
1.3
NTPC
Buy
126
146
104,140
87,271
99,297
23.5
23.5
11.8
13.3
10.8
9.5
1.2
1.1
11.5
12.2
2.2
2.0
Power Grid
Buy
138
170
72,248
20,702
23,361
86.7
86.4
12.1
13.2
11.4
10.5
1.7
1.5
15.6
15.1
8.4
7.8
Real Estate
MLIFE
Buy
424
554
1,738
697
1,011
14.9
19.3
13.8
20.1
30.7
21.1
1.1
1.1
3.8
5.3
3.8
2.6
Telecom
Bharti Airtel
Neutral
338
-
135,052
101,748
109,191
32.1
31.7
12.0
12.5
28.2
27.0
1.9
1.8
6.9
6.7
2.0
1.8
Idea Cellular
Neutral
102
-
36,743
34,282
36,941
32.0
31.5
5.9
6.2
17.3
16.5
1.6
1.4
9.9
9.3
1.6
1.6
zOthers
Abbott India
Neutral
4,851
-
10,308
2,715
3,153
14.5
14.1
134.3
152.2
36.1
31.9
9.0
7.4
27.4
25.6
3.5
3.0
Bajaj Electricals
Buy
188
237
1,898
4,719
5,287
5.2
5.8
8.6
12.7
22.0
14.9
2.5
2.2
11.4
14.8
0.4
0.4
Finolex Cables
Neutral
230
-
3,519
2,520
2,883
12.2
12.0
12.7
14.2
18.2
16.2
2.5
2.2
13.6
13.5
1.1
1.0
Goodyear India*
Buy
477
582
1,100
1,800
1,600
11.7
11.5
58.7
52.9
8.1
9.0
1.8
1.6
24.6
18.7
0.4
0.4
Hitachi
Neutral
1,143
-
3,108
1,779
2,081
7.8
8.8
21.8
33.4
52.4
34.2
8.5
6.8
17.4
22.1
1.8
1.5
Jyothy Laboratories
Neutral
286
-
5,181
1,620
1,847
11.5
11.5
7.3
8.5
39.2
33.8
5.1
4.7
13.3
14.4
3.1
2.6
MRF
Buy
34,434
45,575
14,604
20,316
14,488
21.4
21.1
5,488.0
3,798.0
6.3
9.1
2.1
1.7
41.1
21.2
0.7
0.9
Page Industries
Neutral
11,372
-
12,684
1,929
2,450
19.8
20.1
229.9
299.0
49.5
38.0
21.8
15.2
52.1
47.1
6.6
5.2
Relaxo Footwears
Neutral
387
-
4,646
1,767
2,152
12.3
12.5
19.3
25.1
20.1
15.4
4.9
3.8
27.7
27.8
2.7
2.2
Siyaram Silk Mills
Buy
997
1,354
935
1,636
1,815
11.5
11.5
89.9
104.1
11.1
9.6
1.8
1.6
17.9
17.8
0.7
0.7
Stock Watch
March 14, 2016
Company Name
Reco
CMP
Target
Mkt Cap
Sales ( Čcr )
OPM(%)
EPS (Č)
PER(x)
P/BV(x)
RoE(%)
EV/Sales(x)
(Č)
Price ( Č)
( Č cr )
FY16E
FY17E
FY16E
FY17E
FY16E
FY17E
FY16E
FY17E
FY16E
FY17E
FY16E
FY17E
FY16E
FY17E
zOthers
Styrolution ABS India* Neutral
556
-
978
1,271
1,440
8.6
9.2
32.0
41.1
17.4
13.6
1.8
1.6
10.7
12.4
0.7
0.6
TVS Srichakra
Buy
2,285
3,217
1,749
2,035
2,252
15.9
15.3
248.6
268.1
9.2
8.5
4.0
2.9
43.6
33.9
0.9
0.8
HSIL
Accumulate
271
302
1,959
2,123
2,384
16.1
16.5
15.0
18.9
18.0
14.4
1.4
1.3
8.0
9.4
1.3
1.1
Kirloskar Engines India
Neutral
210
-
3,041
2,403
2,554
8.6
9.9
9.2
10.5
22.9
20.0
2.2
2.1
9.7
10.7
0.9
0.8
Ltd
M M Forgings
Buy
430
614
519
511
615
21.7
21.6
43.1
55.8
10.0
7.7
1.8
1.5
19.9
21.2
1.2
0.9
Banco Products (India) Neutral
99
-
707
1,208
1,353
11.0
12.3
10.8
14.5
9.2
6.8
1.1
0.9
11.9
14.5
0.6
0.5
Competent Automobiles Neutral
128
-
78
1,040
1,137
3.2
3.1
25.7
28.0
5.0
4.6
0.7
0.7
15.0
14.3
0.1
0.1
Nilkamal
Neutral
1,101
-
1,642
1,871
2,031
10.7
10.5
63.2
69.8
17.4
15.8
2.8
2.4
17.6
16.6
0.9
0.8
Visaka Industries
Buy
108
144
172
1,086
1,197
9.9
10.3
21.5
28.8
5.0
3.8
0.5
0.4
9.6
11.6
0.4
0.3
Transport Corporation of
Neutral
271
-
2,065
2,830
3,350
8.8
9.0
14.4
18.3
18.9
14.8
2.9
2.5
15.4
17.1
0.9
0.7
India
Elecon Engineering
Neutral
59
-
638
1,359
1,482
10.3
13.7
0.8
3.9
73.0
15.1
1.2
1.2
1.6
7.8
0.8
0.8
Surya Roshni
Buy
133
201
584
2,992
3,223
8.1
8.4
14.7
18.3
9.1
7.3
0.9
0.8
9.7
11.0
0.5
0.4
MT Educare
Neutral
159
-
632
286
366
18.3
17.7
7.7
9.4
20.6
17.0
4.3
3.8
20.2
21.1
2.1
1.6
Radico Khaitan
Buy
100
156
1,330
1,517
1,635
12.7
13.4
5.8
7.1
17.2
14.1
1.5
1.4
8.6
9.6
1.4
1.2
Garware Wall Ropes
Buy
303
473
662
862
974
11.2
11.2
24.9
29.6
12.2
10.2
1.8
1.6
15.1
15.4
0.8
0.6
Wonderla Holidays
Neutral
368
-
2,078
206
308
44.0
43.6
9.0
12.9
40.9
28.5
5.6
5.1
13.7
17.8
10.0
6.6
Linc Pen & Plastics
Neutral
182
-
268
340
371
8.3
8.9
10.8
13.2
16.8
13.8
2.7
2.3
16.0
17.1
0.8
0.8
The Byke Hospitality
Neutral
155
-
620
222
287
20.5
20.5
5.6
7.6
27.4
20.5
5.2
4.2
18.9
20.8
2.8
2.2
Interglobe Aviation
Neutral
821
-
29,569
17,022
21,122
20.7
14.5
63.9
53.7
12.8
15.3
19.2
15.8
149.9
103.2
1.8
1.4
Coffee Day Enterprises
Neutral
225
-
4,641
2,692
2,964
17.0
18.6
-
4.7
-
47.6
2.8
2.6
0.2
5.5
2.1
2.0
Ltd
Navneet Education
Neutral
82
-
1,955
998
1,062
24.1
24.0
5.8
6.1
14.3
13.5
3.1
2.8
22.0
20.6
2.0
1.9
Navkar Corporation
Buy
162
265
2,317
365
436
38.3
37.5
5.6
5.9
28.8
27.6
1.8
1.7
6.3
6.1
7.2
6.2
Source: Company, Angel Research; Note: *December year end; #September year end; &October year end; Price as on March 11, 2016
Market Outlook
March 14, 2016
Research Team Tel: 022 - 39357800
DISCLAIMER
Angel Broking Private Limited (hereinafter referred to as “Angel”) is a registered Member of National Stock Exchange of India Limited,
Bombay Stock Exchange Limited and Metropolitian Stock Exchange of India Limited. It is also registered as a Depository Participant with
CDSL and Portfolio Manager with SEBI. It also has registration with AMFI as a Mutual Fund Distributor. Angel Broking Private Limited is a
registered entity with SEBI for Research Analyst in terms of SEBI (Research Analyst) Regulations, 2014 vide registration number
INH000000164. Angel or its associates has not been debarred/ suspended by SEBI or any other regulatory authority for accessing
/dealing in securities Market. Angel or its associates including its relatives/analyst do not hold any financial interest/beneficial ownership
of more than 1% in the company covered by Analyst. Angel or its associates/analyst has not received any compensation / managed or co
-managed public offering of securities of the company covered by Analyst during the past twelve months. Angel/analyst has not served as
an officer, director or employee of company covered by Analyst and has not been engaged in market making activity of the company
covered by Analyst.
This document is solely for the personal information of the recipient, and must not be singularly used as the basis of any investment
decision. Nothing in this document should be construed as investment or financial advice. Each recipient of this document should make
such investigations as they deem necessary to arrive at an independent evaluation of an investment in the securities of the companies
referred to in this document (including the merits and risks involved), and should consult their own advisors to determine the merits and
risks of such an investment.
Reports based on technical and derivative analysis center on studying charts of a stock's price movement, outstanding positions and
trading volume, as opposed to focusing on a company's fundamentals and, as such, may not match with a report on a company's
fundamentals.
The information in this document has been printed on the basis of publicly available information, internal data and other reliable sources
believed to be true, but we do not represent that it is accurate or complete and it should not be relied on as such, as this document is for
general guidance only. Angel Broking Pvt. Limited or any of its affiliates/ group companies shall not be in any way responsible for any
loss or damage that may arise to any person from any inadvertent error in the information contained in this report. Angel Broking Pvt.
Limited has not independently verified all the information contained within this document. Accordingly, we cannot testify, nor make any
representation or warranty, express or implied, to the accuracy, contents or data contained within this document. While Angel Broking
Pvt. Limited endeavors to update on a reasonable basis the information discussed in this material, there may be regulatory, compliance,
or other reasons that prevent us from doing so.
This document is being supplied to you solely for your information, and its contents, information or data may not be reproduced,
redistributed or passed on, directly or indirectly.
Neither Angel Broking Pvt. Limited, nor its directors, employees or affiliates shall be liable for any loss or damage that may arise from or
in connection with the use of this information.
Note: Please refer to the important ‘Stock Holding Disclosure' report on the Angel website (Research Section). Also, please refer to the
latest update on respective stocks for the disclosure status in respect of those stocks. Angel Broking Pvt. Limited and its affiliates may have
investment positions in the stocks recommended in this report.