Market Outlook
June 13, 2016
Market Cues
Domestic Indices
Chg (%)
(Pts)
(Close)
Indian Markets are expected to open negative tracking SGX Nifty & Global Markets.
BSE Sensex
(0.5)
(128)
26,636
The US markets ended negatively as global bond yields dropped. Sovereign debt
Nifty
(0.4)
(34)
8,170
yields from Japan to Germany hit record lows. The decline in bond yield, which
Mid Cap
(0.4)
(45)
11,376
normally moves in opposite direction to their prices witnessed nervousness ahead
Small Cap
(0.2)
(22)
11,363
of the Federal Reserves meeting next week and Britain’s referendum later this month
Bankex
(0.4)
(76)
20,427
on whether to stay in European Union. Though the recent economic data suggest
that the Fed may not raise interest rates now, the commentary will be keenly be
watched by market participants.
Global Indices
Chg (%)
(Pts)
(Close)
Dow Jones
(0.7)
(120)
17,865
European markets ended Friday with in negative territory, adding to the losses of the
previous two trading sessions.
Nasdaq
(0.9)
(64)
4,895
FTSE
(1.9)
(116)
6,115
The Indian market closed with a negative note on Friday and selling was witnessed
in banking and auto stocks. The week ahead is likely to take cues from the US Fed
Nikkei
(0.4)
(67)
16,601
meet and progress of monsoon. CPI inflation to be released on Monday will be
Hang Seng
(1.2)
(255)
21,043
crucial data for further move by RBI as, the Governor had indicated that there was
Shanghai Com
(0.3)
(9)
2,927
an upward pressure to inflation. The rise in CPI inflation for April was already a
negative surprise any further rise can be a risk for the further rate cuts.
Advances / Declines
BSE
NSE
News Analysis
Advances
1,199
712
Dr Reddy’s to acquire 8 drugs from Teva for US markets.
Declines
1,388
850
Detailed analysis on Pg2
Unchanged
193
71
Investor’s Ready Reckoner
Volumes (` Cr)
Key Domestic & Global Indicators
BSE
2,370
Stock Watch: Latest investment recommendations on 150+ stocks
Refer Pg4 onwards
NSE
16,506
Top Picks
Net Inflows (` Cr)
Net
Mtd
Ytd
CMP
Target
Upside
Company
Sector
Rating
(`)
(`)
(%)
FII
541
3,707
18,076
Amara Raja
Auto/Auto Ancillary
Buy
842
1,076
27.8
MFs
-124
-405
9,026
HCL Tech
IT
Buy
753
1,000
32.7
LIC Housing
Financials
Buy
476
592
24.3
Top Gainers
Price (`)
Chg (%)
Bharat Electronics
Capital Goods
Accumulate
1,262
1,414
12.1
Aloktext
4
19.9
Navkar Corporation Others
Buy
197
265
34.6
Jpinfratec
7
19.9
More Top Picks on Pg3
Gvkpil
6
15.9
Key Upcoming Events
Jppower
5
12.0
Previous
Consensus
Date
Region
Event Description
Reading
Expectations
Jpassociat
6
5.9
June 14 India
Monthly Wholesale price YoY%
0.3
--
June 14 UK
CPI (YoY)
0.3
--
Top Losers
Price (`)
Chg (%)
June 15 UK
Jobeless claims change
-2.4
--
Mphasis
538
(3.8)
June 15 US
Industrial Production YoY
0.7
--
6.(
Ibrealest
96
(3.6)
More Events on Pg4
Jublfood
1,024
(3.4)
Rdel
63
(3.4)
Tv18Brdcst
41
(3.3)
As on June 10, 2016
Market Outlook
June 13, 2016
Dr Reddy’s to acquire 8 product portfolio from TEVA for US
Market:
Dr Reddy’s Lab has entered into a definitive agreement with Teva Pharmaceutical
Industries Ltd and an affiliate of Allegran Plc to acquire a portfolio eight
Abbreviated New Drug Applications (ANDAs) in the US for $ 350 mn in cash.
The acquired portfolio consists of products that are being divested by Teva as a
precondition to its closing of the Allegran’s generics business. The acquisition of
these ANDAs is also contingent on the closing of the TEVA/Allegran generics
transaction and approved by the US Federal Trade Commission of Dr Reddy’s as a
buyer.
The portfolio being acquired is a mix of filed ANDAs pending approval and
approved ANDA, and comprised of complex generic products across diverse
dosage forms. GV Prasad Co -Chairman and CEO of Dr Reddy’s Lab said, that
the transaction will add strength to the company’s product portfolio, and help in
becoming more relevant in the US market and also will create new growth
opportunities.
Dr Reddy’s Lab is acquiring the portfolio on a cash free, debt free basis and
expects to finance the transaction using a combination of cash on hand and
available borrowings under existing credit facilities. At the current price the stock is
trading at 20x its FY17E EPS of Rs 152.4. We have an accumulate rating on the
stock with a target price of Rs 3476.
Economic and Political News
Telecos to invest Rs 12,000 cr to check call drops
PM wants states to have more say on aviation policy
Govt may use unclaimed PF money in flagship schemes.
Railway freight earnings down 13% in April-May,2016
India’s first private rocket set for launch in 2020
Corporate News
TVS Jupiter eyes 12% share in 110CC scooter segment.
CIL’s coal price hike to push tariff by 8-10%, says Tata Power
Tata Power buys Welspun’s renewable energy assets.
Amtek’s German unit to fetch $700 mn
Rcom and Aircel may complete $ 6bn merger by July
SBI begins work on framework for subsidiary mergers.
Market Outlook
June 13, 2016
Top Picks
Large Cap
M
arket Cap
CM
P
T
arget
Upsid
e
Company
Rationale
(` Cr)
(`)
(`)
(%)
To outpace battery industry growth due to better technological
Amara Raja Batteries
14,376
842
1,076
27.8
products leading to market share gains in both the automotive
OEM and replacement segments.
Uptick in defense capex by government, coupled with BELs
Bharat Electronics
30,280
1,262
1,414
12.1
strong market positioning, indicate good times ahead for BEL.
HCL Tech
1,06,257
753
1,000
32.7
Stock is trading at attractive valuations & factors all bad news.
Strong visibility for a robust 20% earnings trajectory, coupled
HDFC Bank
2,93,669
1,160
1,262
8.8
with high quality of earnings on account of high quality retail
business and strategic focus on highly rated corporates.
Back on the growth trend, expect a long term growth of 14% to
Infosys
2,72,291
1,185
1,374
15.9
be a US$20bn in FY2020.
Continues to grow its retail loan book at healthy pace with
LIC Housing Finance
24,014
476
592
24.3
improvement in asset quality. Expect LICHF to post a healthy
loan book which is likely to reflect in a strong earnings growth.
Huge bid pipeline of re-development works at Delhi and other
NBCC
11,337
189
220
16.4
State Governments and opportunity from Smart City, positions
NBCC to report strong growth, going forward.
Strong market positioning within the domestic AC markets to
Voltas
11,048
334
407
21.9
continue, EMP business set to revive
Source: Company, Angel Research
Mid Cap
M
arket Cap
CM
P
T
arget
Upsid
e
Company
Rationale
(` Cr)
(`)
(`)
(%)
Among the top 4 players in the consumer durables segment.
Bajaj Electricals
2,317
229
268
16.9
Improved profitability backed by turn around in E&P segment.
Strong order book lends earnings visibility.
Favourable outlook for AC industry to augur well for Cooling
Blue Star
3,980
442
495
11.9
products business. EMPPAC division's profitability to improve
once operating environment turns around.
With a focus on the low and medium income (LMI) consumer
Dewan Housing
6,186
212
270
27.4
segment, the company has increased its presence in tier-II & III
cities where the growth opportunity is immense.
Strong loan growth backed by diversified loan portfolio and
Equitas Holdings
5,909
176
235
33.4
adequate CAR. ROE & ROA likely to remain decent as risk of
dilution remains low. Attractive valuations considering growth.
Commencement of new projects, downtrend in the interest rate
IL&FS Transport
2,444
74
93
25.2
cycle, to lead to stock re-rating
Economic recovery to have favourable impact on advertising &
circulation revenue growth. Further, the acquisition of a radio
Jagran Prakashan
5,641
173
205
18.8
business (Radio City) would also boost the company's revenue
growth.
Speedier execution and speedier sales, strong revenue visibility
Mahindra Lifespace
1,870
456
554
21.5
in short-to-long run, attractive valuations
Massive capacity expansion along with rail advantage at ICD
Navkar Corporation
2,809
197
265
34.6
as well CFS augurs well for the company
Earnings boost on back of stable material prices and
Radico Khaitan
1,211
91
125
37.3
favourable pricing environment. Valuation discount to peers
provides additional comfort
Strong brands and distribution network would boost growth
Siyaram Silk Mills
988
1,054
1,347
27.9
going ahead. Stock currently trades at an inexpensive
valuation.
Source: Company, Angel Research
Market Outlook
June 13, 2016
Key Upcoming Events
Global economic events release calendar
Bloomberg Data
Date
Time
Country Event Description
Unit
Period
Last Reported Estimated
Jun 14, 2016
12:00 PM
India Monthly Wholesale Prices YoY%
% Change May
0.34
2:00 PM
UK
CPI (YoY)
% Change May
0.30
June 15, 2016
2:00 PM UK
Jobless claims change
% Change
May
-2.40
US
Producer Price Index (mom)
% Change
May
0.20
6:45 PM US
Industrial Production
%
May
0.66
-0.10
2:30 PM Euro Zone
Euro-Zone CPI (YoY)
% May F
-0.10
Jun 16, 2016
11:30 PM
US
FOMC rate decision
% Jun 15
0.50
0.50
6:00 PM
US
Consumer price index (mom)
% Change May
0.40
0.20
4:30 PM
UK
BOE Announces rates
% Ratio Jun 16
0.50
Jun 17, 2016
6:00 PM
US
Housing Starts
Thousands May
1172.00
1,164.00
6:00 PM
US
Building permits
Thousands May
1130.00
1,145.00
Jun 22, 2016
7:30 PM Euro Zone Euro-Zone Consumer Confidence
Value Jun A
(7.00)
7:30 PM
US
Existing home sales
Million May
5.45
Jun 23, 2016
1:00 PM Germany
PMI Services
Value Jun P
55.20
1:00 PM Germany
PMI Manufacturing
Value Jun P
52.10
7:30 PM
US
Consumer ConfidenceS.A./ 1985=100 Jun
92.60
Source: Bloomberg, Angel Research
Market Outlook
June 13, 2016
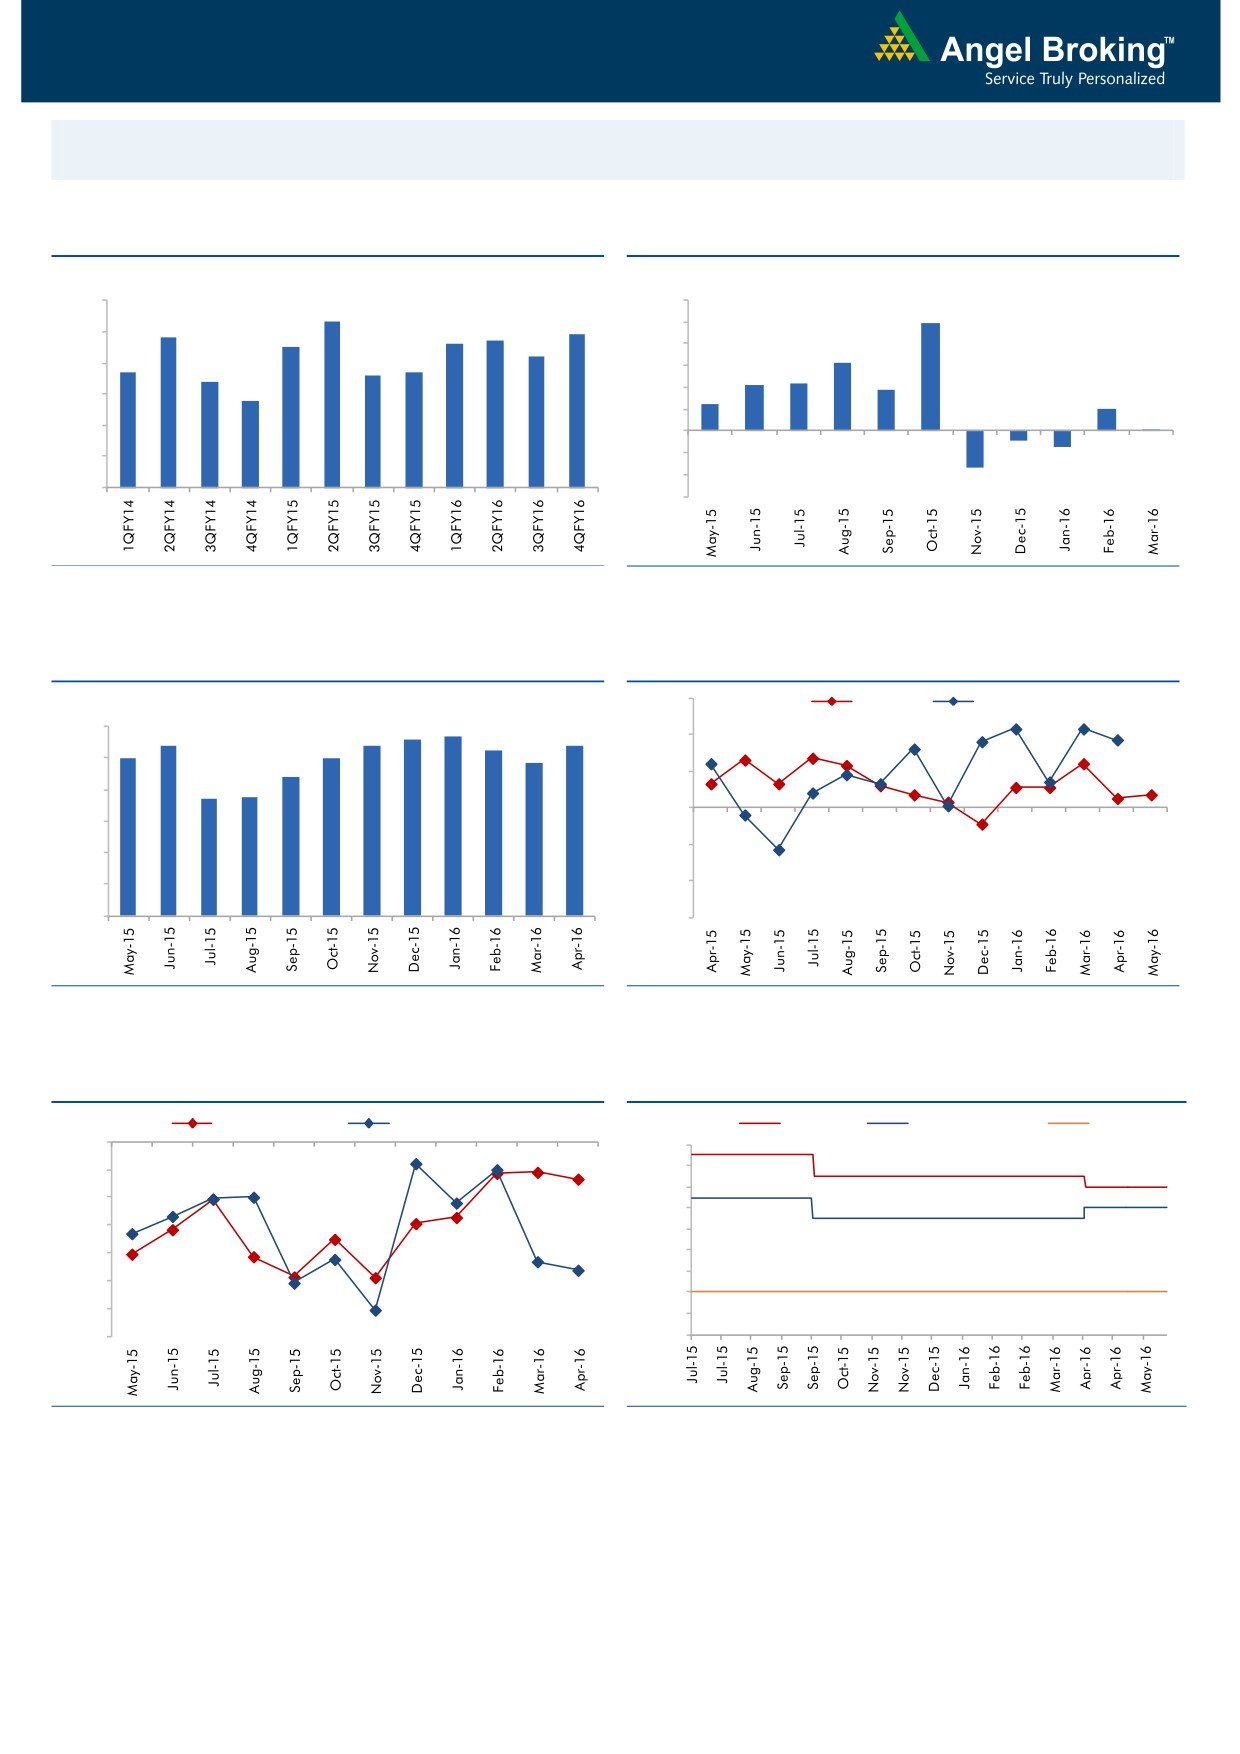
Macro watch
Exhibit 1: Quarterly GDP trends
Exhibit 2: IIP trends
(%)
(%)
9.0
8.3
12.0
9.9
7.8
7.7
7.9
10.0
8.0
7.5
7.6
7.2
8.0
6.3
6.7
6.6
6.7
7.0
6.4
6.0
4.2
4.3
3.7
5.8
4.0
2.5
6.0
2.0
2.0
0.1
5.0
-
4.0
(2.0)
(0.9)
(1.5)
(4.0)
3.0
(3.4)
(6.0)
Source: CSO, Angel Research
Source: MOSPI, Angel Research
Exhibit 3: Monthly CPI inflation trends
Exhibit 4: Manufacturing and services PMI
56.0
Mfg. PMI
Services PMI
(%)
5.6
5.7
6.0
5.4
5.4
5.4
5.3
54.0
5.0
5.0
4.8
5.0
4.4
52.0
3.7
3.7
4.0
50.0
3.0
48.0
2.0
1.0
46.0
-
44.0
Source: MOSPI, Angel Research
Source: Market, Angel Research; Note: Level above 50 indicates expansion
Exhibit 5: Exports and imports growth trends
Exhibit 6: Key policy rates
(%)
Exports yoy growth
Imports yoy growth
(%)
Repo rate
Reverse Repo rate
CRR
0.0
7.50
(5.0)
7.00
6.50
(10.0)
6.00
(15.0)
5.50
(20.0)
5.00
4.50
(25.0)
4.00
(30.0)
3.50
(35.0)
3.00
Source: Bloomberg, Angel Research
Source: RBI, Angel Research
Market Outlook
June 13, 2016
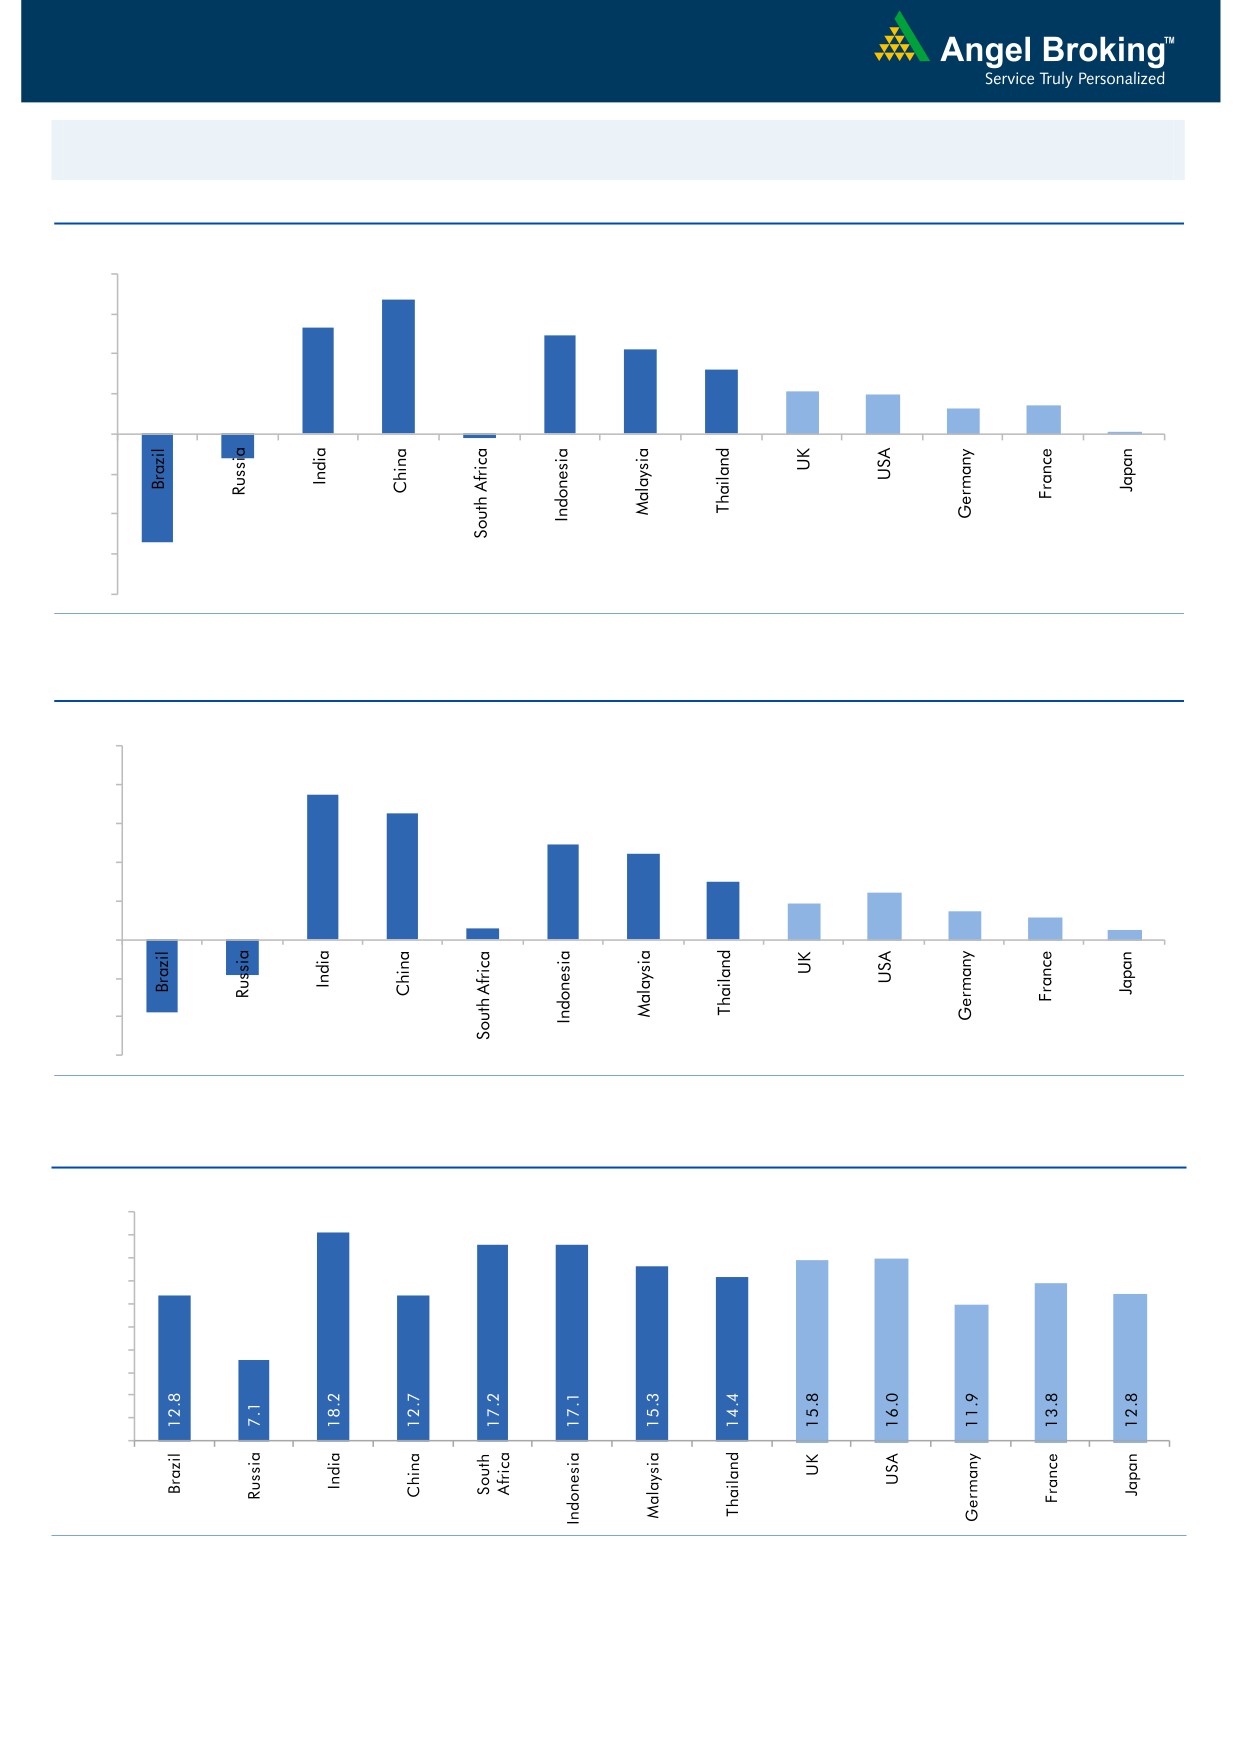
Global watch
Exhibit 1: Latest quarterly GDP Growth (%, yoy) across select developing and developed countries
(%)
8.0
6.7
6.0
5.3
4.9
4.2
4.0
3.2
2.1
2.0
1.3
1.4
2.0
0.1
-
(0.2)
(2.0)
(4.0)
(1.2)
(6.0)
(5.4)
(8.0)
Source: Bloomberg, Angel Research
Exhibit 2: 2016 GDP Growth projection by IMF (%, yoy) across select developing and developed countries
(%)
10.0
7.5
8.0
6.5
6.0
4.9
4.4
4.0
3.0
2.4
1.9
1.5
2.0
1.1
0.6
0.5
(3.8)
(1.8)
-
(2.0)
(4.0)
(6.0)
Source: IMF, Angel Research
Exhibit 3: One year forward P-E ratio across select developing and developed countries
(x)
20.0
18.0
16.0
14.0
12.0
10.0
8.0
6.0
4.0
2.0
-
Source: IMF, Angel Research
Market Outlook
June 13, 2016
Exhibit 4: Relative performance of indices across globe
Returns (%)
Country
Name of index
Closing price
1M
3M
1YR
Brazil
Bovespa
49,422
0.3
4.1
(5.7)
Russia
Micex
1,904
(0.3)
1.1
15.2
India
Nifty
8,170
4.1
9.1
0.7
China
Shanghai Composite
2,927
2.6
1.5
(40.8)
South Africa
Top 40
47,028
2.6
0.9
1.7
Mexico
Mexbol
45,178
(0.7)
1.5
1.1
Indonesia
LQ45
827
(0.2)
(1.2)
(7.1)
Malaysia
KLCI
1,641
(0.2)
(3.3)
(6.0)
Thailand
SET 50
909
3.0
3.3
(6.4)
USA
Dow Jones
17,865
(0.4)
5.1
(0.2)
UK
FTSE
6,116
(0.7)
(0.2)
(8.9)
Japan
Nikkei
16,601
0.1
(1.8)
(19.2)
Germany
DAX
9,835
(2.1)
1.1
(11.0)
France
CAC
4,307
(0.2)
(1.0)
(10.6)
Source: Bloomberg, Angel Research
Stock Watch
June 13, 2016
Company Name
Reco
CMP
Target
Mkt Cap
Sales ( Čcr )
OPM(%)
EPS (Č)
PER(x)
P/BV(x)
RoE(%)
EV/Sales(x)
(Č)
Price ( Č)
( Č cr )
FY16E FY17E
FY16E
FY17E
FY16E
FY17E
FY16E
FY17E
FY16E
FY17E
FY16E
FY17E
FY16E
FY17E
Agri / Agri Chemical
Rallis
Neutral
216
-
4,203
1,612
1,911
13.3
13.3
7.4
9.5
29.2
22.8
4.7
4.2
16.7
18.4
2.6
2.2
United Phosphorus
Accumulate
581
684
24,893
13,083
15,176
18.5
18.5
31.5
37.4
18.4
15.5
3.7
3.0
21.4
21.4
2.2
1.8
Auto & Auto Ancillary
Ashok Leyland
Neutral
105
-
29,924
17,995
21,544
11.4
11.6
3.4
4.7
30.9
22.4
5.4
5.0
17.7
22.2
1.6
1.3
Bajaj Auto
Neutral
2,585
-
74,803
22,709
25,860
20.9
20.1
129.0
143.6
20.0
18.0
6.1
5.3
30.7
29.4
2.9
2.5
Bharat Forge
Buy
752
875
17,508
7,351
8,318
19.9
19.7
31.2
36.5
24.1
20.6
4.3
3.7
19.3
19.2
2.5
2.2
Eicher Motors
Accumulate
18,620
20,044
50,575
15,556
16,747
15.5
17.3
464.8
597.5
40.1
31.2
14.6
10.8
36.2
34.3
3.2
2.9
Gabriel India
Accumulate
89
101
1,273
1,415
1,544
8.7
9.0
4.6
5.4
19.3
16.4
3.5
3.1
18.1
18.9
0.9
0.8
Hero Motocorp
Neutral
3,067
-
61,253
28,244
30,532
15.5
15.9
156.7
168.5
19.6
18.2
7.8
6.6
39.9
36.4
2.1
1.9
Jamna Auto Industries Neutral
159
-
1,270
1,281
1,473
11.2
11.5
7.6
9.2
20.9
17.3
5.3
4.3
25.4
25.2
1.1
0.9
L G Balakrishnan & Bros Neutral
484
-
759
1,254
1,394
11.6
11.8
35.9
41.7
13.5
11.6
1.8
1.6
13.5
13.8
0.7
0.6
Mahindra and Mahindra Neutral
1,375
-
85,375
38,416
42,904
13.7
13.9
54.8
63.4
25.1
21.7
3.9
3.4
15.4
15.8
1.8
1.6
Maruti
Neutral
4,118
-
124,385
57,865
68,104
16.4
16.7
176.3
225.5
23.4
18.3
4.5
3.9
19.4
21.2
2.0
1.6
Minda Industries
Neutral
1,162
-
1,844
2,523
2,890
8.7
9.0
55.0
65.4
21.1
17.8
4.1
3.3
19.3
18.7
0.8
0.7
Motherson Sumi
Accumulate
288
313
38,148
39,343
45,100
8.8
9.1
10.1
12.5
28.6
23.1
9.0
7.1
35.3
34.4
1.0
0.9
Rane Brake Lining
Buy
376
465
298
454
511
11.5
12.0
25.2
31.0
14.9
12.1
2.2
2.0
14.9
16.6
0.8
0.7
Setco Automotive
Neutral
44
-
582
594
741
12.7
13.7
1.7
3.2
25.6
13.6
2.7
2.3
10.4
16.9
1.3
1.1
Tata Motors
Neutral
457
-
132,003
259,686
273,957
13.0
13.4
25.9
29.5
17.7
15.5
2.3
2.0
8.0
9.0
0.7
0.7
TVS Motor
Accumulate
287
330
13,635
11,263
13,122
6.9
8.5
9.2
15.0
31.2
19.1
7.1
5.7
22.7
29.6
1.2
1.0
Amara Raja Batteries
Buy
848
1,076
14,491
4,690
5,429
17.5
17.5
28.5
35.3
29.8
24.0
6.9
5.7
23.1
25.9
3.0
2.6
Exide Industries
Neutral
157
-
13,328
6,950
7,784
14.4
14.8
6.6
7.3
23.8
21.5
3.0
2.7
12.6
12.8
1.6
1.5
Apollo Tyres
Buy
150
183
7,651
12,056
12,714
17.2
16.4
23.0
20.3
6.5
7.4
1.2
1.0
17.7
13.6
0.7
0.7
Ceat
Buy
892
1,119
3,608
6,041
6,597
14.1
13.7
99.5
111.9
9.0
8.0
1.8
1.5
19.6
18.5
0.8
0.6
JK Tyres
Neutral
91
-
2,053
7,446
7,669
15.2
14.0
19.6
18.4
4.6
4.9
1.2
1.0
25.2
19.5
0.7
0.6
Swaraj Engines
Neutral
1,105
-
1,372
552
630
14.2
14.7
44.6
54.1
24.8
20.4
5.8
5.2
23.2
25.6
2.3
2.0
Subros
Neutral
94
-
564
1,293
1,527
11.8
11.9
4.2
6.7
22.4
14.0
1.7
1.5
7.7
11.5
0.7
0.6
Indag Rubber
Neutral
189
-
496
283
329
17.0
17.2
13.0
15.4
14.6
12.3
3.2
2.6
21.8
21.6
1.5
1.2
Capital Goods
ACE
Neutral
41
-
401
660
839
4.7
8.2
1.0
3.9
40.5
10.4
1.3
1.1
3.2
11.3
0.8
0.6
BEML
Buy
863
1,157
3,595
3,277
4,006
6.0
8.9
36.2
64.3
23.9
13.4
1.7
1.5
5.7
11.7
1.1
0.9
Bharat Electronics
Buy
1,266
1,414
30,377
7,295
8,137
20.0
16.8
56.5
58.7
22.4
21.6
3.3
3.0
42.1
44.6
3.0
2.5
Stock Watch
June 13, 2016
Company Name
Reco
CMP
Target
Mkt Cap
Sales ( Čcr )
OPM(%)
EPS (Č)
PER(x)
P/BV(x)
RoE(%)
EV/Sales(x)
(Č)
Price ( Č)
( Č cr )
FY16E
FY17E
FY16E
FY17E
FY16E
FY17E
FY16E
FY17E
FY16E
FY17E
FY16E
FY17E
FY16E
FY17E
Capital Goods
Voltas
Buy
327
407
10,820
5,857
6,511
7.5
7.9
11.7
12.9
28.0
25.4
4.6
4.0
17.1
16.7
1.9
1.7
BGR Energy
Neutral
118
-
852
3,615
3,181
9.5
9.4
16.7
12.4
7.1
9.5
0.7
0.7
10.0
7.0
0.6
0.8
BHEL
Neutral
124
-
30,265
33,722
35,272
10.8
11.7
10.5
14.2
11.8
8.7
0.9
0.8
7.0
9.0
0.9
0.9
Blue Star
Buy
440
495
3,958
3,770
4,351
5.7
6.4
11.4
17.2
38.5
25.6
6.0
5.6
18.4
23.1
1.0
0.9
Crompton Greaves
Neutral
71
-
4,444
13,484
14,687
4.9
6.2
4.5
7.1
15.8
10.0
1.1
1.0
7.2
10.8
0.5
0.4
Greaves Cotton
Neutral
138
-
3,375
1,655
1,755
16.6
16.8
7.4
7.8
18.7
17.7
3.7
3.5
21.1
20.6
2.0
1.9
Inox Wind
Buy
241
286
5,354
4,406
5,605
15.5
15.7
20.4
24.8
11.8
9.7
2.7
2.0
27.9
25.9
1.3
1.0
KEC International
Neutral
139
-
3,575
8,791
9,716
6.1
6.8
5.4
8.2
25.8
17.0
2.6
2.4
10.0
14.0
0.6
0.6
Thermax
Neutral
797
-
9,493
6,413
7,525
7.4
8.5
30.5
39.3
26.1
20.3
4.0
3.5
15.0
17.0
1.4
1.1
VATech Wabag
Neutral
622
-
3,390
2,722
3,336
7.9
8.1
19.5
24.6
31.9
25.3
3.3
3.0
11.1
12.4
1.3
1.1
Cement
ACC
Neutral
1,552
-
29,133
13,151
14,757
16.4
18.3
63.9
83.4
24.3
18.6
3.1
2.9
13.3
16.1
2.0
1.7
Ambuja Cements
Neutral
235
-
36,431
11,564
12,556
19.4
20.7
8.9
10.1
26.4
23.2
3.3
3.1
12.8
13.8
2.7
2.5
HeidelbergCement
Neutral
111
-
2,506
1,772
1,926
13.3
15.4
1.0
3.0
110.6
36.9
2.8
2.6
2.6
7.9
1.9
1.7
India Cements
Neutral
96
-
2,949
4,216
4,840
18.0
19.5
4.0
9.9
24.0
9.7
1.0
0.9
4.0
9.5
1.0
0.8
JK Cement
Neutral
621
-
4,345
3,661
4,742
10.1
15.8
7.5
28.5
82.9
21.8
2.5
2.2
7.5
22.9
1.6
1.2
J K Lakshmi Cement
Neutral
356
-
4,185
2,947
3,616
16.7
19.9
11.5
27.2
30.9
13.1
2.9
2.5
9.8
20.8
1.8
1.4
Mangalam Cements
Neutral
293
-
782
1,053
1,347
10.5
13.3
8.4
26.0
34.9
11.3
1.5
1.4
4.3
12.5
1.1
0.8
Orient Cement
Neutral
168
-
3,449
1,854
2,524
21.2
22.2
7.7
11.1
21.9
15.2
3.1
2.7
13.3
15.7
2.6
1.8
Ramco Cements
Neutral
523
-
12,443
4,036
4,545
20.8
21.3
15.1
18.8
34.6
27.8
4.2
3.8
12.9
14.3
3.5
3.0
Shree Cement^
Neutral
13,544
-
47,183
7,150
8,742
26.7
28.6
228.0
345.5
59.4
39.2
8.7
7.3
15.7
20.3
6.4
5.1
UltraTech Cement
Neutral
3,377
-
92,679
24,669
29,265
18.2
20.6
82.0
120.0
41.2
28.1
4.4
3.9
11.3
14.7
3.6
3.1
Construction
ITNL
Buy
74
93
2,447
7,360
8,682
34.0
32.2
7.0
8.6
10.6
8.7
0.4
0.4
3.2
2.5
3.7
3.5
KNR Constructions
Neutral
566
-
1,592
937
1,470
14.3
14.0
44.2
38.6
12.8
14.7
2.6
2.2
15.4
15.4
1.8
1.2
Larsen & Toubro
Buy
1,487
1,700
138,599
58,870
65,708
8.3
10.3
42.0
53.0
35.4
28.1
2.5
2.2
8.8
11.2
2.5
2.3
Gujarat Pipavav Port
Neutral
158
-
7,629
629
684
51.0
52.2
6.4
5.9
24.7
26.8
3.3
3.0
15.9
12.7
11.8
10.7
MBL Infrastructures
Buy
122
285
507
2,313
2,797
12.2
14.6
19.0
20.0
6.4
6.1
0.7
0.6
11.3
10.6
0.9
0.8
Nagarjuna Const.
Neutral
75
-
4,158
7,892
8,842
8.8
9.1
3.0
5.3
24.9
14.1
1.3
1.2
5.0
8.5
0.7
0.6
PNC Infratech
Neutral
563
-
2,886
1,873
2,288
13.2
13.5
24.0
32.0
23.4
17.6
2.3
2.0
12.1
12.3
1.6
1.3
Simplex Infra
Neutral
277
-
1,369
5,955
6,829
10.3
10.5
16.0
31.0
17.3
8.9
0.9
0.8
5.3
9.9
0.7
0.6
Stock Watch
June 13, 2016
Company Name
Reco
CMP
Target
Mkt Cap
Sales ( Čcr )
OPM(%)
EPS (Č)
PER(x)
P/BV(x)
RoE(%)
EV/Sales(x)
(Č)
Price ( Č)
( Č cr )
FY16E
FY17E
FY16E
FY17E
FY16E
FY17E
FY16E
FY17E
FY16E
FY17E
FY16E
FY17E
FY16E
FY17E
Construction
Power Mech Projects
Neutral
569
-
837
1,539
1,801
12.8
12.7
59.0
72.1
9.6
7.9
1.5
1.2
18.6
16.8
0.6
0.5
Sadbhav Engineering
Accumulate
287
298
4,914
3,186
3,598
10.2
10.3
8.0
9.0
35.8
31.8
3.3
2.9
9.4
9.9
1.8
1.6
NBCC
Accumulate
188
220
11,292
5,838
7,428
6.0
7.9
5.2
8.2
36.2
23.0
1.1
0.9
21.9
28.2
1.8
1.3
MEP Infra
Neutral
38
-
620
1,956
1,876
28.1
30.5
1.3
3.0
29.4
12.7
6.2
4.2
21.2
32.8
1.7
1.7
SIPL
Neutral
102
-
3,594
675
1,042
62.4
64.7
-
-
3.8
4.4
-
-
16.7
11.3
Engineers India
Neutral
193
-
6,491
1,667
1,725
13.5
16.0
9.7
11.4
19.9
16.9
2.3
2.3
11.7
13.4
2.7
2.7
Financials
Allahabad Bank
Neutral
53
-
3,854
8,569
9,392
2.8
2.9
16.3
27.5
3.3
1.9
0.3
0.2
7.6
11.9
-
-
Axis Bank
Neutral
541
-
129,163
26,204
29,738
3.6
3.5
34.5
35.4
15.7
15.3
2.5
2.2
16.8
14.9
-
-
Bank of Baroda
Neutral
146
-
33,744
18,802
21,088
2.0
2.2
(7.4)
13.0
11.3
1.2
0.9
(4.2)
7.3
-
-
Bank of India
Neutral
89
-
8,318
15,972
17,271
1.9
2.0
15.3
33.4
5.8
2.7
0.3
0.2
3.6
7.6
-
-
Canara Bank
Neutral
196
-
10,645
15,441
16,945
2.0
2.1
46.6
70.4
4.2
2.8
0.4
0.3
8.0
11.2
-
-
Dena Bank
Neutral
30
-
1,997
3,440
3,840
2.1
2.3
7.3
10.0
4.1
3.0
0.3
0.3
6.1
7.9
-
-
Dewan Housing Finance Buy
209
270
6,099
1,828
2,225
2.9
3.0
24.9
29.7
8.4
7.1
1.3
1.1
15.1
16.1
-
-
Equitas Holdings
Buy
179
235
6,003
679
1,076
12.4
11.7
6.2
6.7
28.9
26.7
3.6
2.6
13.3
12.5
-
-
Federal Bank
Neutral
58
-
10,026
3,279
3,787
2.8
2.9
3.9
5.5
14.8
10.6
1.2
1.1
8.4
10.8
-
-
HDFC
Neutral
1,231
-
194,516
10,358
11,852
3.3
3.3
41.1
47.0
30.0
26.2
5.7
5.2
24.7
24.9
-
-
HDFC Bank
Accumulate
1,161
1,262
293,986
38,606
47,696
4.4
4.5
48.8
61.4
23.8
18.9
4.0
3.5
18.7
20.0
-
-
ICICI Bank
Neutral
253
-
146,948
34,279
39,262
3.3
3.3
21.0
24.4
12.0
10.4
2.0
1.7
14.4
14.7
-
-
IDBI Bank
Neutral
66
-
13,671
9,625
10,455
1.8
1.8
8.5
14.2
7.8
4.7
0.5
0.4
5.9
9.3
-
-
Indian Bank
Neutral
105
-
5,048
6,160
6,858
2.5
2.5
24.5
29.8
4.3
3.5
0.3
0.3
7.7
8.6
-
-
LIC Housing Finance
Buy
473
592
23,888
3,179
3,758
2.6
2.6
32.9
40.6
14.4
11.7
2.7
2.3
19.6
20.7
-
-
Oriental Bank
Neutral
90
-
3,116
7,643
8,373
2.4
2.4
37.2
45.4
2.4
2.0
0.2
0.2
8.2
9.4
-
-
Punjab Natl.Bank
Neutral
84
-
16,484
23,122
26,022
2.8
2.8
7.0
21.6
12.0
3.9
0.6
0.6
3.4
10.0
-
-
South Ind.Bank
Neutral
20
-
2,761
1,965
2,185
2.5
2.5
2.5
3.3
8.2
6.2
0.8
0.7
9.5
11.7
-
-
St Bk of India
Neutral
206
-
160,068
79,958
86,061
2.6
2.6
13.4
20.7
15.4
10.0
1.3
1.2
11.5
12.8
-
-
Union Bank
Neutral
120
-
8,277
12,646
14,129
2.3
2.4
31.0
39.1
3.9
3.1
0.4
0.4
9.8
11.4
-
-
Vijaya Bank
Neutral
32
-
3,166
3,536
3,827
1.9
1.9
5.5
6.7
5.7
4.8
0.5
0.4
7.8
8.8
-
-
Yes Bank
Neutral
1,062
-
44,713
7,190
9,011
3.2
3.3
58.2
69.7
18.2
15.3
3.3
2.8
19.2
19.6
-
-
FMCG
Asian Paints
Neutral
992
-
95,124
15,534
17,445
17.7
16.8
18.4
19.6
54.0
50.6
19.1
18.0
34.6
35.6
6.2
5.5
Stock Watch
June 13, 2016
Company Name
Reco
CMP
Target
Mkt Cap
Sales ( Čcr )
OPM(%)
EPS (Č)
PER(x)
P/BV(x)
RoE(%)
EV/Sales(x)
(Č)
Price ( Č)
( Č cr )
FY16E FY17E
FY16E
FY17E
FY16E
FY17E
FY16E
FY17E
FY16E
FY17E
FY16E
FY17E
FY16E
FY17E
FMCG
Britannia
Neutral
2,732
-
32,775
8,481
9,795
14.0
14.1
65.5
78.3
41.7
34.9
19.7
16.2
38.3
41.2
3.8
3.3
Colgate
Neutral
872
-
23,714
4,136
4,632
22.5
23.3
22.2
25.3
39.3
34.5
23.9
21.3
68.6
67.5
5.6
5.0
Dabur India
Neutral
302
-
53,126
9,370
10,265
17.6
17.3
7.3
8.1
41.2
37.3
10.7
9.8
31.7
30.6
5.6
5.1
GlaxoSmith Con*
Accumulate
5,658
6,118
23,794
4,519
5,142
19.6
19.8
164.3
191.2
34.4
29.6
9.5
8.1
30.8
29.9
4.7
4.1
Godrej Consumer
Neutral
1,509
-
51,392
9,003
10,335
18.1
18.7
34.1
41.8
44.3
36.1
9.6
8.2
23.9
24.8
6.1
5.3
HUL
Neutral
874
-
189,250
33,299
35,497
17.1
17.1
18.9
20.0
46.3
43.7
40.6
35.3
87.6
80.8
5.6
5.2
ITC
Accumulate
352
380
282,900
36,837
39,726
38.8
38.7
12.2
13.5
28.7
26.1
8.0
7.0
27.8
26.9
7.2
6.7
Marico
Neutral
253
-
32,686
6,151
6,966
17.2
17.3
5.4
6.4
46.9
39.6
14.7
11.6
33.2
32.4
5.2
4.6
Nestle*
Neutral
6,532
-
62,983
9,393
10,507
22.2
22.3
106.8
121.8
61.2
53.6
21.5
19.3
34.8
36.7
6.2
5.6
Tata Global
Accumulate
124
137
7,804
8,635
9,072
9.8
9.9
5.8
7.2
21.3
17.2
1.9
1.8
6.8
7.4
0.9
0.9
Procter & Gamble
Buy
6,270
7,369
20,353
2,588
2,939
23.3
23.2
130.2
146.2
48.2
42.9
96.0
92.1
27.6
25.3
7.4
6.4
Hygiene
IT
HCL Tech^
Buy
749
1,000
105,686
37,061
30,781
21.5
20.5
51.4
40.0
14.6
18.7
3.8
2.7
20.1
20.3
2.5
2.7
Infosys
Accumulate
1,181
1,374
271,223
62,441
70,558
27.5
27.5
59.0
65.3
20.0
18.1
4.0
3.7
22.2
22.4
4.1
3.5
TCS
Accumulate
2,561
3,004
504,617
108,646
122,770
28.3
28.3
123.7
141.0
20.7
18.2
6.9
6.3
33.1
34.6
4.3
3.7
Tech Mahindra
Buy
537
700
52,107
26,494
30,347
16.3
17.0
32.2
37.5
16.7
14.3
3.6
3.1
21.7
21.8
1.8
1.5
Wipro
Buy
545
680
134,642
50,808
56,189
23.7
23.8
37.3
40.7
14.6
13.4
2.8
2.5
19.2
17.7
2.1
1.7
Media
D B Corp
Neutral
374
-
6,872
2,025
2,187
27.4
27.4
17.4
18.9
21.5
19.8
4.8
4.4
22.9
23.7
3.4
3.1
HT Media
Neutral
79
-
1,842
2,495
2,673
12.9
13.2
6.8
7.2
11.6
11.0
0.9
0.9
7.5
7.8
0.3
0.3
Jagran Prakashan
Buy
171
205
5,592
2,107
2,355
33.5
28.0
10.1
10.8
17.0
15.8
4.0
3.4
23.3
21.7
2.7
2.4
Sun TV Network
Neutral
370
-
14,599
2,510
2,763
71.8
71.5
21.9
24.8
16.9
14.9
4.0
3.6
22.8
24.3
5.2
4.7
Hindustan Media
Neutral
276
-
2,026
914
1,016
21.7
21.5
21.9
23.3
12.6
11.9
2.3
1.9
18.0
16.2
1.6
1.4
Ventures
Metals & Mining
Coal India
Buy
307
380
194,007
76,167
84,130
19.9
22.3
22.4
25.8
13.7
11.9
4.9
4.8
35.5
41.0
1.9
1.7
Hind. Zinc
Neutral
173
-
73,225
14,641
14,026
50.4
50.4
17.7
16.0
9.8
10.8
1.5
1.4
16.2
13.2
2.5
2.3
Hindalco
Neutral
115
-
23,789
104,356
111,186
8.7
9.5
6.7
11.1
17.1
10.4
0.6
0.6
3.5
5.9
0.7
0.7
JSW Steel
Neutral
1,418
-
34,287
42,308
45,147
16.4
20.7
(10.3)
49.5
28.7
1.6
1.5
(1.0)
5.6
1.8
1.7
NMDC
Neutral
92
-
36,297
8,237
10,893
46.6
44.5
10.0
11.7
9.2
7.9
1.0
0.9
12.5
13.0
4.1
3.1
SAIL
Neutral
45
-
18,606
45,915
53,954
7.2
10.5
1.5
4.4
29.9
10.3
0.4
0.4
2.3
4.1
1.0
0.9
Vedanta
Neutral
117
-
34,628
71,445
81,910
26.2
26.3
12.9
19.2
9.1
6.1
0.6
0.6
7.2
8.9
0.9
0.7
Tata Steel
Neutral
335
-
32,531
126,760
137,307
8.9
11.3
6.4
23.1
52.6
14.5
1.1
1.0
2.0
7.1
0.8
0.8
Stock Watch
June 13, 2016
Company Name
Reco
CMP
Target
Mkt Cap
Sales ( Čcr )
OPM(%)
EPS (Č)
PER(x)
P/BV(x)
RoE(%)
EV/Sales(x)
(Č)
Price ( Č)
( Č cr )
FY16E FY17E
FY16E
FY17E
FY16E
FY17E
FY16E
FY17E
FY16E
FY17E
FY16E
FY17E
FY16E
FY17E
Oil & Gas
Cairn India
Neutral
146
-
27,382
11,323
12,490
49.4
51.0
20.7
20.7
7.1
7.1
0.5
0.4
6.4
6.1
1.4
0.8
GAIL
Neutral
369
-
46,819
64,856
70,933
9.1
9.6
24.0
28.9
15.4
12.8
1.3
1.2
8.8
9.6
0.9
0.8
ONGC
Neutral
218
-
186,552
154,564
145,998
36.8
37.4
20.8
22.6
10.5
9.7
1.0
0.9
10.1
9.7
1.4
1.5
Petronet LNG
Neutral
276
-
20,670
29,691
31,188
5.8
6.2
12.8
13.4
21.6
20.5
3.2
2.9
15.8
14.8
0.8
0.7
Indian Oil Corp
Accumulate
410
455
99,558
359,607
402,760
5.9
6.1
42.5
48.7
9.7
8.4
1.3
1.1
14.1
14.4
0.4
0.3
Reliance Industries
Buy
976
1,150
316,349
304,775
344,392
12.6
13.4
91.3
102.6
10.7
9.5
1.2
1.1
11.8
12.0
0.9
0.8
Pharmaceuticals
Alembic Pharma
Neutral
562
-
10,595
3,274
3,802
26.9
19.4
35.0
28.7
16.1
19.6
7.1
5.4
55.6
31.2
3.2
2.7
Aurobindo Pharma
Accumulate
745
856
43,589
14,923
17,162
22.0
23.0
35.7
42.8
20.9
17.4
6.1
4.6
34.0
30.2
3.5
3.0
Aventis*
Accumulate
4,223
4,738
9,726
2,049
2,375
15.4
17.3
115.4
153.5
36.6
27.5
6.0
4.7
19.3
25.8
4.6
3.9
Cadila Healthcare
Buy
318
400
32,524
9,469
11,246
21.2
22.0
14.9
17.1
21.3
18.6
6.1
4.8
28.8
26.6
3.4
2.9
Cipla
Buy
476
605
38,261
13,979
16,447
20.2
18.6
25.7
27.5
18.5
17.3
3.0
2.6
17.6
16.1
2.7
2.2
Dr Reddy's
Accumulate
3,065
3,476
52,264
15,471
17,479
24.6
24.6
138.2
152.4
22.2
20.1
4.1
3.5
19.7
18.7
3.4
3.0
Dishman Pharma
Neutral
147
-
2,370
1,733
1,906
21.5
21.5
10.1
10.0
14.5
14.7
1.7
1.5
10.5
11.2
1.9
1.7
GSK Pharma*
Neutral
3,483
-
29,500
2,870
3,158
20.0
22.1
59.5
68.3
58.5
51.0
17.3
17.7
28.5
34.3
9.9
9.1
Indoco Remedies
Neutral
282
-
2,594
1,033
1,199
15.9
18.2
9.4
13.6
30.0
20.7
4.4
3.8
15.7
19.7
2.6
2.3
Ipca labs
Buy
463
750
5,845
3,363
3,909
12.9
18.6
13.4
28.0
34.6
16.5
2.5
2.2
7.4
14.0
1.9
1.6
Lupin
Buy
1,437
1,809
64,778
13,702
15,912
23.7
26.4
50.5
58.1
28.5
24.7
5.9
4.8
22.9
21.4
5.2
4.2
Sun Pharma
Buy
742
950
178,480
28,163
32,610
25.8
30.7
17.4
26.9
42.6
27.6
4.0
3.5
13.0
16.6
5.8
4.8
Power
Tata Power
Neutral
76
-
20,609
35,923
37,402
22.6
22.8
4.1
5.2
18.8
14.8
1.4
1.3
7.5
9.3
1.5
1.4
NTPC
Neutral
151
-
124,630
87,271
99,297
23.5
23.5
11.8
13.3
12.9
11.4
1.4
1.3
11.5
12.2
2.4
2.2
Power Grid
Accumulate
154
170
80,593
20,702
23,361
86.7
86.4
12.1
13.2
12.8
11.7
1.9
1.7
15.6
15.1
8.7
8.1
Real Estate
MLIFE
Buy
453
554
1,858
826
1,011
20.1
21.9
22.7
30.7
19.9
14.8
1.2
1.1
6.0
7.4
4.1
3.1
Telecom
Bharti Airtel
Neutral
351
-
140,409
101,748
109,191
32.1
31.7
12.0
12.5
29.3
28.1
2.0
1.9
6.9
6.7
2.0
1.9
Idea Cellular
Neutral
103
-
37,248
34,282
36,941
32.0
31.5
5.9
6.2
17.5
16.7
1.6
1.5
9.9
9.3
1.7
1.6
zOthers
Abbott India
Neutral
4,460
-
9,478
2,715
3,153
14.5
14.1
134.3
152.2
33.2
29.3
8.3
6.8
27.4
25.6
3.3
2.8
Bajaj Electricals
Buy
230
268
2,322
4,612
5,351
5.6
5.7
23.4
18.0
9.8
12.8
3.0
2.7
12.5
14.4
0.5
0.4
Finolex Cables
Neutral
360
-
5,504
2,520
2,883
12.2
12.0
12.7
14.2
28.4
25.4
3.9
3.4
13.6
13.5
1.9
1.6
Goodyear India*
Accumulate
519
582
1,198
1,800
1,600
11.7
11.5
58.7
52.9
8.8
9.8
2.0
1.7
24.6
18.7
0.4
0.4
Hitachi
Neutral
1,260
-
3,427
1,779
2,081
7.8
8.8
21.8
33.4
57.8
37.7
9.3
7.6
17.4
22.1
2.0
1.7
Stock Watch
June 13, 2016
Company Name
Reco
CMP
Target
Mkt Cap
Sales ( Čcr )
OPM(%)
EPS (Č)
PER(x)
P/BV(x)
RoE(%)
EV/Sales(x)
(Č)
Price ( Č)
( Č cr )
FY16E
FY17E
FY16E
FY17E
FY16E
FY17E
FY16E
FY17E
FY16E
FY17E
FY16E
FY17E
FY16E
FY17E
zOthers
Jyothy Laboratories
Neutral
284
-
5,151
1,620
1,847
11.5
11.5
7.3
8.5
39.0
33.6
5.0
4.7
13.3
14.4
3.1
2.7
MRF
Buy
32,213
45,575
13,662
20,316
14,488
21.4
21.1
5,488.0
3,798.0
5.9
8.5
2.0
1.6
41.1
21.2
0.6
0.9
Page Industries
Neutral
13,678
-
15,257
1,929
2,450
19.8
20.1
229.9
299.0
59.5
45.8
26.3
18.2
52.1
47.1
8.2
6.4
Relaxo Footwears
Neutral
462
-
5,550
1,767
2,152
12.3
12.5
19.3
25.1
24.0
18.5
5.9
4.5
27.7
27.8
3.0
2.5
Siyaram Silk Mills
Buy
1,024
1,347
960
1,619
1,799
11.6
11.6
93.5
104.9
11.0
9.8
1.9
1.6
17.1
16.4
0.8
0.8
Styrolution ABS India* Neutral
622
-
1,093
1,271
1,440
8.6
9.2
32.0
41.1
19.4
15.1
2.0
1.8
10.7
12.4
0.8
0.7
TVS Srichakra
Buy
2,325
2,932
1,780
2,035
2,252
15.9
15.3
248.6
268.1
9.4
8.7
4.1
2.9
43.6
33.9
0.9
0.8
HSIL
Accumulate
264
310
1,912
2,123
2,384
16.1
16.5
15.0
18.9
17.6
14.0
1.4
1.3
8.0
9.4
1.3
1.1
Kirloskar Engines India
Neutral
257
-
3,712
2,403
2,554
8.6
9.9
9.2
10.5
27.9
24.5
2.7
2.6
9.7
10.7
1.2
1.1
Ltd
M M Forgings
Buy
442
546
534
511
615
21.7
21.6
43.1
55.8
10.3
7.9
1.9
1.5
19.9
21.2
1.3
1.0
Banco Products (India) Neutral
138
-
988
1,208
1,353
11.0
12.3
10.8
14.5
12.8
9.5
1.5
1.3
11.9
14.5
0.8
0.7
Competent Automobiles Neutral
142
-
87
1,040
1,137
3.2
3.1
25.7
28.0
5.5
5.1
0.8
0.7
15.0
14.3
0.1
0.1
Nilkamal
Neutral
1,190
-
1,776
1,871
2,031
10.7
10.5
63.2
69.8
18.8
17.1
3.1
2.6
17.6
16.6
1.0
0.9
Visaka Industries
Buy
158
162
251
1,020
1,120
8.7
9.1
13.9
20.1
11.3
7.8
0.7
0.7
6.4
8.7
0.4
0.4
Transport Corporation of
Neutral
304
-
2,331
2,830
3,350
8.8
9.0
14.4
18.3
21.2
16.6
3.3
2.8
15.4
17.1
0.9
0.8
India
Elecon Engineering
Neutral
62
-
671
1,359
1,482
10.3
13.7
0.8
3.9
76.7
15.8
1.3
1.2
1.6
7.8
0.8
0.7
Surya Roshni
Buy
159
201
696
2,992
3,223
8.1
8.4
14.7
18.3
10.8
8.7
1.0
0.9
9.7
11.0
0.5
0.5
MT Educare
Neutral
176
-
701
286
366
18.3
17.7
7.7
9.4
22.8
18.8
4.8
4.2
20.2
21.1
2.4
1.8
Radico Khaitan
Buy
93
125
1,233
1,543
1,659
12.6
13.0
5.8
6.3
16.0
14.6
1.4
1.3
8.5
8.6
1.3
1.2
Garware Wall Ropes
Buy
344
460
753
828
898
11.2
10.3
28.3
29.0
12.2
11.9
2.0
1.8
16.8
14.9
0.9
0.8
Wonderla Holidays
Neutral
395
-
2,232
206
308
44.0
43.6
9.0
12.9
43.9
30.6
6.0
5.4
13.7
17.8
10.4
6.9
Linc Pen & Plastics
Accumulate
208
235
308
344
382
9.1
9.1
12.4
13.1
16.8
15.9
3.0
2.7
18.0
16.7
1.0
0.9
The Byke Hospitality
Neutral
167
-
670
222
287
20.5
20.5
5.6
7.6
29.7
22.1
5.6
4.6
18.9
20.8
3.1
2.4
Interglobe Aviation
Neutral
998
-
35,974
17,022
21,122
20.7
14.5
63.9
53.7
15.6
18.6
23.4
19.2
149.9
103.2
2.1
1.7
Coffee Day Enterprises
Neutral
256
-
5,264
2,692
2,964
17.0
18.6
-
4.7
-
53.9
3.1
3.0
0.2
5.5
2.4
2.2
Ltd
Navneet Education
Neutral
90
-
2,151
998
1,062
24.1
24.0
5.8
6.1
15.7
14.8
3.5
3.1
22.0
20.6
2.1
2.0
Navkar Corporation
Buy
199
265
2,835
347
408
43.2
42.9
6.7
6.8
29.8
29.4
2.2
2.0
7.3
6.9
8.7
7.9
UFO Moviez
Neutral
544
-
1,501
558
619
32.0
33.2
22.5
30.0
24.1
18.1
2.9
2.5
12.0
13.8
2.5
2.1
VRL Logistics
Neutral
310
-
2,828
1,725
1,902
16.5
16.7
12.2
14.6
25.5
21.3
5.3
4.7
20.8
21.9
1.6
1.4
Stock Watch
June 13, 2016
Company Name
Reco
CMP
Target Mkt Cap
Sales ( Čcr )
OPM(%)
EPS (Č)
PER(x)
P/BV(x)
RoE(%)
EV/Sales(x)
(Č)
Price ( Č)
( Č cr )
FY16E FY17E FY16E FY17E FY16E FY17E FY16E FY17E FY16E FY17E FY16E FY17E FY16E FY17E
zOthers
Team Lease Serv.
Neutral
907
-
1,551
2,565
3,229
1.3
1.5
15.2
22.8
59.8
39.8
4.8
4.3
8.0
10.7
0.5
0.4
S H Kelkar & Co.
Neutral
222
-
3,203
928
1,036
15.3
15.1
4.9
6.1
44.9
36.3
4.2
3.9
9.4
10.7
3.2
2.8
Quick Heal
Neutral
246
-
1,723
339
408
27.8
27.3
7.1
7.7
34.8
31.8
2.9
3.0
8.5
9.3
3.8
3.2
Narayana Hrudaya
Neutral
317
-
6,480
1,603
1,873
10.9
11.5
1.0
2.6
332.9
119.9
8.0
7.4
2.4
6.1
4.1
3.5
Manpasand Bever.
Neutral
542
-
2,713
540
836
19.9
19.6
10.2
16.9
52.9
32.1
4.3
3.9
8.1
12.0
4.7
3.0
Source: Company, Angel Research; Note: *December year end; #September year end; &October year end; Price as on June 10, 2016
Market Outlook
June 13, 2016
Research Team Tel: 022 - 39357800
DISCLAIMER
Angel Broking Private Limited (hereinafter referred to as “Angel”) is a registered Member of National Stock Exchange of India Limited,
Bombay Stock Exchange Limited and Metropolitian Stock Exchange of India Limited. It is also registered as a Depository Participant with
CDSL and Portfolio Manager with SEBI. It also has registration with AMFI as a Mutual Fund Distributor. Angel Broking Private Limited is a
registered entity with SEBI for Research Analyst in terms of SEBI (Research Analyst) Regulations, 2014 vide registration number
INH000000164. Angel or its associates has not been debarred/ suspended by SEBI or any other regulatory authority for accessing
/dealing in securities Market. Angel or its associates including its relatives/analyst do not hold any financial interest/beneficial ownership
of more than 1% in the company covered by Analyst. Angel or its associates/analyst has not received any compensation / managed or co
-managed public offering of securities of the company covered by Analyst during the past twelve months. Angel/analyst has not served as
an officer, director or employee of company covered by Analyst and has not been engaged in market making activity of the company
covered by Analyst.
This document is solely for the personal information of the recipient, and must not be singularly used as the basis of any investment
decision. Nothing in this document should be construed as investment or financial advice. Each recipient of this document should make
such investigations as they deem necessary to arrive at an independent evaluation of an investment in the securities of the companies
referred to in this document (including the merits and risks involved), and should consult their own advisors to determine the merits and
risks of such an investment.
Reports based on technical and derivative analysis center on studying charts of a stock's price movement, outstanding positions and
trading volume, as opposed to focusing on a company's fundamentals and, as such, may not match with a report on a company's
fundamentals.
The information in this document has been printed on the basis of publicly available information, internal data and other reliable sources
believed to be true, but we do not represent that it is accurate or complete and it should not be relied on as such, as this document is for
general guidance only. Angel Broking Pvt. Limited or any of its affiliates/ group companies shall not be in any way responsible for any
loss or damage that may arise to any person from any inadvertent error in the information contained in this report. Angel Broking Pvt.
Limited has not independently verified all the information contained within this document. Accordingly, we cannot testify, nor make any
representation or warranty, express or implied, to the accuracy, contents or data contained within this document. While Angel Broking
Pvt. Limited endeavors to update on a reasonable basis the information discussed in this material, there may be regulatory, compliance,
or other reasons that prevent us from doing so.
This document is being supplied to you solely for your information, and its contents, information or data may not be reproduced,
redistributed or passed on, directly or indirectly.
Neither Angel Broking Pvt. Limited, nor its directors, employees or affiliates shall be liable for any loss or damage that may arise from or
in connection with the use of this information.
Note: Please refer to the important ‘Stock Holding Disclosure' report on the Angel website (Research Section). Also, please refer to the
latest update on respective stocks for the disclosure status in respect of those stocks. Angel Broking Pvt. Limited and its affiliates may have
investment positions in the stocks recommended in this report.