Market Outlook
April 13, 2016
Market Cues
Domestic Indices
Chg (%)
(Pts)
(Close)
Indian markets are expected to open on a Positive note tracking the SGX Nifty and
BSE Sensex
0.5
123
25,146
Global Markets.
Nifty
0.5
38
7,709
US stocks posted solid gains yesterday after initially showing a lack of direction. The
Mid Cap
1.0
108
10,817
strength in the markets was primarily led by energy stocks which gained on reports
Small Cap
0.9
96
10,828
of Saudi Arabia and Russia working toward an agreement to cut oil production.
Bankex
0.5
90
18,080
European stocks rose and closed mostly higher on Tuesday at the end of a choppy
session, helped by gains in Energy and Mining stocks owing to rising commodity
Global Indices
Chg (%)
(Pts)
(Close)
prices.
Dow Jones
0.9
165
17,721
The Indian markets ended on a strong note for a second consecutive session on
Nasdaq
0.8
39
4,872
Tuesday, led by companies with higher rural exposure, which gained after the
FTSE
0.7
42
6,242
private forecaster Skymet forecasted an "above average" monsoon this year.
Nikkei
1.1
178
15,929
News & Result Analysis
Hang Seng
0.3
64
20,504
Three Cheers for Indian economy. Low Inflation and positive IIP and above
Shanghai Com
(0.3)
(10)
3,024
normal monsoon
Detailed analysis on Pg2
Advances / Declines
BSE
NSE
Investor’s Ready Reckoner
Advances
1,536
960
Key Domestic & Global Indicators
Declines
1,098
604
Stock Watch: Latest investment recommendations on 150+ stocks
Unchanged
122
76
Refer Pg6 onwards
Volumes (` Cr)
Top Picks
CMP
Target
Upside
BSE
2,466
Company
Sector
Rating
(`)
(`)
(%)
NSE
15,911
Amara Raja
Auto & Auto Ancillary
Buy
895
1,040
16.3
HCL Tech
IT
Buy
839
1,038
23.7
Net Inflows (` Cr)
Net
Mtd
Ytd
LIC Housing
Financials
Buy
479
592
23.6
FII
156
(917)
(13,775)
Bharat Electronics
Capital Goods
Buy
1,184
1,414
19.5
MFs
291
(755)
63,263
Navkar Corporation Others
Buy
182
265
45.8
More Top Picks on Pg4
Top Gainers
Price (`)
Chg (%)
Key Upcoming Events
Escorts
169
10.5
Previous
Consensus
Date
Region
Event Description
Reading
Expectations
Pvr
798
7.4
Apr 13 US
Producer Price Index (mom)
(0.6)
-
Wockpharma
1,029
6.3
Apr 13 China
Exports YoY%
(25.40)
10.00
Jisljaleqs
63
6.1
Apr 14 US
Initial Jobless claims
267.00
270.00
Petronet
258
5.8
Apr 14 US
Consumer price index (mom)
(0.20)
0.20
6.(6.(
More Events on Pg5
Top Losers
Price (`)
Chg (%)
Mrpl
64
(5.8)
Balramchin
104
(3.8)
Aloktext
5
(3.0)
Gmdcltd
65
(2.5)
Naukri
779
(2.4)
As on April 12, 2016
Market Outlook
April 13, 2016
Three Cheers for Indian economy. Low Inflation and positive IIP
and above normal monsoon:
The IIP numbers have given a positive surprise with a growth of 2% for the month
of February 2016. After three months of drop the rise in the Industrial output
certainly speaks a positive word for the economy. The rise in IIP has got a boost
from 9% growth in electricity generation and a 5% growth in mining output. The IIP
numbers had seen a decline of 0.5% in the month of Januray, 2016. If we
consider the cumulative data than the IIP numbers from April to February 2016 the
growth is at 2.6%, little lower than the 2.8% reported in the same period previous
years.
What comes as another surprise is a further drop in the retail inflation. The CPI
inflation for March, 2016 has fallen to 4.83% from 5.26% a month ago. Though
there were already expectations of falling inflation and hence the RBI had offered
25 bps rate cut in the recent policy meet this paves way for further easing of rates
during the rest of the year. We expect the RBI has room for another 25 bps rate cut
in the months to come. However, that would be possible only after further
reduction in lending rates by the Banks.
The third and very encouraging set of news has been the expectations of an above
normal monsoon for the India this year. After two consecutive years of below
normal rainfall the IMD has expects monsoon for the years to be 106% of normal
with a model error of 5%. We think all the things are falling in place for the Indian
economy and see better days ahead.
Quarterly Bloomberg Brokers Consensus Estimate
Infosys Ltd Consol - April 15, 2016
Particulars (` cr)
4QFY16E
4QFY15
y-o-y (%)
3QFY16
q-o-q (%)
Net sales
16,566
13,411
23.5
15,902
4.2
EBITDA
4,572
3,732
22.5
4,328
5.6
EBITDA margin (%)
27.6
27.8
27.2
Net profit
3,521
3,097
13.7
3,465
1.6
LIC Housing Finance Ltd - April 18, 2016
Particulars (` cr)
4QFY16E
4QFY15
y-o-y (%)
3QFY16
q-o-q (%)
PAT
461
378
22.0
419
10.2
Tata Consultancy Services Ltd Consol - April 18, 2016
Particulars (` cr)
4QFY16E
4QFY15
y-o-y (%)
3QFY16
q-o-q (%)
Net sales
28,368
24,220
17.1
27,364
3.7
EBITDA
8,178
4,281
91.1
7,747
5.6
EBITDA margin (%)
28.8
17.7
28.3
Net profit
6,284
5,906
6.4
6,083
3.3
Wipro Ltd Consol - April 20, 2016
Particulars (` cr)
4QFY16E
4QFY15
y-o-y (%)
3QFY16
q-o-q (%)
Net sales
13,467
12,142
10.9
12,861
4.7
EBITDA
2,911
2,753
5.7
2,673
8.9
EBITDA margin (%)
21.6
22.7
20.8
Net profit
2,361
2,272
3.9
2,234
5.7
Market Outlook
April 13, 2016
Economic and Political News
Govt initiates anti-dumping probe into imports of hot-rolled coils, plates
At 106% rainfall, IMD predicts above-normal monsoon in 2016
Iron ore imports tank 63% in FY16 to 5.6 mt
Corporate News
Axis Bank lowers lending rate by 15 bps to 8.95%
RIL invite bids to develop deep sea fields, may end arbitration row with
government
ITC goes online for lifestyle business growth
TVS Infotech acquires majority stake in Blisslogix Technology
Market Outlook
April 13, 2016
Top Picks ★★★★★
Large Cap
Market Cap
CMP
Target
Upside
Company
Rationale
(` Cr)
(`)
(`)
(%)
To outpace battery industry growth due to better technological
Amara Raja Batteries
15,281
895
1,040
16.3
products leading to market share gains in both the automotive
OEM and replacement segments.
Uptick in defense capex by government when coupled with
Bharat Electronics
28,406
1,184
1,414
19.5
BELs strong market positioning, indicate that good times are
ahead for BEL.
The stock is trading at attractive valuations and is factoring all
HCL Tech
1,18,310
839
1,038
23.7
the bad news.
Strong visibility for a robust 20% earnings trajectory, coupled
HDFC Bank
2,68,999
1,064
1,262
18.6
with high quality of earnings on account of high quality retail
business and strategic focus on highly rated corporates.
Back on the growth trend, expect a long term growth of 14%
Infosys
2,72,455
1,182
1,347
13.9
to be a US$20bn in FY2020.
LICHF continues to grow its retail loan book at a healthy pace
with improvement in asset quality. We expect the company to
LIC Housing Finance
24,151
479
592
23.6
post a healthy loan book which is likely to reflect in a strong
earnings growth.
Huge bid pipeline of re-development works at Delhi and other
NBCC
11,829
986
1,089
10.5
State Governments and opportunity from Smart City, positions
NBCC to report strong growth, going forward.
Source: Company, Angel Research
Mid Cap
Market Cap
CMP
Target
Upside
Company
Rationale
(` Cr)
(`)
(`)
(%)
Favorable outlook for the AC industry to augur well for
Cooling products business which is out pacing the market
Blue Star
3,592
399
458
14.7
growth. EMPPAC division's profitability to improve once
operating environment turns around.
With a focus on the low and medium income (LMI) consumer
Dewan Housing
5,613
192
270
40.4
segment, the company has increased its presence in tier-II &
III cities where the growth opportunity is immense.
Commencement of new projects, downtrend in the interest
IL&FS Transport
2,558
78
93
19.6
rate cycle, to lead to stock re-rating
Economic recovery to have favourable impact on advertising
& circulation revenue growth. Further, the acquisition of a
Jagran Prakashan
5,155
158
189
19.8
radio business (Radio City) would also boost the company's
revenue growth.
Speedier execution and speedier sales, strong revenue visibilty
Mahindra Lifespace
1,790
436
554
27.0
in short-to-long run, attractive valuations
Massive capacity expansion along with rail advantage at ICD
Navkar Corporation
2,592
182
265
45.8
as well CFS augurs well for the company
Earnings boost on back of stable material prices and
Radico Khaitan
1,163
87
156
78.4
favourable pricing environment. Valuation discount to peers
provides additional comfort
Strong brands and distribution network would boost growth
Siyaram Silk Mills
947
1,010
1,354
34.1
going ahead. Stock currently trades at an inexpensive
valuation.
Source: Company, Angel Research
Market Outlook
April 13, 2016
Key Upcoming Events
Result Calendar
Date
Company
Apr 15, 2016
Infosys
Apr 18, 2016
LIC Housing Fin., TCS, Mindtree
Apr 20, 2016
Wipro
Apr 21, 2016
IndusInd Bank, Infotech Enterprises
Apr 22, 2016
HDFC Bank, Cairn India
Apr 24, 2016
Persistent
Apr 26, 2016
Maruti, Axis Bank
Apr 27, 2016
Exide Industries, FAG Bearings, Elecon Engineering
Apr 28, 2016
Ambuja Cements, Dabur India
Apr 29, 2016
ICICI Bank, Aventis
May 2, 2016
HDFC
May 3, 2016
Godrej Consumer
May 4, 2016
Vesuvius India
Source: Bloomberg, Angel Research
Global economic events release calendar
Date
Time
Country
Event Description
Unit
Period
Bloomberg Data
Last Reported Estimated
Apr 13, 2016
US
Producer Price Index (mom)
% Change
Mar
(0.60)
--
China
Exports YoY%
% Change
Mar
(25.40)
10.00
Apr 14, 2016
6:00 PM
US
Initial Jobless claims
Thousands
Apr 9
267.00
270.00
6:00 PM
US
Consumer price index (mom)
% Change
Mar
(0.20)
0.20
2:30 PM
Euro Zone
Euro-Zone CPI (YoY)
%
Mar F
(0.10)
(0.10)
4:30 PM
UK
BOE Announces rates
% Ratio
Apr 14
0.50
0.50
Apr 15, 2016
India
Imports YoY%
% Change
Mar
(5.00)
--
India
Exports YoY%
% Change
Mar
(5.66)
--
6:45 PM
US
Industrial Production
%
Mar
(0.52)
(0.10)
7:30 AM
China
Industrial Production (YoY)
% Change
Mar
5.90
5.90
7:30 AM
China
Real GDP (YoY)
% Change
1Q
6.80
6.70
Apr 18, 2016
2:00 PM
India
Monthly Wholesale Prices YoY%
% Change
Mar
(0.91)
(0.74)
Apr 19, 2016
6:00 PM
US
Housing Starts
Thousands
Mar
1,178.00
1,160.00
6:00 PM
US
Building permits
Thousands
Mar
1,177.00
1,208.00
Apr 20, 2016
7:30 PM
US
Existing home sales
Million
Mar
5.08
5.29
2:00 PM
UK
Jobless claims change
% Change
Mar
(18.00)
--
Apr 21, 2016
7:30 PM
Euro Zone
Euro-Zone Consumer Confidence
Value
Apr A
(9.70)
--
5:15 PM
Euro Zone
ECB announces interest rates
%
Apr 21
--
--
Apr 22, 2016
1:00 PM
Germany
PMI Services
Value
Apr P
55.10
--
1:00 PM
Germany
PMI Manufacturing
Value
Apr P
50.70
--
Apr 25, 2016
7:30 PM
US
New home sales
Thousands
Mar
512.00
--
Apr 26, 2016
7:30 PM
US
Consumer Confidence
S.A./ 1985=100
Apr
96.20
--
Apr 27, 2016
2:00 PM
UK
GDP (YoY)
% Change
1Q A
2.10
--
1:30 PM
US
FOMC rate decision
%
Apr 27
0.50
0.50
Apr 28, 2016
1:25 PM
Germany
Unemployment change (000's)
Thousands
Apr
--
--
6:00 PM
US
GDP Qoq (Annualised)
% Change
1Q A
1.40
--
Apr 29, 2016
2:30 PM
Euro Zone
Euro-Zone GDP s.a. (QoQ)
% Change
1Q A
0.30
--
May 1,, 2016
6:30 AM
China
PMI Manufacturing
Value
Apr
50.20
--
Source: Bloomberg, Angel Research
Market Outlook
April 13, 2016
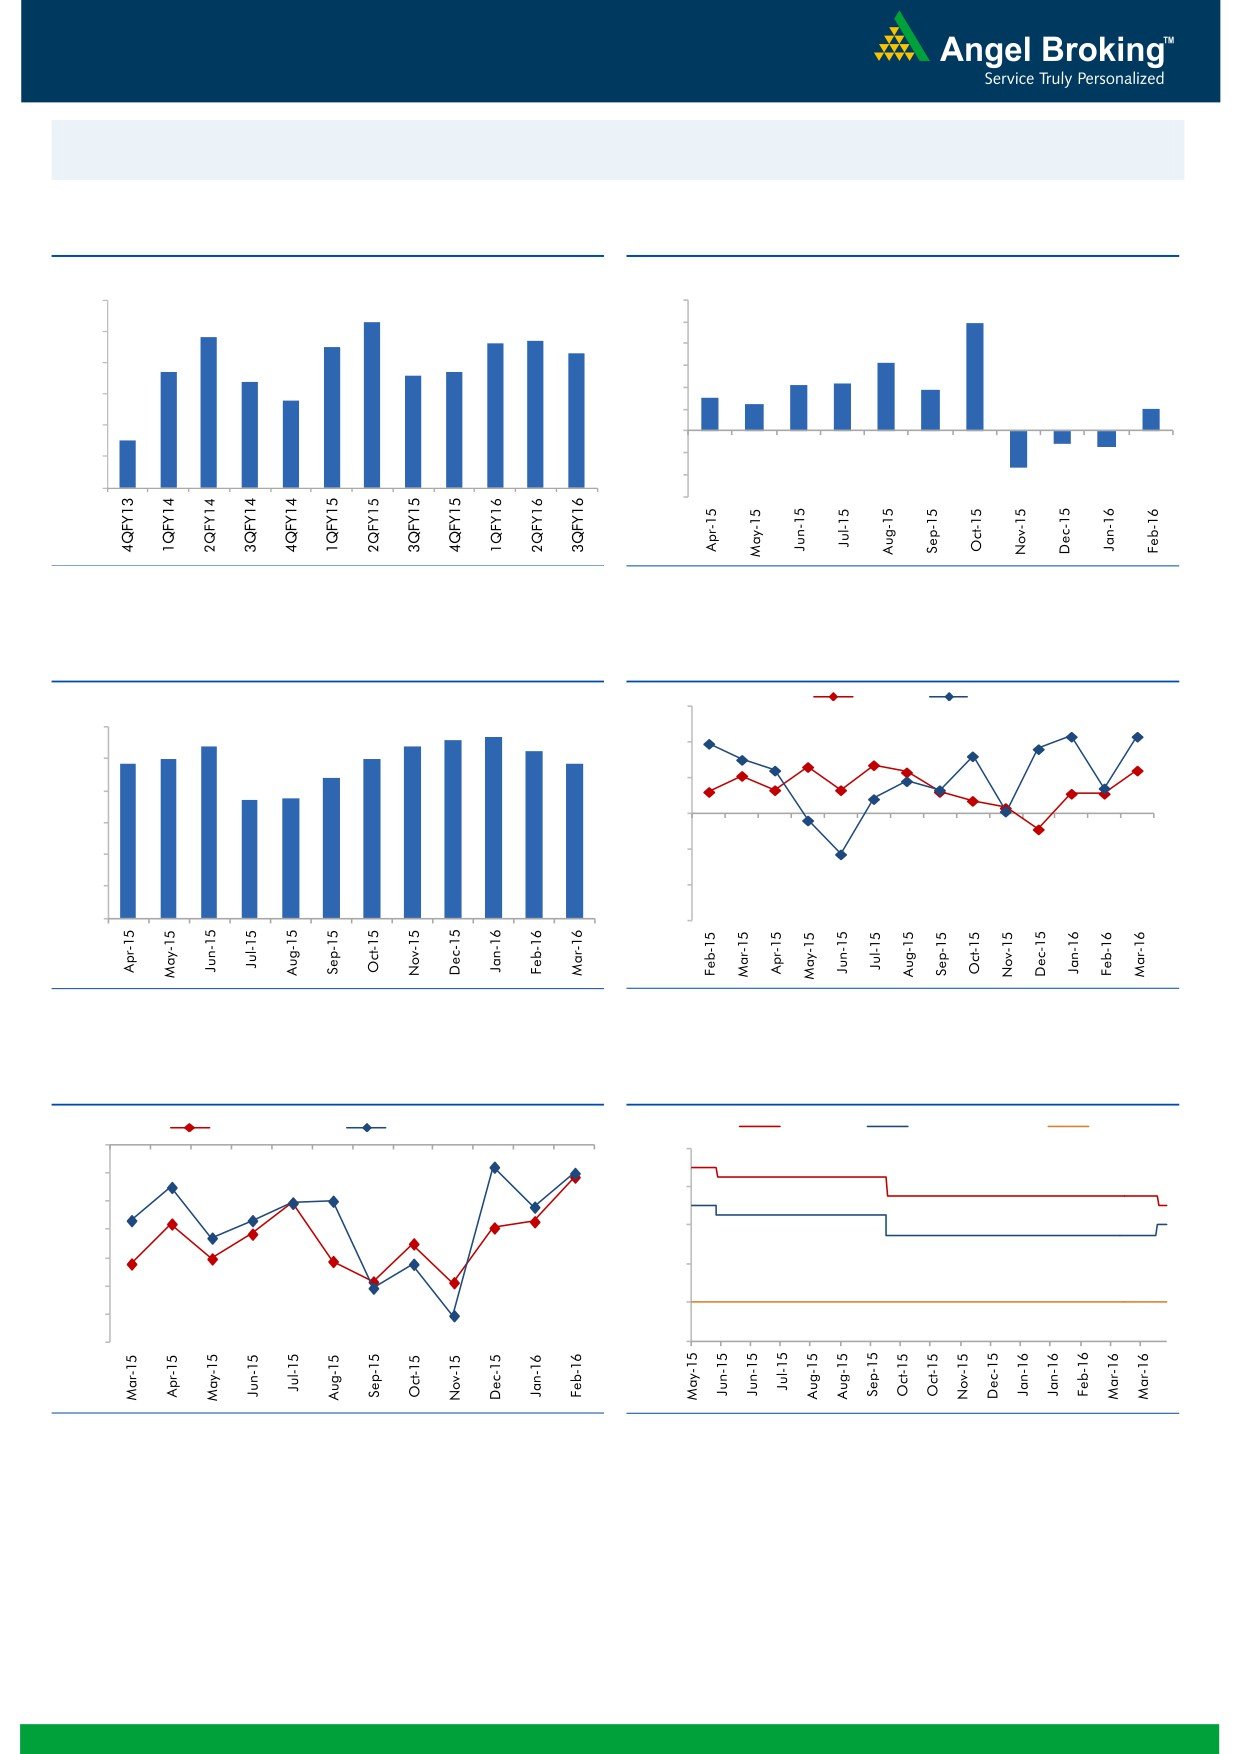
Macro watch
Exhibit 1: Quarterly GDP trends
Exhibit 2: IIP trends
(%)
(%)
9.0
8.3
12.0
9.9
7.8
7.7
10.0
8.0
7.5
7.6
7.3
8.0
6.3
6.7
6.6
6.7
7.0
6.4
6.0
4.2
4.3
3.7
5.8
3.0
2.5
6.0
4.0
2.0
2.0
5.0
4.5
-
4.0
(2.0)
(1.2)
(1.5)
(4.0)
3.0
(3.4)
(6.0)
Source: CSO, Angel Research
Source: MOSPI, Angel Research
Exhibit 3: Monthly CPI inflation trends
Exhibit 4: Manufacturing and services PMI
Mfg. PMI
Services PMI
(%)
56.0
5.6
5.7
6.0
5.4
5.4
5.3
4.9
5.0
5.0
4.8
54.0
5.0
4.4
3.7
3.7
52.0
4.0
50.0
3.0
48.0
2.0
1.0
46.0
-
44.0
Source: MOSPI, Angel Research
Source: Market, Angel Research; Note: Level above 50 indicates expansion
Exhibit 5: Exports and imports growth trends
Exhibit 6: Key policy rates
(%)
Exports yoy growth
Imports yoy growth
(%)
Repo rate
Reverse Repo rate
CRR
0.0
8.00
(5.0)
7.00
(10.0)
(15.0)
6.00
(20.0)
5.00
(25.0)
4.00
(30.0)
(35.0)
3.00
Source: Bloomberg, Angel Research
Source: RBI, Angel Research
Market Outlook
April 13, 2016
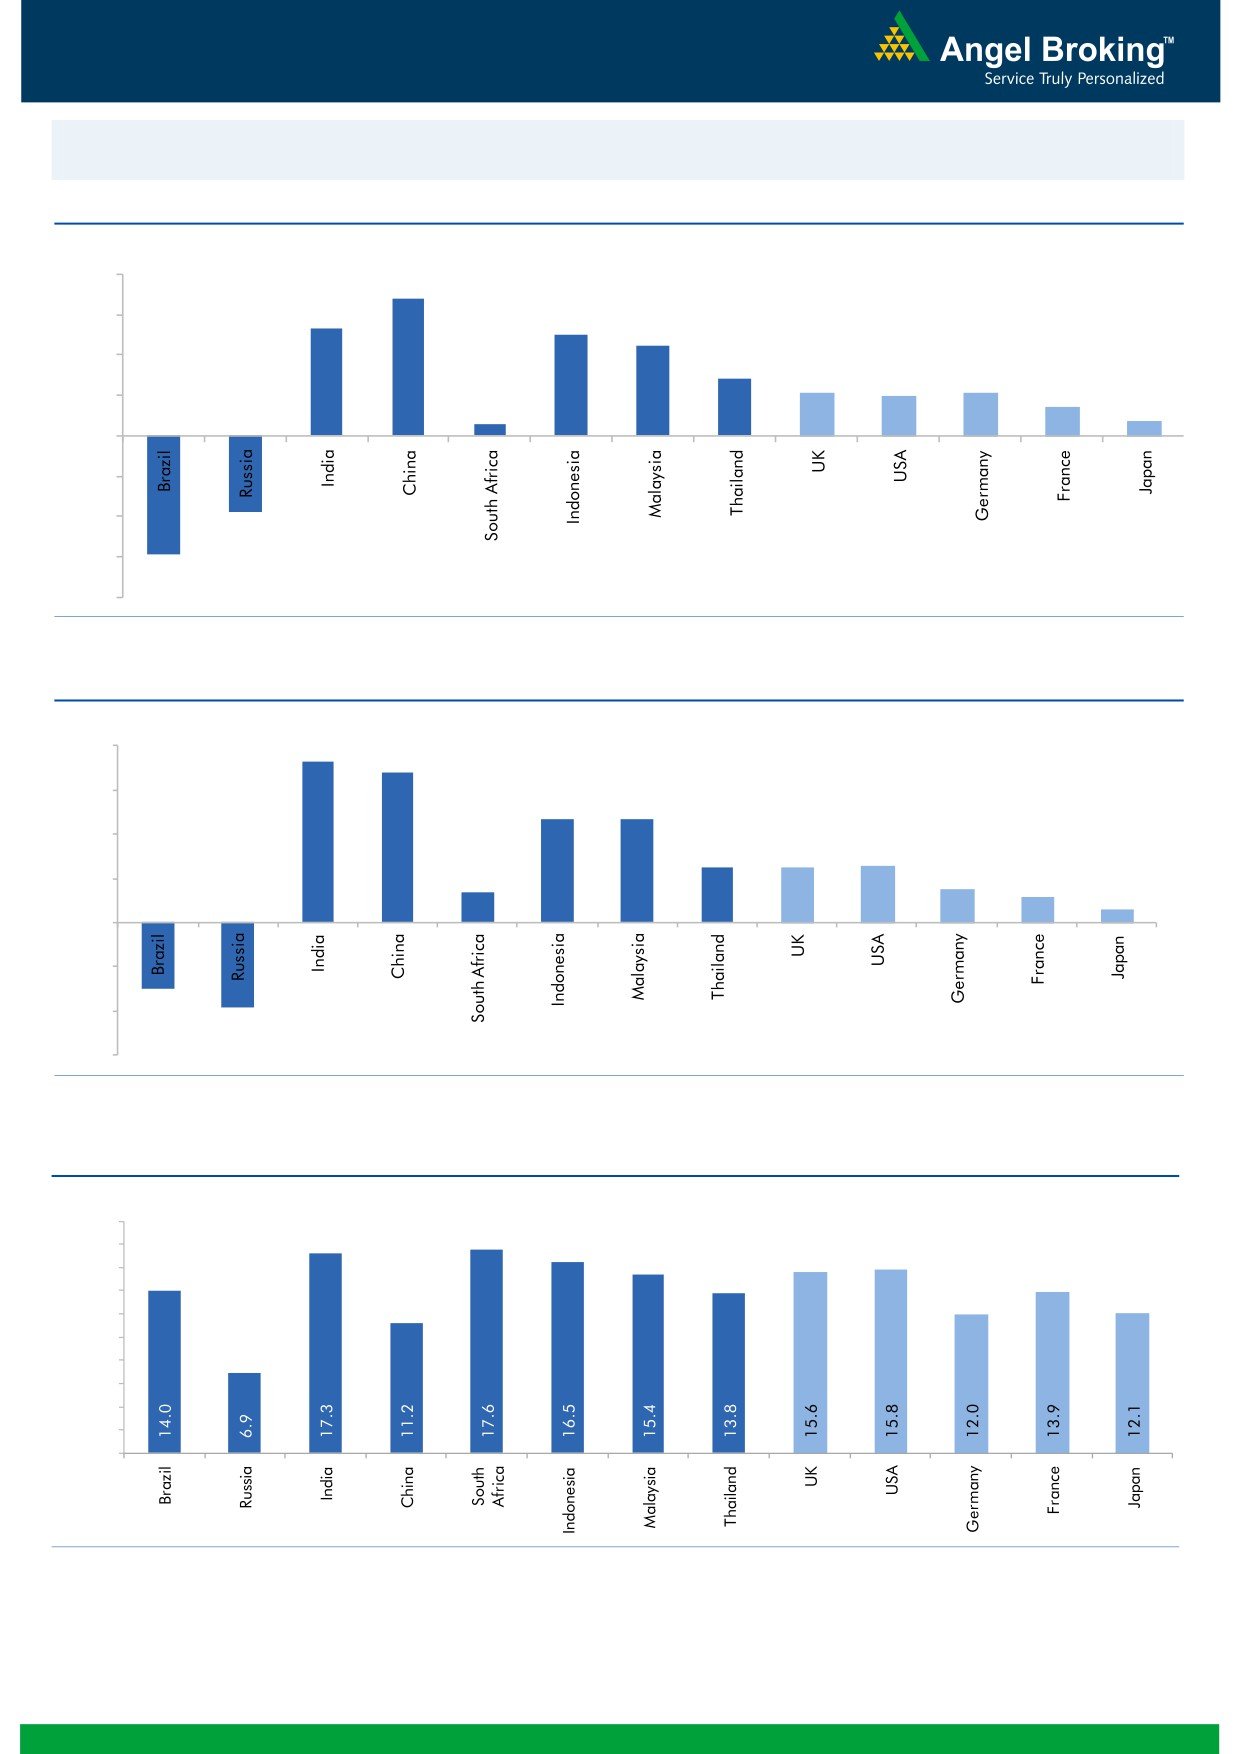
Global watch
Exhibit 1: Latest quarterly GDP Growth (%, yoy) across select developing and developed countries
(%)
8.0
6.8
6.0
5.3
5.0
4.5
4.0
2.8
2.1
2.0
2.1
1.4
2.0
0.6
0.7
-
(2.0)
(4.0)
(3.8)
(6.0)
(5.9)
(8.0)
Source: Bloomberg, Angel Research
Exhibit 2: 2015 GDP Growth projection by IMF (%, yoy) across select developing and developed countries
(%)
8.0
7.3
6.8
6.0
4.7
4.7
4.0
2.5
2.5
2.6
1.4
1.5
2.0
1.2
0.6
-
(2.0)
(3.0)
(4.0)
(3.8)
(6.0)
Source: IMF, Angel Research
Exhibit 3: One year forward P-E ratio across select developing and developed countries
(x)
20.0
18.0
16.0
14.0
12.0
10.0
8.0
6.0
4.0
2.0
-
Source: IMF, Angel Research
Market Outlook
April 13, 2016
Exhibit 4: Relative performance of indices across globe
Returns (%)
Country
Name of index
Closing price
1M
3M
1YR
Brazil
Bovespa
52,002
4.9
27.8
(2.1)
Russia
Micex
1,899
1.2
12.9
14.6
India
Nifty
7,709
2.4
1.9
(11.5)
China
Shanghai Composite
3,024
8.9
(9.0)
(20.8)
South Africa
Top 40
45,751
(1.0)
5.8
(2.9)
Mexico
Mexbol
45,091
1.3
10.9
0.2
Indonesia
LQ45
836
0.3
8.8
(11.6)
Malaysia
KLCI
1,715
1.1
3.6
(6.9)
Thailand
SET 50
880
(0.9)
14.3
(12.9)
USA
Dow Jones
17,721
4.3
8.4
(1.7)
UK
FTSE
6,242
1.6
6.3
(12.0)
Japan
Nikkei
15,929
(5.5)
(10.0)
(17.5)
Germany
DAX
9,761
0.4
(0.6)
(20.2)
France
CAC
4,346
(1.8)
0.8
(16.2)
Source: Bloomberg, Angel Research
Stock Watch
April 13, 2016
Company Name
Reco
CMP
Target
Mkt Cap
Sales ( Čcr )
OPM(%)
EPS (Č)
PER(x)
P/BV(x)
RoE(%)
EV/Sales(x)
(Č)
Price ( Č)
( Č cr )
FY16E FY17E
FY16E
FY17E
FY16E
FY17E
FY16E
FY17E
FY16E
FY17E
FY16E
FY17E
FY16E
FY17E
Agri / Agri Chemical
Rallis
Neutral
183
-
3,558
2,097
2,415
14.4
14.4
9.5
11.0
19.3
16.6
3.8
3.3
21.1
21.3
1.7
1.5
United Phosphorus
Neutral
494
-
21,182
12,500
14,375
18.3
18.3
29.8
35.9
16.6
13.8
3.1
2.6
20.0
20.3
1.8
1.5
Auto & Auto Ancillary
Ashok Leyland
Neutral
112
-
31,746
17,995
21,544
11.4
11.6
3.4
4.7
32.8
23.7
5.8
5.3
17.7
22.2
1.7
1.4
Bajaj Auto
Accumulate
2,459
2,585
71,158
22,709
25,860
20.9
20.1
129.0
143.6
19.1
17.1
5.8
5.0
30.7
29.4
2.7
2.3
Bharat Forge
Accumulate
805
875
18,736
7,351
8,318
19.9
19.7
31.2
36.5
25.8
22.1
4.6
3.9
19.3
19.2
2.7
2.3
Eicher Motors
Neutral
19,558
-
53,121
15,556
16,747
15.5
17.3
464.8
597.5
42.1
32.7
15.4
11.3
36.2
34.3
3.3
3.1
Gabriel India
Accumulate
94
101
1,355
1,415
1,544
8.7
9.0
4.6
5.4
20.5
17.5
3.7
3.3
18.1
18.9
0.9
0.8
Hero Motocorp
Neutral
3,050
-
60,904
28,244
30,532
15.5
15.9
156.7
168.5
19.5
18.1
7.8
6.6
39.9
36.4
2.0
1.8
Jamna Auto Industries Accumulate
147
160
1,175
1,281
1,473
11.2
11.5
7.6
9.2
19.4
16.0
4.9
4.0
25.4
25.2
1.0
0.8
L G Balakrishnan & Bros Neutral
467
-
733
1,254
1,394
11.6
11.8
35.9
41.7
13.0
11.2
1.8
1.6
13.5
13.8
0.7
0.6
Mahindra and Mahindra Accumulate
1,241
1,364
77,062
38,416
42,904
13.7
13.9
54.8
63.4
22.6
19.6
3.5
3.1
15.4
15.8
1.7
1.4
Maruti
Neutral
3,577
-
108,043
57,865
68,104
16.4
16.7
176.3
225.5
20.3
15.9
3.9
3.4
19.4
21.2
1.6
1.3
Minda Industries
Neutral
1,018
-
1,615
2,523
2,890
8.7
9.0
55.0
65.4
18.5
15.6
3.6
2.9
19.3
18.7
0.7
0.6
Motherson Sumi
Buy
251
313
33,194
39,343
45,100
8.8
9.1
10.1
12.5
24.9
20.1
7.9
6.2
35.3
34.4
0.9
0.8
Rane Brake Lining
Buy
378
465
299
454
511
11.5
12.0
25.2
31.0
15.0
12.2
2.2
2.0
14.9
16.6
0.8
0.7
Setco Automotive
Neutral
31
-
412
594
741
12.7
13.7
1.7
3.2
18.2
9.6
1.9
1.7
10.4
16.9
1.1
0.9
Tata Motors
Neutral
395
-
114,073
259,686
273,957
13.0
13.4
25.9
29.5
15.3
13.4
2.0
1.7
8.0
9.0
0.6
0.6
TVS Motor
Neutral
319
-
15,139
11,263
13,122
6.9
8.5
9.2
15.0
34.6
21.2
7.9
6.3
22.7
29.6
1.3
1.1
Amara Raja Batteries
Buy
895
1,040
15,281
4,892
5,871
17.4
17.6
28.8
37.1
31.1
24.1
7.3
5.8
23.4
24.1
3.1
2.5
Exide Industries
Buy
136
162
11,530
6,950
7,784
14.4
14.8
6.6
7.3
20.6
18.6
2.6
2.4
12.6
12.8
1.4
1.2
Apollo Tyres
Accumulate
168
183
8,572
12,056
12,714
17.2
16.4
23.0
20.3
7.3
8.3
1.3
1.1
17.7
13.6
0.8
0.8
Ceat
Neutral
1,124
-
4,547
6,041
6,597
14.1
13.7
99.5
111.9
11.3
10.1
2.2
1.9
19.6
18.5
0.9
0.8
JK Tyres
Neutral
84
-
1,915
7,446
7,669
15.2
14.0
19.6
18.4
4.3
4.6
1.1
0.9
25.2
19.5
0.7
0.6
Swaraj Engines
Neutral
995
-
1,236
552
630
14.2
14.7
44.6
54.1
22.3
18.4
5.2
4.7
23.2
25.6
2.1
1.8
Subros
Neutral
90
-
538
1,293
1,527
11.8
11.9
4.2
6.7
21.4
13.4
1.6
1.5
7.7
11.5
0.7
0.6
Indag Rubber
Neutral
188
-
492
283
329
17.0
17.2
13.0
15.4
14.5
12.2
3.2
2.6
21.8
21.6
1.5
1.2
Capital Goods
ACE
Neutral
41
-
406
660
839
4.7
8.2
1.0
3.9
41.1
10.5
1.3
1.1
3.2
11.3
0.8
0.6
BEML
Buy
905
1,157
3,768
3,277
4,006
6.0
8.9
36.2
64.3
25.0
14.1
1.7
1.6
5.7
11.7
1.2
1.0
Bharat Electronics
Buy
1,184
1,414
28,406
7,737
8,634
16.8
17.2
54.0
61.5
21.9
19.3
3.1
2.8
39.3
45.6
2.8
2.4
Stock Watch
April 13, 2016
Company Name
Reco
CMP
Target
Mkt Cap
Sales ( Čcr )
OPM(%)
EPS (Č)
PER(x)
P/BV(x)
RoE(%)
EV/Sales(x)
(Č)
Price ( Č)
( Č cr )
FY16E
FY17E
FY16E
FY17E
FY16E
FY17E
FY16E
FY17E
FY16E
FY17E
FY16E
FY17E
FY16E
FY17E
Capital Goods
Voltas
Buy
278
353
9,189
5,363
5,963
8.0
9.1
11.0
13.8
25.3
20.1
3.9
3.4
16.2
17.9
1.7
1.5
BGR Energy
Neutral
109
-
785
3,615
3,181
9.5
9.4
16.7
12.4
6.5
8.8
0.6
0.6
10.0
7.0
0.6
0.8
BHEL
Neutral
127
-
31,121
33,722
35,272
10.8
11.7
10.5
14.2
12.1
9.0
0.9
0.8
7.0
9.0
1.0
1.0
Blue Star
Accumulate
399
458
3,592
3,548
3,977
6.3
6.9
13.7
17.2
29.2
23.3
7.3
4.8
26.1
25.4
1.1
0.9
Crompton Greaves
Neutral
53
-
3,319
13,484
14,687
4.9
6.2
4.5
7.1
11.8
7.5
0.8
0.8
7.2
10.8
0.4
0.3
Greaves Cotton
Neutral
131
-
3,208
1,655
1,755
16.6
16.8
7.4
7.8
17.8
16.8
3.6
3.4
21.1
20.6
1.9
1.8
Inox Wind
Buy
253
458
5,613
4,980
5,943
17.0
17.5
26.6
31.6
9.5
8.0
2.8
2.1
35.0
30.0
1.3
1.0
KEC International
Neutral
131
-
3,364
8,791
9,716
6.1
6.8
5.4
8.2
24.2
16.0
2.4
2.2
10.0
14.0
0.6
0.6
Thermax
Neutral
747
-
8,906
6,413
7,525
7.4
8.5
30.5
39.3
24.5
19.0
3.8
3.3
15.0
17.0
1.4
1.1
VATech Wabag
Neutral
565
-
3,077
2,722
3,336
7.9
8.1
19.5
24.6
29.0
23.0
3.0
2.7
11.1
12.4
1.2
1.0
Cement
ACC
Neutral
1,447
-
27,162
13,151
14,757
16.4
18.3
63.9
83.4
22.6
17.4
2.9
2.7
13.3
16.1
1.9
1.6
Ambuja Cements
Neutral
224
-
34,708
11,564
12,556
19.4
20.7
8.9
10.1
25.1
22.1
3.2
3.0
12.8
13.8
2.6
2.4
HeidelbergCement
Neutral
97
-
2,197
1,772
1,926
13.3
15.4
1.0
3.0
97.0
32.3
2.5
2.3
2.6
7.9
1.8
1.6
India Cements
Neutral
93
-
2,861
4,216
4,840
18.0
19.5
4.0
9.9
23.3
9.4
0.9
0.9
4.0
9.5
1.0
0.8
JK Cement
Neutral
661
-
4,625
3,661
4,742
10.1
15.8
7.5
28.5
88.2
23.2
2.7
2.4
7.5
22.9
1.7
1.3
J K Lakshmi Cement
Neutral
343
-
4,038
2,947
3,616
16.7
19.9
11.5
27.2
29.8
12.6
2.8
2.4
9.8
20.8
1.8
1.4
Mangalam Cements
Neutral
241
-
644
1,053
1,347
10.5
13.3
8.4
26.0
28.7
9.3
1.2
1.1
4.3
12.5
1.0
0.7
Orient Cement
Neutral
155
-
3,169
1,854
2,524
21.2
22.2
7.7
11.1
20.1
13.9
2.9
2.5
13.3
15.7
2.4
1.7
Ramco Cements
Neutral
430
-
10,235
4,036
4,545
20.8
21.3
15.1
18.8
28.5
22.9
3.5
3.1
12.9
14.3
3.0
2.6
Shree Cement^
Neutral
12,503
-
43,555
7,150
8,742
26.7
28.6
228.0
345.5
54.8
36.2
8.1
6.8
15.7
20.3
5.8
4.7
UltraTech Cement
Neutral
3,165
-
86,855
24,669
29,265
18.2
20.6
82.0
120.0
38.6
26.4
4.2
3.6
11.3
14.7
3.6
3.0
Construction
ITNL
Buy
78
93
2,558
7,360
8,825
34.0
35.9
7.0
9.0
11.1
8.6
0.4
0.4
3.2
3.7
3.7
3.6
KNR Constructions
Buy
522
603
1,467
937
1,470
14.3
14.0
44.2
38.6
11.8
13.5
2.4
2.0
15.4
15.4
1.6
1.1
Larsen & Toubro
Accumulate
1,223
1,310
113,878
58,870
65,708
8.3
10.3
42.0
53.0
29.1
23.1
2.0
1.8
8.8
11.2
2.2
1.9
Gujarat Pipavav Port
Neutral
177
-
8,562
629
684
51.0
52.2
6.4
5.9
27.7
30.0
3.6
3.4
15.9
12.7
13.3
12.0
MBL Infrastructures
Buy
155
285
641
2,313
2,797
12.2
14.6
19.0
20.0
8.1
7.7
0.9
0.8
11.3
10.6
1.0
0.9
Nagarjuna Const.
Neutral
73
-
4,056
7,892
8,842
8.8
9.1
3.0
5.3
24.3
13.8
1.2
1.1
5.0
8.5
0.8
0.6
PNC Infratech
Accumulate
529
558
2,714
1,873
2,288
13.2
13.5
24.0
32.0
22.0
16.5
2.1
1.9
12.1
12.3
1.6
1.3
Simplex Infra
Neutral
248
-
1,227
5,955
6,829
10.3
10.5
16.0
31.0
15.5
8.0
0.8
0.8
5.3
9.9
0.7
0.6
Stock Watch
April 13, 2016
Company Name
Reco
CMP
Target
Mkt Cap
Sales ( Čcr )
OPM(%)
EPS (Č)
PER(x)
P/BV(x)
RoE(%)
EV/Sales(x)
(Č)
Price ( Č)
( Č cr )
FY16E
FY17E
FY16E
FY17E
FY16E
FY17E
FY16E
FY17E
FY16E
FY17E
FY16E
FY17E
FY16E
FY17E
Construction
Power Mech Projects
Neutral
590
-
868
1,539
1,801
12.8
12.7
59.0
72.1
10.0
8.2
1.5
1.3
18.6
16.8
0.6
0.5
Sadbhav Engineering
Neutral
276
-
4,736
3,481
4,219
10.7
10.8
8.2
11.7
33.7
23.6
3.2
2.8
10.3
13.5
1.6
1.4
NBCC
Accumulate
986
1,089
11,829
5,816
7,382
6.9
7.7
29.6
39.8
33.3
24.8
6.0
4.7
24.1
26.7
1.8
1.4
MEP Infra
Neutral
42
-
681
1,956
1,876
28.1
30.5
1.3
3.0
32.2
14.0
6.8
4.6
21.2
32.8
1.8
1.7
SIPL
Neutral
102
-
3,600
675
1,042
62.4
64.7
-
-
3.8
4.4
-
-
17.0
11.5
Engineers India
Neutral
170
-
5,716
1,667
1,725
13.5
16.0
9.7
11.4
17.5
14.9
2.1
2.0
11.7
13.4
2.2
2.2
Financials
Allahabad Bank
Neutral
56
-
3,410
8,569
9,392
2.8
2.9
16.3
27.5
3.4
2.0
0.3
0.3
7.6
11.9
-
-
Axis Bank
Accumulate
433
494
103,284
26,473
31,527
3.5
3.6
35.7
43.5
12.1
10.0
2.0
1.8
17.9
18.9
-
-
Bank of Baroda
Neutral
149
-
34,355
18,485
21,025
1.9
2.0
13.5
21.1
11.1
7.1
0.9
0.8
7.3
10.6
-
-
Bank of India
Neutral
94
-
7,663
15,972
17,271
1.9
2.0
15.3
33.4
6.1
2.8
0.3
0.2
3.6
7.6
-
-
Canara Bank
Neutral
190
-
10,325
15,441
16,945
2.0
2.1
46.6
70.4
4.1
2.7
0.4
0.3
8.0
11.2
-
-
Dena Bank
Neutral
29
-
1,894
3,440
3,840
2.1
2.3
7.3
10.0
4.1
2.9
0.3
0.3
6.1
7.9
-
-
Dewan Housing Finance Buy
192
270
5,613
1,892
2,277
2.9
2.9
25.9
30.8
7.4
6.3
1.1
1.0
15.3
15.9
-
-
Federal Bank
Neutral
44
-
7,576
3,477
3,999
3.0
3.0
5.0
6.2
8.8
7.1
0.9
0.8
10.6
11.9
-
-
HDFC
Neutral
1,090
-
172,139
10,358
11,852
3.3
3.3
41.1
47.0
26.5
23.2
5.1
4.6
24.7
24.9
-
-
HDFC Bank
Buy
1,064
1,262
268,999
38,309
47,302
4.3
4.3
49.3
61.1
21.6
17.4
3.7
3.2
18.5
19.7
-
-
ICICI Bank
Accumulate
229
254
132,955
34,279
39,262
3.3
3.3
21.0
24.4
10.9
9.4
1.8
1.6
14.4
14.7
-
-
IDBI Bank
Neutral
70
-
14,309
9,625
10,455
1.8
1.8
8.5
14.2
8.2
4.9
0.5
0.5
5.9
9.3
-
-
Indian Bank
Neutral
99
-
4,762
6,160
6,858
2.5
2.5
24.5
29.8
4.1
3.3
0.3
0.3
7.7
8.6
-
-
LIC Housing Finance
Buy
479
592
24,151
3,101
3,745
2.5
2.5
33.0
40.2
14.5
11.9
2.7
2.3
19.7
20.5
-
-
Oriental Bank
Neutral
90
-
2,685
7,643
8,373
2.4
2.4
37.2
45.4
2.4
2.0
0.2
0.2
8.2
9.4
-
-
Punjab Natl.Bank
Neutral
83
-
16,386
23,638
26,557
2.8
2.8
17.9
27.2
4.7
3.1
0.5
0.4
8.5
12.0
-
-
South Ind.Bank
Neutral
18
-
2,383
1,965
2,185
2.5
2.5
2.5
3.3
7.1
5.3
0.7
0.6
9.5
11.7
-
-
St Bk of India
Neutral
188
-
145,707
79,958
86,061
2.6
2.6
13.4
20.7
14.0
9.1
1.1
1.1
11.5
12.8
-
-
Union Bank
Neutral
129
-
8,854
12,646
14,129
2.3
2.4
31.0
39.1
4.2
3.3
0.4
0.4
9.8
11.4
-
-
Vijaya Bank
Neutral
31
-
2,886
3,536
3,827
1.9
1.9
5.5
6.7
5.6
4.7
0.5
0.4
7.8
8.8
-
-
Yes Bank
Neutral
859
-
36,143
7,190
9,011
3.2
3.3
58.2
69.7
14.8
12.3
2.6
2.2
19.2
19.6
-
-
FMCG
Asian Paints
Neutral
865
-
83,009
16,553
19,160
16.0
16.2
17.7
21.5
49.0
40.3
13.0
11.7
29.4
31.2
4.9
4.2
Britannia
Neutral
2,706
-
32,459
8,481
9,795
14.0
14.1
65.5
78.3
41.3
34.6
19.6
16.0
38.3
41.2
3.7
3.2
Stock Watch
April 13, 2016
Company Name
Reco
CMP
Target
Mkt Cap
Sales ( Čcr )
OPM(%)
EPS (Č)
PER(x)
P/BV(x)
RoE(%)
EV/Sales(x)
(Č)
Price ( Č)
( Č cr )
FY16E FY17E
FY16E
FY17E
FY16E
FY17E
FY16E
FY17E
FY16E
FY17E
FY16E
FY17E
FY16E
FY17E
FMCG
Colgate
Neutral
821
-
22,335
4,836
5,490
19.5
19.7
48.5
53.2
16.9
15.4
12.4
10.8
99.8
97.5
4.5
4.0
Dabur India
Neutral
262
-
46,054
9,370
10,265
17.1
17.2
7.3
8.1
35.7
32.3
10.8
8.8
33.7
30.6
4.8
4.4
GlaxoSmith Con*
Neutral
6,065
-
25,505
4,919
5,742
17.2
17.4
168.3
191.2
36.0
31.7
10.2
8.7
28.8
28.9
4.7
4.0
Godrej Consumer
Neutral
1,345
-
45,793
10,168
12,886
16.1
16.1
32.1
38.4
41.9
35.0
8.5
7.9
19.7
21.0
4.6
3.6
HUL
Neutral
871
-
188,414
34,940
38,957
17.5
17.7
20.8
24.7
41.9
35.3
46.6
37.2
110.5
114.2
5.2
4.6
ITC
Accumulate
323
359
259,643
36,804
38,776
37.9
37.9
12.2
12.9
26.5
25.0
7.3
6.5
27.7
25.8
6.6
6.3
Marico
Neutral
258
-
33,248
6,551
7,766
15.7
16.0
10.4
12.5
24.8
20.6
7.2
6.0
33.2
32.4
5.0
4.2
Nestle*
Accumulate
6,136
6,646
59,159
11,291
12,847
22.2
22.3
158.9
184.6
38.6
33.2
20.2
18.2
55.0
57.3
5.1
4.4
Tata Global
Buy
118
144
7,469
8,635
9,072
9.8
9.9
6.5
7.6
18.2
15.6
1.8
1.7
6.8
7.4
0.8
0.8
IT
HCL Tech^
Buy
839
1,038
118,310
42,038
47,503
21.2
21.5
51.5
57.7
16.3
14.5
3.5
2.7
21.5
18.8
2.4
2.0
Infosys
Accumulate
1,182
1,347
272,455
61,850
69,981
27.5
27.5
59.4
65.7
19.9
18.0
4.2
3.6
21.2
20.1
3.7
3.1
TCS
Accumulate
2,513
2,854
495,070
108,487
122,590
28.3
28.5
122.8
138.4
20.5
18.2
7.8
7.1
38.0
38.9
4.2
3.6
Tech Mahindra
Accumulate
464
530
44,931
26,524
29,177
16.2
17.0
28.8
33.6
16.1
13.8
3.1
2.6
19.3
19.1
1.5
1.3
Wipro
Buy
568
680
140,386
50,808
56,189
23.7
23.8
37.3
40.7
15.2
14.0
2.9
2.7
19.2
17.7
2.2
1.9
Media
D B Corp
Accumulate
311
356
5,706
2,241
2,495
27.8
27.9
21.8
25.6
14.3
12.1
3.7
3.3
26.7
28.5
2.5
2.2
HT Media
Neutral
83
-
1,921
2,495
2,603
11.2
11.2
7.3
8.6
11.3
9.6
0.9
0.8
7.4
8.1
0.3
0.3
Jagran Prakashan
Buy
158
189
5,155
2,170
2,355
27.2
26.2
8.9
9.9
17.7
15.9
3.7
3.3
20.9
20.5
2.3
2.1
Sun TV Network
Neutral
360
-
14,177
2,779
3,196
70.2
70.5
22.8
27.3
15.8
13.2
3.9
3.5
26.7
28.3
4.9
4.2
Hindustan Media
Neutral
250
-
1,834
920
1,031
20.0
20.0
19.2
20.9
13.0
12.0
2.1
1.8
16.4
15.3
1.5
1.3
Ventures
Metals & Mining
Coal India
Buy
274
380
173,353
76,167
84,130
19.9
22.3
22.4
25.8
12.2
10.6
4.4
4.3
35.5
41.0
1.6
1.4
Hind. Zinc
Accumulate
160
175
67,478
14,641
14,026
50.4
50.4
17.7
16.0
9.1
10.0
1.4
1.3
16.2
13.2
2.2
2.1
Hindalco
Neutral
92
-
18,977
104,356
111,186
8.7
9.5
6.7
11.1
13.7
8.3
0.5
0.5
3.5
5.9
0.7
0.6
JSW Steel
Neutral
1,298
-
31,385
42,308
45,147
16.4
20.7
(10.3)
49.5
26.2
1.5
1.4
(1.0)
5.6
1.8
1.7
NMDC
Neutral
101
-
39,925
8,237
10,893
46.6
44.5
10.0
11.7
10.1
8.6
1.1
1.0
12.5
13.0
4.6
3.5
SAIL
Neutral
43
-
17,883
45,915
53,954
7.2
10.5
1.5
4.4
28.8
9.9
0.4
0.4
2.3
4.1
1.0
0.9
Vedanta
Neutral
91
-
26,860
71,445
81,910
26.2
26.3
12.9
19.2
7.0
4.7
0.5
0.4
7.2
8.9
0.8
0.6
Tata Steel
Neutral
324
-
31,482
126,760
137,307
8.9
11.3
6.4
23.1
51.0
14.1
1.0
1.0
2.0
7.1
0.8
0.8
Oil & Gas
Cairn India
Neutral
153
-
28,695
11,323
12,490
49.4
51.0
20.7
20.7
7.4
7.4
0.5
0.5
6.4
6.1
1.6
0.9
GAIL
Neutral
367
-
46,496
64,856
70,933
9.1
9.6
24.0
28.9
15.3
12.7
1.3
1.2
8.8
9.6
0.9
0.8
Stock Watch
April 13, 2016
Company Name
Reco
CMP
Target
Mkt Cap
Sales ( Čcr )
OPM(%)
EPS (Č)
PER(x)
P/BV(x)
RoE(%)
EV/Sales(x)
(Č)
Price ( Č)
( Č cr )
FY16E FY17E
FY16E
FY17E
FY16E
FY17E
FY16E
FY17E
FY16E
FY17E
FY16E
FY17E
FY16E
FY17E
Oil & Gas
ONGC
Neutral
210
-
179,922
154,564
167,321
36.8
37.4
28.6
32.5
7.4
6.5
0.9
0.9
12.7
13.5
1.4
1.3
Petronet LNG
Neutral
258
-
19,384
29,691
31,188
5.8
6.2
12.8
13.4
20.2
19.3
3.0
2.7
15.8
14.8
0.7
0.7
Indian Oil Corp
Accumulate
415
455
100,748
359,607
402,760
5.9
6.1
42.5
48.7
9.8
8.5
1.3
1.2
14.1
14.4
0.4
0.3
Reliance Industries
Accumulate
1,047
1,150
339,316
304,775
344,392
12.6
13.4
91.3
102.6
11.5
10.2
1.3
1.2
11.8
12.0
1.0
0.9
Pharmaceuticals
Alembic Pharma
Neutral
546
-
10,291
3,274
3,802
26.9
19.4
35.0
28.7
15.6
19.0
6.9
5.2
55.6
31.2
3.1
2.6
Aurobindo Pharma
Accumulate
784
856
45,880
14,923
17,162
22.0
23.0
35.7
42.8
22.0
18.3
6.5
4.9
34.0
30.2
3.4
2.9
Aventis*
Neutral
4,380
-
10,086
2,082
2,371
17.4
20.8
118.2
151.5
37.1
28.9
5.4
4.4
19.9
25.5
4.5
3.8
Cadila Healthcare
Accumulate
318
352
32,509
10,224
11,840
21.0
22.0
14.6
17.6
21.8
18.0
6.0
4.7
30.8
29.0
3.2
2.7
Cipla
Buy
503
605
40,410
13,979
16,447
20.2
18.6
25.7
27.5
19.6
18.3
3.2
2.8
17.6
16.1
2.9
2.4
Dr Reddy's
Buy
3,083
3,933
52,573
16,838
19,575
25.0
23.1
167.5
178.8
18.4
17.2
3.9
3.2
23.1
20.4
3.1
2.6
Dishman Pharma
Neutral
349
-
2,816
1,733
1,906
21.5
21.5
17.0
19.9
20.5
17.5
2.1
1.9
10.5
11.2
2.1
1.8
GSK Pharma*
Neutral
3,676
-
31,133
2,870
3,158
20.0
22.1
59.5
68.3
61.8
53.8
18.2
18.7
28.5
34.3
10.3
9.5
Indoco Remedies
Neutral
273
-
2,514
1,033
1,199
15.9
18.2
9.4
13.6
29.0
20.1
4.3
3.7
15.7
19.7
2.5
2.2
Ipca labs
Buy
484
900
6,101
3,363
3,909
12.9
18.6
13.4
28.0
36.1
17.3
2.6
2.3
7.4
14.0
2.1
1.8
Lupin
Neutral
1,536
-
69,196
13,092
16,561
25.0
27.0
50.4
68.3
30.5
22.5
6.3
5.0
22.8
24.7
5.0
3.8
Sun Pharma
Buy
824
950
198,213
28,163
32,610
25.8
30.7
17.4
26.9
47.3
30.6
4.5
3.9
13.0
16.6
6.5
5.4
Power
Tata Power
Neutral
68
-
18,351
35,923
37,402
22.6
22.8
4.1
5.2
16.7
13.2
1.3
1.2
7.5
9.3
1.5
1.3
NTPC
Accumulate
136
146
111,932
87,271
99,297
23.5
23.5
11.8
13.3
11.6
10.2
1.3
1.2
11.5
12.2
2.3
2.1
Power Grid
Buy
143
170
74,812
20,702
23,361
86.7
86.4
12.1
13.2
11.8
10.8
1.7
1.6
15.6
15.1
8.5
7.9
Real Estate
MLIFE
Buy
436
554
1,790
697
1,011
14.9
19.3
13.8
20.1
31.6
21.7
1.2
1.1
3.8
5.3
3.9
2.6
Telecom
Bharti Airtel
Neutral
350
-
139,729
101,748
109,191
32.1
31.7
12.0
12.5
29.1
28.0
2.0
1.9
6.9
6.7
2.0
1.8
Idea Cellular
Neutral
113
-
40,848
34,282
36,941
32.0
31.5
5.9
6.2
19.2
18.3
1.8
1.6
9.9
9.3
1.8
1.7
zOthers
Abbott India
Neutral
4,786
-
10,170
2,715
3,153
14.5
14.1
134.3
152.2
35.7
31.4
8.9
7.3
27.4
25.6
3.5
2.9
Bajaj Electricals
Accumulate
217
237
2,190
4,719
5,287
5.2
5.8
8.6
12.7
25.4
17.1
2.9
2.5
11.4
14.8
0.5
0.4
Finolex Cables
Neutral
281
-
4,295
2,520
2,883
12.2
12.0
12.7
14.2
22.2
19.8
3.0
2.7
13.6
13.5
1.5
1.2
Goodyear India*
Accumulate
510
582
1,176
1,800
1,600
11.7
11.5
58.7
52.9
8.7
9.6
2.0
1.7
24.6
18.7
0.4
0.4
Hitachi
Neutral
1,195
-
3,249
1,779
2,081
7.8
8.8
21.8
33.4
54.8
35.7
8.9
7.2
17.4
22.1
1.9
1.6
Jyothy Laboratories
Neutral
304
-
5,505
1,620
1,847
11.5
11.5
7.3
8.5
41.7
35.9
5.4
5.0
13.3
14.4
3.3
2.8
MRF
Buy
36,329
45,575
15,408
20,316
14,488
21.4
21.1
5,488.0
3,798.0
6.6
9.6
2.3
1.8
41.1
21.2
0.7
0.9
Stock Watch
April 13, 2016
Company Name
Reco
CMP
Target
Mkt Cap
Sales ( Čcr )
OPM(%)
EPS (Č)
PER(x)
P/BV(x)
RoE(%)
EV/Sales(x)
(Č)
Price ( Č)
( Č cr )
FY16E
FY17E
FY16E
FY17E
FY16E
FY17E
FY16E
FY17E
FY16E
FY17E
FY16E
FY17E
FY16E
FY17E
zOthers
Page Industries
Neutral
12,852
-
14,335
1,929
2,450
19.8
20.1
229.9
299.0
55.9
43.0
24.7
17.1
52.1
47.1
7.5
5.9
Relaxo Footwears
Neutral
488
-
5,854
1,767
2,152
12.3
12.5
19.3
25.1
25.3
19.5
6.2
4.8
27.7
27.8
3.4
2.7
Siyaram Silk Mills
Buy
1,010
1,354
947
1,636
1,815
11.5
11.5
89.9
104.1
11.2
9.7
1.9
1.6
17.9
17.8
0.7
0.7
Styrolution ABS India* Neutral
599
-
1,053
1,271
1,440
8.6
9.2
32.0
41.1
18.7
14.6
1.9
1.7
10.7
12.4
0.8
0.7
TVS Srichakra
Buy
2,496
3,217
1,911
2,035
2,252
15.9
15.3
248.6
268.1
10.0
9.3
4.4
3.2
43.6
33.9
1.0
0.8
HSIL
Neutral
302
-
2,184
2,123
2,384
16.1
16.5
15.0
18.9
20.1
16.0
1.6
1.5
8.0
9.4
1.4
1.2
Kirloskar Engines India
Neutral
233
-
3,372
2,403
2,554
8.6
9.9
9.2
10.5
25.4
22.2
2.4
2.3
9.7
10.7
1.0
1.0
Ltd
M M Forgings
Buy
455
614
549
511
615
21.7
21.6
43.1
55.8
10.6
8.2
1.9
1.6
19.9
21.2
1.3
1.0
Banco Products (India) Neutral
122
-
873
1,208
1,353
11.0
12.3
10.8
14.5
11.3
8.4
1.3
1.2
11.9
14.5
0.7
0.6
Competent Automobiles Neutral
150
-
92
1,040
1,137
3.2
3.1
25.7
28.0
5.8
5.3
0.9
0.8
15.0
14.3
0.1
0.1
Nilkamal
Neutral
1,334
-
1,990
1,871
2,031
10.7
10.5
63.2
69.8
21.1
19.1
3.4
3.0
17.6
16.6
1.1
1.0
Visaka Industries
Buy
122
144
194
1,086
1,197
9.9
10.3
21.5
28.8
5.7
4.2
0.5
0.5
9.6
11.6
0.4
0.3
Transport Corporation of
Neutral
272
-
2,069
2,830
3,350
8.8
9.0
14.4
18.3
18.9
14.9
2.9
2.5
15.4
17.1
0.9
0.7
India
Elecon Engineering
Neutral
63
-
686
1,359
1,482
10.3
13.7
0.8
3.9
78.4
16.2
1.3
1.2
1.6
7.8
0.9
0.8
Surya Roshni
Buy
153
201
670
2,992
3,223
8.1
8.4
14.7
18.3
10.4
8.3
1.0
0.9
9.7
11.0
0.5
0.5
MT Educare
Neutral
175
-
698
286
366
18.3
17.7
7.7
9.4
22.7
18.7
4.8
4.2
20.2
21.1
2.3
1.8
Radico Khaitan
Buy
87
156
1,163
1,517
1,635
12.7
13.4
5.8
7.1
15.0
12.3
1.3
1.2
8.6
9.6
1.2
1.1
Garware Wall Ropes
Buy
340
473
744
862
974
11.2
11.2
24.9
29.6
13.7
11.5
2.1
1.8
15.1
15.4
0.9
0.7
Wonderla Holidays
Neutral
380
-
2,144
206
308
44.0
43.6
9.0
12.9
42.2
29.4
5.8
5.2
13.7
17.8
10.3
6.9
Linc Pen & Plastics
Neutral
188
-
278
340
371
8.3
8.9
10.8
13.2
17.4
14.2
2.8
2.4
16.0
17.1
0.9
0.8
The Byke Hospitality
Neutral
155
-
622
222
287
20.5
20.5
5.6
7.6
27.5
20.5
5.2
4.3
18.9
20.8
2.8
2.2
Interglobe Aviation
Neutral
1,004
-
36,182
17,022
21,122
20.7
14.5
63.9
53.7
15.7
18.7
23.6
19.3
149.9
103.2
2.2
1.7
Coffee Day Enterprises
Neutral
231
-
4,762
2,692
2,964
17.0
18.6
-
4.7
-
48.8
2.8
2.7
0.2
5.5
2.2
2.0
Ltd
Navneet Education
Neutral
82
-
1,964
998
1,062
24.1
24.0
5.8
6.1
14.3
13.5
3.2
2.8
22.0
20.6
2.1
1.9
Navkar Corporation
Buy
182
265
2,592
365
436
38.3
37.5
5.6
5.9
32.2
30.9
2.0
1.9
6.3
6.1
7.9
6.8
UFO Moviez
Neutral
515
-
1,416
558
619
32.0
33.2
22.5
30.0
22.9
17.2
2.8
2.4
12.0
13.8
2.4
2.0
VRL Logistics
Neutral
381
-
3,473
1,725
1,902
16.5
16.7
12.2
14.6
31.3
26.1
6.5
5.7
20.8
21.9
2.2
1.9
Team Lease Serv.
Neutral
870
-
1,487
2,565
3,229
1.3
1.5
15.2
22.8
57.3
38.2
4.6
4.1
8.0
10.7
0.5
0.4
S H Kelkar & Co.
Neutral
238
-
3,443
928
1,036
15.3
15.1
4.9
6.1
48.2
39.0
4.5
4.2
9.4
10.7
3.6
3.2
Stock Watch
April 13, 2016
Company Name
Reco
CMP
Target Mkt Cap
Sales ( Čcr )
OPM(%)
EPS (Č)
PER(x)
P/BV(x)
RoE(%)
EV/Sales(x)
(Č)
Price ( Č)
( Č cr )
FY16E FY17E FY16E FY17E FY16E FY17E FY16E FY17E FY16E FY17E FY16E FY17E FY16E FY17E
zOthers
Quick Heal
Neutral
223
-
1,562
339
408
27.8
27.3
7.1
7.7
31.5
28.8
2.7
2.7
8.5
9.3
3.5
3.0
Narayana Hrudaya
Neutral
300
-
6,122
1,603
1,873
10.9
11.5
1.0
2.6
314.4
113.3
7.6
7.0
2.4
6.1
4.0
3.4
Manpasand Bever.
Neutral
493
-
2,468
540
836
19.9
19.6
10.2
16.9
48.2
29.2
3.9
3.5
8.1
12.0
4.3
2.7
Source: Company, Angel Research; Note: *December year end; #September year end; &October year end; Price as on April 12, 2016
Market Outlook
April 13, 2016
Research Team Tel: 022 - 39357800
DISCLAIMER
Angel Broking Private Limited (hereinafter referred to as “Angel”) is a registered Member of National Stock Exchange of India Limited,
Bombay Stock Exchange Limited and Metropolitian Stock Exchange of India Limited. It is also registered as a Depository Participant with
CDSL and Portfolio Manager with SEBI. It also has registration with AMFI as a Mutual Fund Distributor. Angel Broking Private Limited is a
registered entity with SEBI for Research Analyst in terms of SEBI (Research Analyst) Regulations, 2014 vide registration number
INH000000164. Angel or its associates has not been debarred/ suspended by SEBI or any other regulatory authority for accessing
/dealing in securities Market. Angel or its associates including its relatives/analyst do not hold any financial interest/beneficial ownership
of more than 1% in the company covered by Analyst. Angel or its associates/analyst has not received any compensation / managed or co
-managed public offering of securities of the company covered by Analyst during the past twelve months. Angel/analyst has not served as
an officer, director or employee of company covered by Analyst and has not been engaged in market making activity of the company
covered by Analyst.
This document is solely for the personal information of the recipient, and must not be singularly used as the basis of any investment
decision. Nothing in this document should be construed as investment or financial advice. Each recipient of this document should make
such investigations as they deem necessary to arrive at an independent evaluation of an investment in the securities of the companies
referred to in this document (including the merits and risks involved), and should consult their own advisors to determine the merits and
risks of such an investment.
Reports based on technical and derivative analysis center on studying charts of a stock's price movement, outstanding positions and
trading volume, as opposed to focusing on a company's fundamentals and, as such, may not match with a report on a company's
fundamentals.
The information in this document has been printed on the basis of publicly available information, internal data and other reliable sources
believed to be true, but we do not represent that it is accurate or complete and it should not be relied on as such, as this document is for
general guidance only. Angel Broking Pvt. Limited or any of its affiliates/ group companies shall not be in any way responsible for any
loss or damage that may arise to any person from any inadvertent error in the information contained in this report. Angel Broking Pvt.
Limited has not independently verified all the information contained within this document. Accordingly, we cannot testify, nor make any
representation or warranty, express or implied, to the accuracy, contents or data contained within this document. While Angel Broking
Pvt. Limited endeavors to update on a reasonable basis the information discussed in this material, there may be regulatory, compliance,
or other reasons that prevent us from doing so.
This document is being supplied to you solely for your information, and its contents, information or data may not be reproduced,
redistributed or passed on, directly or indirectly.
Neither Angel Broking Pvt. Limited, nor its directors, employees or affiliates shall be liable for any loss or damage that may arise from or
in connection with the use of this information.
Note: Please refer to the important ‘Stock Holding Disclosure' report on the Angel website (Research Section). Also, please refer to the
latest update on respective stocks for the disclosure status in respect of those stocks. Angel Broking Pvt. Limited and its affiliates may have
investment positions in the stocks recommended in this report.