Market Outlook
February 12, 2016
Market Cues
Domestic Indices
Chg (%)
(Pts)
(Close)
Indian markets are expected to open on a Flat to Positive note tracking the SGX
BSE Sensex
(3.4)
(807)
22,952
Nifty.
Nifty
(3.3)
(239)
6,976
After opening sharply lower on Thursday, US markets recovered but managed to
Mid Cap
(3.3)
(327)
9,691
close in the red. The markets were weighed down by the concerns over state of
Small Cap
(4.6)
(476)
9,801
global economy.
Bankex
(3.8)
(629)
15,890
European shares declined to touch its 2-1/2 year low on Thursday as continued
weakness in crude and sharp decline in Asian stocks weighed on the markets.
Global Indices
Chg (%)
(Pts)
(Close)
Concerns about slowing global growth also added to the negative sentiment.
Dow Jones
(4.4)
(684)
15,029
Much like European and Asian markets, Indian markets slid sharply yesterday on
Nasdaq
(0.6)
(109)
18,437
plunging oil prices, on going global concerns over state of global banks, and steady
FTSE
(0.6)
(18)
2,763
FII outflows.
Nikkei
(2.3)
(372)
15,713
News & Result Analysis
Hang Seng
(3.9)
(742)
18,546
Wipro buys US-based HealthPlan Services for $460 million
Shanghai Com
(0.6)
(18)
2,763
Result Review: Tata Motors, Voltas
Result Preview: Sun Pharma
Detailed analysis on Pg2
Advances / Declines
BSE
NSE
Advances
300
121
Investor’s Ready Reckoner
Declines
2,405
1,478
Key Domestic & Global Indicators
Unchanged
87
29
Stock Watch: Latest investment recommendations on 150+ stocks
Refer P6 onwards
Volumes (` Cr)
Top Picks
BSE
2,972
CMP
Target
Upside
Company
Sector
Rating
NSE
18,956
(`)
(`)
(%)
Amara Raja Batteries Auto & Auto Ancillary
Buy
861
1,040
20.8
HCL Tech
IT
Buy
809
1,038
28.3
Net Inflows (` Cr)
Net
Mtd
Ytd
Larsen & Toubro
Construction
Buy
1,092
1,310
20.0
FII
(505)
(1,804)
(10,450)
LIC Housing Finance Financials
Buy
406
592
45.6
MFs
10
(94)
76,670
Navkar Corporation Others
Buy
174
265
52.6
More Top Picks on Pg5
Top Gainers
Price (`)
Chg (%)
Abb
1,079
1.8
Key Upcoming Events
Previous
Consensus
Natcopharm
446
1.4
Date
Region
Event Description
Reading
Expectations
Mphasis
431
0.9
Feb 12 India
Exports YoY% (% Change)
(14.70)
--
Idea
101
0.8
Feb 12 India
Imports YoY% (% Change)
(3.90)
--
Prestige
161
0.6
Feb 12 India
Industrial Production YoY (% Change)
(3.20)
--
Feb 12 Euro Zone
GDP s.a. (QoQ)
0.30
0.30
6.(
Top Losers
Price (`)
Chg (%)
Unitech
4
(16.4)
Pipavavdoc
56
(14.2)
Jubilant
295
(13.8)
Sci
64
(13.2)
Gmrinfra
11
(12.4)
As on February 11, 2016
Market Outlook
February 12, 2016
Wipro buys US-based HealthPlan Services for $460 million
Wipro signed a definitive agreement to acquire HealthPlan Services from Water
Street Capital Partners for a consideration of USD$460mn making it one of
Wipros’s largest acquisition in the past decade. HealthPlan is leading independent
technology and Business Process as a Service provider in the US Health Insurance
market. HealthPlan Services will strengthen Wipro’s position in the health
insurance exchange market while offering synergies with Wipro’s presence in the
Managed Medicare and Commercial Group Insurance market. We currently have
a Positive view on the stock.
Result Review
Tata Motors - 3QFY2016 (CMP: `276/ TP: - `409/ Upside: - 48%)
Tata Motors 3QFY2016 results were in line with estimates on the operating front.
However lower taxation led to the net profit coming ahead of estimates.
Consolidated revenues grew marginally 3% yoy to `72,256cr (slightly lower than
our estimate of `73,068cr). JLR revenues (forming 80% of the topline) declined
marginally by 2% while the standalone revenues grew 10% yoy. Operating
margins at 13% were broadly in line with our estimates of 12.8%. JLR EBIDTA
margins at 14.4% improved 220bp sequentially (were in line with estimates) on
account of operating leverage due to higher volumes and favorable currency
movement. Standalone operating margins at 4.6% (as against operating loss in
3QFY2015) were ahead of our estimates of 2.3%. Soft raw material prices,
favourable product mix and cost control initiatives helped in margin improvement.
EBIDTA at `9,380cr was in line with our estimates of `9,324 cr. However lower tax
provison (Tax/PBT of 16%) resulted in Tata Motors reporting Adjusted Net Profit of
`3,462 cr which is ahead of our estimates of `2,914 cr. We will review our
estimates post management interaction.
Y/E
Sales OPM
PAT
EPS ROE P/E P/BV EV/EBITDA EV/Sales
Mar
(` cr)
(%)
(` cr)
(`)
(%)
(x)
(x)
(x)
(x)
FY2016E
266,022
12.8
17,863
26.3
8.4
10.5
1.5
4.7
0.5
FY2017E
312,667
13.1
26,014
38.3 12.1
7.2
1.2
4.3
0.4
Voltas - 3QFY2016 (CMP: `241/ TP: - `353/ Upside: - 46.5%)
Voltas reported mix set of numbers, with better than expected top-line numbers
and disappointment at the PAT level. Voltas reported 38.6% YoY increase in its
top-line to INR 1,301cr, ahead of our estimate of `1,247cr. Top-line growth was
driven by EMP segment, which reported 56.5% YoY increase (55% of 3QFY2016
revenues). Further, on the back of strong festive season, the UCP segment reported
13.6% YoY increase in its revenues (33% of 3QFY2016 revenues).
Despite strong execution, Voltas disappointed us on the EBITDA front. Voltas
reported EBITDA margin of 4.0%, below our estimates and year ago levels of
4.8%. Losses at the EMP segment level led to disappointment at the consol. EBITDA
level. Impact of poor operating performance trickled down to the PAT level too.
Adj. PAT margins for the quarter declined from 6.7% a year ago to 4.0% in
3QFY2016.
Market Outlook
February 12, 2016
Order book for the EMP segment at 3QFY2016 stood at `3,514cr (OB to LTM
ratio of 1.4x). We continue to maintain our positive view towards the stock.
Result Preview
Sun (CMP: `831/ TP: `950 / Upside: 14.3%)
Sun pharmaceuticals, is expected to post sales of `7,000cr in 3QFY2016 (no
corresponding period data available). On the operating front, the Gross Profit
margin is expected to come in at 73.7%, enabling the OPM’s to come in at 25.6%.
The R&D expenditure during the period is expected to be around 7.0% of sales.
Thus, Adj. net profit is expected to come in at `1,145cr. Overall, we maintain our
accumulate rating on the stock with a price target of `950.
Y/E
Sales OPM
PAT
EPS ROE P/E P/BV EV/EBITDA EV/Sales
Mar
(` cr)
(%)
(` cr)
(`)
(%)
(x)
(x)
(x)
(x)
FY2016E
28,163
25.8
4,179
17.4
13.0
47.7
4.5
25.5
6.6
FY2017E
32,610
30.7
6,483
26.9 16.6 30.9
3.9
17.8
5.5
Economic and Political News
Odisha to commission 10-Mw solar power plant
RBI allows 3% more of SLR for LCR
Naidu to launch 'Smart City' project for Indore tomorrow
Corporate News
Domestic steel firms raise product prices up to 4% post MIP imposition
TBZ ties up with Amazon to sell diamond jewellery and gold coins
Lanco books profit second quarter in running
Quarterly Bloomberg Brokers Consensus Estimate
Mahindra & Mahindra Ltd - February 12, 2016
Particulars (` cr)
3QFY16E
3QFY15
y-o-y (%)
2QFY16
q-o-q (%)
Net sales
10,958
9,466
15.8
9,122
20.1
EBITDA
1,426
994
43.4
1,026
38.9
EBITDA margin (%)
13.0
10.5
11.3
Net profit
914
942
(3.0)
924
(1.0)
Nestle India Ltd - February 12, 2016
Particulars (` cr)
4QFY16E
4QFY15
y-o-y (%)
3QFY16
q-o-q (%)
Net sales
2,192
2,516
(12.9)
1,736
26.3
EBITDA
424
550
(22.9)
243
74.6
EBITDA margin (%)
19.3
21.9
14.0
Net profit
237
326
(27.4)
124
90.8
Canara Bank - February 12, 2016
Particulars (` cr)
3QFY16E
3QFY15
y-o-y (%)
2QFY16
q-o-q (%)
PAT
518
302
71.3
658
(21.3)
Market Outlook
February 12, 2016
NMDC Ltd - February 12, 2016
Particulars (` cr)
3QFY16E
3QFY15
y-o-y (%)
2QFY16
q-o-q (%)
Net sales
1,565
2,944
(46.8)
1,602
(2.3)
EBITDA
765
1,948
(60.7)
887
(13.8)
EBITDA margin (%)
48.9
66.2
55.4
Net profit
764
1,593
(52.0)
810
(5.7)
IDBI Bank Ltd - February 12, 2016
Particulars (` cr)
3QFY16E
3QFY15
y-o-y (%)
2QFY16
q-o-q (%)
PAT
140
302
(53.7)
658
(78.7)
Adani Ports and Special Economic Zone Lt - February 12, 2016
Particulars (` cr)
3QFY16E
3QFY15
y-o-y (%)
2QFY16
q-o-q (%)
Net sales
1,711
1,534
11.6
1,820
(6.0)
EBITDA
1,089
935
16.5
1,205
(9.6)
EBITDA margin (%)
63.6
61.0
66.2
Net profit
584
512
14.1
651
(10.3)
Market Outlook
February 12, 2016
Top Picks
Large Cap
M
arket Cap
CM
P
T
arget
Upsid
e
Company
Rationale
(` Cr)
(`)
(`)
(%)
To outpace battery industry growth due to better technological
Amara Raja Batteries
14,707
861
1,040
20.8
products leading to market share gains in both the automotive
OEM and replacement segments.
Earnings to grow strongly given the MHCV cyclical upturn.
Ashok Leyland
23,080
81
111
36.9
Focus on exports and LCV's provides additional growth
avenue.
The stock is trading at attractive valuations and is factoring all
HCL Tech
1,14,028
809
1,038
28.3
the bad news.
Strong visibility for a robust 20% earnings trajectory, coupled
HDFC Bank
2,46,559
976
1,262
29.3
with high quality of earnings on account of high quality retail
business and strategic focus on highly rated corporates.
Back on the growth trend, expect a long term growth of 14%
Infosys
2,48,334
1,081
1,347
24.6
to be a US$20bn in FY2020.
Well positioned to benefit from such expected gradual
recovery in the overall domestic capex cycle, given its presence
Larsen & Toubro
1,01,745
1,092
1,310
20.0
across various infrastructure segments, its execution
capabilities, and its strong balance sheet.
LICHF continues to grow its retail loan book at a healthy pace
with improvement in asset quality. We expect the company to
LIC Housing Finance
20,510
406
592
45.6
post a healthy loan book which is likely to reflect in a strong
earnings growth.
Source: Company, Angel Research
Mid Cap
M
arket Cap
CM
P
T
arget
Upsid
e
Company
Rationale
(` Cr)
(`)
(`)
(%)
Favourable outlook for the AC industry to augur well for
Cooling products business which is out pacing the market
Blue Star
2,957
329
439
33.5
growth. EMPPAC division's profitability to improve once
operating environment turns around.
Change in business focus towards high-margin chronic &
Garware Wall Ropes
677
310
473
52.8
lifestyle segments and increasing penetration in Europe and
US
Economic recovery to have favourable impact on advertising &
circulation revenue growth. Further, the acquisition of a radio
Jagran Prakashan
5,110
156
189
20.9
business (Radio City) would also boost the company's revenue
growth.
Massive capacity expansion along with rail advantage at ICD
Navkar Corporation
2,477
174
265
52.6
as well CFS augurs well for the company
Earnings boost on back of stable material prices and
Radico Khaitan
1,298
98
156
59.8
favourable pricing environment. Valuation discount to peers
provides additional comfort
Strong brands and distribution network would boost growth
Siyaram Silk Mills
934
997
1,354
35.9
going ahead. Stock currently trades at an inexpensive
valuation.
Structural shift in the Lighting industry towards LED lighting will
Surya Roshni
570
130
201
54.4
drive growth.
Source: Company, Angel Research
Market Outlook
February 12, 2016
Key Upcoming Events
Result Calendar
Date
Company
M&M, FAG Bearings, CEAT, Canara Bank, IDBI Bank, Andhra Bank, Corporation Bank, Nestle, Sun TV
February 12, 2016
Network, NMDC, Bhushan Steel, Monnet Ispat, IOC, BPCL, HPCL, Cravatex, Sun Pharma, Adani Power,
Anant Raj
February 13, 2016
Jyoti Structures, Bank of Baroda, Jindal Steel, MM Forging, HDIL, Competent Automobiles
Source: Bloomberg, Angel Research
Global economic events release calendar
Bloomberg Data
Date
Time
Country Event Description
Unit
Period
Last Reported
Estimated
Feb 12, 2016
India
Imports YoY%
% Change Jan
(3.90)
India
Exports YoY%
% Change Jan
(14.70)
5:30 PM
India
Industrial Production YoY
% Change Dec
(3.20)
-
3:30 PM Euro Zone
Euro-Zone GDP s.a. (QoQ)
% Change
4Q A
0.30
0.30
12:30 PM Germany
GDP nsa (YoY)
% Change
4Q P
1.80
1.70
Feb 15, 2016
12:00 PM
India Monthly Wholesale Prices YoY%
% Change Jan
(0.73)
(0.11)
China
Exports YoY%
% Change Jan
(1.40)
(2.00)
Feb 16, 2016
3:00 PM
UK
CPI (YoY)
% Change Jan
0.20
Feb 17, 2016
7:00 PM
US
Housing Starts
Thousands Jan
1,149.00
1,175.00
7:00 PM
US
Building permits
Thousands Jan
1,204.00
1,200.00
3:00 PM
UK
Jobless claims change
% Change Jan
(4.30)
7:45 PM
US
Industrial Production
% Jan
(0.36)
0.30
US
Producer Price Index (mom)
% Change Jan
(0.70)
Feb 18, 2016
7:00 AM
China
Consumer Price Index (YoY)
% Change Jan
1.60
1.90
Feb 19, 2016
7:00 PM
US Consumer price index (mom)
% Change Jan
(0.10)
(0.10)
8:30 PM Euro Zone Euro-Zone Consumer Confidence
Value
Feb A
(6.30)
Feb 22, 2016
2:00 PM Germany
PMI Services
Value
Feb P
55.00
2:00 PM Germany
PMI Manufacturing
Value
Feb P
52.30
Feb 23, 2016
8:30 PM
US
Existing home sales
Million
Jan
5.46
8:30 PM
US
Consumer ConfidenceS.A./ 1985=100 Feb
98.10
Source: Bloomberg, Angel Research
Market Outlook
February 12, 2016
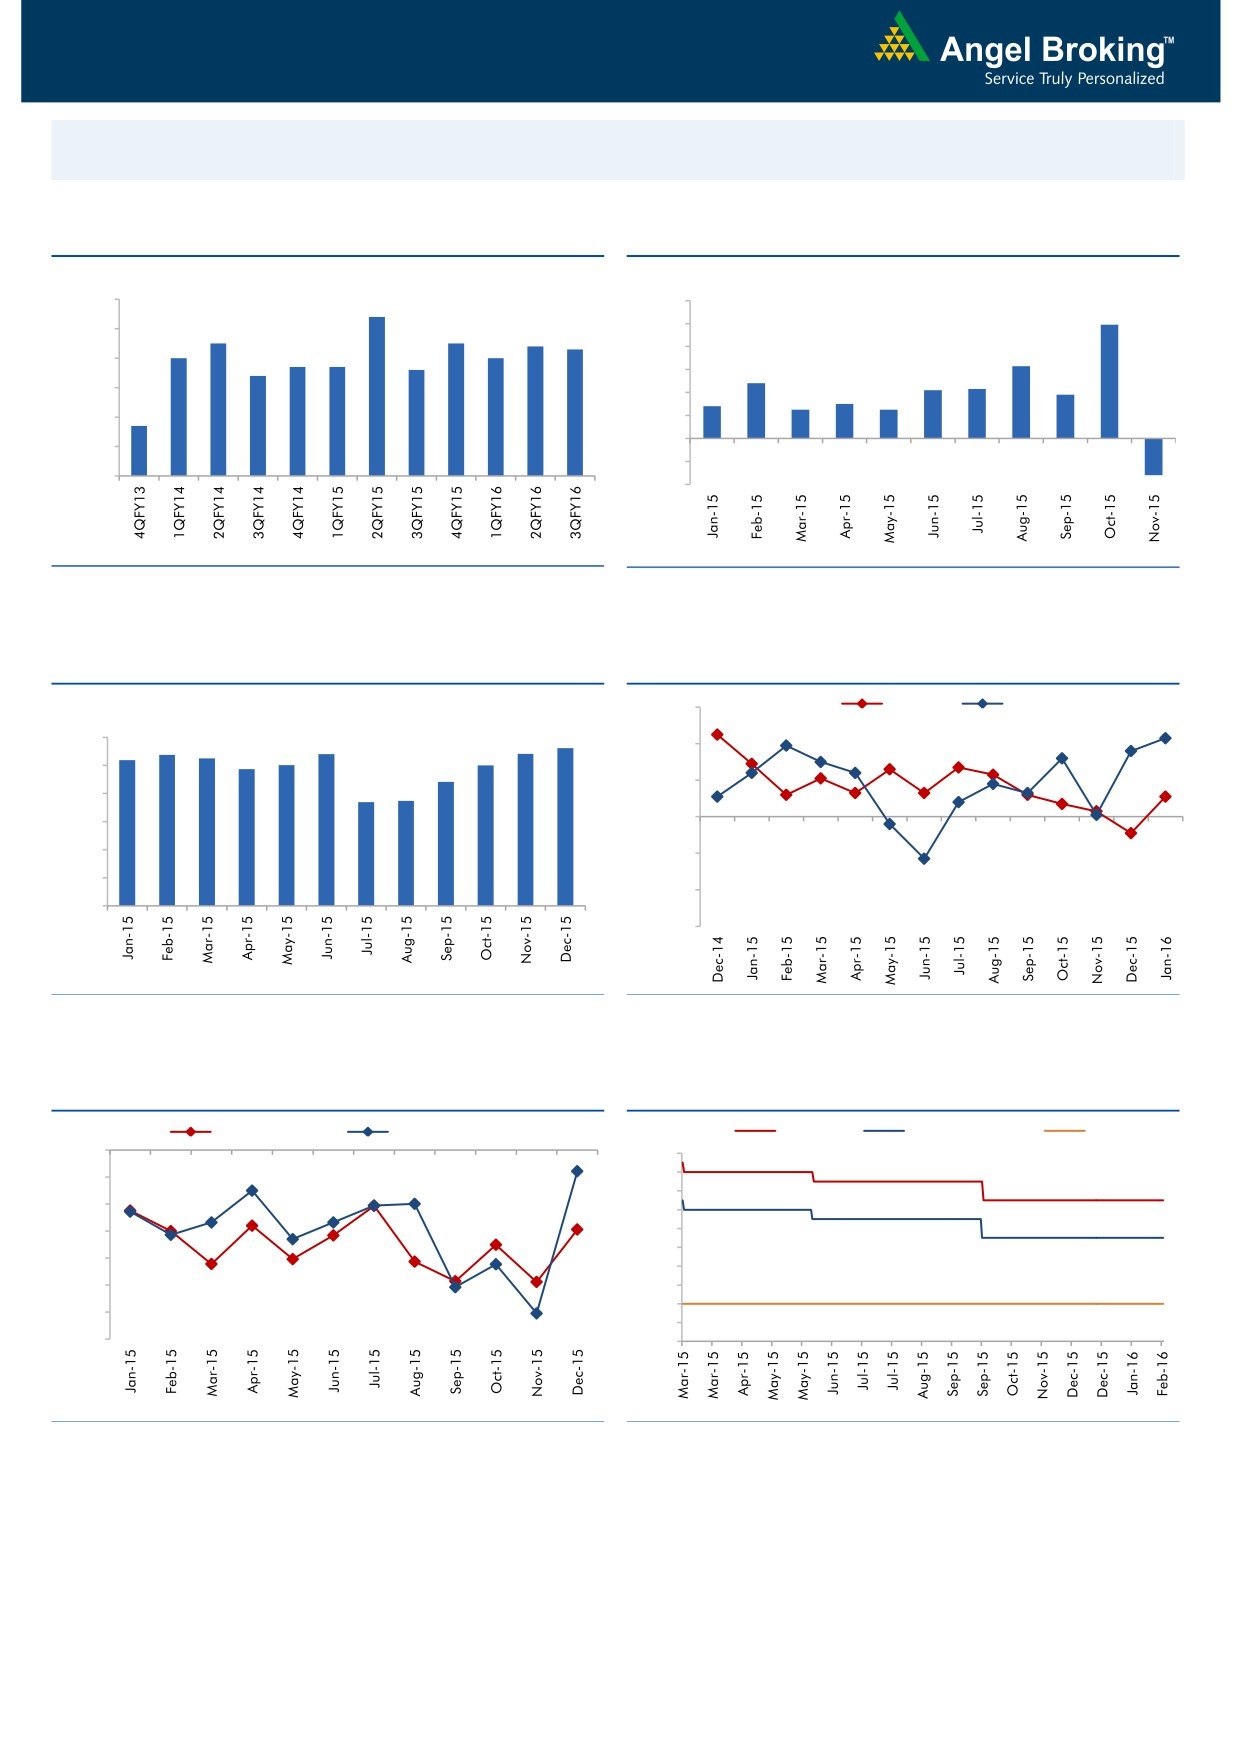
Macro watch
Exhibit 1: Quarterly GDP trends
Exhibit 2: IIP trends
(%)
(%)
9.0
8.4
12.0
9.9
7.5
7.5
10.0
8.0
7.4
7.3
7.0
7.0
6.7
6.7
6.6
8.0
6.3
7.0
6.4
6.0
4.8
4.3
4.2
3.8
6.0
2.8
3.0
4.0
2.5
2.5
4.7
5.0
2.0
(3.2)
-
4.0
(2.0)
3.0
(4.0)
Source: CSO, Angel Research
Source: MOSPI, Angel Research
Exhibit 3: Monthly CPI inflation trends
Exhibit 4: Manufacturing and services PMI
(%)
56.0
Mfg. PMI
Services PMI
5.4
5.4
5.6
6.0
5.2
5.4
5.3
54.0
4.9
5.0
5.0
5.0
4.4
3.7
3.7
52.0
4.0
3.0
50.0
2.0
48.0
1.0
46.0
-
44.0
Source: MOSPI, Angel Research
Source: Market, Angel Research; Note: Level above 50 indicates expansion
Exhibit 5: Exports and imports growth trends
Exhibit 6: Key policy rates
(%)
Exports yoy growth
Imports yoy growth
(%)
Repo rate
Reverse Repo rate
CRR
0.0
8.00
7.50
(5.0)
7.00
(10.0)
6.50
(15.0)
6.00
5.50
(20.0)
5.00
(25.0)
4.50
4.00
(30.0)
3.50
(35.0)
3.00
Source: Bloomberg, Angel Research
Source: RBI, Angel Research
Market Outlook
February 12, 2016
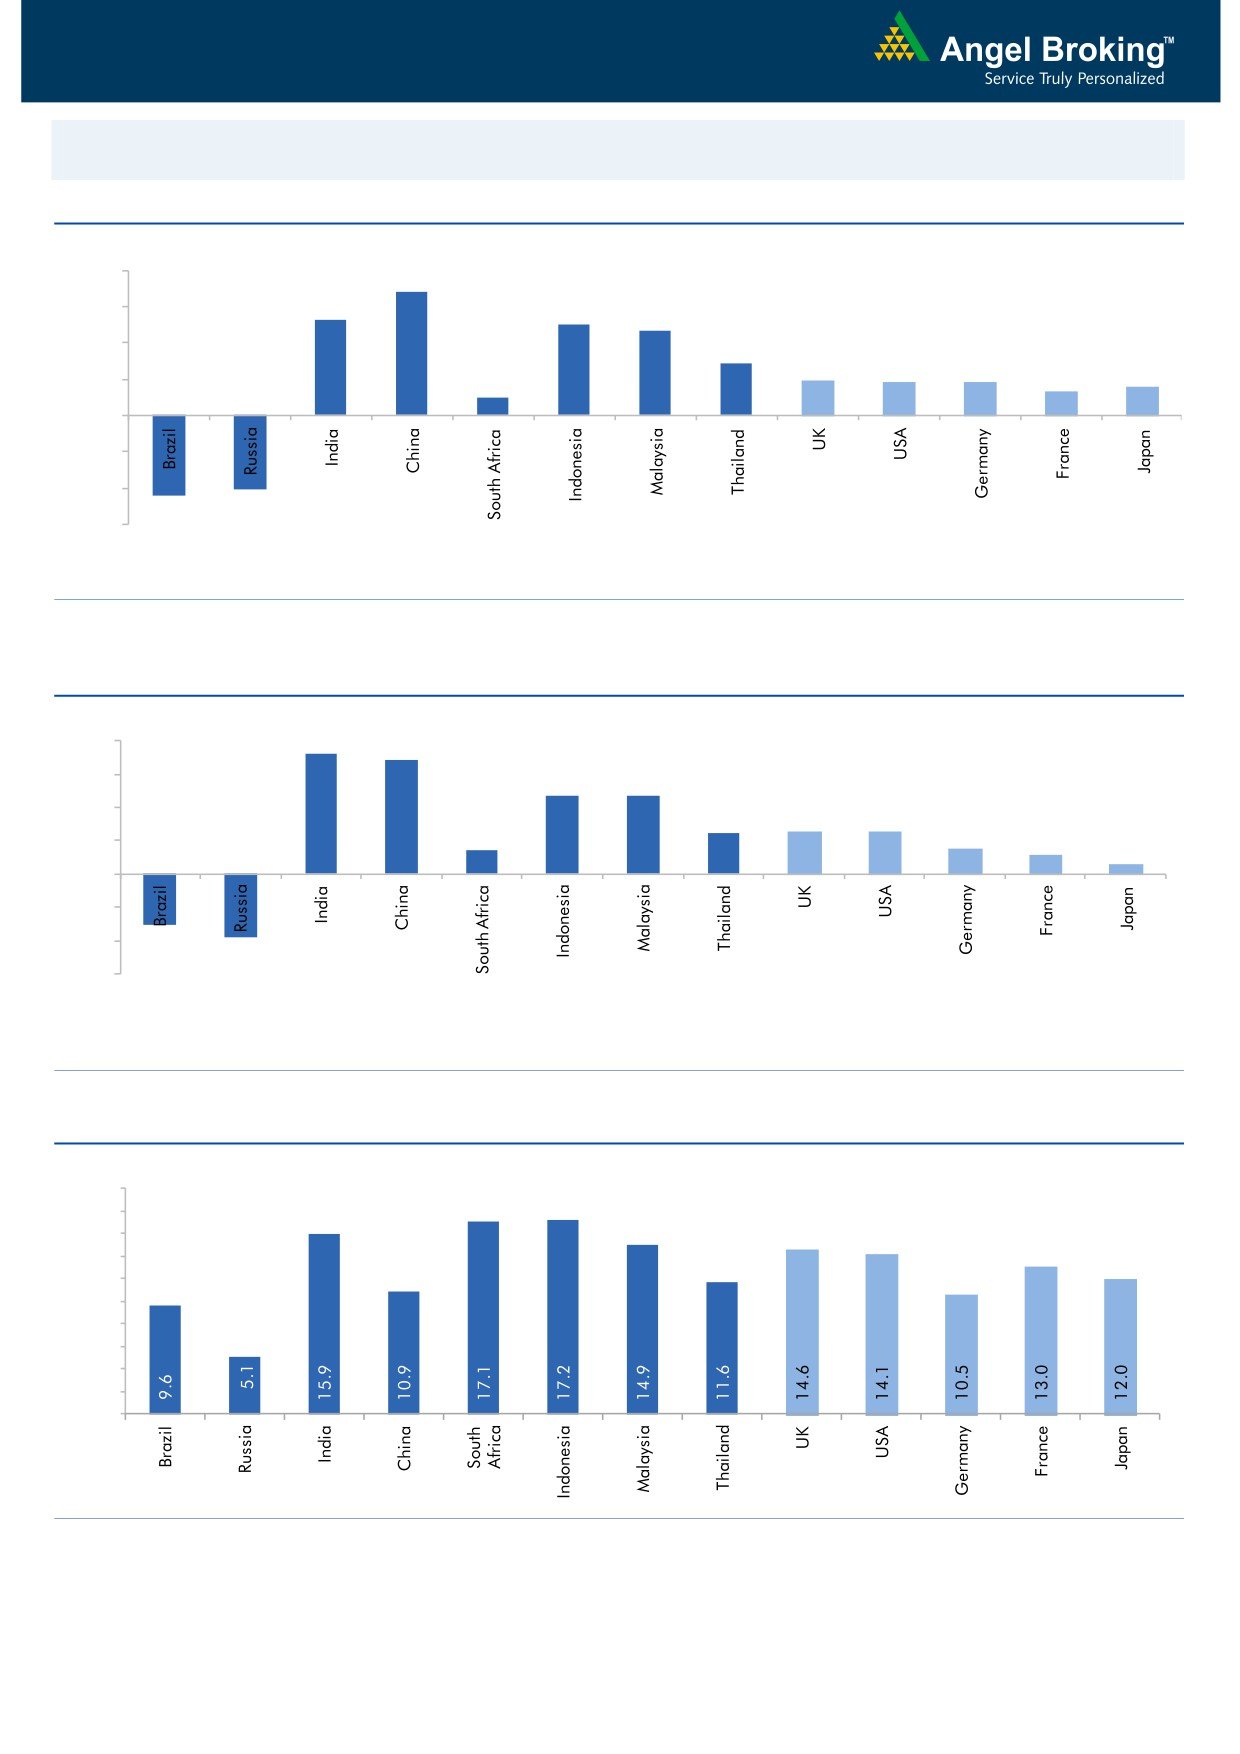
Global watch
Exhibit 1: Latest quarterly GDP Growth (%, yoy) across select developing and developed countries
(%)
8.0
6.8
5.3
6.0
5.0
4.7
4.0
2.9
1.9
1.8
1.8
1.3
1.6
2.0
1.0
(4.5)
(4.1)
-
(2.0)
(4.0)
(6.0)
Source: Bloomberg, Angel Research
Exhibit 2: 2015 GDP Growth projection by IMF (%, yoy) across select developing and developed countries
(%)
7.3
8.0
6.8
6.0
4.7
4.7
4.0
2.5
2.5
2.6
1.4
1.5
2.0
1.2
0.6
(3.0)
(3.8)
-
(2.0)
(4.0)
(6.0)
Source: IMF, Angel Research
Exhibit 3: One year forward P-E ratio across select developing and developed countries
(x)
20.0
18.0
16.0
14.0
12.0
10.0
8.0
6.0
4.0
2.0
-
Source: IMF, Angel Research
Market Outlook
February 12, 2016
Exhibit 4: Relative performance of indices across globe
Returns (%)
Country
Name of index
Closing price
1M
3M
1YR
Brazil
Bovespa
39,318
(3.4)
(18.2)
(16.2)
Russia
Micex
1,712
1.3
(2.3)
(1.8)
India
Nifty
6,976
(7.8)
(11.9)
(19.5)
China
Shanghai Composite
2,763
(17.8)
(23.0)
(16.4)
South Africa
Top 40
42,054
(3.3)
(10.9)
(8.4)
Mexico
Mexbol
42,359
4.1
(4.8)
1.0
Indonesia
LQ45
839
6.1
6.5
(8.1)
Malaysia
KLCI
1,644
(1.4)
(2.0)
(7.8)
Thailand
SET 50
805
2.3
(11.0)
(23.5)
USA
Dow Jones
15,660
(4.5)
(11.7)
(12.9)
UK
FTSE
5,537
(6.6)
(11.8)
(19.4)
Japan
Nikkei
15,713
(11.2)
(17.8)
(10.5)
Germany
DAX
8,753
(12.3)
(19.1)
(20.2)
France
CAC
3,897
(11.0)
(21.3)
(18.8)
Source: Bloomberg, Angel Research
Market Outlook
February 12, 2016
Research Team Tel: 022 - 39357800
DISCLAIMER
Angel Broking Private Limited (hereinafter referred to as “Angel”) is a registered Member of National Stock Exchange of India Limited,
Bombay Stock Exchange Limited and Metropolitan Stock Exchange of India Limited. It is also registered as a Depository Participant with
CDSL and Portfolio Manager with SEBI. It also has registration with AMFI as a Mutual Fund Distributor. Angel Broking Private Limited is
a registered entity with SEBI for Research Analyst in terms of SEBI (Research Analyst) Regulations, 2014 vide registration number
INH000000164. Angel or its associates has not been debarred/ suspended by SEBI or any other regulatory authority for accessing
/dealing in securities Market. Angel or its associates including its relatives/analyst do not hold any financial interest/beneficial
ownership of more than 1% in the company covered by Analyst. Angel or its associates/analyst has not received any compensation /
managed or co-managed public offering of securities of the company covered by Analyst during the past twelve months. Angel/analyst
has not served as an officer, director or employee of company covered by Analyst and has not been engaged in market making activity
of the company covered by Analyst.
This document is solely for the personal information of the recipient, and must not be singularly used as the basis of any investment
decision. Nothing in this document should be construed as investment or financial advice. Each recipient of this document should
make such investigations as they deem necessary to arrive at an independent evaluation of an investment in the securities of the
companies referred to in this document (including the merits and risks involved), and should consult their own advisors to determine
the merits and risks of such an investment.
Reports based on technical and derivative analysis center on studying charts of a stock's price movement, outstanding positions and
trading volume, as opposed to focusing on a company's fundamentals and, as such, may not match with a report on a company's
fundamentals.
The information in this document has been printed on the basis of publicly available information, internal data and other reliable
sources believed to be true, but we do not represent that it is accurate or complete and it should not be relied on as such, as this
document is for general guidance only. Angel Broking Pvt. Limited or any of its affiliates/ group companies shall not be in any way
responsible for any loss or damage that may arise to any person from any inadvertent error in the information contained in this report.
Angel Broking Pvt. Limited has not independently verified all the information contained within this document. Accordingly, we cannot
testify, nor make any representation or warranty, express or implied, to the accuracy, contents or data contained within this document.
While Angel Broking Pvt. Limited endeavors to update on a reasonable basis the information discussed in this material, there may be
regulatory, compliance, or other reasons that prevent us from doing so.
This document is being supplied to you solely for your information, and its contents, information or data may not be reproduced,
redistributed or passed on, directly or indirectly.
Neither Angel Broking Pvt. Limited, nor its directors, employees or affiliates shall be liable for any loss or damage that may arise from
or in connection with the use of this information.
Note: Please refer to the important ‘Stock Holding Disclosure' report on the Angel website (Research Section). Also, please refer to the
latest update on respective stocks for the disclosure status in respect of those stocks. Angel Broking Pvt. Limited and its affiliates may
have investment positions in the stocks recommended in this report.