Market Outlook
January 12, 2016
Market Cues
Domestic Indices
Chg (%)
(Pts)
(Close)
Indian markets are expected to open on a flat note tracking the SGX Nifty and
BSE Sensex
(0.4)
(109)
24,825
Global markets.
Nifty
(0.5)
(37)
7,564
U.S markets closed mixed on Monday, stabilizing after their worst week since 2011,
Mid Cap
(1.0)
(105)
10,888
as declines in commodity prices weighed.
Small Cap
(0.5)
(55)
11,597
European markets were up in early trade Monday, despite the weak performance of
Bankex
(0.8)
(144)
18,224
the Chinese market. The mood among investors soured after the weaker than
expected Eurozone investor sentiment report. Continued weakness in energy and
Global Indices
Chg (%)
(Pts)
(Close)
resource stocks also weighed on the markets. The majority of the European markets
ended the session in negative territory.
Dow Jones
0.3
52
16,399
Nasdaq
(0.1)
(6)
4,638
Indian markets ended Monday’s session in negative territory on the back of
continued worries about Chinese equities.
FTSE
(0.7)
(41)
5,872
Nikkei
(0.4)
(69)
17,698
News & Result Analysis
Hang Seng
(2.8)
(565)
19,889
Cadila Healthcare gets EIR report from USFDA
Shanghai Com
(5.3)
(170)
3,017
Result Preview: TCS
Detailed analysis on Pg2
Advances / Declines
BSE
NSE
Investor’s Ready Reckoner
Advances
1,235
1,231
Key Domestic & Global Indicators
Declines
1,584
343
Stock Watch: Latest investment recommendations on 150+ stocks
Unchanged
125
47
Refer P5 onwards
Top Picks
Volumes (` Cr)
CMP
Target
Upside
Company
Sector
Rating
BSE
3,604
(`)
(`)
(%)
NSE
483,652
Amara Raja Batteries Auto & Auto Ancillary
Buy
843
1,040
23.3
HCL Tech
IT
Buy
814
1,132
39.0
Larsen & Toubro
Construction
Buy
1,175
1,646
40.1
Net Inflows (` Cr)
Net
Mtd
Ytd
LIC Housing Finance Financials
Buy
501
592
18.2
FII
(678)
(2,275)
18,575
Navkar Corporation Others
Buy
202
265
30.9
MFs
62
306
69,277
More Top Picks on Pg4
Top Gainers
Price (`)
Chg (%)
Key Upcoming Events
Previous
Consensus
Sreinfra
68
8.3
Date
Region
Event Description
Reading
Expectations
Rtnpower
13
6.3
Jan 12
India
Industrial Production YoY
9.80
Sci
96
5.5
UK
Industrial Production (YoY)
1.70
1.80
Nationalum
39
5.5
Jan 13
China
Exports YoY%
(6.80)
(8.00)
Jan 14
US
Initial Jobless claims
277.00
275.00
Hdil
81
5.3
India
Monthly Wholesale Prices YoY%
(1.99)
(1.20)
Top Losers
Price (`)
Chg (%)
Sintex
94
(6.9)
Unionbank
131
(4.7)
Abb
1,007
(4.5)
Oil
377
(4.3)
Gskcons
6,250
(4.2)
As on January 11, 2015
Market Outlook
January 12, 2016
Cadila Healthcare gets EIR report from USFDA
Drug firm Cadila Healthcare has received Establishment Inspection Report (EIR)
for Baddi manufacturing plant from the US health regulator after successful
inspection closure.
The company's manufacturing plant at Baddi, Himachal Pradesh, has successfully
obtained the Establishment Inspection Report from the United States Food and
Drug Administration (USFDA).
This will now pave the way for further approval of products from this site. The
company makes formulations at its Baddi manufacturing facility. Establishment
Inspection Report is given to an establishment after the completion of the
inspection by the FDA. We maintain our accumulate rating on the stock, with a
price target of `352.
Result Preview
TCS (CMP: `2,518/ TP: `2,833/ Upside: 12.5%)
TCS is slated to announce its 3QFY2015 results today. We expect the company to
post 0.2% sequential growth in USD revenues to US$3,935mn, mostly impacted by
cross currency impact. In rupee terms, revenues are expected to come in at
`24,563cr, up 3.1% qoq. EBITDA margin is expected to show an uptick of ~47bp
qoq to 29.2%. Consequently, PAT is expected to be at `5,424cr, an up-tick of
2.6% qoq. We maintain our accumulate rating on the stock, with a price target of
`2,833.
Y/E
Sales OPM
PAT
EPS ROE P/E P/BV EV/EBITDA EV/Sales
March
(` cr)
(%)
(` cr)
(`)
(%)
(x)
(x)
(x)
(x)
FY2015E
95,106
29.6
21,576
110.2
35.9
22.8
8.2
16.6
4.9
FY2016E
1,08,420
29.2
24,251
123.9
35.7
20.3
7.3
14.7
4.3
Quarterly Bloomberg Brokers Consensus Estimate
Tata Consultancy Services Ltd Consol - January 12, 2016
Particulars (` cr)
3QFY16E
3QFY15
y-o-y (%)
2QFY16
q-o-q (%)
Net sales
27,647
24,501
12.8
23,816
16.1
EBITDA
7,837
7,053
11.1
6,808
15.1
EBITDA margin (%)
28.3
28.8
28.6
Net profit
6,004
5,227
14.9
5,244
14.5
Federal Bank Ltd - January 12, 2016
Particulars (` cr)
3QFY16E
3QFY15
y-o-y (%)
2QFY16
q-o-q (%)
PAT
181
265
(31.6)
240
(24.6)
Indusind bank Ltd- January 12, 2016
Particulars (` cr)
3QFY16E
3QFY15
y-o-y (%)
2QFY16
q-o-q (%)
PAT
579
447
29.5
560
3.4
Market Outlook
January 12, 2016
Economic and Political News
PMO sets up committee to fast-track high speed rail corridor
SriCity signs MoUs with 11 cos pledging `1,215cr investment
Tamil Nadu set state-advised price of sugarcane at `2,850 a tonne
Corporate News
Indian Bank plans to raise around `1,100cr
Torrent launches world's second biosimilar of generic auto-immune drug
Apollo Hospitals to close PE funding in a month
Market Outlook
January 12, 2016
Top Picks ★★★★★
Large Cap
Market Cap
CMP
Target
Upside
Company
Rationale
(` Cr)
(`)
(`)
(%)
To outpace battery industry growth due to better technological
Amara Raja Batteries
14,403
843
1,040
23.3
products leading to market share gains in both the automotive
OEM and replacement segments.
Earnings to grow strongly given the MHCV cyclical upturn.
Ashok Leyland
26,296
92
111
20.1
Focus on exports and LCV's provides additional growth
avenue.
The stock is trading at attractive valuations and is factoring all
HCL Tech
1,14,782
814
1,132
39.0
the bad news.
Strong visibility for a robust 20% earnings trajectory, coupled
HDFC Bank
2,67,053
1,058
1,262
19.3
with high quality of earnings on account of high quality retail
business and strategic focus on highly rated corporates.
Back on the growth trend, expect a long term growth of 14%
Infosys
2,42,810
1,057
1,306
23.5
to be a US$20bn in FY2020.
Well positioned to benefit from such expected gradual
recovery in the overall domestic capex cycle, given its presence
Larsen & Toubro
1,09,399
1,175
1,646
40.1
across various infrastructure segments, its execution
capabilities, and its strong balance sheet.
LICHF continues to grow its retail loan book at a healthy pace
with improvement in asset quality. We expect the company to
LIC Housing Finance
25,261
501
592
18.2
post a healthy loan book which is likely to reflect in a strong
earnings growth.
Source: Company, Angel Research
Mid Cap
Market Cap
CMP
Target
Upside
Company
Rationale
(` Cr)
(`)
(`)
(%)
Favourable outlook for the AC industry to augur well for
Cooling products business which is out pacing the market
Blue Star
3,340
371
439
18.2
growth. EMPPAC division's profitability to improve once
operating environment turns around.
Change in business focus towards high-margin chronic &
Garware Wall Ropes
872
399
473
18.7
lifestyle segments and increasing penetration in Europe and
US
Economic recovery to have favourable impact on advertising &
circulation revenue growth. Further, the acquisition of a radio
Jagran Prakashan
5,504
168
189
12.3
business (Radio City) would also boost the company's revenue
growth.
Massive capacity expansion along with rail advantage at ICD
Navkar Corporation
2,886
202
265
30.9
as well CFS augurs well for the company
Earnings boost on back of stable material prices and
Radico Khaitan
1,614
121
156
28.6
favourable pricing environment. Valuation discount to peers
provides additional comfort
Strong brands and distribution network would boost growth
Siyaram Silk Mills
1,110
1,184
1,354
14.3
going ahead. Stock currently trades at an inexpensive
valuation.
Structural shift in the Lighting industry towards LED lighting will
Surya Roshni
735
168
201
19.8
drive growth.
Source: Company, Angel Research
Market Outlook
January 12, 2016
Key Upcoming Events
Result Calendar
Date
Company
Jan 12, 2016
IndusInd Bank, Federal Bank, TCS
Jan 14, 2016
Infosys, Infotech Enterprises
Jan 15, 2016
HUL, NIIT, Tide Water Oil India
Jan 16, 2016
LIC Housing Fin.
Jan 18, 2016
Rallis, Kotak Mah. Bank, Asian Paints, Wipro, Mindtree
Jan 19, 2016
HCL Tech, Hind. Zinc
Jan 20, 2016
UltraTech Cement, Axis Bank, South Ind.Bank, KPIT Cummins
Jan 21, 2016
Exide Industries, Heritage Foods, Alembic Pharma
Jan 22, 2016
Cairn India
Jan 23, 2016
Persistent
Jan 25, 2016
HDFC Bank, Hindustan Media Ventures
Jan 27, 2016
Colgate, Godrej Consumer, HT Media, Kirloskar Engines India Ltd
Jan 28, 2016
ICICI Bank, Dabur India, Jyothy Laboratories
Jan 29, 2016
Blue Star, JSW Steel , Elecon Engineering
Source: Bloomberg, Angel Research
Global economic events release calendar
Date
Time
Country
Event Description
Unit
Period
Bloomberg Data
Last Reported Estimated
Jan 12, 2016
5:30PM
India
Industrial Production YoY
% Change
Nov
9.80
2.00
3:00PM
UK
Industrial Production (YoY)
% Change
Nov
1.70
1.70
Jan 13, 2016
China
Exports YoY%
% Change
Dec
(6.80)
(8.00)
Jan 14, 2016
7:00PM
US
Initial Jobless claims
Thousands
Jan 9
277.00
275.00
India
Imports YoY%
% Change
Dec
(30.26)
--
India
Exports YoY%
% Change
Dec
(24.43)
--
12:00PM
India
Monthly Wholesale Prices YoY%
% Change
Dec
(1.99)
(1.20)
5:30PM
UK
BOE Announces rates
% Ratio
Jan 14
0.50
0.50
Jan 15, 2016
7:45PM
US
Industrial Production
%
Dec
(0.56)
(0.20)
US
Producer Price Index (mom)
% Change
Dec
0.10
--
Jan 19, 2016
3:00PM
UK
CPI (YoY)
% Change
Dec
0.10
--
7:30AM
China
Industrial Production (YoY)
% Change
Dec
6.20
6.10
7:30AM
China
Real GDP (YoY)
% Change
4Q
6.90
6.90
Jan 20, 2016
7:00PM
US
Housing Starts
Thousands
Dec
1,173.00
1,235.00
7:00PM
US
Building permits
Thousands
Dec
1,282.00
1,193.00
3:00PM
UK
Jobless claims change
% Change
Dec
3.90
--
7:00PM
US
Consumer price index (mom)
% Change
Dec
--
Jan 21, 2016
8:30PM
Euro Zone
Euro-Zone Consumer Confidence
Value
Jan A
(5.70)
--
3:30PM
Euro Zone
Euro-Zone CPI (YoY)
%
Dec F
0.20
--
6:15PM
Euro Zone
ECB announces interest rates
%
Jan 21
0.05
--
Jan 22, 2016
2:00PM
Germany
PMI Services
Value
Jan P
56.00
--
2:00PM
Germany
PMI Manufacturing
Value
Jan P
53.20
--
8:30PM
US
Existing home sales
Million
Dec
4.76
5.14
Jan 26, 2016
8:30PM
US
Consumer Confidence
S.A./ 1985=100
Jan
96.50
--
Jan 27, 2016
8:30PM
US
New home sales
Thousands
Dec
490.00
--
Jan 28, 2016
3:00PM
UK
GDP (YoY)
% Change
4Q A
2.10
--
12:30AM
US
FOMC rate decision
%
Jan 27
0.50
0.50
Source: Bloomberg, Angel Research
Market Outlook
January 12, 2016
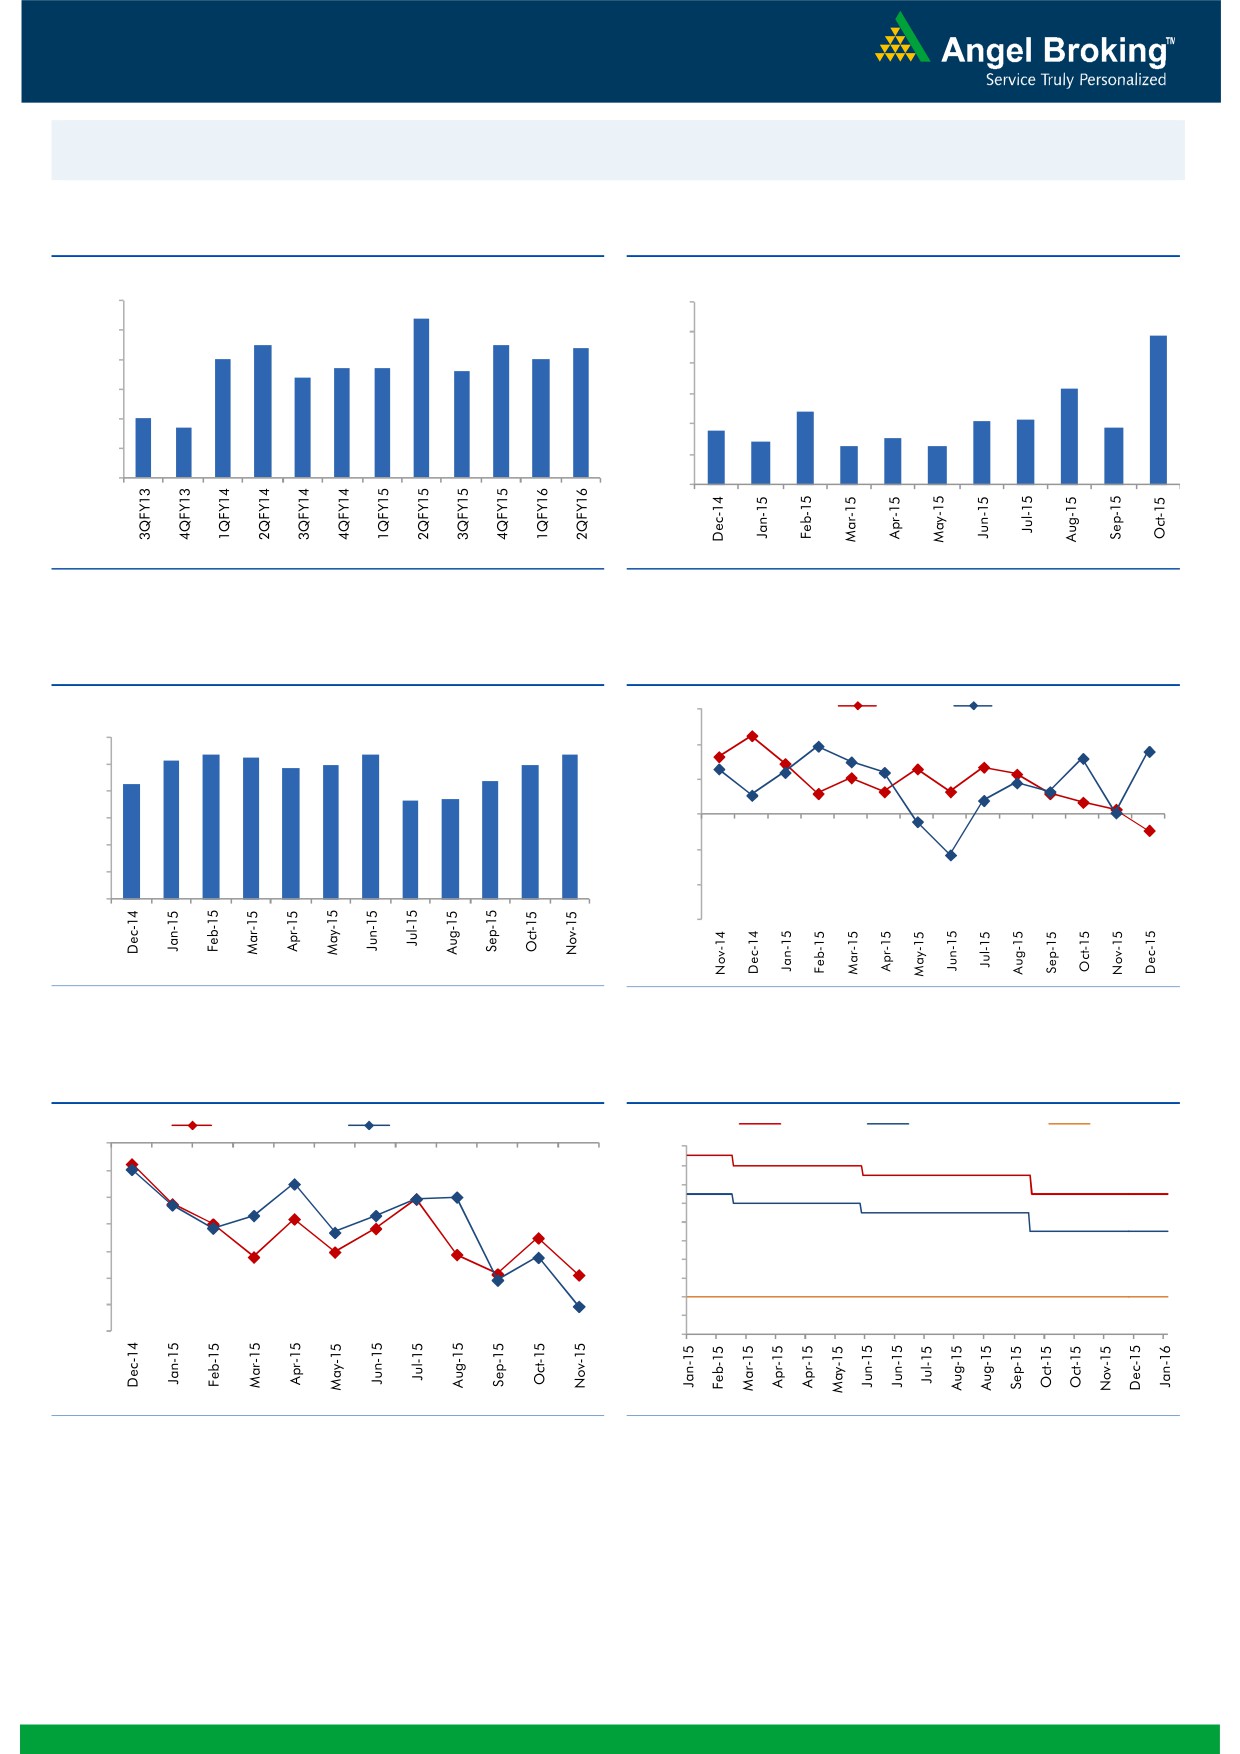
Macro watch
Exhibit 1: Quarterly GDP trends
Exhibit 2: IIP trends
(%)
(%)
9.0
8.4
12.0
9.8
8.0
7.5
7.5
7.4
10.0
7.0
7.0
6.7
6.7
6.6
7.0
6.4
8.0
6.3
6.0
6.0
4.8
5.0
4.2
4.3
4.7
3.6
3.8
5.0
4.0
2.8
3.0
2.5
2.5
4.0
2.0
3.0
-
Source: CSO, Angel Research
Source: MOSPI, Angel Research
Exhibit 3: Monthly CPI inflation trends
Exhibit 4: Manufacturing and services PMI
(%)
56.0
Mfg. PMI
Services PMI
6.0
5.4
5.3
5.4
5.4
5.2
5.0
5.0
54.0
4.9
5.0
4.3
4.4
3.7
3.7
52.0
4.0
3.0
50.0
2.0
48.0
1.0
46.0
-
44.0
Source: MOSPI, Angel Research
Source: Market, Angel Research; Note: Level above 50 indicates expansion
Exhibit 5: Exports and imports growth trends
Exhibit 6: Key policy rates
(%)
Exports yoy growth
Imports yoy growth
(%)
Repo rate
Reverse Repo rate
CRR
0.0
8.00
7.50
(5.0)
7.00
(10.0)
6.50
(15.0)
6.00
5.50
(20.0)
5.00
(25.0)
4.50
4.00
(30.0)
3.50
(35.0)
3.00
Source: Bloomberg, Angel Research
Source: RBI, Angel Research
Market Outlook
January 12, 2016
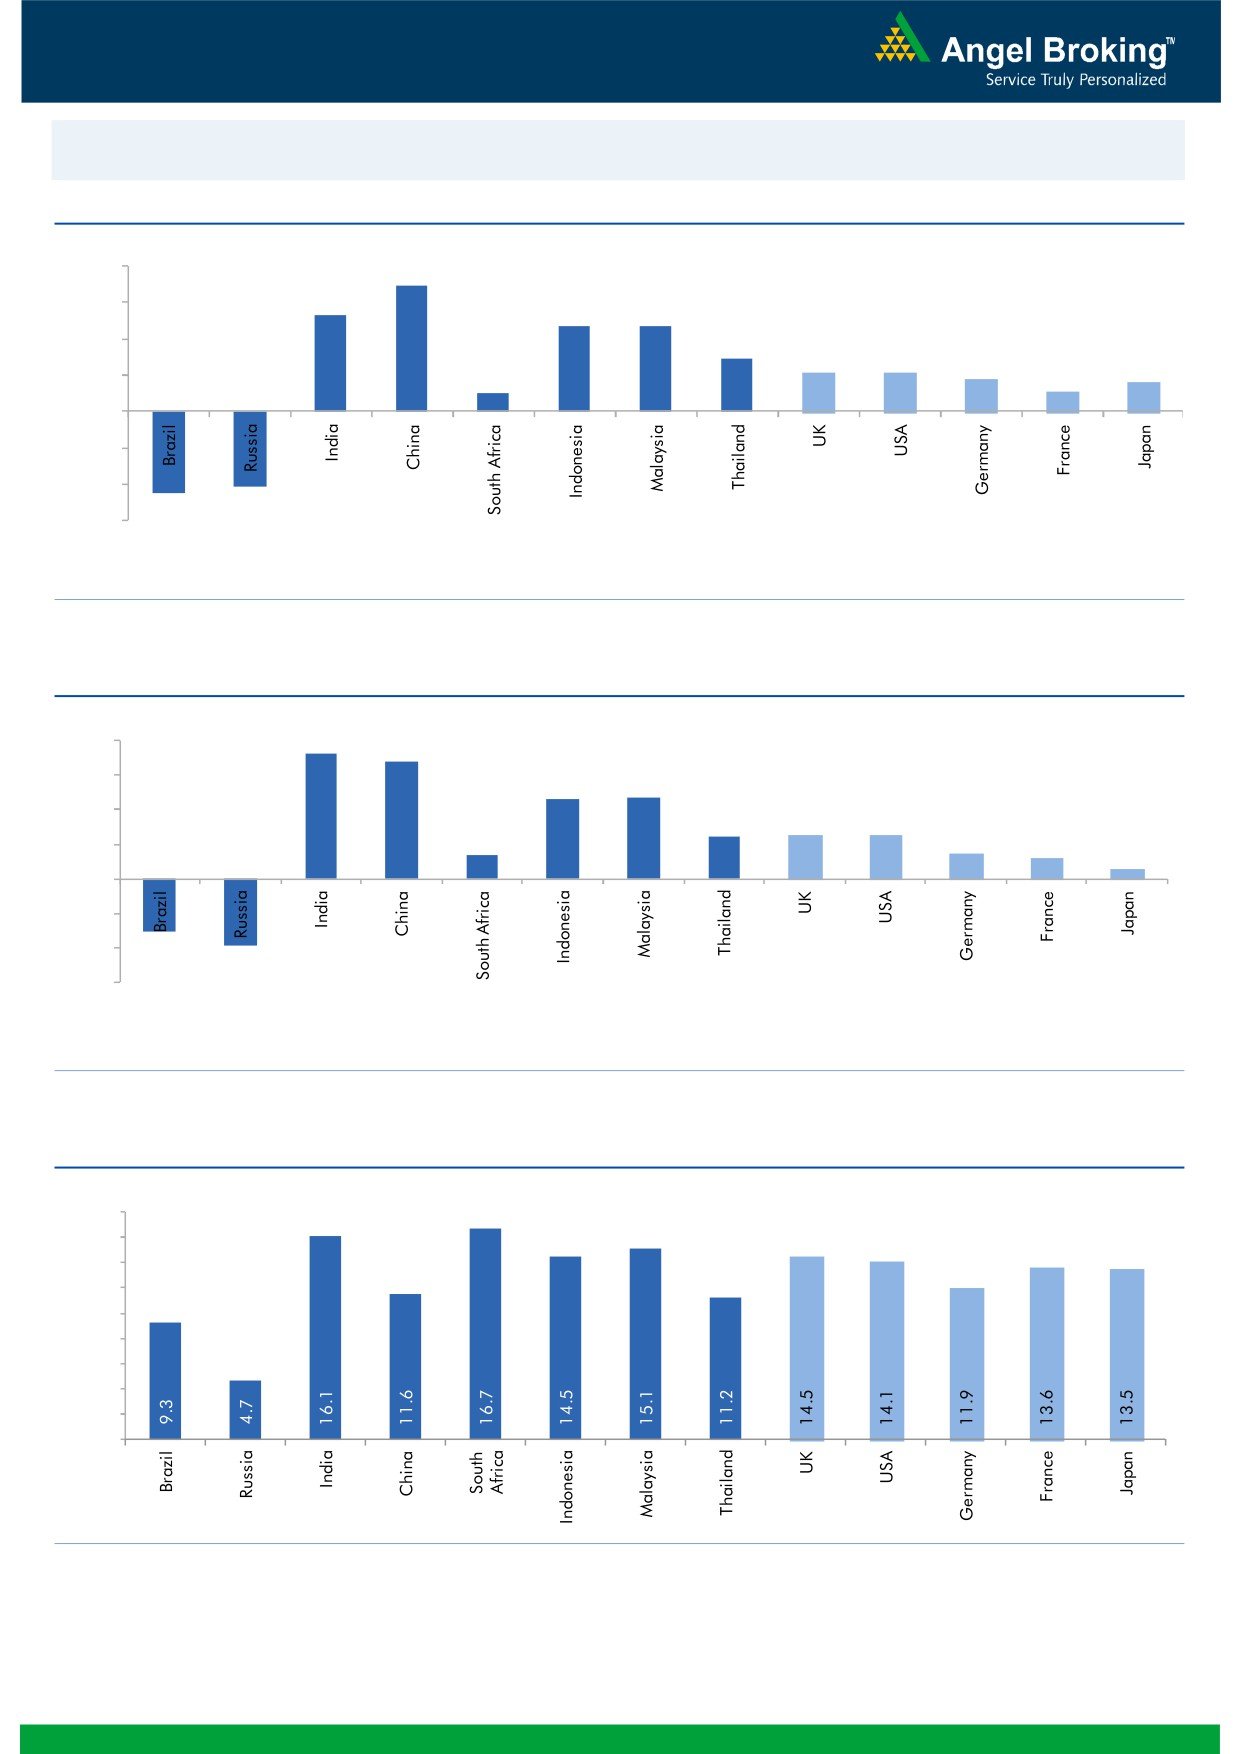
Global watch
Exhibit 1: Latest quarterly GDP Growth (%, yoy) across select developing and developed countries
(%)
8.0
6.9
6.0
5.3
4.7
4.7
4.0
2.9
2.1
2.1
1.8
2.0
1.0
1.1
1.6
-
(2.0)
(4.0)
(4.1)
(4.5)
(6.0)
Source: Bloomberg, Angel Research
Exhibit 2: 2015 GDP Growth projection by IMF (%, yoy) across select developing and developed countries
(%)
7.3
8.0
6.8
6.0
4.7
4.7
4.0
2.5
2.5
2.6
1.4
1.5
2.0
1.2
0.6
-
(2.0)
(4.0)
(3.0)
(3.8)
(6.0)
Source: IMF, Angel Research
Exhibit 3: One year forward P-E ratio across select developing and developed countries
(x)
18.0
16.0
14.0
12.0
10.0
8.0
6.0
4.0
2.0
-
Source: IMF, Angel Research
Market Outlook
January 12, 2016
Exhibit 4: Relative performance of indices across globe
Returns (%)
Country
Name of index
Closing price
1M
3M
1YR
Brazil
Bovespa
39,950
(11.9)
(15.1)
(17.6)
Russia
Micex
1,683
(4.1)
0.7
8.7
India
Nifty
7,564
(0.6)
(7.5)
(6.9)
China
Shanghai Composite
3,017
(13.1)
(8.2)
(4.7)
South Africa
Top 40
43,483
(3.2)
(8.1)
1.1
Mexico
Mexbol
40,707
(3.6)
(7.1)
(4.0)
Indonesia
LQ45
773
(1.3)
5.4
(13.4)
Malaysia
KLCI
1,638
(2.1)
(1.5)
(6.6)
Thailand
SET 50
770
(10.0)
(13.3)
(23.8)
USA
Dow Jones
16,399
(6.7)
(3.8)
(7.0)
UK
FTSE
5,872
(5.7)
(7.9)
(10.2)
Japan
Nikkei
17,698
(9.3)
(0.2)
(0.7)
Germany
DAX
9,825
(8.6)
(1.5)
(1.2)
France
CAC
4,313
(7.9)
(8.3)
(1.5)
Source: Bloomberg, Angel Research
Stock Watch
January 12, 2016
Company Name
Reco
CMP
Target
Mkt Cap
Sales ( Čcr )
OPM(%)
EPS (Č)
PER(x)
P/BV(x)
RoE(%)
EV/Sales(x)
(Č)
Price ( Č)
( Č cr )
FY16E FY17E
FY16E
FY17E
FY16E
FY17E
FY16E
FY17E
FY16E
FY17E
FY16E
FY17E
FY16E
FY17E
Agri / Agri Chemical
Rallis
Neutral
166
-
3,234
2,097
2,415
14.4
14.4
9.5
11.0
17.5
15.1
3.5
3.0
21.1
21.3
1.6
1.4
United Phosphorus
Buy
425
510
18,233
13,698
15,752
17.6
17.6
32.1
38.5
13.3
11.1
2.6
2.2
21.4
21.3
1.4
1.2
Auto & Auto Ancillary
Ashok Leyland
Buy
92
111
26,296
17,995
21,544
11.4
11.6
3.4
4.7
27.2
19.7
4.8
4.4
17.7
22.2
1.4
1.2
Bajaj Auto
Buy
2,360
2,728
68,285
23,695
27,298
21.3
20.4
134.6
151.5
17.5
15.6
5.6
4.8
31.8
30.6
2.4
2.1
Bharat Forge
Accumulate
827
943
19,260
7,867
8,881
20.0
20.3
34.4
41.0
24.1
20.2
4.7
3.9
21.1
20.9
2.6
2.2
Eicher Motors
Accumulate
17,239
19,036
46,811
15,379
16,498
15.6
16.6
473.2
574.8
36.4
30.0
13.5
10.0
36.7
33.2
3.0
2.7
Gabriel India
Accumulate
93
101
1,339
1,415
1,544
8.7
9.0
4.6
5.4
20.3
17.3
3.7
3.3
18.1
18.9
0.9
0.8
Hero Motocorp
Accumulate
2,503
2,774
49,986
28,561
31,559
14.7
14.7
151.1
163.2
16.6
15.3
6.4
5.5
38.7
35.6
1.6
1.4
Jamna Auto Industries Neutral
152
-
1,215
1,292
1,486
9.3
9.8
6.0
7.5
25.4
20.3
5.3
4.4
20.7
21.8
1.0
0.9
L G Balakrishnan & Bros Neutral
494
-
775
1,254
1,394
11.6
11.8
35.9
41.7
13.8
11.9
1.9
1.6
13.5
13.8
0.7
0.6
Mahindra and Mahindra Buy
1,164
1,449
72,270
39,031
44,440
13.8
13.9
57.9
67.6
20.1
17.2
3.3
2.9
16.1
16.6
1.5
1.3
Maruti
Neutral
4,279
-
129,274
57,865
68,104
16.4
16.7
176.3
225.5
24.3
19.0
4.7
4.0
19.4
21.2
2.0
1.7
Minda Industries
Neutral
898
-
1,425
2,567
2,965
8.0
8.3
46.1
57.8
19.5
15.5
3.3
2.7
16.7
17.3
0.7
0.5
Motherson Sumi
Buy
270
313
35,667
39,343
45,100
8.8
9.1
10.1
12.5
26.7
21.6
8.5
6.6
35.3
34.4
1.0
0.9
Rane Brake Lining
Accumulate
343
366
272
454
511
11.1
11.4
23.8
28.1
14.4
12.2
2.0
1.9
14.2
15.3
0.7
0.7
Setco Automotive
Neutral
39
-
524
594
741
12.7
13.7
1.7
3.2
23.1
12.3
2.4
2.1
10.4
16.9
1.3
1.1
Tata Motors
Accumulate
361
409
104,127
266,022
312,667
12.8
13.1
26.3
38.3
13.7
9.4
1.8
1.5
8.4
12.1
0.6
0.5
TVS Motor
Buy
286
338
13,580
11,569
13,648
7.3
8.7
10.3
16.1
27.8
17.8
6.9
5.4
24.8
30.5
1.2
1.0
Amara Raja Batteries
Buy
843
1,040
14,403
4,892
5,871
17.4
17.6
28.8
37.1
29.3
22.7
6.8
5.5
23.4
24.1
2.9
2.4
Exide Industries
Buy
139
162
11,824
6,950
7,784
14.4
14.8
6.6
7.3
21.1
19.1
2.7
2.4
12.6
12.8
1.4
1.3
Apollo Tyres
Buy
148
171
7,531
12,146
12,689
16.8
16.0
21.2
19.0
7.0
7.8
1.2
1.0
16.5
13.0
0.7
0.7
Ceat
Accumulate
1,002
1,119
4,052
6,041
6,597
14.1
13.7
99.5
111.9
10.1
9.0
2.0
1.7
19.6
18.5
0.8
0.7
JK Tyres
Neutral
105
-
2,391
7,446
7,669
15.2
14.0
19.6
18.4
5.4
5.7
1.4
1.1
25.2
19.5
0.7
0.6
Swaraj Engines
Neutral
953
-
1,184
552
630
14.2
14.7
44.6
54.1
21.4
17.6
5.0
4.5
23.2
25.6
2.0
1.7
Subros
Neutral
106
-
633
1,268
1,488
11.6
11.9
3.7
6.6
28.5
16.0
1.9
1.7
6.8
11.4
0.8
0.7
Indag Rubber
Neutral
201
-
528
283
329
17.0
17.2
13.0
15.4
15.5
13.0
3.4
2.8
21.8
21.6
1.6
1.3
Capital Goods
ACE
Neutral
45
-
447
660
839
4.7
8.2
1.0
3.9
45.2
11.6
1.4
1.3
3.2
11.3
0.8
0.7
BEML
Neutral
1,224
-
5,097
3,277
4,006
6.0
8.9
29.2
64.3
41.9
19.0
2.3
2.1
5.7
11.7
1.6
1.3
Bharat Electronics
Accumulate
1,331
1,414
31,934
7,737
8,634
16.8
17.2
54.0
61.0
24.6
21.8
3.5
3.1
39.3
45.6
3.2
2.8
Stock Watch
January 12, 2016
Company Name
Reco
CMP
Target
Mkt Cap
Sales ( Čcr )
OPM(%)
EPS (Č)
PER(x)
P/BV(x)
RoE(%)
EV/Sales(x)
(Č)
Price ( Č)
( Č cr )
FY16E
FY17E
FY16E
FY17E
FY16E
FY17E
FY16E
FY17E
FY16E
FY17E
FY16E
FY17E
FY16E
FY17E
Capital Goods
Voltas
Buy
298
353
9,869
5,363
5,963
8.0
9.1
11.0
13.8
27.1
21.6
4.2
3.7
16.2
17.9
1.8
1.6
BGR Energy
Neutral
127
-
916
3,615
3,181
9.5
9.4
16.7
12.4
7.6
10.2
0.7
0.7
10.0
7.0
0.7
0.8
BHEL
Neutral
150
-
36,653
33,722
35,272
10.8
11.7
10.5
14.2
14.3
10.6
1.1
1.0
7.0
9.0
1.2
1.1
Blue Star
Buy
371
439
3,340
3,548
3,977
6.3
6.9
13.7
17.2
27.1
21.6
6.8
4.4
26.1
25.4
1.0
0.9
Crompton Greaves
Accumulate
192
204
12,055
13,484
14,687
4.9
6.2
4.5
7.1
42.7
27.1
3.0
2.8
7.2
10.8
1.0
0.9
Inox Wind
Buy
346
458
7,684
4,980
5,943
17.0
17.5
26.6
31.6
13.0
11.0
3.9
2.9
35.0
30.0
1.7
1.4
KEC International
Neutral
140
-
3,607
8,791
9,716
6.1
6.8
5.4
8.2
26.0
17.1
2.6
2.4
10.0
14.0
0.6
0.6
Thermax
Neutral
900
-
10,722
6,413
7,525
7.4
8.5
30.5
39.3
29.5
22.9
4.5
4.0
15.0
17.0
1.6
1.4
Cement
ACC
Buy
1,294
1,630
24,296
13,151
14,757
16.4
18.3
63.9
83.4
20.3
15.5
2.6
2.4
13.3
16.1
1.7
1.4
Ambuja Cements
Buy
198
233
30,790
11,564
12,556
19.4
20.7
8.9
10.1
22.3
19.6
2.8
2.7
12.8
13.8
2.3
2.1
HeidelbergCement
Neutral
75
-
1,702
1,772
1,926
13.3
15.4
1.0
3.0
75.1
25.0
1.9
1.8
2.6
7.9
1.5
1.3
India Cements
Accumulate
100
112
3,056
4,216
4,840
18.0
19.5
4.0
9.9
24.9
10.1
1.0
0.9
4.0
9.5
1.1
0.9
JK Cement
Buy
535
744
3,742
3,661
4,742
10.1
15.8
18.0
61.0
29.7
8.8
2.2
1.9
7.5
22.9
1.5
1.1
J K Lakshmi Cement
Buy
317
430
3,727
2,947
3,616
16.7
19.9
11.5
27.2
27.5
11.6
2.6
2.3
9.8
20.8
1.7
1.3
Mangalam Cements
Neutral
194
-
518
1,053
1,347
10.5
13.3
8.4
26.0
23.1
7.5
1.0
0.9
4.3
12.5
0.9
0.6
Orient Cement
Buy
147
183
3,012
1,854
2,524
21.2
22.2
7.7
11.1
19.1
13.2
2.7
2.4
13.3
15.7
2.4
1.6
Ramco Cements
Neutral
391
-
9,308
4,036
4,545
20.8
21.3
15.1
18.8
25.9
20.8
3.2
2.8
12.9
14.3
2.8
2.4
Shree Cement^
Neutral
10,917
-
38,033
7,150
8,742
26.7
28.6
228.0
345.5
47.9
31.6
7.1
5.9
15.7
20.3
5.1
4.1
UltraTech Cement
Buy
2,727
3,282
74,831
25,021
30,023
19.1
21.6
89.0
132.0
30.6
20.7
3.6
3.1
12.2
15.9
3.1
2.6
Construction
ITNL
Neutral
88
-
2,893
7,360
8,825
34.0
35.9
7.0
9.0
12.6
9.8
0.4
0.4
3.2
3.7
3.8
3.6
KNR Constructions
Buy
534
673
1,500
937
1,470
14.3
14.0
33.5
38.6
15.9
13.8
2.4
2.1
15.4
15.4
1.7
1.1
Larsen & Toubro
Buy
1,175
1,646
109,399
65,065
77,009
11.5
11.7
61.5
65.6
19.1
17.9
1.9
1.8
13.4
14.0
1.9
1.6
Gujarat Pipavav Port
Neutral
156
-
7,539
629
684
51.0
52.2
6.4
5.9
24.4
26.4
3.2
3.0
15.9
12.7
11.6
10.5
MBL Infrastructures
Buy
214
285
885
2,313
2,797
12.2
14.6
19.0
20.0
11.2
10.7
1.2
1.1
11.3
10.6
1.1
1.0
Nagarjuna Const.
Neutral
74
-
4,111
7,892
8,842
8.8
9.1
3.0
5.3
24.7
14.0
1.2
1.1
5.0
8.5
0.8
0.6
PNC Infratech
Neutral
538
-
2,760
1,873
2,288
13.2
13.5
24.0
32.0
22.4
16.8
2.2
1.9
12.1
12.3
1.6
1.3
Simplex Infra
Neutral
312
-
1,543
5,955
6,829
10.3
10.5
16.0
31.0
19.5
10.1
1.0
0.9
5.3
9.9
0.8
0.7
Power Mech Projects
Neutral
687
-
1,010
1,539
1,801
12.8
12.7
59.0
72.1
11.6
9.5
1.8
1.5
18.6
16.8
0.7
0.6
Sadbhav Engineering
Neutral
314
-
5,384
3,481
4,219
10.7
10.8
8.0
12.0
39.2
26.2
3.7
3.2
10.3
13.5
1.8
1.5
Stock Watch
January 12, 2016
Company Name
Reco
CMP
Target
Mkt Cap
Sales ( Čcr )
OPM(%)
EPS (Č)
PER(x)
P/BV(x)
RoE(%)
EV/Sales(x)
(Č)
Price ( Č)
( Č cr )
FY16E
FY17E
FY16E
FY17E
FY16E
FY17E
FY16E
FY17E
FY16E
FY17E
FY16E
FY17E
FY16E
FY17E
Construction
NBCC
Accumulate
990
1,089
11,882
7,382
9,506
7.7
8.6
39.8
54.4
24.9
18.2
6.0
4.7
26.7
29.1
1.4
1.0
MEP Infra
Neutral
46
-
744
1,956
1,876
28.1
30.5
1.3
3.0
35.2
15.3
7.4
5.0
21.2
32.8
1.8
1.8
SIPL
Neutral
94
-
3,304
675
1,042
62.4
64.7
-
-
3.5
4.0
-
-
16.6
11.2
Financials
Allahabad Bank
Neutral
64
-
3,817
8,569
9,392
2.8
2.9
16.3
27.5
3.9
2.3
0.4
0.3
7.6
11.9
-
-
Axis Bank
Buy
417
630
99,260
26,473
31,527
3.5
3.6
35.7
43.5
11.7
9.6
2.3
2.0
17.9
18.9
-
-
Bank of Baroda
Neutral
139
-
32,062
18,485
21,025
1.9
2.0
13.5
21.1
10.3
6.6
0.8
0.7
7.3
10.6
-
-
Bank of India
Neutral
108
-
8,529
15,972
17,271
1.9
2.0
15.3
33.4
7.0
3.2
0.3
0.3
3.6
7.6
-
-
Canara Bank
Neutral
216
-
11,748
15,441
16,945
2.0
2.1
46.6
70.4
4.7
3.1
0.4
0.4
8.0
11.2
-
-
Dena Bank
Neutral
40
-
2,552
3,440
3,840
2.1
2.3
7.3
10.0
5.5
3.9
0.4
0.3
6.1
7.9
-
-
Federal Bank
Neutral
52
-
8,982
3,477
3,999
3.0
3.0
5.0
6.2
10.4
8.4
1.1
1.0
10.6
11.9
-
-
HDFC
Neutral
1,163
-
183,566
10,358
11,852
3.3
3.3
41.1
47.0
28.3
24.7
5.4
4.9
24.7
24.9
-
-
HDFC Bank
Buy
1,058
1,262
267,053
38,309
47,302
4.3
4.3
49.3
61.1
21.4
17.3
3.7
3.2
18.5
19.7
-
-
ICICI Bank
Buy
240
354
139,202
34,279
39,262
3.3
3.3
21.0
24.4
11.4
9.8
1.9
1.6
14.4
14.7
-
-
IDBI Bank
Neutral
77
-
12,286
9,625
10,455
1.8
1.8
8.5
14.2
9.0
5.4
0.6
0.5
5.9
9.3
-
-
Indian Bank
Neutral
105
-
5,057
6,160
6,858
2.5
2.5
24.5
29.8
4.3
3.5
0.3
0.3
7.7
8.6
-
-
LIC Housing Finance
Buy
501
592
25,261
3,101
3,745
2.5
2.5
33.0
40.2
15.2
12.5
2.8
2.4
19.7
20.5
-
-
Oriental Bank
Neutral
123
-
3,696
7,643
8,373
2.4
2.4
37.2
45.4
3.3
2.7
0.3
0.3
8.2
9.4
-
-
Punjab Natl.Bank
Neutral
103
-
20,215
23,638
26,557
2.8
2.8
17.9
27.2
5.8
3.8
0.6
0.5
8.5
12.0
-
-
South Ind.Bank
Neutral
20
-
2,633
1,965
2,185
2.5
2.5
2.5
3.3
7.8
5.9
0.8
0.7
9.5
11.7
-
-
St Bk of India
Buy
204
283
158,594
82,520
93,299
2.7
2.8
20.0
24.5
10.2
8.4
1.1
1.0
11.5
12.8
-
-
Union Bank
Neutral
131
-
8,978
12,646
14,129
2.3
2.4
31.0
39.1
4.2
3.3
0.5
0.4
9.8
11.4
-
-
Vijaya Bank
Neutral
33
-
2,874
3,536
3,827
1.9
1.9
5.5
6.7
6.1
5.0
0.5
0.5
7.8
8.8
-
-
Yes Bank
Buy
695
921
29,138
7,190
9,011
3.2
3.3
58.2
69.7
11.9
10.0
2.1
1.8
19.2
19.6
-
-
FMCG
Asian Paints
Neutral
874
-
83,810
16,553
19,160
16.0
16.2
17.7
21.5
49.4
40.6
13.1
11.8
29.4
31.2
4.9
4.2
Britannia
Neutral
2,914
-
34,960
8,065
9,395
9.6
10.2
47.2
65.5
61.7
44.5
20.5
19.4
38.3
41.2
4.2
3.6
Colgate
Neutral
907
-
24,669
4,836
5,490
19.5
19.7
48.5
53.2
18.7
17.1
13.7
11.9
99.8
97.5
5.0
4.4
Dabur India
Neutral
263
-
46,283
9,370
10,265
17.1
17.2
7.3
8.1
35.9
32.5
10.8
8.8
33.7
30.6
4.8
4.4
GlaxoSmith Con*
Neutral
6,254
-
26,301
4,919
5,742
17.2
17.4
168.3
191.2
37.2
32.7
10.5
9.0
28.8
28.9
4.9
4.2
Godrej Consumer
Neutral
1,235
-
42,051
10,168
12,886
16.1
16.1
32.1
38.4
38.5
32.2
7.8
7.2
19.7
21.0
4.2
3.3
Stock Watch
January 12, 2016
Company Name
Reco
CMP
Target
Mkt Cap
Sales ( Čcr )
OPM(%)
EPS (Č)
PER(x)
P/BV(x)
RoE(%)
EV/Sales(x)
(Č)
Price ( Č)
( Č cr )
FY16E FY17E
FY16E
FY17E
FY16E
FY17E
FY16E
FY17E
FY16E
FY17E
FY16E
FY17E
FY16E
FY17E
FMCG
HUL
Neutral
812
-
175,804
34,940
38,957
17.5
17.7
20.8
24.7
39.1
32.9
43.5
34.7
110.5
114.2
4.8
4.3
ITC
Buy
316
382
253,959
41,068
45,068
37.8
37.4
13.9
15.9
22.7
19.9
7.6
6.7
34.1
33.8
5.8
5.3
Marico
Neutral
221
-
28,571
6,551
7,766
15.7
16.0
10.4
12.5
21.3
17.7
6.2
5.2
33.2
32.4
4.3
3.6
Nestle*
Buy
5,515
6,646
53,172
11,291
12,847
22.2
22.3
158.9
184.6
34.7
29.9
18.1
16.3
55.0
57.3
4.6
4.0
Tata Global
Neutral
142
-
8,956
8,635
9,072
9.8
9.9
6.5
7.6
21.8
18.7
2.2
2.1
6.8
7.4
1.0
0.9
IT
HCL Tech^
Buy
814
1,132
114,782
42,038
47,503
23.2
23.5
55.8
62.9
14.6
13.0
3.4
2.6
23.0
19.8
2.3
1.9
Infosys
Buy
1,057
1,306
242,810
60,250
66,999
27.0
28.0
56.4
63.7
18.7
16.6
3.8
3.3
20.4
19.8
3.3
2.8
TCS
Buy
2,363
3,165
465,612
111,274
126,852
28.4
28.7
125.4
143.9
18.8
16.4
7.5
6.9
39.9
42.2
3.8
3.3
Tech Mahindra
Buy
507
646
49,053
25,566
28,890
16.0
17.0
26.3
31.9
19.3
15.9
3.5
3.0
17.9
18.6
1.7
1.4
Wipro
Buy
538
719
132,858
50,808
58,713
23.7
23.8
37.3
42.3
14.4
12.7
2.7
2.4
19.0
17.9
2.2
1.7
Media
D B Corp
Accumulate
321
356
5,900
2,241
2,495
27.8
27.9
21.8
25.6
14.8
12.5
3.9
3.4
26.7
28.5
2.6
2.3
HT Media
Neutral
85
-
1,967
2,495
2,603
11.2
11.2
7.3
8.6
11.6
9.8
0.9
0.8
7.4
8.1
0.3
0.3
Jagran Prakashan
Accumulate
168
189
5,504
2,170
2,355
27.2
26.2
8.9
9.9
18.9
17.0
4.0
3.5
20.9
20.5
2.4
2.2
Sun TV Network
Neutral
408
-
16,096
2,779
3,196
70.2
70.5
22.8
27.3
17.9
15.0
4.4
4.0
26.7
28.3
5.5
4.8
Hindustan Media
Neutral
292
-
2,140
920
1,031
20.0
20.0
19.2
20.9
15.2
14.0
2.5
2.1
16.4
15.3
1.9
1.6
Ventures
Metals & Mining
Coal India
Buy
317
380
200,134
76,167
84,130
19.9
22.3
22.4
25.8
14.1
12.3
5.1
5.0
35.5
41.0
2.0
1.7
Hind. Zinc
Buy
140
175
58,964
14,641
14,026
50.4
50.4
17.7
16.0
7.9
8.7
1.2
1.1
16.2
13.2
1.6
1.5
Hindalco
Neutral
78
-
16,076
104,356
111,186
8.7
9.5
6.7
11.1
11.6
7.0
0.4
0.4
3.5
5.9
0.7
0.6
JSW Steel
Neutral
1,020
-
24,645
42,308
45,147
16.4
20.7
(10.3)
49.5
20.6
1.1
1.1
(1.0)
5.6
1.6
1.5
NMDC
Neutral
88
-
34,890
8,237
10,893
46.6
44.5
10.0
11.7
8.9
7.6
1.0
0.9
12.5
13.0
4.0
3.1
SAIL
Neutral
46
-
19,184
45,915
53,954
7.2
10.5
1.5
4.4
30.8
10.6
0.5
0.4
2.3
4.1
1.1
0.9
Vedanta
Neutral
85
-
25,200
71,445
81,910
26.2
26.3
12.9
19.2
6.6
4.4
0.5
0.4
7.2
8.9
0.8
0.6
Tata Steel
Neutral
252
-
24,475
126,760
137,307
8.9
11.3
6.4
23.1
39.6
10.9
0.8
0.8
2.0
7.1
0.8
0.7
Oil & Gas
Cairn India
Neutral
130
-
24,458
11,323
12,490
49.4
51.0
20.7
20.7
6.3
6.3
0.4
0.4
6.4
6.1
1.2
0.6
GAIL
Neutral
369
-
46,794
64,856
70,933
9.1
9.6
24.0
28.9
15.4
12.8
1.3
1.2
8.8
9.6
0.9
0.8
ONGC
Neutral
226
-
193,654
154,564
167,321
36.8
37.4
28.6
32.5
7.9
7.0
1.0
0.9
12.7
13.5
1.5
1.4
Petronet LNG
Neutral
262
-
19,628
29,691
31,188
5.8
6.2
12.8
13.4
20.5
19.5
3.1
2.7
15.8
14.8
0.7
0.7
Indian Oil Corp
Neutral
443
-
107,534
359,607
402,760
5.9
6.1
42.5
48.7
10.4
9.1
1.4
1.2
14.1
14.4
0.4
0.4
Reliance Industries
Accumulate
1,052
1,150
340,619
304,775
344,392
12.6
13.4
91.3
102.6
11.5
10.3
1.3
1.2
11.8
12.0
1.0
0.9
Stock Watch
January 12, 2016
Company Name
Reco
CMP
Target
Mkt Cap
Sales ( Čcr )
OPM(%)
EPS (Č)
PER(x)
P/BV(x)
RoE(%)
EV/Sales(x)
(Č)
Price ( Č)
( Č cr )
FY16E FY17E
FY16E
FY17E
FY16E
FY17E
FY16E
FY17E
FY16E
FY17E
FY16E
FY17E
FY16E
FY17E
Pharmaceuticals
Alembic Pharma
Neutral
664
-
12,514
2,658
3,112
24.1
20.2
24.6
23.9
27.0
27.8
9.7
7.4
42.5
30.2
4.7
4.0
Aurobindo Pharma
Neutral
834
-
48,720
14,923
17,162
22.0
23.0
35.7
42.8
23.4
19.5
6.9
5.2
34.0
30.2
3.6
3.1
Aventis*
Neutral
4,202
-
9,677
2,082
2,371
17.4
20.8
118.2
151.5
35.6
27.7
5.2
4.2
19.9
25.5
4.3
3.6
Cadila Healthcare
Accumulate
315
352
32,258
10,224
11,840
21.0
22.0
14.6
17.6
21.6
17.9
5.9
4.6
30.8
29.0
3.2
2.7
Cipla
Neutral
610
-
49,018
14,211
16,611
20.6
19.0
27.0
28.9
22.6
21.1
3.8
3.3
18.4
16.8
3.4
2.9
Dr Reddy's
Buy
2,943
3,933
50,180
16,838
19,575
25.0
23.1
167.5
178.8
17.6
16.5
3.7
3.1
23.1
20.4
2.9
2.5
Dishman Pharma
Neutral
329
-
2,656
1,733
1,906
21.5
21.5
17.0
19.9
19.4
16.5
2.0
1.8
10.5
11.2
2.0
1.8
GSK Pharma*
Neutral
3,237
-
27,422
2,870
3,158
20.0
22.1
59.5
68.3
54.4
47.4
16.1
16.5
28.5
34.3
9.1
8.3
Indoco Remedies
Neutral
316
-
2,916
1,033
1,199
15.9
18.2
9.4
13.6
33.7
23.3
5.0
4.2
15.7
19.7
2.9
2.5
Ipca labs
Buy
673
900
8,493
3,363
3,909
12.9
18.6
13.4
28.0
50.2
24.0
3.6
3.1
7.4
14.0
2.8
2.4
Lupin
Neutral
1,702
-
76,688
13,092
16,561
25.0
27.0
50.4
68.3
33.8
24.9
7.0
5.5
22.8
24.7
5.6
4.3
Sun Pharma
Buy
783
950
188,401
28,163
32,610
25.8
30.7
17.4
26.9
45.0
29.1
4.3
3.7
13.0
16.6
6.2
5.1
Power
Tata Power
Neutral
67
-
18,162
35,923
37,402
22.6
22.8
4.1
5.2
16.6
13.0
1.3
1.2
7.5
9.3
1.5
1.3
NTPC
Accumulate
142
157
116,797
87,064
98,846
23.5
23.5
11.7
13.2
12.1
10.7
1.4
1.3
11.4
12.1
2.4
2.1
Power Grid
Buy
143
170
74,916
20,702
23,361
86.7
86.4
12.1
13.2
11.9
10.8
1.7
1.6
15.6
15.1
8.5
7.9
Telecom
Bharti Airtel
Neutral
321
-
128,436
101,748
109,191
32.1
31.7
12.0
12.5
26.8
25.7
1.8
1.7
6.9
6.7
1.9
1.7
Idea Cellular
Neutral
130
-
46,895
34,282
36,941
32.0
31.5
5.9
6.2
22.1
21.0
2.0
1.8
9.9
9.3
1.9
1.8
zOthers
Abbott India
Neutral
5,636
-
11,977
2,715
3,153
14.5
14.1
134.3
152.2
42.0
37.0
10.5
8.6
27.4
25.6
4.1
3.5
Bajaj Electricals
Buy
199
290
2,011
4,719
5,287
5.2
5.8
8.6
12.7
23.3
15.7
2.7
2.3
11.4
14.8
0.4
0.4
Finolex Cables
Neutral
252
-
3,850
2,520
2,883
12.2
12.0
12.7
14.2
19.9
17.7
2.7
2.4
13.6
13.5
1.3
1.1
Goodyear India*
Buy
537
622
1,238
1,888
1,680
12.1
11.9
62.2
56.6
8.6
9.5
2.0
1.7
25.9
19.7
0.4
0.4
Hitachi
Neutral
1,182
-
3,215
1,779
2,081
7.8
8.8
21.8
33.4
54.2
35.4
8.8
7.1
17.4
22.1
1.9
1.6
Jyothy Laboratories
Neutral
306
-
5,537
1,620
1,847
11.5
11.5
7.3
8.5
41.9
36.1
5.4
5.0
13.3
14.4
3.3
2.8
MRF
Buy
39,033
45,575
16,554
20,316
14,488
21.4
21.1
5,488.0
3,798.0
7.1
10.3
2.4
2.0
41.1
21.2
0.8
1.0
Page Industries
Neutral
13,286
-
14,819
1,929
2,450
19.8
20.1
229.9
299.0
57.8
44.4
25.5
17.7
52.1
47.1
7.7
6.1
Relaxo Footwears
Neutral
489
-
5,870
1,767
2,152
12.3
12.5
19.3
25.1
25.4
19.5
6.2
4.8
27.7
27.8
3.4
2.7
Siyaram Silk Mills
Accumulate
1,184
1,354
1,110
1,636
1,815
11.5
11.5
89.9
104.1
13.2
11.4
2.2
1.9
17.9
17.8
0.8
0.7
Styrolution ABS India*
Neutral
727
-
1,278
1,271
1,440
8.6
9.2
32.0
41.1
22.7
17.7
2.3
2.1
10.7
12.4
1.0
0.8
TVS Srichakra
Buy
2,735
3,240
2,094
2,101
2,338
15.7
15.0
248.6
270.0
11.0
10.1
4.8
3.5
43.6
34.0
1.0
0.9
Stock Watch
January 12, 2016
Company Name
Reco
CMP
Target
Mkt Cap
Sales ( Čcr )
OPM(%)
EPS (Č)
PER(x)
P/BV(x)
RoE(%)
EV/Sales(x)
(Č)
Price ( Č)
( Č cr )
FY16E
FY17E
FY16E
FY17E
FY16E
FY17E
FY16E
FY17E
FY16E
FY17E
FY16E
FY17E
FY16E
FY17E
zOthers
HSIL
Neutral
291
-
2,106
2,123
2,384
16.1
16.5
15.0
18.9
19.4
15.4
1.5
1.4
8.0
9.4
1.3
1.2
Kirloskar Engines India
Neutral
246
-
3,564
2,471
2,826
8.8
10.4
9.1
13.3
27.0
18.5
2.6
2.4
9.7
13.4
1.1
0.9
Ltd
M M Forgings
Accumulate
543
614
655
511
615
21.7
21.6
43.1
55.8
12.6
9.7
2.3
1.9
19.9
21.2
1.5
1.1
Banco Products (India) Neutral
143
-
1,020
1,208
1,353
11.0
12.3
10.8
14.5
13.2
9.9
1.5
1.4
11.9
14.5
0.8
0.7
Competent Automobiles Neutral
152
-
94
1,040
1,137
3.2
3.1
25.7
28.0
5.9
5.4
0.9
0.8
15.0
14.3
0.1
0.1
Nilkamal
Neutral
1,473
-
2,198
1,910
2,083
10.5
10.3
63.3
69.2
23.3
21.3
3.8
3.3
17.6
16.5
1.2
1.1
Visaka Industries
Buy
118
144
188
1,086
1,197
9.9
10.3
21.5
28.8
5.5
4.1
0.5
0.5
9.6
11.6
0.4
0.3
Transport Corporation of
Neutral
292
-
2,219
2,830
3,350
8.8
9.0
14.4
18.3
20.3
15.9
3.1
2.7
15.4
17.1
0.9
0.8
India
Elecon Engineering
Accumulate
77
85
836
1,369
1,533
13.7
14.9
3.3
6.1
23.1
12.7
1.5
1.4
6.6
11.4
1.0
0.8
Surya Roshni
Buy
168
201
735
2,992
3,223
8.1
8.4
14.7
18.3
11.4
9.2
1.1
1.0
9.7
11.0
0.5
0.5
MT Educare
Neutral
190
-
758
286
366
18.3
17.7
7.7
9.4
24.7
20.3
5.2
4.6
20.2
21.1
2.6
1.9
Radico Khaitan
Buy
121
156
1,614
1,565
1,687
12.2
13.0
5.7
7.1
21.3
17.1
1.8
1.6
8.3
9.6
1.5
1.4
Garware Wall Ropes
Buy
399
473
872
862
974
11.2
11.2
24.9
29.6
16.0
13.5
2.4
2.1
15.1
15.4
1.0
0.9
Wonderla Holidays
Neutral
391
-
2,210
206
308
44.0
43.6
9.0
12.9
43.5
30.3
5.9
5.4
13.7
17.8
10.6
7.1
Linc Pen & Plastics
Neutral
235
-
347
340
371
8.3
8.9
10.8
13.2
21.7
17.8
3.5
3.0
16.0
17.1
1.1
1.0
The Byke Hospitality
Neutral
153
-
615
222
287
20.5
20.5
5.6
7.6
27.2
20.3
5.1
4.2
18.9
20.8
2.8
2.2
Interglobe Aviation
Neutral
1,238
-
44,618
17,022
21,122
20.7
14.5
63.9
53.7
19.4
23.1
29.0
23.8
149.9
103.2
2.7
2.1
Coffee Day Enterprises
Neutral
268
-
5,516
2,692
2,964
17.0
18.6
-
4.7
-
56.5
3.3
3.1
0.2
5.5
2.4
2.3
Ltd
Navneet Education
Accumulate
92
97
2,180
998
1,062
24.1
24.0
5.8
6.1
15.9
15.0
3.5
3.1
22.0
20.6
2.3
2.1
Navkar Corporation
Buy
202
265
2,886
365
436
38.3
37.5
5.6
5.9
35.9
34.4
2.3
2.1
6.3
6.1
8.7
7.5
Source: Company, Angel Research; Note: *December year end; #September year end; &October year end; Price as on January 11, 2016
Market Outlook
January 12, 2016
Research Team Tel: 022 - 39357800
DISCLAIMER
Angel Broking Private Limited (hereinafter referred to as “Angel”) is a registered Member of National Stock Exchange of India Limited,
Bombay Stock Exchange Limited and Metropolitian Stock Exchange of India Limited. It is also registered as a Depository Participant with
CDSL and Portfolio Manager with SEBI. It also has registration with AMFI as a Mutual Fund Distributor. Angel Broking Private Limited is a
registered entity with SEBI for Research Analyst in terms of SEBI (Research Analyst) Regulations, 2014 vide registration number
INH000000164. Angel or its associates has not been debarred/ suspended by SEBI or any other regulatory authority for accessing
/dealing in securities Market. Angel or its associates including its relatives/analyst do not hold any financial interest/beneficial ownership
of more than 1% in the company covered by Analyst. Angel or its associates/analyst has not received any compensation / managed or co
-managed public offering of securities of the company covered by Analyst during the past twelve months. Angel/analyst has not served as
an officer, director or employee of company covered by Analyst and has not been engaged in market making activity of the company
covered by Analyst.
This document is solely for the personal information of the recipient, and must not be singularly used as the basis of any investment
decision. Nothing in this document should be construed as investment or financial advice. Each recipient of this document should make
such investigations as they deem necessary to arrive at an independent evaluation of an investment in the securities of the companies
referred to in this document (including the merits and risks involved), and should consult their own advisors to determine the merits and
risks of such an investment.
Reports based on technical and derivative analysis center on studying charts of a stock's price movement, outstanding positions and
trading volume, as opposed to focusing on a company's fundamentals and, as such, may not match with a report on a company's
fundamentals.
The information in this document has been printed on the basis of publicly available information, internal data and other reliable sources
believed to be true, but we do not represent that it is accurate or complete and it should not be relied on as such, as this document is for
general guidance only. Angel Broking Pvt. Limited or any of its affiliates/ group companies shall not be in any way responsible for any
loss or damage that may arise to any person from any inadvertent error in the information contained in this report. Angel Broking Pvt.
Limited has not independently verified all the information contained within this document. Accordingly, we cannot testify, nor make any
representation or warranty, express or implied, to the accuracy, contents or data contained within this document. While Angel Broking
Pvt. Limited endeavors to update on a reasonable basis the information discussed in this material, there may be regulatory, compliance,
or other reasons that prevent us from doing so.
This document is being supplied to you solely for your information, and its contents, information or data may not be reproduced,
redistributed or passed on, directly or indirectly.
Neither Angel Broking Pvt. Limited, nor its directors, employees or affiliates shall be liable for any loss or damage that may arise from or
in connection with the use of this information.
Note: Please refer to the important ‘Stock Holding Disclosure' report on the Angel website (Research Section). Also, please refer to the
latest update on respective stocks for the disclosure status in respect of those stocks. Angel Broking Pvt. Limited and its affiliates may have
investment positions in the stocks recommended in this report.