Market Outlook
December 11, 2015
Market Cues
Domestic Indices
Chg (%)
(Pts)
(Close)
Indian markets are expected to open on a Flat note tracking the SGX Nifty and most
BSE Sensex
0.9
216
25,252
Global markets.
Nifty
0.9
71
7,683
US Markets ended Thursday's trading on a marginally positive note on bargain
Mid Cap
0.9
95
10,702
hunting. However, continued decline in commodity prices restricted the upwards
Small Cap
1.2
138
11,304
move.
Bankex
0.1
26
19,080
The European markets ended Thursday's session on a mixed note. The markets
awaited announcements from both the Bank of England and the Swiss National
Global Indices
Chg (%)
(Pts)
(Close)
Bank and along expected lines; the key rates were left unchanged.
Dow Jones
0.5
82
17,575
Indian shares rebounded from three-month lows on optimism of crucial reform bills
Nasdaq
0.4
22
5,045
being cleared in the winter session of Parliament. Short covering rally may have
contributed to the positive closing.
FTSE
(0.6)
(39)
6,088
Nikkei
(1.3)
(255)
19,047
News & Result Analysis
Hang Seng
(0.5)
(99)
21,705
RBI announces timetable reduction in SLR
Shanghai Com
(0.5)
(17)
3,455
Maruti to hike prices across models by up to `20,000 from Jan
Detailed analysis on Pg2
Advances / Declines
BSE
NSE
Investor’s Ready Reckoner
Advances
1,851
1,117
Key Domestic & Global Indicators
Declines
842
418
Stock Watch: Latest investment recommendations on 150+ stocks
Unchanged
171
66
Refer P4 onwards
Top Picks
Volumes (` Cr)
CMP
Target
Upside
Company
Sector
Rating
BSE
2,467
(`)
(`)
(%)
NSE
14,934
Axis Bank
Financials
Buy
450
630
40.0
HCL Tech
IT
Buy
846
1,132
33.8
ICICI Bank
Financials
Buy
259
354
36.9
Net Inflows (` Cr)
Net
Mtd
Ytd
Ashok Leyland
Automobiles
Buy
89
111
24.6
FII
(452)
(3,185)
(25,634)
Larsen & Toubro
Construction
Buy
1,311
1,646
25.6
MFs
148
1,271
58,166
More Top Picks on Pg3
Top Gainers
Price (`)
Chg (%)
Key Upcoming Events
Previous
Consensus
Bhusanstl
46
8.1
Date
Region
Event Description
Reading
Expectations
Hcc
25
8.1
Dec 11
India
Industrial Production YoY
3.60
-
Havells
305
8.1
Dec 12
China
Industrial Production (YoY)
5.60
5.70
Frl
159
7.6
Dec 14
India
Monthly Wholesale Prices YoY%
(3.81)
-
Sci
89
7.5
Dec 15
US
Consumer price index (mom)
0.20
-
Top Losers
Price (`)
Chg (%)
Pmcfin
1
(8.7)
Gppl
146
(4.9)
Unionbank
150
(4.7)
Pvr
755
(3.4)
Srtransfin
825
(3.2)
As on December 10, 2015
Market Outlook
December 11, 2015
RBI announces timetable reduction in SLR
The Reserve Bank of India (RBI) has announced a reduction in the share of
government securities that banks have to mandatorily hold in their books in four
equal phases starting from next fiscal year.
The bank's investment in government securities known as Statutory Liquidity Ratio
(SLR) would be lowered to 20.5% by January 2017. As of now, banks are
mandated to invest 21.5% of their deposits in government securities.
According to the new time table, SLR would be reduced to by 25 basis points to
21.25% as on April 2, 2016. It would fall to 21% by July 9, 2016. It would further
be lowered from October 1, 2016 to 20.75%. The RBI said that the last round of
reduction in the SLR would be one 20.50% by January 1, 2017.
As of now, most banks have excess SLR in their books than mandated by RBI. As
per the RBI data, the banking system has 29.33% of SLR as on October 30, 2015.
The excess investment in government securities is primarily due to absence of
credit demand. Also, most banks hold 2-3% excess SLR to meet any unexpected
liquidity shortage.
Maruti to hike prices across models by up to `20,000 from Jan
After its Rival Hyundai Motor India announced that it would hike prices of its
products by up to `30,000 from next month, Maruti Suzuki India has followed up
by announcing that it will hike prices of its vehicles across models by up to
`20,000 from January. The company said that the price increase has been
necessitated on account of increase in costs due to, weakening of rupee against
dollar, rise in administrative and other costs. Toyota too had announced a price
hike recently. Currently, we have a Neutral rating on the stock.
Economic and Political News
Centre may form panel to review national policy on farmers
Govt to auction 9 coal blocks in fourth round
COAI, AUSPI move Delhi HC seeking stay on Trai's compensation policy
Corporate News
Steel firms allege safeguard duty being bypassed
Siemens bags `102cr order from WBSETCL
NBCC bags `188cr contract from Tourism Ministry
Market Outlook
December 11, 2015
Top Picks ★★★★★
Large Cap
Market Cap
CMP
Target
Upside
Company
Rationale
(` Cr)
(`)
(`)
(%)
To outpace battery industry growth due to better technological
Amara Raja Batteries
14,398
843
1,040
23.4
products leading to market share gains in both the automotive
OEM and replacement segments.
Earnings to grow strongly given the MHCV cyclical upturn.
Ashok Leyland
25,343
89
111
24.6
Focus on exports and LCV's provides additional growth
avenue.
Healthy pace of branch expansion, backed by distribution
Axis Bank
1,06,979
450
630
40.0
network, will be the driving force for the bank’s retail business
and overall earnings.
The stock is trading at attractive valuations and is factoring all
HCL Tech
1,19,184
846
1,132
33.8
the bad news.
Strong visibility for a robust 20% earnings trajectory, coupled
HDFC Bank
2,67,589
1,061
1,262
19.0
with high quality of earnings on account of high quality retail
business and strategic focus on highly rated corporates.
Due to its robust franchise and capital adequacy position, the
bank is well positioned to grow by at least a few percentage
ICICI Bank
1,50,325
259
354
36.9
points higher than the average industry growth rate from a
structural point of view.
Back on the growth trend, expect a long term growth of 14%
Infosys
2,40,352
1,046
1,306
24.8
to be a US$20bn in FY2020.
Well positioned to benefit from such expected gradual
recovery in the overall domestic capex cycle, given its presence
Larsen & Toubro
1,22,036
1,311
1,646
25.6
across various infrastructure segments, its execution
capabilities, and its strong balance sheet.
LICHF continues to grow its retail loan book at a healthy pace
with improvement in asset quality. We expect the company to
LIC Housing Finance
23,419
464
571
23.0
post a healthy loan book which is likely to reflect in a strong
earnings growth.
Source: Company, Angel Research
Mid Cap
Market Cap
CMP
Target
Upside
Company
Rationale
(` Cr)
(`)
(`)
(%)
Favourable outlook for the AC industry to augur well for
Cooling products business which is out pacing the market
Blue Star
3,187
354
429
21.0
growth. EMPPAC division's profitability to improve once
operating environment turns around.
Change in business focus towards high-margin chronic &
Ipca labs
9,584
760
900
18.5
lifestyle segments and increasing penetration in Europe and
US
Economic recovery to have favourable impact on advertising &
circulation revenue growth. Further, the acquisition of a radio
Jagran Prakashan
5,046
154
169
9.5
business (Radio City) would also boost the company's revenue
growth.
Strong brand & quality teaching with innovative technologies &
MT Educare
549
138
169
22.5
higher government educational spending to boost growth
Earnings boost on back of stable material prices and
Radico Khaitan
1,420
107
156
46.2
favourable pricing environment. Valuation discount to peers
provides additional comfort
Strong brands and distribution network would boost growth
Siyaram Silk Mills
1,070
1,141
1,354
18.6
going ahead. Stock currently trades at an inexpensive
valuation.
Structural shift in the Lighting industry towards LED lighting will
Surya Roshni
592
135
183
35.4
drive growth.
Source: Company, Angel Research
Market Outlook
December 11, 2015
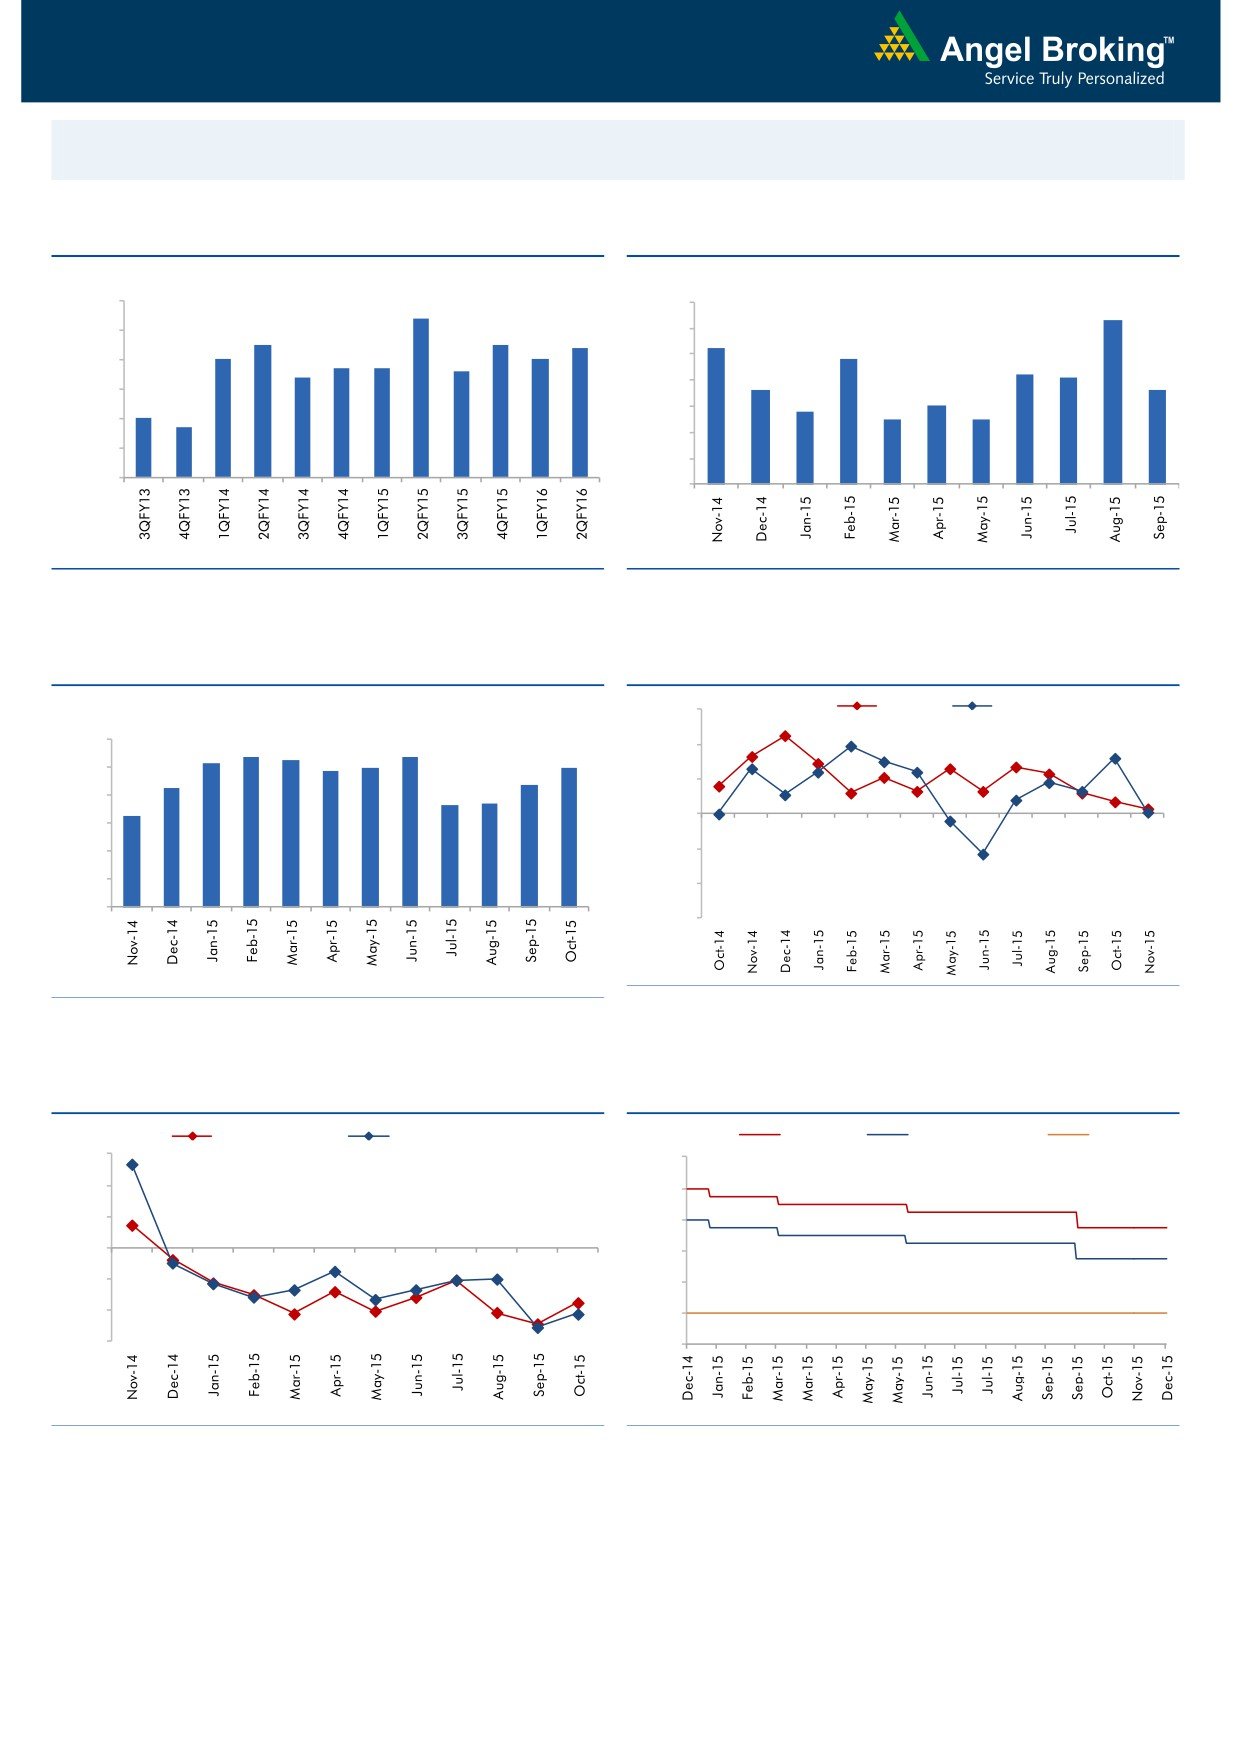
Macro watch
Exhibit 1: Quarterly GDP trends
Exhibit 2: IIP trends
(%)
(%)
9.0
8.4
7.0
6.3
8.0
7.5
7.5
7.4
6.0
5.2
7.0
7.0
4.8
6.7
6.7
6.6
5.0
7.0
6.4
4.2
4.1
3.6
3.6
4.0
6.0
2.8
3.0
5.0
3.0
2.5
2.5
4.7
5.0
2.0
4.0
1.0
3.0
-
Source: CSO, Angel Research
Source: MOSPI, Angel Research
Exhibit 3: Monthly CPI inflation trends
Exhibit 4: Manufacturing and services PMI
(%)
56.0
Mfg. PMI
Services PMI
6.0
5.4
5.3
5.4
54.0
5.2
5.0
5.0
4.9
5.0
4.3
4.4
52.0
3.7
3.7
4.0
3.3
50.0
3.0
2.0
48.0
1.0
46.0
-
44.0
Source: Market, Angel Research; Note: Level above 50 indicates expansion
Source: MOSPI, Angel Research
Exhibit 5: Exports and imports growth trends
Exhibit 6: Key policy rates
(%)
Exports yoy growth
Imports yoy growth
(%)
Repo rate
Reverse Repo rate
CRR
30.0
9.00
20.0
8.00
10.0
7.00
0.0
6.00
(10.0)
5.00
(20.0)
4.00
(30.0)
3.00
Source: Bloomberg, Angel Research
Source: RBI, Angel Research
Market Outlook
December 11, 2015
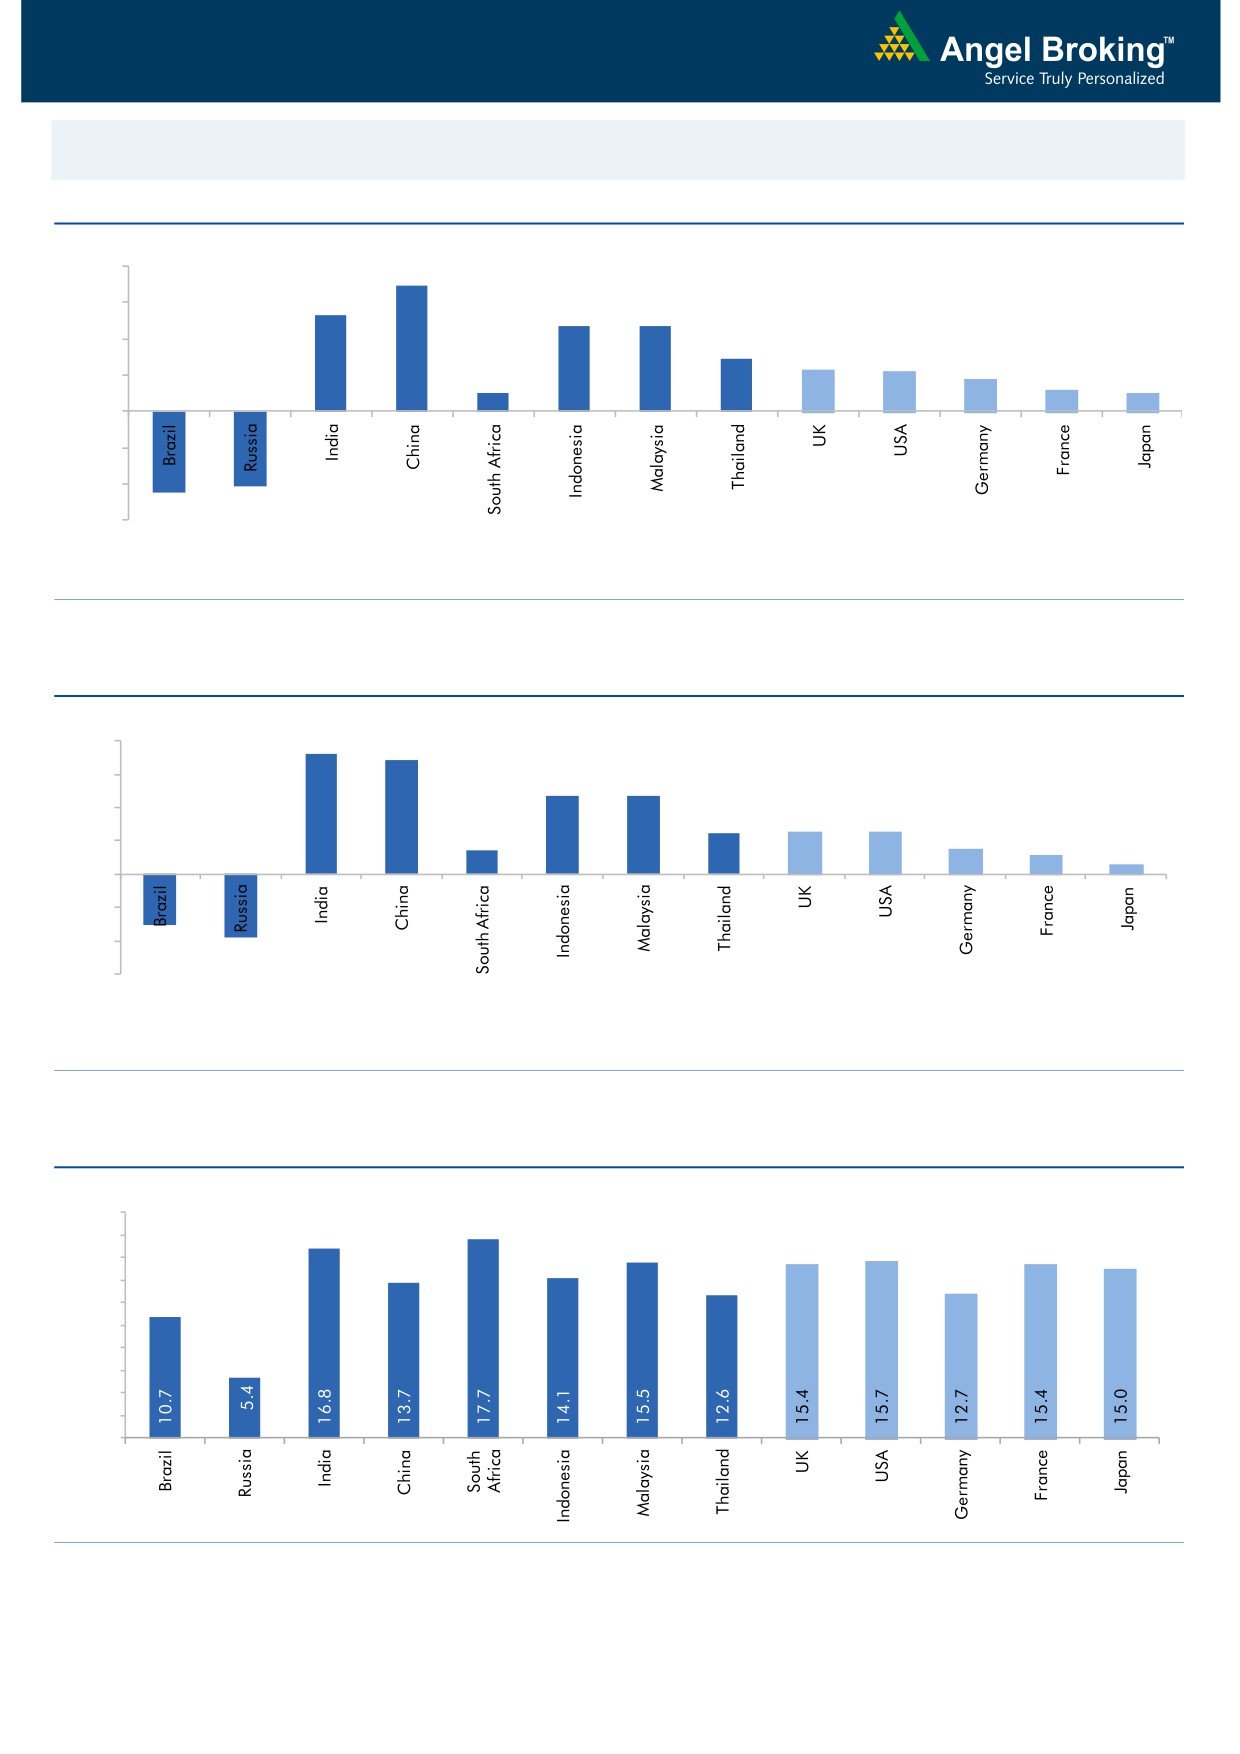
Global watch
Exhibit 1: Latest quarterly GDP Growth (%, yoy) across select developing and developed countries
(%)
8.0
6.9
5.3
6.0
4.7
4.7
4.0
2.9
2.3
2.2
1.8
2.0
1.0
1.2
1.0
-
(2.0)
(4.0)
(4.1)
(4.5)
(6.0)
Source: Bloomberg, Angel Research
Exhibit 2: 2015 GDP Growth projection by IMF (%, yoy) across select developing and developed countries
(%)
7.3
8.0
6.8
6.0
4.7
4.7
4.0
2.5
2.5
2.6
1.4
1.5
2.0
1.2
0.6
-
(2.0)
(4.0)
(3.0)
(3.8)
(6.0)
Source: IMF, Angel Research
Exhibit 3: One year forward P-E ratio across select developing and developed countries
(x)
20.0
18.0
16.0
14.0
12.0
10.0
8.0
6.0
4.0
2.0
-
Source: IMF, Angel Research
Market Outlook
December 11, 2015
Exhibit 4: Relative performance of indices across globe
Returns (%)
Country
Name of index
Closing price
1M
3M
1YR
Brazil
Bovespa
45,631
(1.2)
(2.4)
(12.8)
Russia
Micex
1,733
(0.8)
0.8
17.5
India
Nifty
7,683
(3.4)
(1.8)
(10.0)
China
Shanghai Composite
3,455
(5.9)
11.5
24.2
South Africa
Top 40
44,251
(6.3)
0.5
3.1
Mexico
Mexbol
42,448
(4.6)
(1.5)
0.3
Indonesia
LQ45
767
(0.1)
5.6
(13.8)
Malaysia
KLCI
1,649
(2.2)
4.2
(5.6)
Thailand
SET 50
831
(9.1)
(7.4)
(22.3)
USA
Dow Jones
17,575
(0.9)
7.6
(0.1)
UK
FTSE
6,088
(3.0)
(0.5)
(3.4)
Japan
Nikkei
19,047
(3.0)
4.8
8.3
Germany
DAX
10,599
(2.2)
4.7
7.5
France
CAC
4,635
(5.6)
1.9
13.2
Source: Bloomberg, Angel Research
Stock Watch
December 11, 2015
Company Name
Reco
CMP
Target
Mkt Cap
Sales ( Čcr )
OPM(%)
EPS (Č)
PER(x)
P/BV(x)
RoE(%)
EV/Sales(x)
(Č)
Price ( Č)
( Č cr )
FY16E FY17E
FY16E
FY17E
FY16E
FY17E
FY16E
FY17E
FY16E
FY17E
FY16E
FY17E
FY16E
FY17E
Agri / Agri Chemical
Rallis
Neutral
166
-
3,227
2,075
2,394
14.4
14.4
9.5
11.0
17.5
15.1
3.5
3.0
21.1
21.3
1.6
1.4
United Phosphorus
Buy
408
510
17,491
13,698
15,752
17.6
17.6
32.1
38.5
12.7
10.6
2.5
2.1
21.4
21.3
1.4
1.1
Auto & Auto Ancillary
Ashok Leyland
Buy
89
111
25,343
17,995
21,544
11.4
11.6
3.4
4.7
26.2
19.0
4.6
4.2
17.7
22.2
1.4
1.1
Bajaj Auto
Accumulate
2,441
2,728
70,648
23,695
27,298
21.3
20.4
134.6
151.5
18.1
16.1
5.8
4.9
31.8
30.6
2.5
2.2
Bharat Forge
Buy
803
943
18,699
7,867
8,881
20.0
20.3
34.4
41.0
23.4
19.6
4.5
3.8
21.1
20.9
2.5
2.2
Eicher Motors
Buy
16,035
19,036
43,542
15,379
16,498
15.6
16.6
473.2
574.8
33.9
27.9
12.5
9.3
36.7
33.2
2.8
2.5
Hero Motocorp
Accumulate
2,546
2,774
50,832
28,561
31,559
14.7
14.7
151.1
163.2
16.9
15.6
6.5
5.6
38.7
35.6
1.6
1.4
Jamna Auto Industries Neutral
123
-
983
1,292
1,486
9.3
9.8
6.0
7.5
20.5
16.4
4.3
3.6
20.7
21.8
0.8
0.7
L G Balakrishnan & Bros Neutral
509
-
799
1,254
1,394
11.6
11.8
35.9
41.7
14.2
12.2
1.9
1.7
13.5
13.8
0.7
0.7
Mahindra and Mahindra Accumulate
1,291
1,449
80,186
39,031
44,440
13.8
13.9
57.9
67.6
22.3
19.1
3.6
3.2
16.1
16.6
1.7
1.4
Maruti
Neutral
4,497
-
135,836
57,865
68,104
16.4
16.7
176.3
225.5
25.5
19.9
5.0
4.2
19.4
21.2
2.1
1.7
Minda Industries
Neutral
849
-
1,347
2,567
2,965
8.0
8.3
46.1
57.8
18.4
14.7
3.1
2.5
16.7
17.3
0.6
0.5
Motherson Sumi
Accumulate
280
313
37,096
39,343
45,100
8.8
9.1
10.1
12.5
27.8
22.4
8.8
6.9
35.3
34.4
1.0
0.9
Rane Brake Lining
Accumulate
340
366
269
454
511
11.1
11.4
23.8
28.1
14.3
12.1
2.0
1.8
14.2
15.3
0.7
0.7
Setco Automotive
Neutral
225
-
601
594
741
12.7
13.7
8.4
15.8
26.8
14.2
2.8
2.4
10.4
16.9
1.5
1.2
Tata Motors
Neutral
389
-
112,399
255,254
301,772
12.9
13.4
23.7
37.3
16.4
10.4
2.0
1.7
7.4
12.1
0.6
0.6
TVS Motor
Buy
279
338
13,234
11,569
13,648
7.3
8.7
10.3
16.1
27.0
17.3
6.7
5.3
24.8
30.5
1.1
0.9
Amara Raja Batteries
Buy
843
1,040
14,398
4,892
5,871
17.4
17.6
28.8
37.1
29.3
22.7
6.8
5.5
23.4
24.1
2.9
2.4
Exide Industries
Buy
140
162
11,862
6,950
7,784
14.4
14.8
6.6
7.3
21.1
19.1
2.7
2.4
12.6
12.8
1.4
1.3
Apollo Tyres
Accumulate
151
171
7,702
12,146
12,689
16.8
16.0
21.2
19.0
7.1
8.0
1.2
1.0
16.5
13.0
0.7
0.8
Ceat
Accumulate
1,018
1,119
4,120
6,041
6,597
14.1
13.7
99.5
111.9
10.2
9.1
2.0
1.7
19.6
18.5
0.8
0.7
JK Tyres
Neutral
107
-
2,418
7,446
7,669
15.2
14.0
19.6
18.4
5.4
5.8
1.4
1.1
25.2
19.5
0.7
0.6
Swaraj Engines
Neutral
895
-
1,111
552
630
14.2
14.7
44.6
54.1
20.1
16.5
4.7
4.2
23.2
25.6
1.9
1.6
Subros
Neutral
93
-
559
1,268
1,488
11.6
11.9
3.7
6.6
25.2
14.1
1.7
1.5
6.8
11.4
0.7
0.6
Indag Rubber
Neutral
214
-
562
283
329
17.0
17.2
13.0
15.4
16.5
13.9
3.6
3.0
21.8
21.6
1.7
1.4
Capital Goods
ACE
Neutral
41
-
410
660
839
4.7
8.2
1.0
3.9
41.5
10.6
1.3
1.2
3.2
11.3
0.8
0.6
BEML
Neutral
1,067
-
4,445
3,277
4,006
6.0
8.9
29.2
64.3
36.6
16.6
2.0
1.9
5.7
11.7
1.4
1.1
BGR Energy
Neutral
114
-
823
3,615
3,181
9.5
9.4
16.7
12.4
6.8
9.2
0.6
0.6
10.0
7.0
0.6
0.8
BHEL
Neutral
168
-
41,010
33,722
35,272
10.8
11.7
10.5
14.2
16.0
11.8
1.2
1.1
7.0
9.0
1.3
1.2
Stock Watch
December 11, 2015
Company Name
Reco
CMP
Target
Mkt Cap
Sales ( Čcr )
OPM(%)
EPS (Č)
PER(x)
P/BV(x)
RoE(%)
EV/Sales(x)
(Č)
Price ( Č)
( Č cr )
FY16E
FY17E
FY16E
FY17E
FY16E
FY17E
FY16E
FY17E
FY16E
FY17E
FY16E
FY17E
FY16E
FY17E
Capital Goods
Blue Star
Buy
354
429
3,187
3,548
3,977
6.3
6.9
13.7
17.2
25.9
20.7
6.5
4.2
26.1
25.4
1.0
0.8
Crompton Greaves
Accumulate
189
204
11,836
13,484
14,687
4.9
6.2
4.5
7.1
42.0
26.6
3.0
2.8
7.2
10.8
1.0
0.9
Inox Wind
Buy
350
505
7,770
4,980
5,943
17.0
17.5
26.6
31.6
13.2
11.1
3.9
2.9
35.0
30.0
1.7
1.4
KEC International
Neutral
150
-
3,863
8,791
9,716
6.1
6.8
5.4
8.2
27.8
18.3
2.8
2.6
10.0
14.0
0.7
0.6
Thermax
Neutral
905
-
10,780
6,413
7,525
7.4
8.5
30.5
39.3
29.7
23.0
4.6
4.0
15.0
17.0
1.7
1.4
Cement
ACC
Buy
1,324
1,630
24,861
13,151
14,757
16.4
18.3
63.9
83.4
20.7
15.9
2.7
2.5
13.3
16.1
1.7
1.5
Ambuja Cements
Buy
190
233
29,447
11,564
12,556
19.4
20.7
8.9
10.1
21.3
18.8
2.7
2.5
12.8
13.8
2.2
2.0
HeidelbergCement
Neutral
72
-
1,638
1,772
1,926
13.3
15.4
1.0
3.0
72.3
24.1
1.8
1.7
2.6
7.9
1.5
1.3
India Cements
Buy
82
112
2,520
4,216
4,840
18.0
19.5
4.0
9.9
20.5
8.3
0.8
0.8
4.0
9.5
0.9
0.7
JK Cement
Buy
645
744
4,511
3,661
4,742
10.1
15.8
18.0
61.0
35.9
10.6
2.6
2.3
7.5
22.9
1.7
1.3
J K Lakshmi Cement
Buy
323
430
3,799
2,947
3,616
16.7
19.9
11.5
27.2
28.1
11.9
2.7
2.3
9.8
20.8
1.7
1.4
Mangalam Cements
Neutral
203
-
542
1,053
1,347
10.5
13.3
8.4
26.0
24.2
7.8
1.0
0.9
4.3
12.5
0.9
0.7
Orient Cement
Buy
157
183
3,217
1,854
2,524
21.2
22.2
7.7
11.1
20.4
14.2
2.9
2.5
13.3
15.7
2.5
1.7
Ramco Cements
Neutral
370
-
8,797
4,036
4,545
20.8
21.3
15.1
18.8
24.5
19.7
3.0
2.7
12.9
14.3
2.7
2.3
Shree Cement^
Neutral
10,631
-
37,035
7,150
8,742
26.7
28.6
228.0
345.5
46.6
30.8
6.9
5.8
15.7
20.3
4.9
4.0
UltraTech Cement
Buy
2,814
3,282
77,216
25,021
30,023
19.1
21.6
89.0
132.0
31.6
21.3
3.7
3.2
12.2
15.9
3.1
2.6
Construction
ITNL
Neutral
78
-
2,571
7,360
8,825
34.0
35.9
7.0
9.0
11.2
8.7
0.4
0.4
3.2
3.7
3.7
3.6
KNR Constructions
Accumulate
599
673
1,683
937
1,470
14.3
14.0
33.5
38.6
17.9
15.5
2.7
2.3
15.4
15.4
1.9
1.2
Larsen & Toubro
Buy
1,311
1,646
122,036
65,065
77,009
11.5
11.7
61.5
65.6
21.3
20.0
2.2
2.0
13.4
14.0
2.1
1.8
Gujarat Pipavav Port
Neutral
146
-
7,078
629
684
51.0
52.2
6.4
5.9
22.9
24.8
3.0
2.8
15.9
12.7
10.9
9.8
MBL Infrastructures
Buy
208
285
861
2,313
2,797
12.2
14.6
19.0
20.0
10.9
10.4
1.1
1.1
11.3
10.6
1.1
1.0
Nagarjuna Const.
Neutral
75
-
4,164
7,892
8,842
8.8
9.1
3.0
5.3
25.0
14.1
1.3
1.2
5.0
8.5
0.8
0.6
PNC Infratech
Accumulate
530
558
2,719
1,873
2,288
13.2
13.5
24.0
32.0
22.1
16.6
2.2
1.9
12.1
12.3
1.6
1.3
Simplex Infra
Neutral
326
-
1,611
5,955
6,829
10.3
10.5
16.0
31.0
20.4
10.5
1.1
1.0
5.3
9.9
0.8
0.7
Power Mech Projects
Neutral
613
-
902
1,539
1,801
12.8
12.7
59.0
72.1
10.4
8.5
1.6
1.3
18.6
16.8
0.6
0.5
Sadbhav Engineering
Neutral
319
-
5,475
3,481
4,219
10.7
10.8
8.0
12.0
39.9
26.6
3.7
3.3
10.3
13.5
1.8
1.5
NBCC
Buy
944
1,089
11,328
7,382
9,506
7.7
8.6
39.8
54.4
23.7
17.4
5.7
4.5
26.7
29.1
1.3
1.0
SIPL
Neutral
98
-
3,452
675
1,042
62.4
64.7
-
-
3.7
4.2
-
-
16.8
11.3
Financials
Allahabad Bank
Neutral
69
-
4,135
8,569
9,392
2.8
2.9
16.3
27.5
4.2
2.5
0.4
0.3
7.6
11.9
-
-
Stock Watch
December 11, 2015
Company Name
Reco
CMP
Target
Mkt Cap
Sales ( Čcr )
OPM(%)
EPS (Č)
PER(x)
P/BV(x)
RoE(%)
EV/Sales(x)
(Č)
Price ( Č)
( Č cr )
FY16E
FY17E
FY16E
FY17E
FY16E
FY17E
FY16E
FY17E
FY16E
FY17E
FY16E
FY17E
FY16E
FY17E
Financials
Axis Bank
Buy
450
630
106,979
26,473
31,527
3.5
3.6
35.7
43.5
12.6
10.3
2.4
2.1
17.9
18.9
-
-
Bank of Baroda
Neutral
159
-
36,705
18,485
21,025
1.9
2.0
13.5
21.1
11.8
7.5
0.9
0.8
7.3
10.6
-
-
Bank of India
Neutral
117
-
9,269
15,972
17,271
1.9
2.0
15.3
33.4
7.7
3.5
0.3
0.3
3.6
7.6
-
-
Canara Bank
Neutral
246
-
13,355
15,441
16,945
2.0
2.1
46.6
70.4
5.3
3.5
0.5
0.4
8.0
11.2
-
-
Dena Bank
Neutral
41
-
2,646
3,440
3,840
2.1
2.3
7.3
10.0
5.7
4.1
0.4
0.4
6.1
7.9
-
-
Federal Bank
Neutral
55
-
9,523
3,477
3,999
3.0
3.0
5.0
6.2
11.1
8.9
1.1
1.0
10.6
11.9
-
-
HDFC
Neutral
1,181
-
186,392
10,358
11,852
3.3
3.3
41.1
47.0
28.8
25.1
5.5
5.0
24.7
24.9
-
-
HDFC Bank
Buy
1,061
1,262
267,589
38,309
47,302
4.3
4.3
49.3
61.1
21.5
17.4
3.7
3.2
18.5
19.7
-
-
ICICI Bank
Buy
259
354
150,325
34,279
39,262
3.3
3.3
21.0
24.4
12.3
10.6
2.1
1.8
14.4
14.7
-
-
IDBI Bank
Neutral
85
-
13,634
9,625
10,455
1.8
1.8
8.5
14.2
10.0
6.0
0.6
0.6
5.9
9.3
-
-
Indian Bank
Neutral
122
-
5,852
6,160
6,858
2.5
2.5
24.5
29.8
5.0
4.1
0.4
0.4
7.7
8.6
-
-
LIC Housing Finance
Buy
464
571
23,419
3,101
3,745
2.5
2.5
33.0
40.2
14.1
11.6
2.6
2.2
19.7
20.5
-
-
Oriental Bank
Neutral
135
-
4,054
7,643
8,373
2.4
2.4
37.2
45.4
3.6
3.0
0.3
0.3
8.2
9.4
-
-
Punjab Natl.Bank
Neutral
130
-
25,429
23,638
26,557
2.8
2.8
17.9
27.2
7.2
4.8
0.7
0.6
8.5
12.0
-
-
South Ind.Bank
Neutral
19
-
2,592
1,965
2,185
2.5
2.5
2.5
3.3
7.7
5.8
0.8
0.7
9.5
11.7
-
-
St Bk of India
Buy
232
283
180,058
82,520
93,299
2.7
2.8
20.0
24.5
11.6
9.5
1.3
1.1
11.5
12.8
-
-
Union Bank
Neutral
150
-
10,294
12,646
14,129
2.3
2.4
31.0
39.1
4.8
3.8
0.5
0.4
9.8
11.4
-
-
Vijaya Bank
Neutral
34
-
2,908
3,536
3,827
1.9
1.9
5.5
6.7
6.1
5.1
0.5
0.5
7.8
8.8
-
-
Yes Bank
Buy
707
921
29,637
7,190
9,011
3.2
3.3
58.2
69.7
12.1
10.2
2.2
1.8
19.2
19.6
-
-
FMCG
Asian Paints
Neutral
859
-
82,390
16,553
19,160
16.0
16.2
17.7
21.5
48.6
40.0
12.9
11.6
29.4
31.2
4.8
4.2
Britannia
Neutral
2,865
-
34,368
8,065
9,395
9.6
10.2
47.2
65.5
60.7
43.7
20.2
19.1
38.3
41.2
4.1
3.5
Colgate
Neutral
976
-
26,542
4,836
5,490
19.5
19.7
48.5
53.2
20.1
18.3
14.8
12.8
99.8
97.5
5.4
4.7
Dabur India
Neutral
270
-
47,418
9,370
10,265
17.1
17.2
7.3
8.1
36.8
33.3
11.1
9.0
33.7
30.6
5.0
4.5
GlaxoSmith Con*
Neutral
6,195
-
26,052
4,919
5,742
17.2
17.4
168.3
191.2
36.8
32.4
10.4
8.9
28.8
28.9
4.9
4.1
Godrej Consumer
Neutral
1,242
-
42,287
10,168
12,886
16.1
16.1
32.1
38.4
38.7
32.3
7.9
7.3
19.7
21.0
4.3
3.3
HUL
Neutral
816
-
176,583
34,940
38,957
17.5
17.7
20.8
24.7
39.2
33.0
43.6
34.9
110.5
114.2
4.9
4.3
ITC
Buy
321
382
258,083
41,068
45,068
37.8
37.4
13.9
15.9
23.1
20.2
7.7
6.8
34.1
33.8
5.9
5.4
Marico
Neutral
424
-
27,352
6,551
7,766
15.7
16.0
10.4
12.5
40.9
33.9
11.9
9.9
33.2
32.4
4.1
3.5
Nestle*
Buy
5,776
6,646
55,687
11,291
12,847
22.2
22.3
158.9
184.6
36.3
31.3
19.0
17.1
55.0
57.3
4.8
4.2
Stock Watch
December 11, 2015
Company Name
Reco
CMP
Target
Mkt Cap
Sales ( Čcr )
OPM(%)
EPS (Č)
PER(x)
P/BV(x)
RoE(%)
EV/Sales(x)
(Č)
Price ( Č)
( Č cr )
FY16E FY17E
FY16E
FY17E
FY16E
FY17E
FY16E
FY17E
FY16E
FY17E
FY16E
FY17E
FY16E
FY17E
FMCG
Tata Global
Accumulate
135
144
8,520
8,635
9,072
9.8
9.9
6.5
7.6
20.8
17.8
2.1
2.0
6.8
7.4
0.9
0.9
IT
HCL Tech^
Buy
846
1,132
119,184
42,038
47,503
23.2
23.5
55.8
62.9
15.2
13.5
3.5
2.7
23.0
19.8
2.4
1.9
Infosys
Buy
1,046
1,306
240,352
60,250
66,999
28.0
28.0
58.3
63.7
18.0
16.4
3.8
3.2
20.9
19.7
3.3
2.8
TCS
Buy
2,381
3,165
469,110
111,274
126,852
28.4
28.7
125.4
143.9
19.0
16.5
7.5
6.9
39.9
42.2
3.8
3.3
Tech Mahindra
Buy
538
646
52,018
25,566
28,890
16.0
17.0
26.3
31.9
20.5
16.9
3.7
3.1
17.9
18.6
1.8
1.5
Wipro
Buy
565
719
139,669
52,414
58,704
23.7
23.8
38.4
42.3
14.7
13.4
2.9
2.6
19.5
18.0
2.2
1.8
Media
D B Corp
Accumulate
328
356
6,031
2,241
2,495
27.8
27.9
21.8
25.6
15.1
12.8
3.9
3.5
26.7
28.5
2.6
2.4
HT Media
Neutral
80
-
1,865
2,495
2,603
11.2
11.2
7.3
8.6
11.0
9.3
0.9
0.8
7.4
8.1
0.3
0.2
Jagran Prakashan
Accumulate
154
169
5,046
2,170
2,355
27.2
26.2
8.9
9.9
17.3
15.6
3.6
3.2
20.9
20.5
2.2
2.0
Sun TV Network
Neutral
387
-
15,247
2,779
3,196
70.2
70.5
22.8
27.3
17.0
14.2
4.2
3.8
26.7
28.3
5.2
4.5
Hindustan Media
Neutral
283
-
2,077
920
1,031
20.0
20.0
19.2
20.9
14.7
13.6
2.4
2.1
16.4
15.3
1.8
1.6
Ventures
Metals & Mining
Coal India
Buy
311
380
196,376
76,167
84,130
19.9
22.3
22.4
25.8
13.9
12.0
5.0
4.9
35.5
41.0
1.9
1.7
Hind. Zinc
Buy
143
175
60,211
14,641
14,026
50.4
50.4
17.7
16.0
8.1
8.9
1.2
1.1
16.2
13.2
1.7
1.6
Hindalco
Neutral
76
-
15,642
104,356
111,186
8.7
9.5
6.7
11.1
11.3
6.9
0.4
0.4
3.5
5.9
0.7
0.6
JSW Steel
Neutral
960
-
23,202
42,308
45,147
16.4
20.7
(10.3)
49.5
19.4
1.1
1.0
(1.0)
5.6
1.6
1.5
NMDC
Neutral
89
-
35,108
8,237
10,893
46.6
44.5
10.0
11.7
8.9
7.6
1.0
0.9
12.5
13.0
4.1
3.1
SAIL
Neutral
44
-
18,317
45,915
53,954
7.2
10.5
1.5
4.4
29.4
10.1
0.4
0.4
2.3
4.1
1.0
0.9
Vedanta
Neutral
83
-
24,696
71,445
81,910
26.2
26.3
12.9
19.2
6.5
4.3
0.5
0.4
7.2
8.9
0.8
0.6
Tata Steel
Neutral
233
-
22,624
126,760
137,307
8.9
11.3
6.4
23.1
36.6
10.1
0.7
0.7
2.0
7.1
0.8
0.7
Oil & Gas
Cairn India
Neutral
127
-
23,717
11,323
12,490
49.4
51.0
20.7
20.7
6.1
6.1
0.4
0.4
6.4
6.1
1.2
0.5
GAIL
Neutral
343
-
43,521
64,856
70,933
9.1
9.6
24.0
28.9
14.3
11.9
1.2
1.1
8.8
9.6
0.9
0.8
ONGC
Neutral
220
-
187,921
154,564
167,321
36.8
37.4
28.6
32.5
7.7
6.8
1.0
0.9
12.7
13.5
1.4
1.3
Petronet LNG
Neutral
244
-
18,293
29,691
31,188
5.8
6.2
12.8
13.4
19.1
18.2
2.9
2.5
15.8
14.8
0.7
0.7
Indian Oil Corp
Accumulate
414
455
100,614
359,607
402,760
5.9
6.1
42.5
48.7
9.8
8.5
1.3
1.2
14.1
14.4
0.4
0.3
Reliance Industries
Accumulate
950
1,050
307,693
304,775
344,392
12.6
13.4
91.3
102.6
10.4
9.3
1.2
1.1
11.8
12.0
0.9
0.8
Pharmaceuticals
Alembic Pharma
Neutral
673
-
12,683
2,658
3,112
24.1
20.2
24.6
23.9
27.4
28.2
9.8
7.5
42.5
30.2
4.8
4.0
Aurobindo Pharma
Accumulate
804
872
46,974
14,923
17,162
23.0
23.0
38.2
43.6
21.1
18.5
6.5
4.9
36.0
30.2
3.5
3.0
Aventis*
Neutral
4,229
-
9,738
2,082
2,371
17.4
20.8
118.2
151.5
35.8
27.9
5.2
4.2
19.9
25.5
4.4
3.6
Cadila Healthcare
Neutral
393
-
40,192
10,224
11,840
21.0
22.0
14.6
17.6
26.9
22.3
7.4
5.8
30.8
29.0
4.0
3.4
Stock Watch
December 11, 2015
Company Name
Reco
CMP
Target
Mkt Cap
Sales ( Čcr )
OPM(%)
EPS (Č)
PER(x)
P/BV(x)
RoE(%)
EV/Sales(x)
(Č)
Price ( Č)
( Č cr )
FY16E FY17E
FY16E
FY17E
FY16E
FY17E
FY16E
FY17E
FY16E
FY17E
FY16E
FY17E
FY16E
FY17E
Pharmaceuticals
Cipla
Neutral
635
-
51,018
14,211
16,611
20.6
19.0
27.0
28.9
23.5
22.0
4.0
3.4
18.4
16.8
3.6
3.0
Dr Reddy's
Buy
2,995
3,933
51,062
16,838
19,575
25.0
23.1
167.5
178.8
17.9
16.8
3.8
3.1
23.1
20.4
3.0
2.5
Dishman Pharma
Neutral
309
-
2,494
1,733
1,906
21.5
21.5
17.0
19.9
18.2
15.5
1.8
1.7
10.5
11.2
2.0
1.7
GSK Pharma*
Neutral
3,240
-
27,440
2,870
3,158
20.0
22.1
59.5
68.3
54.5
47.4
16.1
16.5
28.5
34.3
9.1
8.3
Indoco Remedies
Neutral
318
-
2,932
1,033
1,199
15.9
18.2
9.4
13.6
33.9
23.4
5.0
4.3
15.7
19.7
2.9
2.5
Ipca labs
Buy
760
900
9,584
3,363
3,909
12.9
18.6
13.4
28.0
56.7
27.1
4.1
3.6
7.4
14.0
3.1
2.7
Lupin
Neutral
1,736
-
78,193
13,092
16,561
25.0
27.0
50.4
68.3
34.5
25.4
7.1
5.6
22.8
24.7
5.7
4.4
Sun Pharma
Buy
757
950
182,072
28,163
32,610
25.8
30.7
17.4
26.9
43.5
28.1
4.1
3.6
13.0
16.6
5.9
4.9
Power
Tata Power
Neutral
63
-
16,917
35,923
37,402
22.6
22.8
4.1
5.2
15.4
12.1
1.2
1.1
7.5
9.3
1.4
1.3
NTPC
Buy
133
157
110,036
87,064
98,846
23.5
23.5
11.7
13.2
11.4
10.1
1.3
1.2
11.4
12.1
2.3
2.0
Power Grid
Buy
131
170
68,351
20,702
23,361
86.7
86.4
12.1
13.2
10.8
9.9
1.6
1.4
15.6
15.1
8.2
7.7
Telecom
Bharti Airtel
Neutral
313
-
124,939
101,748
109,191
32.1
31.7
12.0
12.5
26.1
25.0
1.8
1.7
6.9
6.7
1.9
1.7
Idea Cellular
Neutral
135
-
48,420
34,282
36,941
32.0
31.5
5.9
6.2
22.8
21.7
2.1
1.9
9.9
9.3
2.0
1.9
zOthers
Abbott India
Neutral
5,355
-
11,379
2,715
3,153
14.5
14.1
134.3
152.2
39.9
35.2
10.0
8.2
27.4
25.6
3.9
3.3
Bajaj Electricals
Buy
205
341
2,065
4,719
5,287
5.2
5.8
8.6
12.7
23.9
16.2
2.7
2.4
11.4
14.8
0.4
0.4
Finolex Cables
Neutral
250
-
3,823
2,520
2,883
12.2
12.0
12.7
14.2
19.7
17.6
2.7
2.4
13.6
13.5
1.3
1.1
Goodyear India*
Accumulate
552
622
1,273
1,888
1,680
12.1
11.9
62.2
56.6
8.9
9.8
2.1
1.8
25.9
19.7
0.5
0.5
Hitachi
Neutral
1,289
-
3,505
1,779
2,081
7.8
8.8
21.8
33.4
59.1
38.6
9.5
7.7
17.4
22.1
2.0
1.7
Jyothy Laboratories
Neutral
303
-
5,480
1,620
1,847
11.5
11.5
7.3
8.5
41.5
35.7
5.4
5.0
13.3
14.4
3.3
2.8
MRF
Buy
39,436
45,575
16,725
20,316
14,488
21.4
21.1
5,488.0
3,798.0
7.2
10.4
2.5
2.0
41.1
21.2
0.8
1.0
Page Industries
Neutral
12,685
-
14,149
1,929
2,450
19.8
20.1
229.9
299.0
55.2
42.4
24.4
16.9
52.1
47.1
7.4
5.8
Relaxo Footwears
Neutral
491
-
5,897
1,767
2,152
12.3
12.5
19.3
25.1
25.5
19.6
6.3
4.8
27.7
27.8
3.4
2.8
Siyaram Silk Mills
Buy
1,141
1,354
1,070
1,636
1,815
11.5
11.5
89.9
104.1
12.7
11.0
2.1
1.8
17.9
17.8
0.8
0.7
Styrolution ABS India*
Neutral
700
-
1,231
1,271
1,440
8.6
9.2
32.0
41.1
21.9
17.1
2.2
2.0
10.7
12.4
0.9
0.8
TVS Srichakra
Buy
2,729
3,240
2,090
2,101
2,338
15.7
15.0
248.6
270.0
11.0
10.1
4.8
3.4
43.6
34.0
1.0
0.9
HSIL
Neutral
306
-
2,213
2,123
2,384
16.1
16.5
15.0
18.9
20.4
16.2
1.6
1.5
8.0
9.4
1.4
1.2
Kirloskar Engines India
Neutral
254
-
3,673
2,471
2,826
8.8
10.4
9.1
13.3
27.8
19.1
2.7
2.5
9.7
13.4
1.1
1.0
Ltd
M M Forgings
Buy
525
614
634
511
615
21.7
21.6
43.1
55.8
12.2
9.4
2.2
1.8
19.9
21.2
1.4
1.1
Banco Products (India)
Neutral
139
-
993
1,208
1,353
11.0
12.3
10.8
14.5
12.9
9.6
1.5
1.3
11.9
14.5
0.8
0.7
Stock Watch
December 11, 2015
Company Name
Reco
CMP
Target Mkt Cap
Sales ( Čcr )
OPM(%)
EPS (Č)
PER(x)
P/BV(x)
RoE(%)
EV/Sales(x)
(Č)
Price ( Č)
( Č cr )
FY16E FY17E FY16E FY17E FY16E FY17E FY16E FY17E FY16E FY17E FY16E FY17E FY16E FY17E
zOthers
Competent Automobiles Neutral
143
-
88
1,040
1,137
3.2
3.1
25.7
28.0
5.6
5.1
0.8
0.7
15.0
14.3
0.1
0.1
Nilkamal
Neutral
1,003
-
1,497
1,910
2,083
10.5
10.3
63.3
69.2
15.8
14.5
2.6
2.2
17.6
16.5
0.8
0.7
Visaka Industries
Accumulate
125
144
199
1,086
1,197
9.9
10.3
21.5
28.8
5.8
4.4
0.6
0.5
9.6
11.6
0.4
0.3
Transport Corporation of
Neutral
294
-
2,237
2,830
3,350
8.8
9.0
14.4
18.3
20.5
16.1
3.2
2.7
15.4
17.1
0.9
0.8
India
Elecon Engineering
Neutral
84
-
913
1,369
1,533
13.7
14.9
3.3
6.1
25.2
13.8
1.6
1.5
6.6
11.4
1.0
0.9
Surya Roshni
Buy
135
183
592
2,992
3,223
8.1
8.4
14.7
18.3
9.2
7.4
0.9
0.8
9.7
11.0
0.5
0.4
MT Educare
Buy
138
169
549
286
366
18.3
17.7
7.7
9.4
17.9
14.7
3.8
3.3
20.2
21.1
1.8
1.4
Radico Khaitan
Buy
107
156
1,420
1,565
1,687
12.2
13.0
5.7
7.1
18.7
15.0
1.6
1.4
8.3
9.6
1.4
1.3
Garware Wall Ropes
Accumulate
380
423
832
861
967
10.9
10.9
24.0
28.2
15.8
13.5
2.3
2.0
14.6
14.9
1.0
0.8
Wonderla Holidays
Neutral
366
-
2,068
206
308
44.0
43.6
9.0
12.9
40.7
28.4
5.6
5.0
13.7
17.8
9.9
6.6
Linc Pen & Plastics
Neutral
178
-
263
340
371
8.3
8.9
10.8
13.2
16.5
13.5
2.6
2.3
16.0
17.1
0.8
0.7
The Byke Hospitality
Accumulate
163
181
655
222
287
20.5
20.5
5.6
7.6
29.0
21.6
5.5
4.5
18.9
20.8
3.0
2.3
Interglobe Aviation
Neutral
997
-
35,938
17,022
21,122
20.7
14.5
63.9
53.7
15.6
18.6
23.4
19.2
149.9
103.2
2.1
1.7
Coffee Day Enterprises
Neutral
257
-
5,292
2,692
2,964
17.0
18.6
-
4.7
-
54.2
3.1
3.0
0.2
5.5
2.4
2.2
Ltd
Navneet Education
Buy
82
97
1,964
998
1,062
24.1
24.0
5.8
6.1
14.3
13.5
3.2
2.8
22.0
20.6
2.1
1.9
Source: Company, Angel Research; Note: *December year end; #September year end; &October year end; Price as on December 10, 2015
Market Outlook
December 11, 2015
Research Team Tel: 022 - 39357800
DISCLAIMER
Angel Broking Private Limited (hereinafter referred to as “Angel”) is a registered Member of National Stock Exchange of India Limited,
Bombay Stock Exchange Limited and Metropolitian Stock Exchange of India Limited. It is also registered as a Depository Participant with
CDSL and Portfolio Manager with SEBI. It also has registration with AMFI as a Mutual Fund Distributor. Angel Broking Private Limited is a
registered entity with SEBI for Research Analyst in terms of SEBI (Research Analyst) Regulations, 2014 vide registration number
INH000000164. Angel or its associates has not been debarred/ suspended by SEBI or any other regulatory authority for accessing
/dealing in securities Market. Angel or its associates including its relatives/analyst do not hold any financial interest/beneficial ownership
of more than 1% in the company covered by Analyst. Angel or its associates/analyst has not received any compensation / managed or co
-managed public offering of securities of the company covered by Analyst during the past twelve months. Angel/analyst has not served as
an officer, director or employee of company covered by Analyst and has not been engaged in market making activity of the company
covered by Analyst.
This document is solely for the personal information of the recipient, and must not be singularly used as the basis of any investment
decision. Nothing in this document should be construed as investment or financial advice. Each recipient of this document should make
such investigations as they deem necessary to arrive at an independent evaluation of an investment in the securities of the companies
referred to in this document (including the merits and risks involved), and should consult their own advisors to determine the merits and
risks of such an investment.
Reports based on technical and derivative analysis center on studying charts of a stock's price movement, outstanding positions and
trading volume, as opposed to focusing on a company's fundamentals and, as such, may not match with a report on a company's
fundamentals.
The information in this document has been printed on the basis of publicly available information, internal data and other reliable sources
believed to be true, but we do not represent that it is accurate or complete and it should not be relied on as such, as this document is for
general guidance only. Angel Broking Pvt. Limited or any of its affiliates/ group companies shall not be in any way responsible for any
loss or damage that may arise to any person from any inadvertent error in the information contained in this report. Angel Broking Pvt.
Limited has not independently verified all the information contained within this document. Accordingly, we cannot testify, nor make any
representation or warranty, express or implied, to the accuracy, contents or data contained within this document. While Angel Broking
Pvt. Limited endeavors to update on a reasonable basis the information discussed in this material, there may be regulatory, compliance,
or other reasons that prevent us from doing so.
This document is being supplied to you solely for your information, and its contents, information or data may not be reproduced,
redistributed or passed on, directly or indirectly.
Neither Angel Broking Pvt. Limited, nor its directors, employees or affiliates shall be liable for any loss or damage that may arise from or
in connection with the use of this information.
Note: Please refer to the important ‘Stock Holding Disclosure' report on the Angel website (Research Section). Also, please refer to the
latest update on respective stocks for the disclosure status in respect of those stocks. Angel Broking Pvt. Limited and its affiliates may have
investment positions in the stocks recommended in this report.