Market Outlook
August 11, 2015
Dealer’s Diary
Domestic Indices
Chg (%)
(Pts)
(Close)
BSE Sensex
(0.5)
(135)
28,102
Indian markets are expected to open positive tracking SGX Nifty.
Nifty
(0.5)
(39)
8,526
Dow index moved sharply higher during trading session on Monday, regaining
MID CAP
(0.0)
(2)
11,555
some ground following the weakness seen in last few trading session. Buying interest
SMALL CAP
(0.4)
(49)
12,055
was also generated by renewed optimism about an end to the seemingly endless
BSE HC
(0.1)
(21)
17,500
Greek debt crisis.
BSE PSU
(0.9)
(69)
7,729
European stock markets climbed higher on Monday as a rise in some major
BANKEX
(0.1)
(14)
21,688
financial shares offset the impact of weaker energy stocks that curbed the progress
AUTO
(0.4)
(87)
19,678
of the market.
METAL
(1.0)
(90)
8,583
OIL & GAS
(0.9)
(94)
9,873
Indian markets ended negative after trading in positive territory for most of the day
BSE IT
(0.4)
(46)
11,123
in the wake of media reports that the government is mulling over convening a
Global Indices
Chg (%)
(Pts)
(Close)
special session of Parliament to pass the GST bill, touted as the biggest reform in
Dow Jones
1.4
242
17,615
indirect taxation since independence.
NASDAQ
1.2
58
5,102
News & Result Analysis
FTSE
0.3
18
6,736
Round 3 of Coal Auctions set to begin today
Nikkei
0.4
84
20,809
Result Review: Finolex Cables, Radico Khaitan, Garware Wall Ropes, Minda
Hang Sang
(0.1)
(31)
24,521
Industries
Straits Times
0.2
5
3,197
Result Preview: Sun Pharmaceuticals
Shanghai Com
4.9
184
3,928
Refer detailed news & result analysis on the following page
Markets Today
Indian ADR
Chg (%)
(Pts)
(Close)
The trend deciding level for the day is 28,179 / 8,548 levels. If NIFTY trades above
INFY
0.9
0.2
$17.7
this level during the first half-an-hour of trade then we may witness a further rally up
WIT
0.6
0.1
$12.6
to 28,340 - 28,579 / 8,599 - 8,672 levels. However, if NIFTY trades below
IBN
0.3
0.0
$10.2
28,179 / 8,548 levels for the first half-an-hour of trade then it may correct towards
HDB
0.1
0.0
$63.0
27,941 - 27,779 / 8,475 - 8,425 levels.
Indices
S2
S1
PIVOT
R1
R2
Advances / Declines
BSE
NSE
SENSEX
27,779
27,941
28,179
28,340
28,579
Advances
1,441
682
NIFTY
8,425
8,475
8,548
8,599
8,672
Declines
1,529
842
Unchanged
111
74
Net Inflows (August 7, 2015)
` cr
Purch
Sales
Net
MTD
YTD
Volumes (` cr)
FII
3,795
3,675
120
1,897
142,867
BSE
3,105
MFs
968
938
30
(537)
57,411
NSE
16,375
FII Derivatives (August 10, 2015)
` cr
Purch
Sales
Net
Open Interest
Index Futures
1,211
598
613
16,174
Stock Futures
2,153
2,579
(426)
51,208
Gainers / Losers
Gainer
Loser
Company
Price (`)
chg (%)
Company
Price (`)
chg (%)
GSPL
133
6.5
MRPL
74
(10.3)
GODREJPROP
301
6.4
JPASSOCIAT
11
(7.5)
TRENT
1,302
5.2
JPPOWER
8
(6.2)
ECLERX
1,591
5.1
APLLTD
669
(6.2)
KAILASH
5
4.9
COX&KINGS
284
(5.6)
Market Outlook
August 11, 2015
Round 3 of Coal Auctions set to begin today
The third round of coal auctions will see bidding for five coal blocks between
August 11-13th. The government had earlier decided to auction 10 coal blocks.
However, only two technical bids each were received for Dongeri Tal-II and
Sondhia coal mines, while only one technical bid was received for Kosar
Dongergaon mine. No technical bids were received for the Marki Mangli - IV
mine. Auctions for the rest will begin today, except Jamkhani which will be
scheduled at a later date. Total extraction capacity of the six mines is ~9MTPA,
while total extractable reserves are ~275MT. Majra mine has the highest no of
bidders with 6 bids. Jindal Steel and Power has qualified for three out of the six
mines on auction. Making one change to the auction rules in this round, the
government will treat multiple bids from one company as a single bid. Earlier, two
or more bids from an entity were treated as separate bids.
Geological
Extractable
Extraction
Date
Coal Mine
Location
Previous Allottee
Reserves (MT)
Reserves (MT)
Rate (MTPA)
11-Aug-15 Marki Mangli-I
Maharashtra
24
10
0.3 B.S. Ispat Ltd.
11-Aug-15 Bhaskarpara
Chhattisgarh
47
24
1.0 Bhaskarpara Coal Company Ltd
12-Aug-15 Chitarpur
Jharkhand
175
61
3.5 Corporate Ispat Alloys Limited
13-Aug-15 Parbatpur Central
Jharkhand
236
51
1.2 Electrosteel Castings Ltd.
13-Aug-15 Majra
Maharastra
51
15
0.5 M/S Gondwana Ispat Ltd.
TBA*
Jamkhani
Orissa
178
115
2.6 Bhushan Ltd
* Pursuant to the Delhi High Court case, the e-auction date of Jamkhani Coal Mine shall be announced at a later date.
Source: MSTC
Mine
Shortlisted Bidders
Marki Mangli-I
Grace Industries Limited
Lloyds Metals and Energy Limited
Topworth Urja & Metals Limited
Bhaskarpara
Crest Steel and Power Private Limited
Godawari Natural Resources Limited
Jindal Steel and Power Limited
Chitarpur
Hindalco Industries Limited
Jindal Steel and Power Limited
Vedanta Limited
Parbatpur Central
JSW Steel Limited
Rashtriya Ispat Nigam Limited
Steel Authority of India Limited
Majra
ACC Limited
Crest Steel and Power Private Limited
Emami Cement Limited
Grace Industries Limited
Jaypee Cement Corporation Limited
JK Lakshmi Cement Limited
Jamkhani
Bhushan Power & Steel Limited
Hindalco Industries Limited
Jindal Steel and Power Limited
Vedanta Limited
Source: MSTC
Market Outlook
August 11, 2015
Result Review
Finolex Cables (CMP: `263/ TP: -/ Upside: -)
Finolex Cables (FCL) reported a good set of numbers for 1QFY2016. Its top line
grew by a modest 2.8% yoy to `588cr which is lower than our estimate of `639cr.
The raw material cost as a percentage of sales declined by 304bp yoy to 71.9% of
sales while employee and other expenses remained flat on yoy basis. As a result,
the EBIDTA margin expanded by 262bp yoy to 12.4%. We had estimated EBITDA
margin to be in the range of 10.2% with lower raw material cost being the reason
for variance in EBITDA margin.
In terms of segmental performance, the revenue from the Electrical cables segment
degrew by 1.2% yoy and came in at `502cr. However, the EBIT grew by 34.5% on
a yoy basis while EBIT margin expanded by
428bp yoy to
16.1%. The
Communication cables segment reported revenue growth of 30.6% yoy to `63cr,
while EBIT and EBIT margins increased by 127.0% and 375bp yoy to `6cr and
8.8% respectively.
On the back of lower raw material cost, the net profit for the quarter increased by
38.5% yoy to `48cr. On the valuation front, the stock is currently trading at a P/E
multiple of 15.7x on FY2017E earnings. We recommend a Neutral rating on the
stock.
Y/E
Sales OPM
PAT
EPS ROE P/E P/BV EV/EBITDA EV/Sales
March
(` cr)
(%)
(` cr)
(`)
(%)
(x)
(x)
(x)
(x)
FY2016E
2,728
10.8
220.3
14.4
15.2
18.3
2.8
11.3
1.2
FY2017E
3,036
11.0
256.1
16.8
15.3
15.7
2.4
9.4
1.0
Radico Khaitan (CMP: `97/ TP: `112/ Upside: 15.4%)
Radico Khaitan’s 1QFY2016 results outperformed our estimates. The company’s
top-line grew by a healthy ~7% yoy to `395cr (our estimates was of around
`365cr), mainly due to healthy growth in prestige and above products segment.
On the operating front, the company reported margin contraction (down by 112bp
yoy to 11.9%), primarily on account of higher other costs. However, we see
reduction in raw material prices which is a good sign for the company. The
reported net profit grew by 9% yoy to `18cr (our estimates was of around `16.5cr)
on account of lower interest cost (in FY2015 the company has repaid a significant
amount of its debt; further debt reduction is also on the cards) and lower taxes.
Further, the company has not performed well in the last two years due to
increasing material costs (ENA is a key raw material) and with it not receiving
significant price hikes from various states. We expect the company to perform well
going forward in anticipation of easing material costs and on expectation of better
price hikes. This would result in an overall improvement in the operating margin of
the company. We are positive on Radico Khaitan and recommend a Buy rating on
the stock.
Market Outlook
August 11, 2015
Garware Wall Ropes (CMP: `293/TP: `390/ Upside: 33.1%)
Garware Wall Ropes (GWRL)’s 1QFY2016 results outperformed our estimates. The
company’s top-line grew by a healthy ~20% yoy to `239cr (our estimates was of
`213cr), mainly due to healthy growth in Synthetic cordage and fiber & Industrial
products segment. On the operating front, the company reported
margin improvement (up by 111bp yoy to 10.8%), primarily on account of lower
employee and other expenses. Notably, raw material costs have not declined (Key
raw matarial for GWRL is High Density Polyethylene, Polyethylene etc). We believe
recent correction in raw material price should get reflected in the coming
quarters.The reported net profit grew by 50% yoy to `15cr (our estimates was of
`11cr) on account of healthy sales growth, strong operating performance and
lower interest cost (in FY2015 the company has repaid a significant amount of its
debt).
Going ahead, we expect GWRL to report a healthy top-line owing to strong
domestic as well as export sales. On the domestic front, we expect demand to pick
up due to growth in agriculture and fisheries segments in the country. Further,
going forward, we expect the company to continue reporting strong numbers on
back of higher demand for aquaculture and sports products globally and also with
the company tapping new geographies. We are positive on GWRL and
recommend a Buy rating on the stock.
Minda Industries (CMP: `608/ TP: `652 /Upside:7%)
Minda Industries Ltd (MIL) 1QFY2016 results were ahead of estimates on account
of lower depreciation and higher profits from associate companies even as the
operating performance meet expectations. Minda continued to outpace the
automotive industry growth, registering a healthy topline growth of 9%. Building on
the strategy of new product development and higher sourcing to existing clients,
MIL was successful in beating the industry growth. Operating margins at 6.4%
were slightly below estimates due to pricing pressures by OEM’s. However, lower
depreciation expenditure and improved performance of associate companies led
tohigher profitability. Net Profit at `13.7 cr was ahead of our estimates of
`11.4 cr. We maintain our positive view on the stock with a price target of `652.
Y/E
Sales OPM
PAT
EPS ROE P/E P/BV EV/EBITDA EV/Sales
March
(` cr)
(%)
(` cr)
(`)
(%)
(x)
(x)
(x)
(x)
FY2016E
2,500
7.6
63
39.8
14.7
15.3
2.3
6.5
0.5
FY2017E
2,889
8.3
87
54.7
16.9
11.1
1.9
4.9
0.4
Result Preview
Sun Pharmaceuticals (CMP: `842/ TP: `950 / Upside: 12.8% )
For 1QFY2016, Sun Pharmaceuticals, the company is expected to post sales of
`6200cr. The sales will, be driven by the domestic and Taro sales. On the
operating front, the gross margins are expected to be 74.4%, with OPM expected
to come in at 25.8%. The normalised OPM’s came in at ~24-25% in 4QFY2015.
On the net profit front, the company is expected to post net profit of `1203cr. The
R&D expenditure during the quarter is expected to be around 9.3% of sales.
Note- For the corresponding period, the numbers are not available and the
Market Outlook
August 11, 2015
expected numbers do not include any extra-ordinaries, on back of merger with
Ranbaxy Labs. We recommend a accumulate on the stock.
Y/E
Sales OPM PAT EPS
ROE
P/E
P/BV EV/Sales EV/EBITDA
Mar
(` cr)
(%)
(` cr)
(`)
(%)
(x)
(x)
(x)
(x)
FY2016E
27,839
27.7
4,565
18.9
13.0
44.4
4.0
6.7
24.1
FY2017E
33,542
29.7
6,471
26.9
14.6
31.3
3.5
5.2
17.5
Quarterly Bloomberg Brokers Consensus Estimate
State Bank of India - August 11, 2015
Particulars (` cr)
1QFY16E
1QFY15
y-o-y (%)
4QFY15
q-o-q (%)
Net profit
3,400
3,349
1.5
3,742
(9.2)
NMDC Ltd - August 11, 2015
Particulars (` cr)
1QFY16E
1QFY15
y-o-y (%)
4QFY15
q-o-q (%)
Net sales
1,937
3,475
(44.2)
2,827
(31.5)
EBITDA
1,044
2,402
(56.6)
1,421
(26.6)
EBITDA margin (%)
53.9
69.1
50.3
Net profit
1,002
1,915
(47.7)
1,347
(25.6)
Tata Steel Ltd Consol - August 11, 2015
Particulars (` cr)
1QFY16E
1QFY15
y-o-y (%)
4QFY15
q-o-q (%)
Net sales
29,389
36,143
(18.7)
33,337
(11.8)
EBITDA
2,218
4,273
(48.1)
1,543
43.7
EBITDA margin (%)
7.5
11.8
4.6
Net profit
(481)
337
0.0
(5,674)
0.0
Hindustan Petroleum Corp Ltd - August 11, 2015
Particulars (` cr)
1QFY16E
1QFY15
y-o-y (%)
4QFY15
q-o-q (%)
Net sales
40,744
59,152
(31.1)
44,550
(8.5)
EBITDA
1,989
590
237.2
3,514
(43.4)
EBITDA margin (%)
4.9
1.0
7.9
Net profit
1,040
46
2,159.4
2,162
(51.9)
Sun Pharmaceutical Industries Ltd Consol - August 11, 2015
Particulars (` cr)
1QFY16E
1QFY15
y-o-y (%)
4QFY15
q-o-q (%)
Net sales
6,706
3,927
70.8
6,145
9.1
EBITDA
1,949
1,733
12.5
892
118.4
EBITDA margin (%)
29.1
44.1
14.5
Net profit
1,104
1,391
(20.6)
888
24.3
Reliance Power Ltd Consol - August 11, 2015
Particulars (` cr)
1QFY16E
1QFY15
y-o-y (%)
4QFY15
q-o-q (%)
Net sales
2,688
1,753
53.3
1,585
69.6
EBITDA
1,231
635
94.0
675
82.3
EBITDA margin (%)
45.8
36.2
42.6
Net profit
293
244
19.8
276
5.9
Market Outlook
August 11, 2015
Ashok Leyland Ltd - August 12, 2015
Particulars (` cr)
1QFY16E
1QFY15
y-o-y (%)
4QFY15
q-o-q (%)
Net sales
3,746
2,435
53.9
4,436
(15.5)
EBITDA
326
116
181.0
457
(28.6)
EBITDA margin (%)
8.7
4.8
10.3
Net profit
120
(48)
0.0
230
(48.0)
IDBI Bank Ltd - August 12, 2015
Particulars (` cr)
1QFY16E
1QFY15
y-o-y (%)
4QFY15
q-o-q (%)
Net profit
161
105
53.4
546
(70.5)
Coal India Ltd Consol - August 12, 2015
Particulars (` cr)
1QFY16E
1QFY15
y-o-y (%)
4QFY15
q-o-q (%)
Net sales
19,325
17,800
8.6
20,774
(7.0)
EBITDA
4,701
4,281
9.8
5,965
(21.2)
EBITDA margin (%)
24.3
24.1
28.7
Net profit
4,104
4,033
1.8
4,239
(3.2)
Jindal Steel & Power Ltd Consol - August 12, 2015
Particulars (` cr)
1QFY16E
1QFY15
y-o-y (%)
4QFY15
q-o-q (%)
Net sales
4,884
4,870
0.3
4,481
9.0
EBITDA
841
1,629
(48.4)
1,048
(19.8)
EBITDA margin (%)
17.2
33.4
23.4
Net profit
(453)
418
0.0
(519)
0.0
Reliance Infrastructure Ltd - August 12, 2015
Particulars (` cr)
1QFY16E
1QFY15
y-o-y (%)
4QFY15
q-o-q (%)
Net sales
2,656
2,524
5.2
2,660
(0.1)
EBITDA
497
431
15.5
567
(12.3)
EBITDA margin (%)
18.7
17.1
21.3
Net profit
351
321
9.2
450
(22.0)
Oil & Natural Gas Corp Ltd - August 13, 2015
Particulars (` cr)
1QFY16E
1QFY15
y-o-y (%)
4QFY15
q-o-q (%)
Net sales
23,586
21,747
8.5
21,303
10.7
EBITDA
13,613
8,864
53.6
7,619
78.7
EBITDA margin (%)
57.7
40.8
35.8
Net profit
6,069
4,782
26.9
3,935
54.2
Indian Oil Corp Ltd - August 13, 2015
Particulars (` cr)
1QFY16E
1QFY15
y-o-y (%)
4QFY15
q-o-q (%)
Net sales
101,442
124,666
(18.6)
93,492
8.5
EBITDA
6,136
3,697
66.0
9,284
(33.9)
EBITDA margin (%)
6.0
3.0
9.9
Net profit
4,213
2,523
67.0
6,285
(33.0)
Market Outlook
August 11, 2015
Tata Power Co Ltd Consol - August 13, 2015
Particulars (` cr)
1QFY16E
1QFY15
y-o-y (%)
4QFY15
q-o-q (%)
Net sales
8,594
8,739
(1.7)
8,167
5.2
EBITDA
1,866
1,775
5.1
1,962
(4.9)
EBITDA margin (%)
21.7
20.3
24.0
Net profit
186
(111)
0.0
159
16.7
DLF Ltd Consol - August 13, 2015
Particulars (` cr)
1QFY16E
1QFY15
y-o-y (%)
4QFY15
q-o-q (%)
Net sales
1,991
1,725
15.4
1,954
1.9
EBITDA
740
737
0.4
696
6.4
EBITDA margin (%)
37.2
42.7
35.6
Net profit
152
128
19.1
172
(11.3)
Unitech Ltd Consol - August 13, 2015
Particulars (` cr)
1QFY16E
1QFY15
y-o-y (%)
4QFY15
q-o-q (%)
Net sales
415
1,522
(72.7)
813
(48.9)
EBITDA
#VALUE!
1,043
#VALUE!
(315)
#VALUE!
EBITDA margin (%)
#VALUE!
68.6
-38.8
Net profit
17
996
(98.3)
(163)
0.0
Reliance Capital Ltd Consol - August 14, 2015
Particulars (` cr)
1QFY16E
1QFY15
y-o-y (%)
4QFY15
q-o-q (%)
Net profit
215
164
31.3
407
(47.1)
Economic and Political News
Price cuts fail to boost Q1 volume growth for FMCG cos
Domestic car sales rise 17% in July
CII seeks incentives to promote medical equipment industry
Corporate News
IOC expects its LNG terminal to go on stream by 2018
RComm launches unlimited voice, data plan in Gujarat circle
Adani Power: Acquisition seen to be strategy paying off
Market Outlook
August 11, 2015
Top Picks
Large Cap
Market
CMP
Target
Upside
Company
Sector
Rating
Cap (` Cr)
(`)
(`)
(%)
Axis Bank
Financials
137,034
Buy
577
716
24.1
ICICI Bank
Financials
179,809
Buy
310
370
19.5
Infosys
IT
248,518
Buy
1,082
1,306
20.7
Inox Wind
Capital Goods
8,659
Buy
390
505
29.4
LIC Housing Fin. Financials
25,574
Buy
507
590
16.4
Power Grid
Power
72,248
Buy
138
170
23.1
TCS
IT
503,550
Buy
2,571
3,168
23.2
Tech Mahindra IT
51,085
Buy
531
646
21.6
Yes Bank
Financials
34,157
Buy
817
989
21.1
Sun Pharma
Pharmaceuticals
202,507 Accumulate
842
950
12.9
Source: Angel Research, Bloomberg
Mid Cap
Market
CMP
Target
Upside
Company
Sector
Rating
Cap (` Cr)
(`)
(`)
(%)
Bajaj Electricals
Others
2,785
Buy
276
341
23.4
Garware Wall Ropes Others
638
Buy
292
390
33.7
Hindustan Media Ven. Media
1,761
Buy
240
292
21.7
JK Tyre
Auto Ancillary
2,637
Buy
116
147
26.5
MBL Infrastructures
Construction
1,105
Buy
267
395
48.0
MT Educare
Others
486
Buy
122
141
15.5
Surya Roshni
Others
651
Buy
148
193
30.0
Minda Industries
Auto Ancillary
933 Accumulate
588
652
10.8
Radico Khaitan
Others
1,306 Accumulate
98
112
14.1
Setco Automotive
Auto Ancillary
684 Accumulate
256
286
11.7
Source: Angel Research, Bloomberg
Market Outlook
August 11, 2015
Result Calendar
Date
Company
Bosch India, Apollo Tyres, J K Lakshmi Cements, St Bk of India, NMDC, Tata Steel, Prakash Industries, Godawari Ispat,
August 11, 2015
HPCL, Siyaram Silk Mills, Sun Pharma, Reliance Power
Ashok Leyland, India Cements, IDBI Bank, Bank of Maharashtra, Coal India, Jindal Steel, Nalco, MOIL, Goodyear,
August 12, 2015
TVS Srichakra, Abbott India, Cadila Healthcare, Aurobindo Pharma, Reliance Infra., Anant Raj
August 13, 2015
Jyoti Structures, ONGC, IOC, Page Industries, Surya Roshni, Orchid Chemicals, Tata Power Co., DLF, Unitech
Amara Raja Batteries, Power Fin.Corpn., Reliance Capital, SAIL, Hindalco, Bhushan Steel, BPCL, Elecon Engineering,
August 14, 2015
Cipla, GIPCL
Source: Bloomberg, Angel Research
Global economic events release calendar
Date
Time
Country Event Description
Unit
Period
Bloomberg Data
Last Reported Estimated
August 11, 2015
India
Imports YoY%
% Change
Jul
(13.40)
--
India
Exports YoY%
% Change
Jul
(15.80)
--
August 12, 2015
2:00PM UK
Jobless claims change
% Change
Jul
7.00
1.00
11:00AM China Industrial Production (YoY)
% Change
Jul
6.80
6.60
5:30PM India
Industrial Production YoY
% Change
Jun
2.70
3.30
August 13, 2015
6:00PM US
Initial Jobless claims
Thousands
Aug 8
270.00
270.00
August 14, 2015
2:30PM Euro Zone Euro-Zone CPI (YoY)
%
Jul F
0.20
0.20
6:45PM US
Industrial Production
%
Jul
0.23
0.30
12:00PM India
Monthly Wholesale Prices YoY%
% Change
Jul
(2.40)
(2.80)
2:30PM Euro Zone Euro-Zone GDP s.a. (QoQ)
% Change
2Q A
0.40
0.40
11:30AM Germany GDP nsa (YoY)
% Change
2Q P
1.10
1.60
August 18, 2015
6:00PM US
Building permits
Thousands
Jul
1,337.00
1,200.00
6:00PM US
Housing Starts
Thousands
Jul
1,174.00
1,180.00
2:00PM UK
CPI (YoY)
% Change
Jul
--
--
August 19, 2015
6:00PM US
Consumer price index (mom)
% Change
Jul
0.30
0.10
August 20, 2015
7:30PM US
Existing home sales
Million
Jul
5.49
5.41
August 21, 2015
7:30PM Euro Zone Euro-Zone Consumer Confidence
Value
Aug A
(7.10)
--
August 24, 2015
1:00PM Germany PMI Services
Value
Aug P
53.80
--
1:00PM Germany PMI Manufacturing
Value
Aug P
51.80
--
August 25, 2015
7:30PM US
New home sales
Thousands
Jul
482.00
--
7:30PM US
Consumer Confidence
S.A./ 1985=100
Aug
90.91
--
August 27, 2015
6:00PM US
GDP Qoq (Annualised)
% Change
2Q S
2.30
--
August 28, 2015
2:00PM UK
GDP (YoY)
% Change
2Q P
2.60
--
Source: Bloomberg, Angel Research
Market Outlook
August 11, 2015
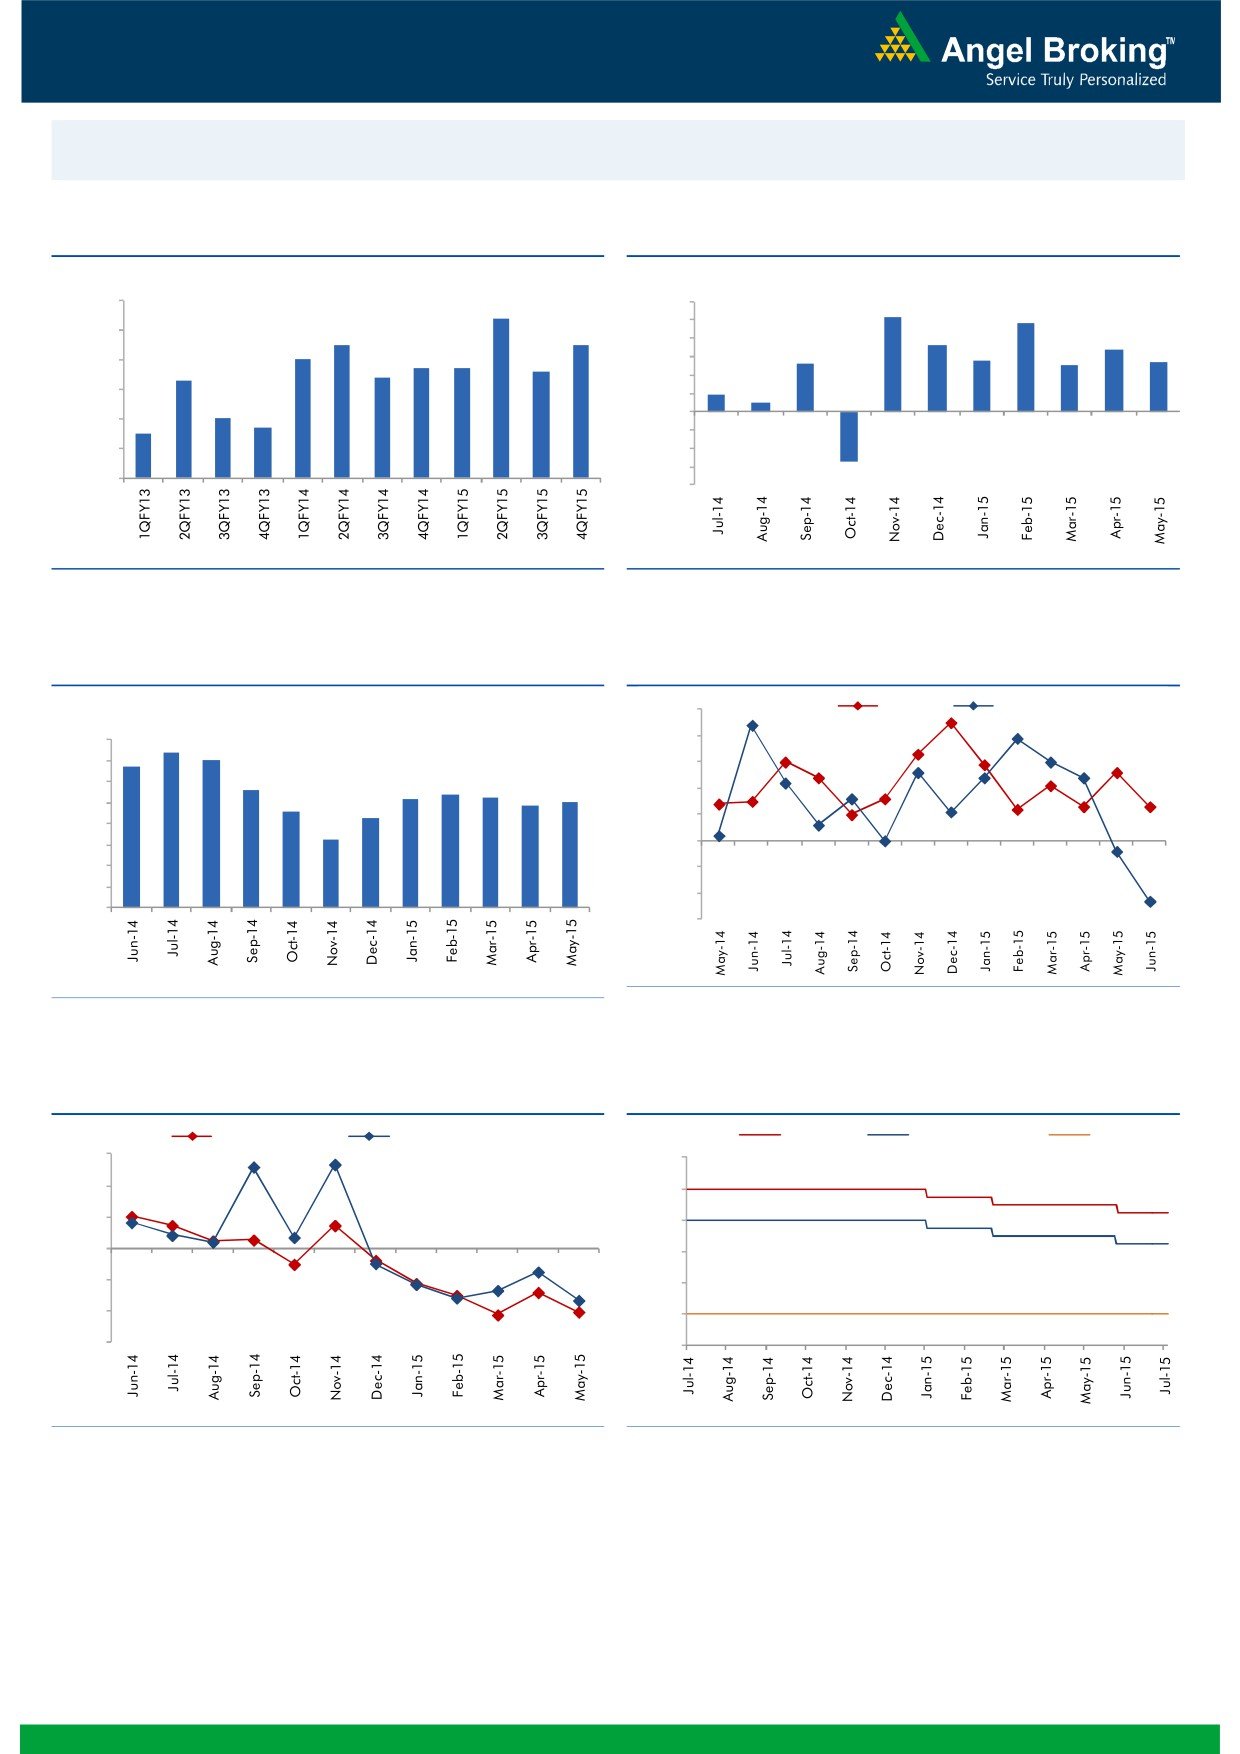
Macro watch
Exhibit 1: Quarterly GDP trends
Exhibit 2: IIP trends
(%)
(%)
9.0
8.4
6.0
5.2
4.8
5.0
8.0
7.5
7.5
3.6
4.0
3.4
7.0
2.8
2.7
6.7
6.7
6.6
2.6
2.5
7.0
6.3
6.4
3.0
2.0
0.9
6.0
0.5
1.0
5.0
4.7
-
5.0
4.5
(1.0)
4.0
(2.0)
(3.0)
3.0
(2.7)
(4.0)
Source: CSO, Angel Research
Source: MOSPI, Angel Research
Exhibit 3: Monthly CPI inflation trends
Exhibit 4: Manufacturing and services PMI
(%)
55.0
Mfg. PMI
Services PMI
8.0
7.4
54.0
7.0
6.8
7.0
53.0
5.6
5.2
5.4
5.3
6.0
4.9
5.0
52.0
4.6
5.0
4.3
51.0
4.0
3.3
3.0
50.0
2.0
49.0
1.0
48.0
-
47.0
Source: Market, Angel Research; Note: Level above 50 indicates expansion
Source: MOSPI, Angel Research
Exhibit 5: Exports and imports growth trends
Exhibit 6: Key policy rates
(%)
Exports yoy growth
Imports yoy growth
(%)
Repo rate
Reverse Repo rate
CRR
30.0
9.00
20.0
8.00
10.0
7.00
0.0
6.00
(10.0)
5.00
(20.0)
4.00
(30.0)
3.00
Source: Bloomberg, Angel Research
Source: RBI, Angel Research
Market Outlook
August 11, 2015
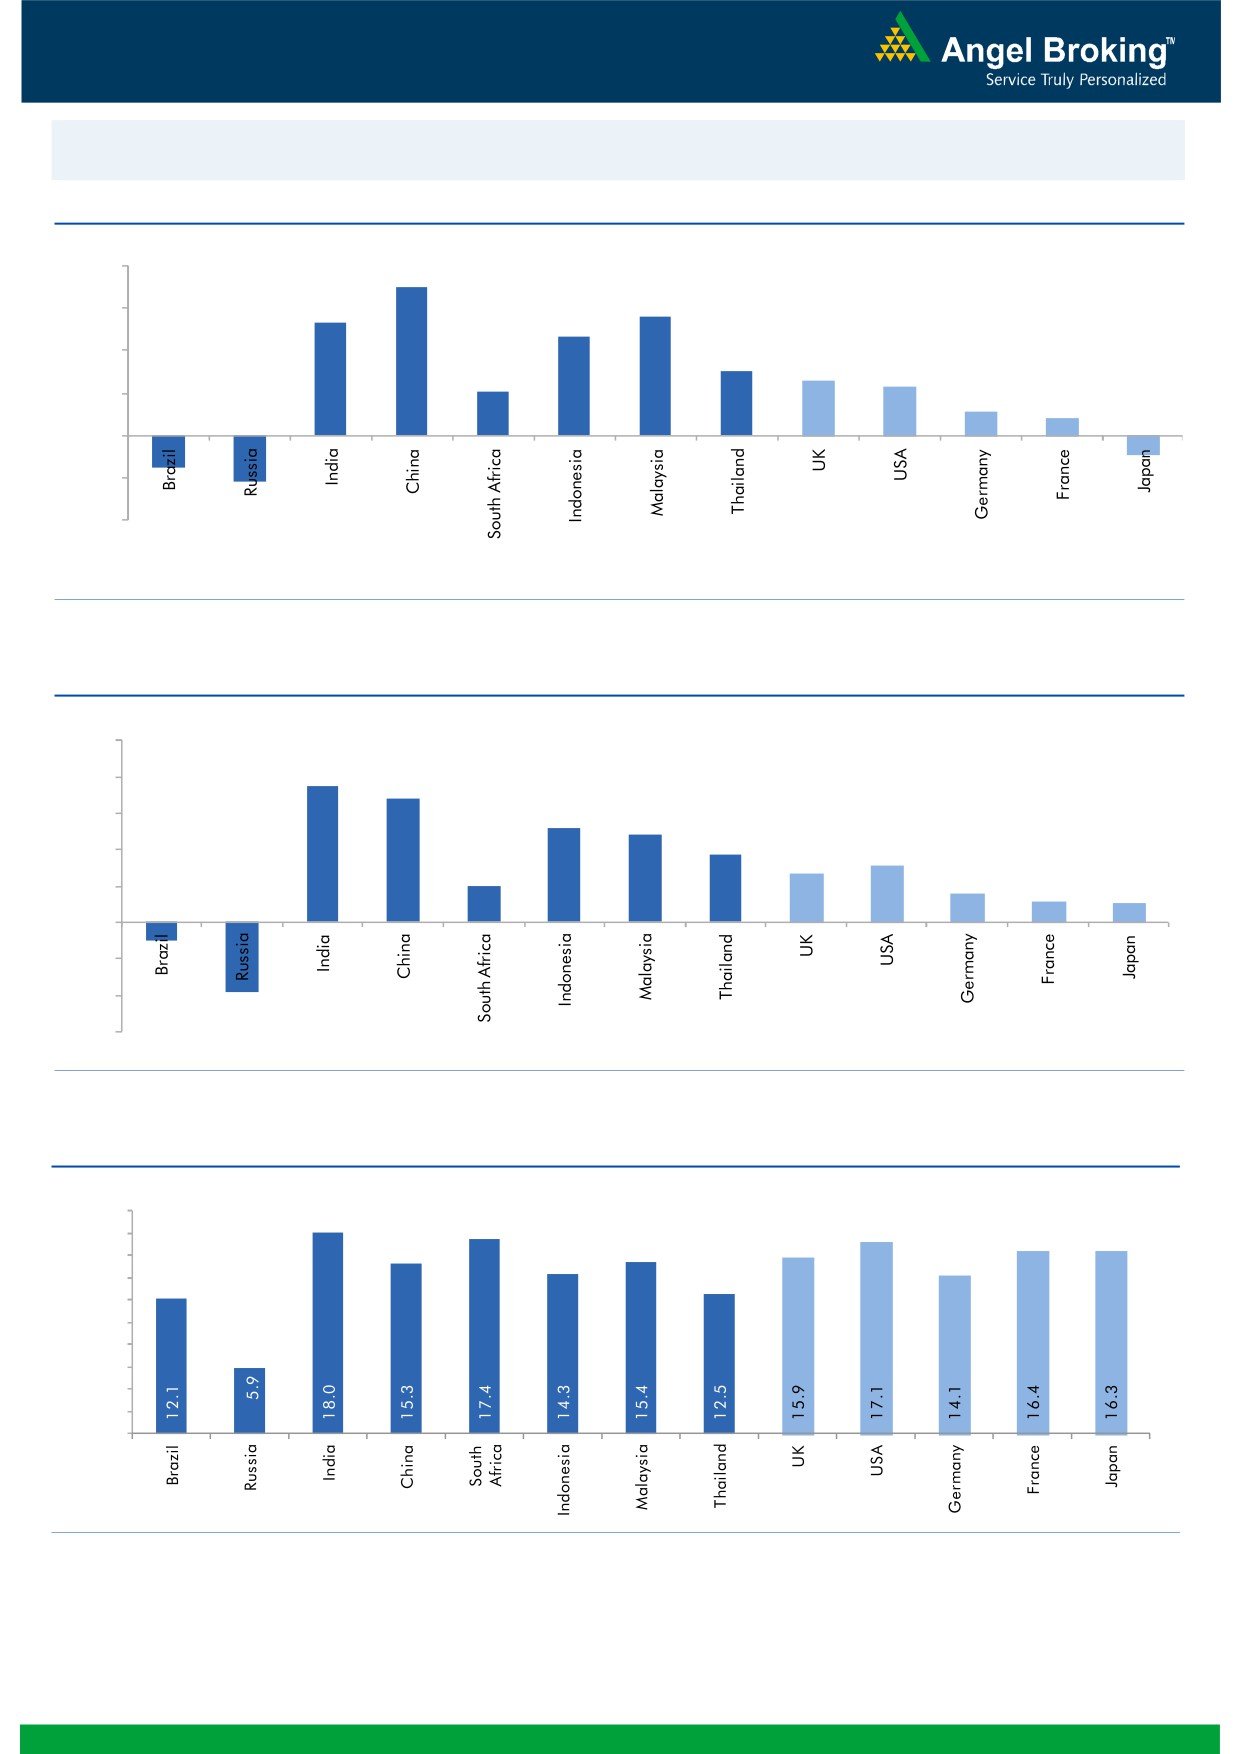
Global watch
Exhibit 1: Latest quarterly GDP Growth (%, yoy) across select developing and developed countries
(%)
8.0
7.0
5.6
6.0
5.3
4.7
4.0
3.0
2.6
2.1
2.3
2.0
1.1
0.8
(1.6)
(2.2)
(0.9)
-
(2.0)
(4.0)
Source: Bloomberg, Angel Research
Exhibit 2: 2015 GDP Growth projection by IMF (%, yoy) across select developing and developed countries
(%)
10.0
7.5
8.0
6.8
6.0
5.2
4.8
3.7
4.0
3.1
2.7
2.0
1.6
2.0
1.2
1.0
(1.0)
(3.8)
-
(2.0)
(4.0)
(6.0)
Source: IMF, Angel Research
Exhibit 3: One year forward P-E ratio across select developing and developed countries
(x)
20.0
18.0
16.0
14.0
12.0
10.0
8.0
6.0
4.0
2.0
-
Source: Bloomberg, Angel Research
Market Outlook
August 11, 2015
Exhibit 4: Relative performance of indices across globe
Returns (%)
Country
Name of index
Closing price
1M
3M
1YR
Brazil
Bovespa
49,353
(4.1)
(12.4)
(11.7)
Russia
Micex
1,702
3.8
(2.3)
23.4
India
Nifty
8,526
0.9
4.8
10.8
China
Shanghai Composite
3,928
6.1
(11.5)
70.6
South Africa
Top 40
46,432
5.8
(0.6)
2.2
Mexico
Mexbol
45,321
(0.2)
(0.5)
1.1
Indonesia
LQ45
808
(4.0)
(6.2)
(7.2)
Malaysia
KLCI
1,654
(1.9)
(7.0)
(10.4)
Thailand
SET 50
928
(3.2)
(6.8)
(9.4)
USA
Dow Jones
17,615
(2.0)
(2.4)
6.4
UK
FTSE
6,736
4.9
(2.0)
2.7
Japan
Nikkei
20,809
1.2
6.4
31.8
Germany
DAX
11,605
8.5
1.6
26.9
France
CAC
5,195
12.8
2.0
24.7
Source: Bloomberg, Angel Research
Market Outlook
August 11, 2015
Stock Watch
Company Name
Reco
CMP
Target
Mkt Cap
Sales ( Čcr )
OPM(%)
EPS (Č)
PER(x)
P/BV(x)
RoE(%)
EV/Sales(x)
(Č)
Price ( Č)
( Č cr )
FY16E FY17E
FY16E
FY17E
FY16E
FY17E
FY16E
FY17E
FY16E
FY17E
FY16E
FY17E
FY16E
FY17E
Agri / Agri Chemical
Rallis
Neutral
226
-
4,398
2,075
2,394
14.4
14.4
9.5
11.0
23.8
20.6
4.7
4.1
21.1
21.3
2.2
1.9
United Phosphorus
Neutral
562
-
24,107
13,698
15,752
17.6
17.6
32.1
38.5
17.5
14.6
3.4
2.9
21.4
21.3
1.8
1.5
Auto & Auto Ancillary
Ashok Leyland
Neutral
88
-
24,973
17,394
20,318
9.6
10.7
2.8
4.4
31.3
19.9
4.4
4.1
14.3
20.4
1.4
1.2
Bajaj Auto
Neutral
2,556
-
73,971
23,842
27,264
19.8
19.6
128.4
144.4
19.9
17.7
6.1
5.2
30.5
29.5
2.6
2.3
Eicher Motors
Accumulate
20,365
21,843
55,274
11,681
15,550
15.3
16.9
358.5
564.3
56.8
36.1
17.1
12.7
29.8
34.9
4.7
3.5
Hero Motocorp
Neutral
2,705
-
54,012
28,500
33,028
13.8
14.1
144.2
166.3
18.8
16.3
6.9
5.9
36.7
36.0
1.7
1.4
L G Balakrishnan & Bros Neutral
475
-
746
1,254
1,394
11.6
11.8
35.9
41.7
13.3
11.4
1.8
1.6
13.5
13.8
0.7
0.6
Mahindra and Mahindra Accumulate
1,360
1,493
84,497
40,088
45,176
13.8
14.0
59.6
70.4
22.8
19.3
3.8
3.3
16.6
17.2
1.8
1.5
Maruti
Accumulate
4,498
4,735
135,867
58,102
68,587
16.7
16.9
182.0
225.5
24.7
20.0
4.9
4.2
19.9
21.0
2.1
1.7
Minda Industries
Accumulate
588
652
933
2,500
2,889
7.6
8.3
39.4
54.3
14.9
10.8
2.1
1.8
14.1
16.3
0.5
0.4
Rane Brake Lining
Accumulate
332
366
263
454
511
11.1
11.4
23.8
28.1
14.0
11.8
2.0
1.8
14.2
15.3
0.7
0.6
Setco Automotive
Accumulate
256
286
684
718
862
13.3
14.3
13.4
19.0
19.1
13.5
3.0
2.5
15.4
18.5
1.2
1.1
Tata Motors
Buy
386
455
111,403
267,464
311,225
13.7
13.7
34.6
41.8
11.2
9.2
1.4
1.2
13.2
13.9
0.6
0.6
TVS Motor
Accumulate
234
255
11,124
11,839
13,985
7.0
8.0
10.8
15.9
21.7
14.7
5.5
4.4
25.5
29.7
0.9
0.8
Amara Raja Batteries
Neutral
965
-
16,489
5,355
6,641
17.4
17.8
31.8
40.9
30.4
23.6
7.6
6.0
25.2
25.5
3.1
2.4
Exide Industries
Neutral
158
-
13,468
7,363
8,247
13.7
14.5
6.6
7.7
24.0
20.6
3.0
2.8
12.6
13.3
1.6
1.4
Apollo Tyres
Neutral
209
-
10,639
12,866
13,892
15.7
15.4
20.1
19.9
10.4
10.5
1.6
1.4
15.8
13.6
0.9
0.9
Ceat
Neutral
1,019
-
4,120
6,041
6,770
14.3
13.9
101.5
117.7
10.0
8.7
2.0
1.7
20.0
19.2
0.8
0.7
JK Tyres
Buy
116
147
2,637
7,446
7,942
15.2
14.7
19.6
21.0
5.9
5.5
1.5
1.2
25.2
21.7
0.8
0.7
Swaraj Engines
Neutral
995
-
1,236
593
677
14.5
14.8
51.2
60.8
19.4
16.4
4.5
4.1
23.3
24.8
1.9
1.6
Subros
Neutral
96
-
574
1,268
1,488
11.6
11.9
3.7
6.6
25.9
14.5
1.7
1.6
6.8
11.4
0.8
0.6
Indag Rubber
Buy
203
247
534
283
329
17.0
17.2
13.0
15.4
15.7
13.2
3.4
2.9
21.8
21.6
1.6
1.3
Capital Goods
ACE
Neutral
49
-
482
660
839
4.7
8.2
1.0
3.9
48.8
12.5
1.5
1.4
3.2
11.3
0.9
0.7
BEML
Accumulate
1,406
1,607
5,855
3,277
4,006
6.0
8.9
29.2
64.3
48.2
21.9
2.7
2.4
5.7
11.7
2.0
1.6
BGR Energy
Neutral
141
-
1,016
3,615
3,181
9.5
9.4
16.7
12.4
8.4
11.4
0.8
0.8
10.0
7.0
0.7
0.9
BHEL
Neutral
271
-
66,367
33,722
35,272
10.8
11.7
10.5
14.2
25.8
19.1
1.9
1.8
7.0
9.0
2.0
1.9
Blue Star
Neutral
374
-
3,365
3,649
4,209
5.0
5.9
9.2
14.7
40.9
25.4
7.4
7.0
9.1
17.5
1.0
0.9
Crompton Greaves
Accumulate
191
204
11,983
13,484
14,687
4.9
6.2
4.5
7.1
42.5
26.9
3.0
2.8
7.2
10.8
1.0
0.9
Inox Wind
Buy
390
505
8,659
4,980
5,943
17.0
17.5
26.6
31.6
14.7
12.4
4.4
3.2
35.0
30.0
2.0
1.6
Market Outlook
August 11, 2015
Stock Watch
Company Name
Reco
CMP
Target
Mkt Cap
Sales ( Čcr )
OPM(%)
EPS (Č)
PER(x)
P/BV(x)
RoE(%)
EV/Sales(x)
(Č)
Price ( Č)
( Č cr )
FY16E
FY17E
FY16E
FY17E
FY16E
FY17E
FY16E
FY17E
FY16E
FY17E
FY16E
FY17E
FY16E
FY17E
Capital Goods
KEC International
Neutral
150
-
3,845
8,791
9,716
6.1
6.8
5.4
8.2
27.7
18.2
2.8
2.5
10.0
14.0
0.7
0.6
Thermax
Neutral
1,032
-
12,298
6,413
7,525
7.4
8.5
30.5
39.3
33.8
26.3
5.2
4.5
15.0
17.0
1.9
1.6
Cement
ACC
Accumulate
1,384
1,548
25,987
11,856
14,092
14.5
17.8
47.6
76.1
29.1
18.2
3.0
2.8
10.6
15.7
2.1
1.7
Ambuja Cements
Neutral
226
-
35,143
10,569
12,022
20.7
22.2
8.7
10.7
26.0
21.2
3.3
3.1
13.0
15.2
3.0
2.6
India Cements
Buy
86
132
2,645
4,716
5,133
14.9
15.8
1.0
4.5
86.1
19.1
0.9
0.9
1.0
4.5
0.9
0.8
JK Cement
Accumulate
668
767
4,670
4,056
4,748
14.5
17.0
22.6
41.1
29.6
16.3
2.6
2.4
9.3
15.3
1.6
1.3
J K Lakshmi Cement
Buy
363
443
4,267
3,004
3,618
17.6
19.9
13.9
27.2
26.1
13.3
3.0
2.6
11.8
20.5
1.9
1.5
Mangalam Cements
Buy
228
349
609
1,111
1,336
12.2
15.1
16.3
34.6
14.0
6.6
1.1
1.0
8.2
16.0
0.9
0.7
Orient Cement
Neutral
176
-
3,600
1,854
2,524
21.2
22.2
7.7
11.1
22.8
15.8
3.3
2.8
13.3
15.7
2.7
1.9
Ramco Cements
Neutral
357
-
8,510
4,036
4,545
20.8
21.3
15.1
18.8
23.7
19.0
2.9
2.6
12.9
14.3
2.7
2.3
Shree Cement^
Neutral
11,229
-
39,120
7,150
8,742
26.7
28.6
228.0
345.5
49.2
32.5
7.3
6.1
15.7
20.3
5.3
4.2
UltraTech Cement
Neutral
3,171
-
87,010
27,562
31,548
20.4
22.3
111.9
143.3
28.3
22.1
4.0
3.5
15.2
16.8
3.3
2.8
Construction
ITNL
Neutral
141
-
3,486
7,589
8,021
34.0
35.9
16.0
19.0
8.8
7.4
0.6
0.5
6.5
6.7
3.6
3.8
KNR Constructions
Neutral
562
-
1,578
915
1,479
14.3
13.9
20.3
37.2
27.7
15.1
2.5
2.2
9.6
15.6
1.9
1.2
Larsen & Toubro
Accumulate
1,817
2,013
169,047
68,920
82,446
10.9
11.5
57.0
73.0
31.9
24.9
2.9
2.7
13.6
15.5
2.7
2.2
Gujarat Pipavav Port
Neutral
216
-
10,428
793
694
53.0
50.9
9.0
8.0
24.0
27.0
5.2
4.2
25.9
18.4
12.7
14.4
MBL Infrastructures
Buy
267
395
1,105
2,507
2,986
12.4
14.4
21.5
20.5
12.4
13.0
1.5
1.4
12.6
12.7
1.2
1.1
PNC Infratech
Accumulate
470
445
2,410
1,719
2,003
13.0
13.5
21.0
28.0
22.4
16.8
1.9
1.7
11.0
10.9
1.5
1.3
Financials
Allahabad Bank
Neutral
91
-
5,205
8,859
9,817
3.0
3.0
23.7
30.1
3.8
3.0
0.5
0.4
10.6
12.3
-
-
Axis Bank
Buy
577
716
137,034
26,522
31,625
3.6
3.6
36.2
45.4
15.9
12.7
3.1
2.7
18.2
19.6
-
-
Bank of Baroda
Neutral
182
-
40,282
18,934
21,374
2.0
2.0
13.2
15.1
13.8
12.1
1.0
0.9
7.1
7.7
-
-
Bank of India
Neutral
169
-
11,250
17,402
20,003
2.0
2.1
40.3
50.7
4.2
3.3
0.4
0.4
9.0
10.4
-
-
Canara Bank
Neutral
308
-
15,891
15,805
17,745
2.0
2.2
64.3
73.5
4.8
4.2
0.5
0.5
10.8
11.3
-
-
Dena Bank
Neutral
45
-
2,514
3,580
4,040
2.1
2.2
8.4
10.9
5.4
4.1
0.5
0.4
6.8
8.4
-
-
Federal Bank
Neutral
67
-
11,524
3,522
4,045
3.2
3.2
12.2
14.1
5.5
4.8
0.7
0.6
12.9
13.4
-
-
HDFC
Neutral
1,306
-
205,836
11,198
13,321
3.5
3.5
45.1
53.7
29.0
24.3
6.0
5.4
27.2
28.2
-
-
HDFC Bank
Accumulate
1,094
1,255
274,992
38,629
47,500
4.5
4.7
52.6
66.4
20.8
16.5
3.8
3.2
19.6
21.2
-
-
ICICI Bank
Buy
310
370
179,809
36,037
41,647
3.5
3.6
22.9
26.7
13.5
11.6
2.3
2.0
15.7
15.9
-
-
IDBI Bank
Neutral
66
-
10,626
9,806
11,371
1.7
1.9
10.0
16.3
6.7
4.1
0.5
0.4
6.8
10.4
-
-
Market Outlook
August 11, 2015
Stock Watch
Company Name
Reco
CMP
Target
Mkt Cap
Sales ( Čcr )
OPM(%)
EPS (Č)
PER(x)
P/BV(x)
RoE(%)
EV/Sales(x)
(Č)
Price ( Č)
( Č cr )
FY16E FY17E
FY16E
FY17E
FY16E
FY17E
FY16E
FY17E
FY16E
FY17E
FY16E
FY17E
FY16E
FY17E
Financials
Indian Bank
Neutral
150
-
7,214
6,454
7,321
2.5
2.6
26.4
33.3
5.7
4.5
0.5
0.4
8.1
9.6
-
-
LIC Housing Finance
Buy
507
590
25,574
2,934
3,511
2.3
2.3
30.9
36.8
16.4
13.8
2.6
2.3
16.8
17.5
-
-
Oriental Bank
Neutral
176
-
5,268
7,930
8,852
2.5
2.5
51.8
57.1
3.4
3.1
0.4
0.3
9.3
9.5
-
-
Punjab Natl.Bank
Neutral
159
-
29,515
24,160
27,777
2.9
3.0
18.5
24.6
8.6
6.5
0.8
0.7
8.8
10.8
-
-
South Ind.Bank
Neutral
23
-
3,126
1,999
2,249
2.4
2.4
3.5
4.0
6.7
5.8
0.8
0.8
12.6
13.1
-
-
St Bk of India
Neutral
283
-
214,200
86,900
100,550
3.1
3.1
22.1
27.7
12.8
10.2
1.6
1.4
12.7
14.3
-
-
Union Bank
Neutral
206
-
13,110
12,995
14,782
2.4
2.4
32.3
40.9
6.4
5.1
0.8
0.6
10.7
12.3
-
-
Vijaya Bank
Neutral
40
-
3,436
3,474
3,932
1.8
1.9
5.9
7.2
6.8
5.6
0.6
0.5
8.1
9.3
-
-
Yes Bank
Buy
817
989
34,157
7,006
8,825
3.1
3.3
61.4
77.1
13.3
10.6
2.5
2.1
20.1
21.3
-
-
FMCG
Asian Paints
Neutral
901
-
86,419
16,553
19,160
16.0
16.2
17.7
21.5
51.0
41.9
13.5
12.2
29.4
31.2
5.0
4.4
Britannia
Neutral
3,312
-
39,738
8,065
9,395
9.6
10.2
47.2
65.5
70.2
50.6
23.3
22.0
38.3
41.2
4.6
4.0
Colgate
Neutral
2,034
-
27,658
4,836
5,490
19.5
19.7
48.5
53.2
41.9
38.2
30.7
26.8
99.8
97.5
5.6
5.0
Dabur India
Neutral
305
-
53,627
9,370
10,265
17.1
17.2
7.3
8.1
41.6
37.7
12.6
10.2
33.7
30.6
5.7
5.2
GlaxoSmith Con*
Neutral
6,277
-
26,399
4,919
5,742
17.2
17.4
168.3
191.2
37.3
32.8
10.6
9.0
28.8
28.9
4.9
4.2
Godrej Consumer
Neutral
1,400
-
47,685
10,168
12,886
16.1
16.1
32.1
38.4
43.6
36.5
8.9
8.2
19.7
21.0
4.8
3.8
HUL
Neutral
906
-
195,944
34,940
38,957
17.5
17.7
20.8
24.7
43.5
36.7
48.4
38.7
110.5
114.2
5.4
4.8
ITC
Buy
321
409
257,120
41,068
45,068
37.8
37.4
13.9
15.9
23.0
20.2
7.7
6.8
34.1
33.8
6.0
5.4
Marico
Neutral
436
-
28,155
6,551
7,766
15.7
16.0
10.4
12.5
42.1
34.9
12.2
10.2
33.2
32.4
4.2
3.6
Nestle*
Neutral
6,386
-
61,571
11,291
12,847
22.2
22.3
158.9
184.6
40.2
34.6
21.0
18.9
55.0
57.3
5.4
4.7
Tata Global
Accumulate
139
152
8,763
8,635
9,072
9.8
9.9
6.5
7.6
21.4
18.3
2.1
2.0
6.8
7.4
1.0
0.9
IT
HCL Tech^
Buy
935
1,100
131,445
41,535
46,519
24.0
23.4
56.6
61.1
16.5
15.3
3.4
2.7
20.8
17.7
3.1
2.6
Infosys
Buy
1,082
1,306
248,518
60,250
66,999
28.0
28.0
58.3
63.7
18.6
17.0
3.9
3.3
20.9
19.7
3.5
3.0
TCS
Buy
2,571
3,168
503,550
108,420
123,559
28.8
28.7
127.2
143.9
20.2
17.9
8.1
7.5
39.9
41.8
4.2
3.6
Tech Mahindra
Buy
531
646
51,085
25,566
28,890
16.0
17.0
26.3
31.9
20.2
16.7
3.6
3.1
17.9
18.6
1.8
1.5
Wipro
Buy
564
719
139,192
52,414
58,704
23.7
23.8
38.4
42.3
14.7
13.3
2.9
2.6
19.5
18.0
2.3
1.9
Media
D B Corp
Accumulate
326
356
5,983
2,241
2,495
27.8
27.9
21.8
25.6
15.0
12.7
3.9
3.5
26.7
28.5
2.6
2.3
HT Media
Neutral
88
-
2,038
2,495
2,603
11.2
11.2
7.3
8.6
12.0
10.2
1.0
0.9
7.4
8.1
0.3
0.3
Jagran Prakashan
Accumulate
142
156
4,652
1,939
2,122
26.0
26.0
8.3
9.2
17.1
15.5
2.9
2.6
17.5
17.1
2.3
2.1
Sun TV Network
Neutral
341
-
13,436
2,779
3,196
70.2
70.5
22.8
27.3
15.0
12.5
3.7
3.3
26.7
28.3
4.5
3.9
Market Outlook
August 11, 2015
Stock Watch
Company Name
Reco
CMP
Target
Mkt Cap
Sales ( Čcr )
OPM(%)
EPS (Č)
PER(x)
P/BV(x)
RoE(%)
EV/Sales(x)
(Č)
Price ( Č)
( Č cr )
FY16E FY17E
FY16E
FY17E
FY16E
FY17E
FY16E
FY17E
FY16E
FY17E
FY16E
FY17E
FY16E
FY17E
Media
Hindustan Media
Buy
240
292
1,761
920
1,031
20.0
20.0
19.2
20.9
12.5
11.5
2.1
1.8
16.4
15.3
1.5
1.3
Ventures
Metals & Mining
Coal India
Accumulate
409
450
258,308
77,595
89,628
22.9
24.4
27.6
30.0
14.8
13.6
6.4
6.4
33.9
33.2
2.7
2.3
Hind. Zinc
Neutral
154
-
65,028
15,546
16,821
47.5
49.0
19.7
20.3
7.8
7.6
1.3
1.2
17.2
16.6
2.0
1.5
Hindalco
Neutral
108
-
22,281
112,328
119,817
7.7
7.9
16.3
20.1
6.6
5.4
0.5
0.5
8.0
8.5
0.7
0.6
JSW Steel
Neutral
915
-
22,126
48,125
53,595
18.8
21.0
46.9
97.5
19.5
9.4
1.0
0.9
4.4
9.5
1.3
1.1
NMDC
Neutral
104
-
41,352
12,544
13,330
59.5
59.7
16.3
16.5
6.4
6.3
1.1
1.1
5.1
9.9
2.0
2.0
SAIL
Neutral
60
-
24,925
56,365
63,383
6.9
8.0
7.1
8.2
8.5
7.4
0.5
0.5
7.0
7.1
1.0
0.9
Vedanta
Neutral
128
-
37,889
81,842
88,430
30.6
32.8
20.2
25.7
6.3
5.0
0.5
0.4
7.5
8.5
0.8
0.6
Tata Steel
Neutral
261
-
25,363
136,805
149,228
11.3
11.9
26.4
36.8
9.9
7.1
0.8
0.7
6.0
8.0
0.7
0.7
Oil & Gas
Cairn India
Neutral
164
-
30,757
12,617
14,513
33.7
40.0
25.5
27.7
6.4
5.9
0.5
0.5
7.4
7.7
1.1
0.9
GAIL
Neutral
344
-
43,686
75,595
85,554
8.6
8.0
31.8
36.1
10.8
9.5
1.2
1.1
10.7
11.4
0.7
0.6
ONGC
Neutral
275
-
235,362
174,773
192,517
22.7
24.8
34.6
38.2
8.0
7.2
1.1
1.0
14.2
14.9
1.5
1.3
Petronet LNG
Neutral
188
-
14,100
45,759
49,386
3.7
4.0
12.6
14.9
14.9
12.6
2.3
2.0
16.1
16.7
0.4
0.3
Reliance Industries
Accumulate
970
1,050
314,133
339,083
384,014
7.8
9.5
75.7
94.5
12.8
10.3
1.3
1.2
10.7
12.2
1.3
1.1
Pharmaceuticals
Alembic Pharma
Neutral
669
-
12,620
2,601
3,115
21.2
20.2
20.8
23.9
32.2
28.0
10.3
7.8
37.2
31.8
5.2
4.3
Aurobindo Pharma
Accumulate
779
824
45,470
14,435
16,600
22.6
22.6
36.1
41.2
21.6
18.9
6.4
4.9
34.5
29.3
3.5
3.0
Aventis*
Neutral
4,092
-
9,423
2,156
2,455
15.1
16.8
109.7
133.9
37.3
30.6
5.1
4.2
18.4
22.5
4.1
3.4
Cadila Healthcare
Neutral
1,897
-
38,837
10,224
11,840
19.7
20.0
69.8
81.0
27.2
23.4
7.2
5.7
26.8
25.3
3.9
3.3
Cipla
Neutral
715
-
57,450
14,051
16,515
18.9
18.7
25.1
28.9
28.5
24.8
4.6
3.9
17.2
16.9
4.1
3.4
Dr Reddy's
Neutral
4,258
-
72,598
17,903
20,842
22.7
22.8
160.5
189.5
26.5
22.5
5.4
4.5
22.2
21.7
4.0
3.4
Dishman Pharma
Buy
207
278
1,670
1,716
1,888
20.2
20.2
16.3
21.6
12.7
9.6
1.2
1.1
9.7
11.7
1.1
0.9
GSK Pharma*
Neutral
3,601
-
30,501
2,870
3,158
20.0
22.1
59.5
68.3
60.5
52.7
17.9
18.3
28.5
34.3
10.3
9.4
Indoco Remedies
Neutral
338
-
3,110
1,088
1,262
18.2
18.2
13.1
15.5
25.8
21.8
5.0
4.2
21.2
21.1
3.0
2.6
Ipca labs
Neutral
758
-
9,566
3,507
4,078
17.6
18.6
25.8
32.0
29.4
23.7
3.8
3.3
13.8
14.9
3.1
2.6
Lupin
Neutral
1,698
-
76,400
14,864
17,244
26.9
26.9
62.1
71.1
27.3
23.9
6.6
5.3
27.4
24.6
4.9
4.1
Sun Pharma
Accumulate
842
950
202,507
27,839
33,542
27.7
29.7
18.9
26.9
44.5
31.3
4.0
3.5
13.0
14.6
6.7
5.3
Power
Tata Power
Neutral
69
-
18,689
38,302
38,404
14.1
13.1
5.1
6.0
13.5
11.6
1.3
1.2
9.2
10.3
1.4
1.3
NTPC
Neutral
131
-
108,263
89,067
98,329
15.9
16.5
12.1
13.1
10.9
10.1
1.2
1.1
11.0
11.6
2.3
2.2
Power Grid
Buy
138
170
72,248
19,986
22,702
86.2
86.3
11.1
12.7
12.4
10.9
1.7
1.5
14.4
14.7
8.8
8.1
Market Outlook
August 11, 2015
Stock Watch
Company Name
Reco
CMP
Target
Mkt Cap
Sales ( Čcr )
OPM(%)
EPS (Č)
PER(x)
P/BV(x)
RoE(%)
EV/Sales(x)
(Č)
Price ( Č)
( Č cr )
FY16E FY17E
FY16E
FY17E
FY16E
FY17E
FY16E
FY17E
FY16E
FY17E
FY16E
FY17E
FY16E
FY17E
Telecom
Bharti Airtel
Neutral
410
-
163,933
101,748
109,191
32.1
31.7
12.0
12.5
34.2
32.8
2.4
2.2
6.9
6.7
2.3
2.0
Idea Cellular
Neutral
164
-
59,001
34,282
36,941
32.0
31.5
5.9
6.2
27.8
26.4
2.6
2.3
9.9
9.3
2.3
2.2
zOthers
Abbott India
Neutral
4,549
-
9,666
2,713
3,141
13.7
13.5
127.8
145.7
35.6
31.2
8.3
6.8
25.9
23.9
3.5
2.9
Bajaj Electricals
Buy
276
341
2,785
4,719
5,287
5.2
5.8
8.6
12.7
32.3
21.8
3.7
3.2
11.4
14.8
0.6
0.5
Finolex Cables
Neutral
263
-
4,027
2,728
3,036
10.8
11.0
14.4
16.8
18.3
15.7
2.8
2.4
15.2
15.3
1.2
1.0
Goodyear India*
Neutral
632
-
1,457
1,536
1,683
9.6
10.0
41.8
48.0
15.1
13.2
2.6
2.3
18.2
18.3
0.7
0.6
Hitachi
Neutral
1,382
-
3,759
1,806
2,112
9.0
9.2
28.6
29.1
48.3
47.5
12.0
9.7
28.1
22.6
2.2
1.9
Jyothy Laboratories
Neutral
311
-
5,635
1,620
1,847
11.5
11.5
7.3
8.5
42.7
36.8
5.5
5.1
13.3
14.4
3.3
2.8
MRF
Neutral
44,488
-
18,868
20,727
14,841
19.3
18.6
4,905.8
3,351.9
9.1
13.3
2.9
2.4
37.6
19.6
0.9
1.2
Page Industries
Neutral
14,709
-
16,406
1,929
2,450
19.8
20.1
229.9
299.0
64.0
49.2
28.2
19.6
52.1
47.1
8.5
6.7
Relaxo Footwears
Neutral
565
-
6,783
1,767
2,152
12.3
12.5
19.3
25.1
29.4
22.6
7.2
5.5
27.7
27.8
3.9
3.2
Siyaram Silk Mills
Neutral
1,247
-
1,169
1,653
1,873
11.7
12.2
99.3
122.1
12.6
10.2
2.3
1.9
19.5
20.2
0.9
0.8
Styrolution ABS India*
Neutral
856
-
1,505
1,271
1,440
8.6
9.2
32.0
41.1
26.7
20.9
2.7
2.4
10.7
12.4
1.2
1.0
Tree House
Accumulate
392
433
1,658
259
324
56.8
56.8
17.0
21.7
23.0
18.1
2.3
2.1
10.1
11.5
6.4
5.3
TVS Srichakra
Neutral
2,879
-
2,204
2,112
2,389
11.9
12.1
168.5
202.5
17.1
14.2
5.9
4.4
39.6
35.5
1.1
1.0
HSIL
Buy
277
434
2,004
2,085
2,436
18.5
18.6
21.7
28.9
12.8
9.6
1.3
1.2
10.0
12.1
1.1
0.9
Kirloskar Engines India
Neutral
285
-
4,116
2,634
3,252
10.1
12.0
10.9
17.4
26.1
16.3
2.9
2.6
11.4
16.8
1.3
1.0
Ltd
M M Forgings
Buy
672
797
811
563
671
22.1
22.9
51.0
66.5
13.2
10.1
2.8
2.2
23.1
24.1
1.6
1.3
Banco Products (India)
Neutral
137
-
981
1,208
1,353
11.0
12.3
10.8
14.5
12.7
9.5
1.5
1.3
11.9
14.5
0.8
0.7
Competent Automobiles Neutral
184
-
113
1,007
1,114
3.1
3.1
23.7
28.2
7.8
6.5
1.1
1.0
13.9
14.6
0.1
0.1
Nilkamal
Neutral
1,093
-
1,631
1,948
2,147
10.6
10.3
60.0
67.0
18.2
16.3
2.8
2.5
16.8
16.1
0.9
0.8
Visaka Industries
Neutral
173
-
275
1,158
1,272
8.6
9.5
23.7
32.7
7.3
5.3
0.7
0.7
10.1
12.5
0.4
0.3
Transport Corporation of
Neutral
290
-
2,194
2,830
3,350
8.8
9.0
14.4
18.3
20.2
15.8
3.1
2.7
15.4
17.1
0.9
0.8
India
Elecon Engineering
Neutral
89
-
970
1,452
1,596
13.7
14.7
4.2
6.2
21.5
14.3
1.7
1.5
8.1
11.2
1.0
0.8
Surya Roshni
Buy
148
193
651
2,992
3,223
8.4
8.7
15.2
19.3
9.8
7.7
0.9
0.8
10.1
11.5
0.5
0.5
MT Educare
Buy
122
141
486
275
355
18.3
17.3
7.4
8.8
16.5
13.8
3.3
2.9
20.2
21.1
1.7
1.3
Radico Khaitan
Accumulate
98
112
1,306
1,565
1,687
11.9
12.4
5.4
6.6
18.1
14.9
1.5
1.3
8.0
9.0
1.3
1.3
Garware Wall Ropes
Buy
298
390
652
875
983
10.4
10.6
23.1
27.8
12.9
10.7
1.8
1.6
14.1
14.8
0.7
0.6
Source: Company, Angel Research; Note: *December year end; #September year end; &October year end; Price as on August 10, 2015
Market Outlook
August 11, 2015
Research Team Tel: 022 - 39357800
DISCLAIMER
Angel Broking Private Limited (hereinafter referred to as “Angel”) is a registered Member of National Stock Exchange of India Limited,
Bombay Stock Exchange Limited and MCX Stock Exchange Limited. It is also registered as a Depository Participant with CDSL and
Portfolio Manager with SEBI. It also has registration with AMFI as a Mutual Fund Distributor. Angel Broking Private Limited is a registered
entity with SEBI for Research Analyst in terms of SEBI (Research Analyst) Regulations, 2014 vide registration number INH000000164.
Angel or its associates has not been debarred/ suspended by SEBI or any other regulatory authority for accessing /dealing in securities
Market. Angel or its associates including its relatives/analyst do not hold any financial interest/beneficial ownership of more than 1% in
the company covered by Analyst. Angel or its associates/analyst has not received any compensation / managed or co-managed public
offering of securities of the company covered by Analyst during the past twelve months. Angel/analyst has not served as an officer,
director or employee of company covered by Analyst and has not been engaged in market making activity of the company covered by
Analyst.
This document is solely for the personal information of the recipient, and must not be singularly used as the basis of any investment
decision. Nothing in this document should be construed as investment or financial advice. Each recipient of this document should make
such investigations as they deem necessary to arrive at an independent evaluation of an investment in the securities of the companies
referred to in this document (including the merits and risks involved), and should consult their own advisors to determine the merits and
risks of such an investment.
Reports based on technical and derivative analysis center on studying charts of a stock's price movement, outstanding positions and
trading volume, as opposed to focusing on a company's fundamentals and, as such, may not match with a report on a company's
fundamentals.
The information in this document has been printed on the basis of publicly available information, internal data and other reliable sources
believed to be true, but we do not represent that it is accurate or complete and it should not be relied on as such, as this document is for
general guidance only. Angel Broking Pvt. Limited or any of its affiliates/ group companies shall not be in any way responsible for any
loss or damage that may arise to any person from any inadvertent error in the information contained in this report. Angel Broking Pvt.
Limited has not independently verified all the information contained within this document. Accordingly, we cannot testify, nor make any
representation or warranty, express or implied, to the accuracy, contents or data contained within this document. While Angel Broking
Pvt. Limited endeavors to update on a reasonable basis the information discussed in this material, there may be regulatory, compliance,
or other reasons that prevent us from doing so.
This document is being supplied to you solely for your information, and its contents, information or data may not be reproduced,
redistributed or passed on, directly or indirectly.
Neither Angel Broking Pvt. Limited, nor its directors, employees or affiliates shall be liable for any loss or damage that may arise from or
in connection with the use of this information.
Note: Please refer to the important ‘Stock Holding Disclosure' report on the Angel website (Research Section). Also, please refer to the
latest update on respective stocks for the disclosure status in respect of those stocks. Angel Broking Pvt. Limited and its affiliates may have
investment positions in the stocks recommended in this report.