Market Outlook
May 11, 2016
Market Cues
Domestic Indices
Chg (%)
(Pts)
(Close)
BSE Sensex
0.33
84
25,773
Indian markets are expected to open on a negative note tracking the SGX Nifty.
Nifty
0.28
22
7,887
There could be some knee jerk reaction after the news that India and Mauritius has
signed the Double Taxation Avoidance Agreement, under which capital gains
Mid Cap
0.20
23
11,124
earned by Mauritian entity will be taxable In India at the full domestic tax rate from
Small Cap
0.11
12
11,042
FY19-20 onwards.
Bankex
0.62
117
19.110
The S&P 500 and Dow industrials steadily climbed to session highs Tuesday, to end
with their best one-day percentage gains in two months as oil prices rallied. The
Global Indices
Chg (%)
(Pts)
(Close)
Dow Jones Industrial Average DJIA, +1.26% surged 222 points, or 1.3%, to 17,928.
Dow Jones
1.26
222
17,928
The percentage gain in both the S&P 500 and Dow industrials was their biggest
Nasdaq
1.26
59
4809
since March 11. Meanwhile, the Nasdaq Composite Index COMP, +1.26% climbed
59.67 points, or 1.3%, to 4,809.88, its biggest one-day gain in a month.
FTSE
0.7
42
6156
Nikkei
2.15
349
16,565
European stocks moved up Tuesday as gains for Credit Suisse AG and Volkswagen
AG shares and an important breakthrough on the Greek debt crisis allowed
Hang Seng
0.43
86
20,242
investors to set aside disappointing economic data.
Shanghai Com
0.02
0.4
2,833
After Monday’s Bull Run, Indian markets consolidated with a modest gain and
NIFTY and Sensex ended with a gain of 22 points and 84 points respectively.
Advances / Declines
BSE
NSE
Though Banks and IT stocks witnessed buying interest, while metals and energy
stocks remained weak.
Advances
1,255
748
Declines
1350
774
News & Result Analysis
Unchanged
160
102
Result Review: Radico Khaitan; Visaka Industries
Detailed analysis on Pg2
Volumes (` Cr)
BSE
2,350
Investor’s Ready Reckoner
NSE
16,384
Key Domestic & Global Indicators
Stock Watch: Latest investment recommendations on 150+ stocks
Net Inflows (` Cr)
Net
Mtd
Ytd
Refer Pg5 onwards
FII
295
(273)
11,517
Top Picks
MFs
15
390
2,985
CMP
Target
Upside
Company
Sector
Rating
(`)
(`)
(%)
Top Gainers
Price (`)
Chg (%)
Amara Raja
Auto & Auto Ancillary Accumulate
952
1,076
13.0
HCL Tech
IT
Buy
720
1,038
44.2
Naukri
754
5.05
LIC Housing
Financials
Buy
461
592
28.3
KSCL
404
4.87
Bharat Electronics
Capital Goods
Buy
1,169
1,414
20.9
Redington
106
4.01
Navkar Corporation Others
Buy
176
265
50.7
Enginersin
181
3.96
More Top Picks on Pg4
Cadilahc
333
3.88
Key Upcoming Events
Previous
Consensus
Top Losers
Price (`)
Chg (%)
Date
Region
Event Description
Reading
Expectations
Justdial
39
(5.08)
May 11 China
Consumer Price Index (%)
2.30
2.30
JPAssociat
7
(4.05)
May 12 US
Initial Jobless claims
274
270
Aloktext
4
(3.94)
May 12 Euro zone
Euro zone GDP (QoQ)
(0.60)
(0.60)
Muthootfin
207
(3.77)
May 12 India
Industrial Production YoY
2.00
--
6.(
More Events on Pg5
Tatamotors
389
(3.58)
As on May 10, 2016
Market Outlook
May 11, 2016
Radico Khaitan (CMP:92 /Target Price:156 /Upside 69% )
For 4QFY2016, Radico Khaitan outperformed our estimates on the top-line front
although the bottom-line came in flat YoY. Revenues rose to ~INR 378cr, which is
higher than our estimate of INR 351cr on the back of healthy volume growth. On
the operating front, the company’s margin improved by 61bp YoY to 10.3%,
primarily on account of lower selling & distribution expenses and other
expenditure. However, raw material cost increased 331bp yoy. The company
reported net profit of INR14.8cr (which was flat growth YoY) on account of higher
taxes.
The company has not performed well in the last two years due to increasing raw
material costs (ENA is a key raw material) and with it not receiving significant price
hikes from various states. We expect the company to perform well going forward
in anticipation of better price hikes & healthy sales growth in premium products.
This would result in an overall improvement in the operating margin of the
company. We currently have positive view on Radico Khaitan.
Visaka Industries
For 4QFY2016, Visaka Industries posted a muted set of numbers. The top-line for
the quarter declined by 3.3% yoy to INR 276cr which can be attributed to lower
volumes and realization from sale of asbestos cement products (building products),
and decline in realization for the synthetic yarn segment. On the operating front,
the EBITDA margin expanded by 60bp yoy to 10.0% on account of lower other
expenses. Aided by lower interest and depreciation expense, the adj. net profit
grew by 63.6% yoy to INR 10cr.
The building products segment revenue declined by 3.3% yoy to INR 229cr while
the synthetic yarn segment revenue was flat on yoy basis at INR 45cr. However, the
EBIT margin of building products segment expanded by 123bp yoy to 8.1% while
the synthetic yarn segment margin were flat at 13.5%.
The company has experienced marginal de-growth of 1.6% in revenue for FY2016
as poor rural sentiment has impacted overall demand for its building products
segment. We believe that the performance of the segment will likely remain under
pressure in the near term. Moreover, the Synthetic Yarn business is performing well
which in the longer run should benefit from rise in textile exports. We maintain our
Buy recommendation on the stock and will revise out target price post
management interaction.
Economic and Political News
Maharastra to soon launch Rs 1 lakh cr projects in Mumbai.
AC, Refrigerators sales hit 5 year high in March,2016
Fresh Capital to PSU banks to be linked to performance
Corporate News
JSW Steel joins race to buy Tata Steel’s UK business.
Yes Bank seeks shareholders approvals for raising Rs 16,500 cr
Dena Bank targets 15% credit growth in FY17
Market Outlook
May 11, 2016
Quarterly Bloomberg Brokers Consensus Estimate
Asian Paints Ltd. Consol - May 11, 2016
Particulars (` cr)
4QFY16E
4QFY15
y-o-y (%)
3QFY16
q-o-q (%)
Net sales
3,860
3,490
10.6
4,103
(5.9)
EBITDA
691
559
23.5
801
(13.7)
EBITDA margin (%)
17.9
16.0
19.5
Net profit
436
341
27.9
516
(15.5)
Kotak Mahindra Bank Ltd. - May 11, 2016
Particulars (` cr)
4QFY16E
4QFY15
y-o-y (%)
3QFY15
q-o-q (%)
Net profit
670
527
27.1
945
(29.1)
Dr. Reddy’s Laboratories Ltd. Consol - May 12, 2016
Particulars (` cr)
4QFY16E
4QFY15
y-o-y (%)
3QFY16
q-o-q (%)
Net sales
3,981
3,870
2.9
3,968
0.3
EBITDA
976
765
27.5
926
5.3
EBITDA margin (%)
24.5
19.8
23.3
Net profit
576
519
11.1
579
(0.5)
Nestle India Ltd. Consol - May 12, 2016
Particulars (` cr)
1QCY16E
1QCY15
y-o-y (%)
4QCY15
q-o-q (%)
Net sales
2,161
2,507
(13.8)
1,946
11.0
EBITDA
455
612
(25.6)
379
20.2
EBITDA margin (%)
21.1
24.4
19.5
Net profit
258
320
(19.4)
183
40.9
Glenmark Pharmaceuticals Ltd. Consol - May 12, 2016
Particulars (` cr)
4QFY16E
4QFY15
y-o-y (%)
3QFY16
q-o-q (%)
Net sales
1,889
1,754
7.7
1,764
7.1
EBITDA
398
281
41.5
370
7.7
EBITDA margin (%)
21.1
16.0
21.0
Net profit
209
198
5.5
170
22.7
Market Outlook
May 11, 2016
Top Picks
Large Cap
Market Cap
CMP
Target
Upside
Company
Rationale
(` Cr)
(`)
(`)
(%)
To outpace battery industry growth due to better technological
Amara Raja Batteries
16,262
952
1,076
13.0
products leading to market share gains in both the automotive
OEM and replacement segments.
Uptick in defense capex by government when coupled with
Bharat Electronics
28,060
1,169
1,414
20.9
BELs strong market positioning, indicate that good times are
ahead for BEL.
The stock is trading at attractive valuations and is factoring all
HCL Tech
1,01,560
720
1,038
44.2
the bad news.
Strong visibility for a robust 20% earnings trajectory, coupled
HDFC Bank
2,89,521
1,145
1,262
10.3
with high quality of earnings on account of high quality retail
business and strategic focus on highly rated corporates.
Back on the growth trend, expect a long term growth of 14%
Infosys
2,79,425
1,213
1,374
13.3
to be a US$20bn in FY2020.
LICHF continues to grow its retail loan book at a healthy pace
with improvement in asset quality. We expect the company to
LIC Housing Finance
23,270
461
592
28.3
post a healthy loan book which is likely to reflect in a strong
earnings growth.
Huge bid pipeline of re-development works at Delhi and other
NBCC
11,672
973
1,089
12.0
State Governments and opportunity from Smart City, positions
NBCC to report strong growth, going forward.
Source: Company, Angel Research
Mid Cap
Market Cap
CMP
Target
Upside
Company
Rationale
(` Cr)
(`)
(`)
(%)
Favorable outlook for the AC industry to augur well for
Cooling products business which is out pacing the market
Blue Star
3,872
431
481
11.7
growth. EMPPAC division's profitability to improve once
operating environment turns around.
With a focus on the low and medium income (LMI) consumer
Dewan Housing
5,837
200
270
35.0
segment, the company has increased its presence in tier-II &
III cities where the growth opportunity is immense.
Commencement of new projects, downtrend in the interest
IL&FS Transport
2,385
73
93
28.3
rate cycle, to lead to stock re-rating
Economic recovery to have favourable impact on advertising
& circulation revenue growth. Further, the acquisition of a
Jagran Prakashan
5,536
169
205
21.1
radio business (Radio City) would also boost the company's
revenue growth.
Speedier execution and speedier sales, strong revenue visibilty
Mahindra Lifespace
1,853
452
554
22.7
in short-to-long run, attractive valuations
Massive capacity expansion along with rail advantage at ICD
Navkar Corporation
2,508
176
265
50.7
as well CFS augurs well for the company
Earnings boost on back of stable material prices and
Radico Khaitan
1,224
92
156
69.6
favourable pricing environment. Valuation discount to peers
provides additional comfort
Strong brands and distribution network would boost growth
Siyaram Silk Mills
1,002
1,069
1,354
26.6
going ahead. Stock currently trades at an inexpensive
valuation.
Source: Company, Angel Research
Market Outlook
May 11, 2016
Key Upcoming Events
Result Calendar
Date
Company
May 11, 2016
Apollo Tyres, Kotak Mah. Bank, Indian Bank, Oriental Bank, South Ind.Bank, Asian Paints, TVS Srichakra, Quick Heal
May 12, 2016
Vijaya Bank, Bank of Maharashtra, Nestle, ITD Cementation, Dr Reddy's, Glenmark Pharma.
May 13, 2016
Bank of Baroda, Allahabad Bank, Central Bank, UCO Bank, Dena Bank, Indraprasth Gas, Cadila Healthcare
May 14, 2016
Electrosteel Castings, Relaxo
May 16, 2016
JK Tyre, Styrolution
May 17, 2016
Motherson Sumi, Bharat Forge, Syndicate Bank, GlaxoSmith Con
Source: Bloomberg, Angel Research
Global economic events release calendar
Date
Time
Country
Event Description
Unit
Period
Bloomberg Data
Last Reported Estimated
May 11, 2016 7:00AM China
Consumer Price Index (YoY)
% Change
Apr
2.30
2.30
May 12, 2016 6:00PM US
Initial Jobless claims
Thousands
May 7
274.00
270.00
2:30PM Euro Zone
Euro-Zone GDP s.a. (QoQ)
% Change
1Q P
0.60
0.60
5:30PM India
Industrial Production YoY
% Change
Mar
2.00
--
May 13, 2016 4:30PM UK
BOE Announces rates
% Ratio
May 12
0.50
0.50
US
Producer Price Index (mom)
% Change
Apr
0.20
--
11:30AM Germany
GDP nsa (YoY)
% Change
1Q P
2.10
1.20
May 14, 201611:00AM China
Industrial Production (YoY)
% Change
Apr
6.80
6.60
May 16, 201612:00PM India
Monthly Wholesale Prices YoY%
% Change
Apr
(0.85)
--
May 17, 2016 2:00PM UK
CPI (YoY)
% Change
Apr
0.50
--
Source: Bloomberg, Angel Research
Market Outlook
May 11, 2016
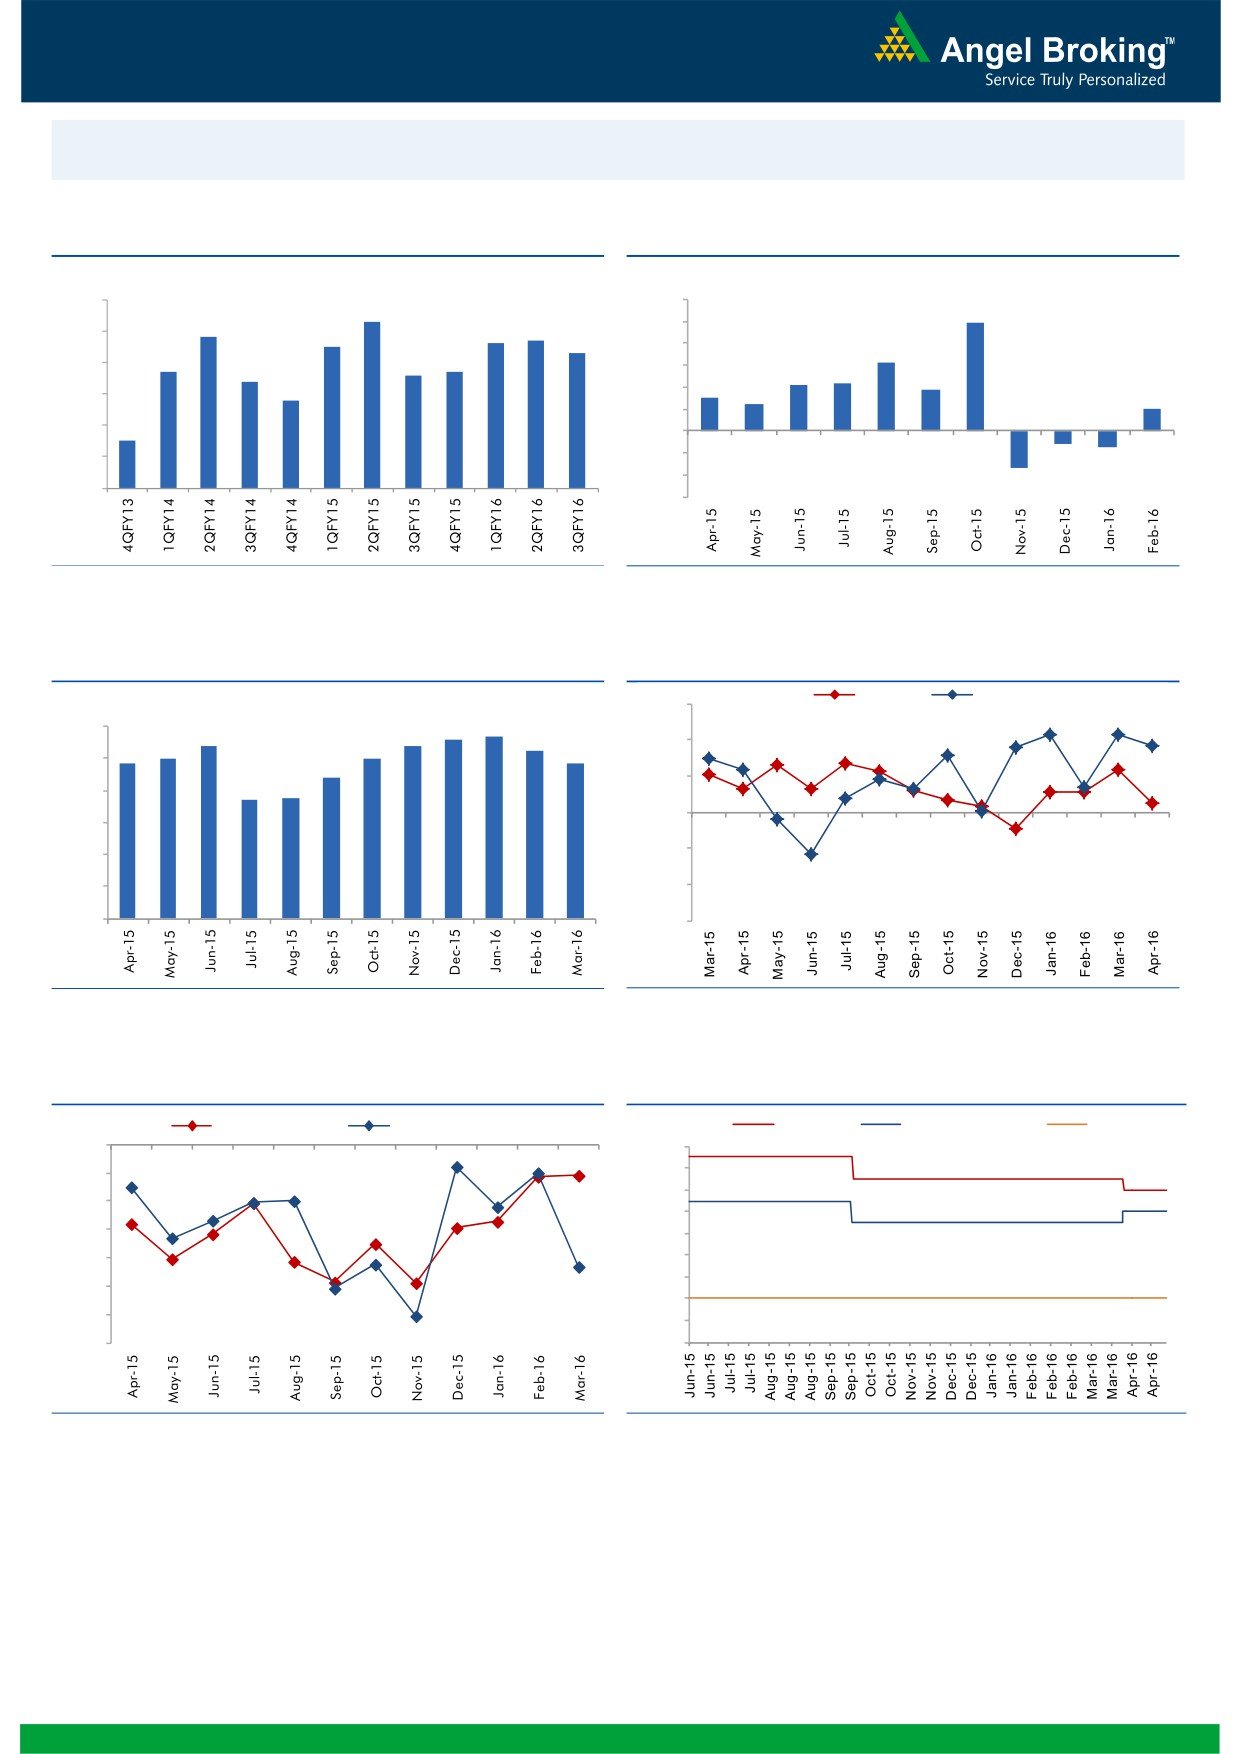
Macro watch
Exhibit 1: Quarterly GDP trends
Exhibit 2: IIP trends
(%)
(%)
9.0
8.3
12.0
9.9
7.8
7.7
10.0
8.0
7.5
7.6
7.3
8.0
6.3
6.7
6.6
6.7
7.0
6.4
6.0
4.2
4.3
3.7
5.8
3.0
2.5
6.0
4.0
2.0
2.0
5.0
4.5
-
4.0
(2.0)
(1.2)
(1.5)
(4.0)
3.0
(3.4)
(6.0)
Source: CSO, Angel Research
Source: MOSPI, Angel Research
Exhibit 3: Monthly CPI inflation trends
Exhibit 4: Manufacturing and services PMI
Mfg. PMI
Services PMI
(%)
56.0
5.6
5.7
6.0
5.4
5.4
5.3
5.0
5.0
54.0
4.9
4.8
5.0
4.4
52.0
3.7
3.7
4.0
50.0
3.0
48.0
2.0
1.0
46.0
-
44.0
Source: MOSPI, Angel Research
Source: Market, Angel Research; Note: Level above 50 indicates expansion
Exhibit 5: Exports and imports growth trends
Exhibit 6: Key policy rates
(%)
Exports yoy growth
Imports yoy growth
(%)
Repo rate
Reverse Repo rate
CRR
0.0
7.50
(5.0)
7.00
6.50
(10.0)
6.00
(15.0)
5.50
(20.0)
5.00
4.50
(25.0)
4.00
(30.0)
3.50
(35.0)
3.00
Source: Bloomberg, Angel Research
Source: RBI, Angel Research
Market Outlook
May 11, 2016
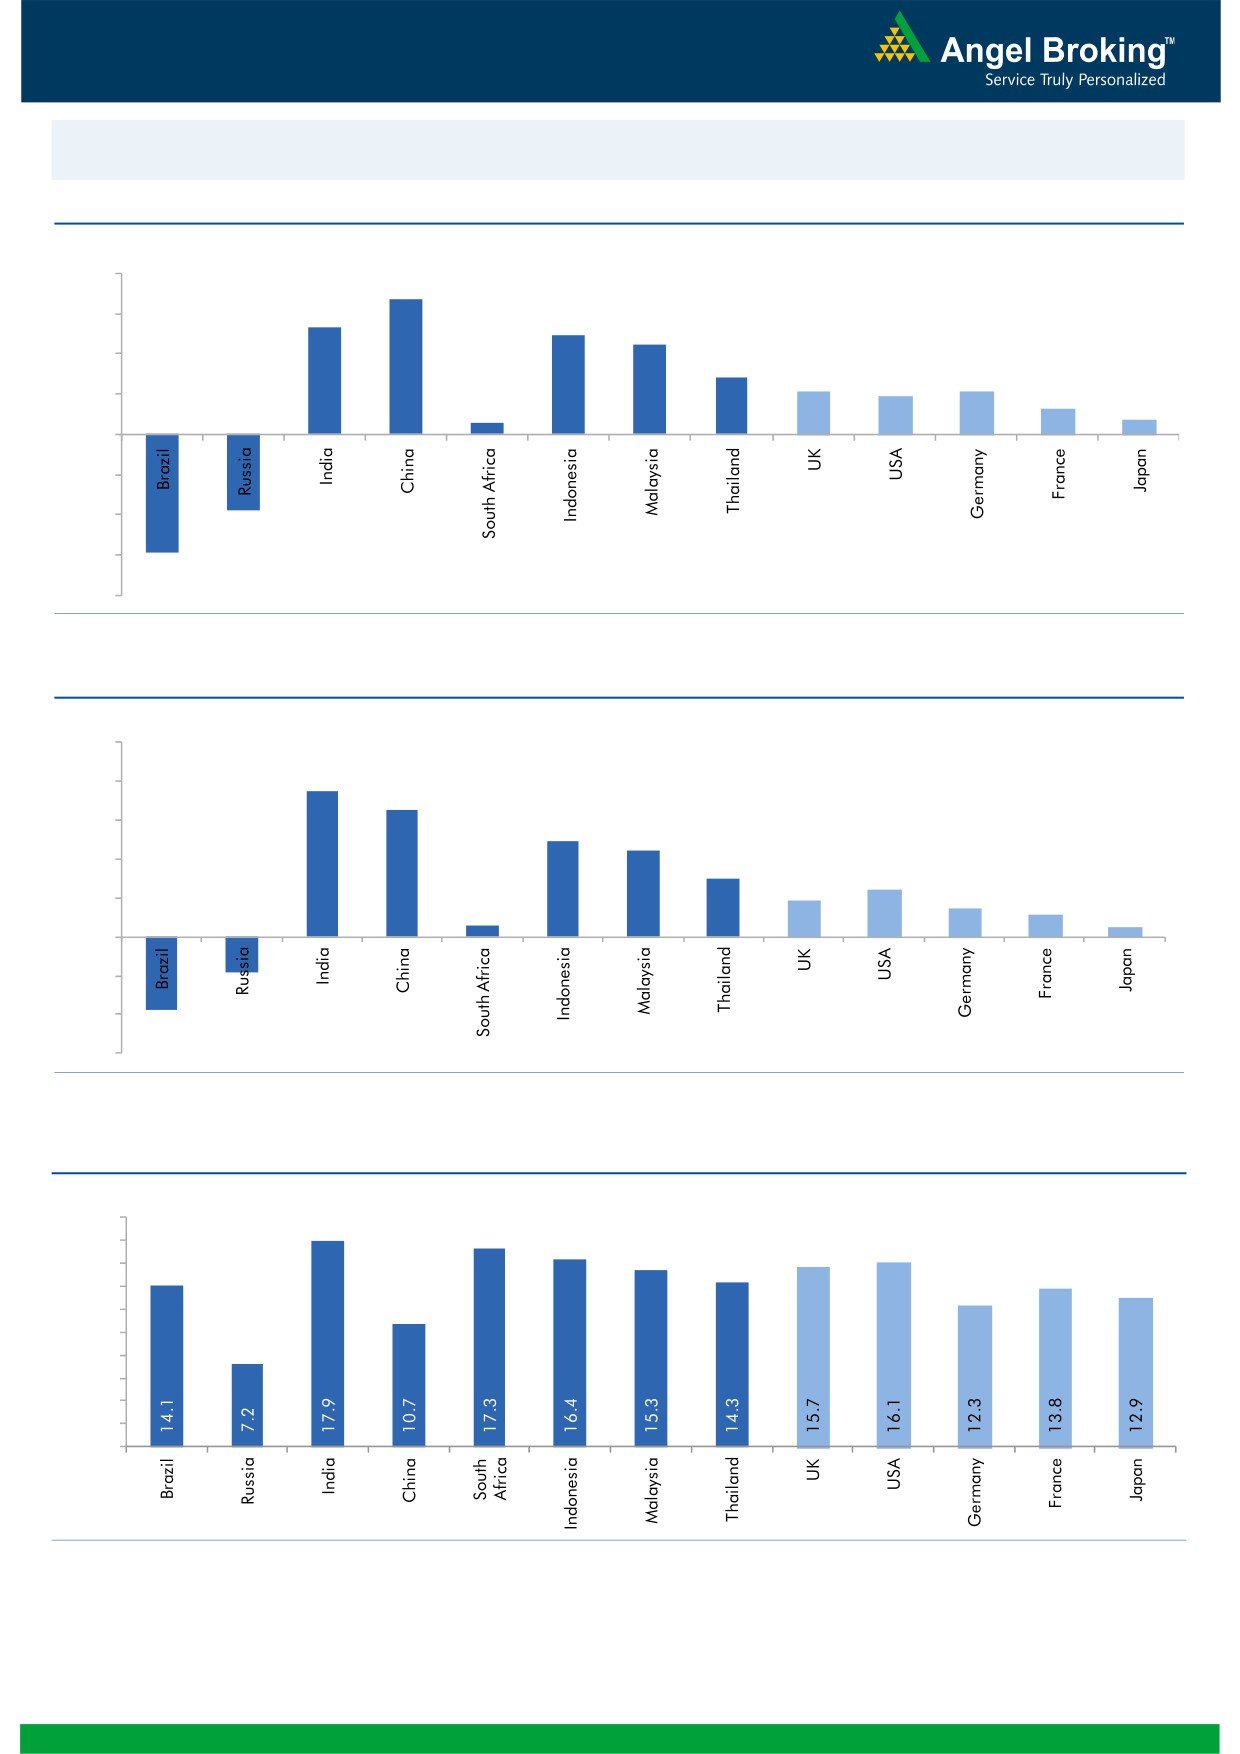
Global watch
Exhibit 1: Latest quarterly GDP Growth (%, yoy) across select developing and developed countries
(%)
8.0
6.7
6.0
5.3
4.9
4.5
4.0
2.8
2.1
1.9
2.1
2.0
1.3
0.6
0.7
-
(2.0)
(4.0)
(3.8)
(6.0)
(5.9)
(8.0)
Source: Bloomberg, Angel Research
Exhibit 2: 2016 GDP Growth projection by IMF (%, yoy) across select developing and developed countries
(%)
10.0
7.5
8.0
6.5
6.0
4.9
4.4
4.0
3.0
2.4
1.9
1.5
2.0
1.1
0.6
0.5
(3.8)
(1.8)
-
(2.0)
(4.0)
(6.0)
Source: IMF, Angel Research
Exhibit 3: One year forward P-E ratio across select developing and developed countries
(x)
20.0
18.0
16.0
14.0
12.0
10.0
8.0
6.0
4.0
2.0
-
Source: IMF, Angel Research
Market Outlook
May 11, 2016
Exhibit 4: Relative performance of indices across globe
Returns (%)
Country
Name of index
Closing price
1M
3M
1YR
Brazil
Bovespa
53,071
9.4
30.0
(7.5)
Russia
Micex
1,885
1.5
8.0
11.8
India
Nifty
7,888
3.7
5.8
(5.2)
China
Shanghai Composite
2,833
(5.2)
2.9
(36.8)
South Africa
Top 40
45,707
1.4
5.2
(4.2)
Mexico
Mexbol
45,676
1.8
5.7
1.6
Indonesia
LQ45
819
(2.7)
1.1
(9.5)
Malaysia
KLCI
1,636
(5.1)
(1.6)
(10.5)
Thailand
SET 50
883
(2.9)
6.9
(13.7)
USA
Dow Jones
17,928
2.0
11.9
(0.8)
UK
FTSE
6,157
0.3
5.3
(11.4)
Japan
Nikkei
16,565
2.7
(6.7)
(17.3)
Germany
DAX
10,045
4.4
11.9
(13.1)
France
CAC
4,338
0.8
6.7
(15.2)
Source: Bloomberg, Angel Research
Stock Watch
May 11, 2016
Company Name
Reco
CMP
Target
Mkt Cap
Sales ( Čcr )
OPM(%)
EPS (Č)
PER(x)
P/BV(x)
RoE(%)
EV/Sales(x)
(Č)
Price ( Č)
( Č cr )
FY16E FY17E
FY16E
FY17E
FY16E
FY17E
FY16E
FY17E
FY16E
FY17E
FY16E
FY17E
FY16E
FY17E
Agri / Agri Chemical
Rallis
Neutral
197
-
3,837
1,612
1,911
13.3
13.3
7.4
9.5
26.7
20.8
4.3
3.8
16.7
18.4
2.4
2.0
United Phosphorus
Buy
589
684
25,256
13,083
15,176
18.5
18.5
31.5
37.4
18.7
15.8
3.7
3.1
21.4
21.4
2.1
1.8
Auto & Auto Ancillary
Ashok Leyland
Accumulate
105
111
29,867
17,995
21,544
11.4
11.6
3.4
4.7
30.9
22.3
5.4
5.0
17.7
22.2
1.6
1.3
Bajaj Auto
Neutral
2,533
-
73,291
22,709
25,860
20.9
20.1
129.0
143.6
19.6
17.6
6.0
5.2
30.7
29.4
2.8
2.4
Bharat Forge
Accumulate
786
875
18,289
7,351
8,318
19.9
19.7
31.2
36.5
25.2
21.5
4.5
3.8
19.3
19.2
2.6
2.3
Eicher Motors
Neutral
20,256
-
55,017
15,556
16,747
15.5
17.3
464.8
597.5
43.6
33.9
15.9
11.7
36.2
34.3
3.5
3.2
Gabriel India
Accumulate
90
101
1,291
1,415
1,544
8.7
9.0
4.6
5.4
19.5
16.6
3.5
3.1
18.1
18.9
0.9
0.8
Hero Motocorp
Neutral
2,962
-
59,145
28,244
30,532
15.5
15.9
156.7
168.5
18.9
17.6
7.5
6.4
39.9
36.4
1.9
1.8
Jamna Auto Industries Accumulate
142
160
1,137
1,281
1,473
11.2
11.5
7.6
9.2
18.7
15.5
4.7
3.9
25.4
25.2
0.9
0.8
L G Balakrishnan & Bros Neutral
469
-
736
1,254
1,394
11.6
11.8
35.9
41.7
13.1
11.3
1.8
1.6
13.5
13.8
0.7
0.6
Mahindra and Mahindra Neutral
1,350
-
83,872
38,416
42,904
13.7
13.9
54.8
63.4
24.6
21.3
3.8
3.4
15.4
15.8
1.8
1.6
Maruti
Neutral
3,847
-
116,209
57,865
68,104
16.4
16.7
176.3
225.5
21.8
17.1
4.2
3.6
19.4
21.2
1.8
1.5
Minda Industries
Neutral
1,054
-
1,671
2,523
2,890
8.7
9.0
55.0
65.4
19.2
16.1
3.7
3.0
19.3
18.7
0.8
0.6
Motherson Sumi
Buy
253
313
33,459
39,343
45,100
8.8
9.1
10.1
12.5
25.0
20.2
7.9
6.2
35.3
34.4
0.9
0.8
Rane Brake Lining
Buy
384
465
304
454
511
11.5
12.0
25.2
31.0
15.2
12.4
2.3
2.1
14.9
16.6
0.8
0.7
Setco Automotive
Neutral
32
-
421
594
741
12.7
13.7
1.7
3.2
18.5
9.8
1.9
1.7
10.4
16.9
1.2
1.0
Tata Motors
Neutral
389
-
112,283
259,686
273,957
13.0
13.4
25.9
29.5
15.0
13.2
2.0
1.7
8.0
9.0
0.6
0.6
TVS Motor
Accumulate
298
330
14,167
11,263
13,122
6.9
8.5
9.2
15.0
32.4
19.9
7.4
5.9
22.7
29.6
1.2
1.0
Amara Raja Batteries
Accumulate
952
1,076
16,262
4,892
5,871
17.4
17.6
28.8
37.1
33.1
25.7
7.7
6.2
23.4
24.1
3.3
2.7
Exide Industries
Accumulate
148
162
12,572
6,950
7,784
14.4
14.8
6.6
7.3
22.4
20.3
2.8
2.6
12.6
12.8
1.5
1.4
Apollo Tyres
Buy
152
183
7,755
12,056
12,714
17.2
16.4
23.0
20.3
6.6
7.5
1.2
1.0
17.7
13.6
0.7
0.7
Ceat
Accumulate
1,015
1,119
4,105
6,041
6,597
14.1
13.7
99.5
111.9
10.2
9.1
2.0
1.7
19.6
18.5
0.8
0.7
JK Tyres
Neutral
84
-
1,900
7,446
7,669
15.2
14.0
19.6
18.4
4.3
4.6
1.1
0.9
25.2
19.5
0.7
0.6
Swaraj Engines
Neutral
1,106
-
1,373
552
630
14.2
14.7
44.6
54.1
24.8
20.4
5.8
5.2
23.2
25.6
2.3
2.0
Subros
Neutral
90
-
538
1,293
1,527
11.8
11.9
4.2
6.7
21.4
13.4
1.6
1.5
7.7
11.5
0.7
0.6
Indag Rubber
Neutral
182
-
478
283
329
17.0
17.2
13.0
15.4
14.1
11.8
3.1
2.6
21.8
21.6
1.4
1.2
Capital Goods
ACE
Neutral
41
-
402
660
839
4.7
8.2
1.0
3.9
40.7
10.4
1.3
1.1
3.2
11.3
0.8
0.6
BEML
Buy
916
1,157
3,814
3,277
4,006
6.0
8.9
36.2
64.3
25.3
14.2
1.8
1.6
5.7
11.7
1.3
1.0
Bharat Electronics
Buy
1,169
1,414
28,060
7,737
8,634
16.8
17.2
54.0
61.5
21.7
19.0
3.1
2.7
39.3
45.6
2.7
2.3
Stock Watch
May 11, 2016
Company Name
Reco
CMP
Target
Mkt Cap
Sales ( Čcr )
OPM(%)
EPS (Č)
PER(x)
P/BV(x)
RoE(%)
EV/Sales(x)
(Č)
Price ( Č)
( Č cr )
FY16E
FY17E
FY16E
FY17E
FY16E
FY17E
FY16E
FY17E
FY16E
FY17E
FY16E
FY17E
FY16E
FY17E
Capital Goods
Voltas
Accumulate
307
353
10,168
5,363
5,963
8.0
9.1
11.0
13.8
27.9
22.3
4.3
3.8
16.2
17.9
1.8
1.6
BGR Energy
Neutral
113
-
815
3,615
3,181
9.5
9.4
16.7
12.4
6.8
9.1
0.6
0.6
10.0
7.0
0.6
0.8
BHEL
Neutral
129
-
31,488
33,722
35,272
10.8
11.7
10.5
14.2
12.3
9.1
0.9
0.9
7.0
9.0
1.0
1.0
Blue Star
Accumulate
431
481
3,872
3,548
3,977
6.3
6.9
13.7
17.2
31.4
25.1
7.9
5.1
26.1
25.4
1.2
1.0
Crompton Greaves
Neutral
61
-
3,811
13,484
14,687
4.9
6.2
4.5
7.1
13.5
8.6
1.0
0.9
7.2
10.8
0.4
0.4
Greaves Cotton
Neutral
141
-
3,432
1,655
1,755
16.6
16.8
7.4
7.8
19.0
18.0
3.8
3.6
21.1
20.6
2.0
1.9
Inox Wind
Buy
243
286
5,383
4,406
5,605
15.2
15.7
20.4
24.8
11.9
9.8
2.7
2.0
27.9
25.9
1.4
1.1
KEC International
Neutral
128
-
3,288
8,791
9,716
6.1
6.8
5.4
8.2
23.7
15.6
2.4
2.2
10.0
14.0
0.6
0.6
Thermax
Neutral
763
-
9,088
6,413
7,525
7.4
8.5
30.5
39.3
25.0
19.4
3.9
3.4
15.0
17.0
1.4
1.1
VATech Wabag
Neutral
576
-
3,137
2,722
3,336
7.9
8.1
19.5
24.6
29.5
23.4
3.1
2.7
11.1
12.4
1.2
1.0
Cement
ACC
Neutral
1,460
-
27,411
13,151
14,757
16.4
18.3
63.9
83.4
22.9
17.5
2.9
2.7
13.3
16.1
1.9
1.6
Ambuja Cements
Neutral
221
-
34,243
11,564
12,556
19.4
20.7
8.9
10.1
24.8
21.9
3.1
2.9
12.8
13.8
2.6
2.4
HeidelbergCement
Neutral
101
-
2,285
1,772
1,926
13.3
15.4
1.0
3.0
100.9
33.6
2.6
2.4
2.6
7.9
1.9
1.6
India Cements
Neutral
90
-
2,772
4,216
4,840
18.0
19.5
4.0
9.9
22.6
9.1
0.9
0.8
4.0
9.5
1.0
0.8
JK Cement
Accumulate
566
605
3,957
3,661
4,742
10.1
15.8
7.5
28.5
75.5
19.9
2.3
2.0
7.5
22.9
1.6
1.2
J K Lakshmi Cement
Neutral
338
-
3,973
2,947
3,616
16.7
19.9
11.5
27.2
29.4
12.4
2.8
2.4
9.8
20.8
1.8
1.4
Mangalam Cements
Neutral
266
-
710
1,053
1,347
10.5
13.3
8.4
26.0
31.6
10.2
1.3
1.2
4.3
12.5
1.1
0.8
Orient Cement
Neutral
150
-
3,069
1,854
2,524
21.2
22.2
7.7
11.1
19.5
13.5
2.8
2.4
13.3
15.7
2.4
1.7
Ramco Cements
Neutral
500
-
11,904
4,036
4,545
20.8
21.3
15.1
18.8
33.1
26.6
4.1
3.6
12.9
14.3
3.5
3.0
Shree Cement^
Neutral
12,948
-
45,108
7,150
8,742
26.7
28.6
228.0
345.5
56.8
37.5
8.4
7.0
15.7
20.3
6.1
4.9
UltraTech Cement
Neutral
3,172
-
87,052
24,669
29,265
18.2
20.6
82.0
120.0
38.7
26.4
4.2
3.6
11.3
14.7
3.6
3.0
Construction
ITNL
Buy
73
93
2,385
7,360
8,825
34.0
35.9
7.0
9.0
10.4
8.1
0.4
0.3
3.2
3.7
3.7
3.6
KNR Constructions
Buy
521
603
1,465
937
1,470
14.3
14.0
44.2
38.6
11.8
13.5
2.4
2.0
15.4
15.4
1.6
1.1
Larsen & Toubro
Neutral
1,319
-
122,872
58,870
65,708
8.3
10.3
42.0
53.0
31.4
24.9
2.2
2.0
8.8
11.2
2.3
2.1
Gujarat Pipavav Port
Neutral
162
-
7,834
629
684
51.0
52.2
6.4
5.9
25.3
27.5
3.3
3.1
15.9
12.7
12.1
10.9
MBL Infrastructures
Buy
135
285
561
2,313
2,797
12.2
14.6
19.0
20.0
7.1
6.8
0.7
0.7
11.3
10.6
1.0
0.9
Nagarjuna Const.
Neutral
79
-
4,370
7,892
8,842
8.8
9.1
3.0
5.3
26.2
14.8
1.3
1.2
5.0
8.5
0.8
0.7
PNC Infratech
Neutral
542
-
2,780
1,873
2,288
13.2
13.5
24.0
32.0
22.6
16.9
2.2
2.0
12.1
12.3
1.6
1.3
Simplex Infra
Neutral
264
-
1,306
5,955
6,829
10.3
10.5
16.0
31.0
16.5
8.5
0.9
0.8
5.3
9.9
0.7
0.6
Stock Watch
May 11, 2016
Company Name
Reco
CMP
Target
Mkt Cap
Sales ( Čcr )
OPM(%)
EPS (Č)
PER(x)
P/BV(x)
RoE(%)
EV/Sales(x)
(Č)
Price ( Č)
( Č cr )
FY16E
FY17E
FY16E
FY17E
FY16E
FY17E
FY16E
FY17E
FY16E
FY17E
FY16E
FY17E
FY16E
FY17E
Construction
Power Mech Projects
Neutral
580
-
853
1,539
1,801
12.8
12.7
59.0
72.1
9.8
8.0
1.5
1.3
18.6
16.8
0.6
0.5
Sadbhav Engineering
Accumulate
270
298
4,625
3,186
3,598
10.2
10.3
8.0
9.0
33.7
30.0
3.1
2.8
9.4
9.9
1.8
1.6
NBCC
Accumulate
973
1,089
11,672
5,816
7,382
6.9
7.7
29.6
39.8
32.9
24.4
5.9
4.7
24.1
26.7
1.7
1.3
MEP Infra
Neutral
41
-
659
1,956
1,876
28.1
30.5
1.3
3.0
31.2
13.5
6.5
4.4
21.2
32.8
1.8
1.7
SIPL
Neutral
99
-
3,494
675
1,042
62.4
64.7
-
-
3.7
4.2
-
-
16.8
11.4
Engineers India
Neutral
181
-
6,107
1,667
1,725
13.5
16.0
9.7
11.4
18.7
15.9
2.2
2.1
11.7
13.4
2.5
2.5
Financials
Allahabad Bank
Neutral
55
-
3,376
8,569
9,392
2.8
2.9
16.3
27.5
3.4
2.0
0.3
0.3
7.6
11.9
-
-
Axis Bank
Neutral
488
-
116,339
26,204
29,738
3.6
3.5
34.5
35.4
14.1
13.8
2.2
2.0
16.8
14.9
-
-
Bank of Baroda
Neutral
157
-
36,256
18,802
21,088
2.0
2.2
(7.4)
13.0
12.1
1.3
1.0
(4.2)
7.3
-
-
Bank of India
Neutral
89
-
7,271
15,972
17,271
1.9
2.0
15.3
33.4
5.8
2.7
0.3
0.2
3.6
7.6
-
-
Canara Bank
Neutral
194
-
10,510
15,441
16,945
2.0
2.1
46.6
70.4
4.2
2.8
0.4
0.3
8.0
11.2
-
-
Dena Bank
Neutral
29
-
1,961
3,440
3,840
2.1
2.3
7.3
10.0
4.1
2.9
0.3
0.3
6.1
7.9
-
-
Dewan Housing Finance Buy
200
270
5,837
1,828
2,225
2.9
3.0
24.9
29.7
8.0
6.7
1.2
1.1
15.1
16.1
-
-
Federal Bank
Neutral
49
-
8,418
3,279
3,787
2.8
2.9
3.9
5.5
12.4
8.9
1.0
0.9
8.4
10.8
-
-
HDFC
Neutral
1,219
-
192,504
10,358
11,852
3.3
3.3
41.1
47.0
29.7
25.9
5.7
5.1
24.7
24.9
-
-
HDFC Bank
Accumulate
1,145
1,262
289,521
38,606
47,696
4.4
4.5
48.8
61.4
23.5
18.7
4.0
3.5
18.7
20.0
-
-
ICICI Bank
Accumulate
226
243
131,132
34,279
39,262
3.3
3.3
21.0
24.4
10.8
9.3
1.8
1.5
14.4
14.7
-
-
IDBI Bank
Neutral
69
-
14,247
9,625
10,455
1.8
1.8
8.5
14.2
8.1
4.9
0.5
0.5
5.9
9.3
-
-
Indian Bank
Neutral
94
-
4,505
6,160
6,858
2.5
2.5
24.5
29.8
3.8
3.1
0.3
0.3
7.7
8.6
-
-
LIC Housing Finance
Buy
461
592
23,270
3,179
3,758
2.6
2.6
32.9
40.6
14.0
11.4
2.6
2.2
19.6
20.7
-
-
Oriental Bank
Neutral
87
-
2,807
7,643
8,373
2.4
2.4
37.2
45.4
2.4
1.9
0.2
0.2
8.2
9.4
-
-
Punjab Natl.Bank
Neutral
83
-
16,219
23,122
26,022
2.8
2.8
7.0
21.6
11.8
3.8
0.6
0.5
3.4
10.0
-
-
South Ind.Bank
Neutral
18
-
2,424
1,965
2,185
2.5
2.5
2.5
3.3
7.2
5.4
0.7
0.6
9.5
11.7
-
-
St Bk of India
Neutral
189
-
146,949
79,958
86,061
2.6
2.6
13.4
20.7
14.1
9.2
1.2
1.1
11.5
12.8
-
-
Union Bank
Neutral
121
-
8,308
12,646
14,129
2.3
2.4
31.0
39.1
3.9
3.1
0.4
0.4
9.8
11.4
-
-
Vijaya Bank
Neutral
32
-
2,942
3,536
3,827
1.9
1.9
5.5
6.7
5.7
4.7
0.5
0.4
7.8
8.8
-
-
Yes Bank
Neutral
950
-
39,963
7,190
9,011
3.2
3.3
58.2
69.7
16.3
13.6
2.9
2.5
19.2
19.6
-
-
FMCG
Asian Paints
Neutral
899
-
86,198
16,553
19,160
16.0
16.2
17.7
21.5
50.8
41.8
13.5
12.1
29.4
31.2
5.0
4.4
Britannia
Neutral
2,821
-
33,840
8,481
9,795
14.0
14.1
65.5
78.3
43.1
36.0
20.4
16.7
38.3
41.2
3.9
3.4
Stock Watch
May 11, 2016
Company Name
Reco
CMP
Target
Mkt Cap
Sales ( Čcr )
OPM(%)
EPS (Č)
PER(x)
P/BV(x)
RoE(%)
EV/Sales(x)
(Č)
Price ( Č)
( Č cr )
FY16E FY17E
FY16E
FY17E
FY16E
FY17E
FY16E
FY17E
FY16E
FY17E
FY16E
FY17E
FY16E
FY17E
FMCG
Colgate
Neutral
846
-
22,998
4,136
4,632
22.5
23.3
22.2
25.3
38.1
33.4
23.2
20.6
68.6
67.5
5.4
4.8
Dabur India
Neutral
291
-
51,165
9,370
10,265
17.6
17.3
7.3
8.1
39.7
35.9
10.3
9.4
31.7
30.6
5.3
4.8
GlaxoSmith Con*
Neutral
5,898
-
24,802
4,519
5,142
19.6
19.8
164.3
191.2
35.9
30.8
9.9
8.5
30.8
29.9
4.9
4.3
Godrej Consumer
Neutral
1,382
-
47,069
9,003
10,335
18.1
18.7
34.1
41.8
40.5
33.1
8.8
7.5
23.9
24.8
5.4
4.7
HUL
Neutral
862
-
186,629
33,299
35,497
17.1
17.1
18.9
20.0
45.6
43.1
23.1
26.5
87.6
80.8
5.4
5.1
ITC
Accumulate
323
359
260,166
36,804
38,776
37.9
37.9
12.2
12.9
26.5
25.1
7.4
6.5
27.7
25.8
6.6
6.3
Marico
Neutral
250
-
32,254
6,151
6,966
17.2
17.3
5.4
6.4
46.3
39.1
14.5
11.5
33.2
32.4
5.1
4.5
Nestle*
Neutral
5,523
-
53,251
9,393
10,507
22.2
22.3
106.8
121.8
51.7
45.4
18.2
16.3
34.8
36.7
5.5
4.9
Tata Global
Buy
118
137
7,457
8,635
9,072
9.8
9.9
5.8
7.2
20.4
16.4
1.8
1.7
6.8
7.4
0.9
0.8
Procter & Gamble
Buy
6,356
7,369
20,631
2,588
2,939
23.3
23.2
130.2
146.2
48.8
43.5
97.3
93.3
27.6
25.3
7.6
6.6
Hygiene
IT
HCL Tech^
Buy
720
1,038
101,560
42,038
47,503
21.2
21.5
51.5
57.7
14.0
12.5
3.0
2.3
21.5
18.8
2.0
1.6
Infosys
Accumulate
1,213
1,374
279,425
62,441
70,558
27.5
27.5
59.0
65.3
20.6
18.6
4.1
3.8
22.2
22.4
3.9
3.4
TCS
Buy
2,524
3,004
497,257
108,646
122,770
28.3
28.3
123.7
141.0
20.4
17.9
6.8
6.2
33.1
34.6
4.1
3.6
Tech Mahindra
Accumulate
483
530
46,865
26,524
29,177
16.2
17.0
28.8
33.6
16.8
14.4
3.2
2.8
19.3
19.1
1.5
1.3
Wipro
Buy
539
680
133,073
50,808
56,189
23.7
23.8
37.3
40.7
14.4
13.2
2.8
2.5
19.2
17.7
2.1
1.7
Media
D B Corp
Accumulate
326
356
5,988
2,025
2,187
27.4
27.4
17.4
18.9
18.7
17.3
4.2
3.8
22.9
23.7
2.9
2.7
HT Media
Neutral
87
-
2,027
2,495
2,673
12.9
13.2
6.8
7.2
12.8
12.1
1.0
0.9
7.5
7.8
0.4
0.3
Jagran Prakashan
Buy
169
205
5,536
2,170
2,355
27.2
26.2
8.9
9.9
19.0
17.1
4.0
3.5
20.9
20.5
2.4
2.3
Sun TV Network
Neutral
361
-
14,234
2,510
2,763
71.8
71.5
21.9
24.8
16.5
14.6
3.9
3.5
22.8
24.3
5.1
4.6
Hindustan Media
Neutral
269
-
1,971
914
1,016
21.7
21.5
21.9
23.3
12.3
11.6
2.2
1.9
18.0
16.2
1.6
1.3
Ventures
Metals & Mining
Coal India
Buy
285
380
180,143
76,167
84,130
19.9
22.3
22.4
25.8
12.7
11.0
4.6
4.5
35.5
41.0
1.7
1.5
Hind. Zinc
Accumulate
166
175
70,225
14,641
14,026
50.4
50.4
17.7
16.0
9.4
10.4
1.4
1.3
16.2
13.2
2.4
2.3
Hindalco
Neutral
90
-
18,554
104,356
111,186
8.7
9.5
6.7
11.1
13.4
8.1
0.5
0.5
3.5
5.9
0.7
0.6
JSW Steel
Neutral
1,288
-
31,139
42,308
45,147
16.4
20.7
(10.3)
49.5
26.0
1.4
1.4
(1.0)
5.6
1.8
1.7
NMDC
Neutral
92
-
36,654
8,237
10,893
46.6
44.5
10.0
11.7
9.3
7.9
1.0
0.9
12.5
13.0
4.2
3.2
SAIL
Neutral
42
-
17,512
45,915
53,954
7.2
10.5
1.5
4.4
28.2
9.7
0.4
0.4
2.3
4.1
1.0
0.9
Vedanta
Neutral
101
-
29,869
71,445
81,910
26.2
26.3
12.9
19.2
7.8
5.3
0.5
0.5
7.2
8.9
0.9
0.7
Tata Steel
Neutral
328
-
31,851
126,760
137,307
8.9
11.3
6.4
23.1
51.5
14.2
1.0
1.0
2.0
7.1
0.8
0.8
Oil & Gas
Cairn India
Neutral
135
-
25,283
11,323
12,490
49.4
51.0
20.7
20.7
6.5
6.5
0.4
0.4
6.4
6.1
1.3
0.7
Stock Watch
May 11, 2016
Company Name
Reco
CMP
Target
Mkt Cap
Sales ( Čcr )
OPM(%)
EPS (Č)
PER(x)
P/BV(x)
RoE(%)
EV/Sales(x)
(Č)
Price ( Č)
( Č cr )
FY16E FY17E
FY16E
FY17E
FY16E
FY17E
FY16E
FY17E
FY16E
FY17E
FY16E
FY17E
FY16E
FY17E
Oil & Gas
GAIL
Neutral
391
-
49,547
64,856
70,933
9.1
9.6
24.0
28.9
16.3
13.5
1.4
1.3
8.8
9.6
1.0
0.8
ONGC
Neutral
208
-
178,040
154,564
145,998
36.8
37.4
20.8
22.6
10.0
9.2
0.9
0.9
10.1
9.7
1.4
1.5
Petronet LNG
Neutral
276
-
20,726
29,691
31,188
5.8
6.2
12.8
13.4
21.6
20.6
3.2
2.9
15.8
14.8
0.8
0.7
Indian Oil Corp
Accumulate
414
455
100,408
359,607
402,760
5.9
6.1
42.5
48.7
9.7
8.5
1.3
1.2
14.1
14.4
0.4
0.3
Reliance Industries
Buy
981
1,150
317,994
304,775
344,392
12.6
13.4
91.3
102.6
10.8
9.6
1.2
1.1
11.8
12.0
1.0
0.8
Pharmaceuticals
Alembic Pharma
Neutral
592
-
11,155
3,274
3,802
26.9
19.4
35.0
28.7
16.9
20.6
7.5
5.7
55.6
31.2
3.4
2.8
Aurobindo Pharma
Accumulate
815
856
47,700
14,923
17,162
22.0
23.0
35.7
42.8
22.8
19.1
6.7
5.1
34.0
30.2
3.6
3.0
Aventis*
Accumulate
4,348
4,738
10,013
2,049
2,375
15.4
17.3
115.4
153.5
37.7
28.3
6.2
4.8
19.3
25.8
4.6
3.9
Cadila Healthcare
Accumulate
333
352
34,121
10,224
11,840
21.0
22.0
14.6
17.6
22.8
18.9
6.3
4.9
30.8
29.0
3.4
2.9
Cipla
Accumulate
537
605
43,134
13,979
16,447
20.2
18.6
25.7
27.5
20.9
19.5
3.4
2.9
17.6
16.1
3.1
2.6
Dr Reddy's
Buy
2,928
3,933
49,940
16,838
19,575
25.0
23.1
167.5
178.8
17.5
16.4
3.7
3.1
23.1
20.4
2.9
2.4
Dishman Pharma
Neutral
158
-
2,557
1,733
1,906
21.5
21.5
10.1
10.0
15.7
15.8
1.8
1.7
10.5
11.2
2.0
1.7
GSK Pharma*
Neutral
3,529
-
29,894
2,870
3,158
20.0
22.1
59.5
68.3
59.3
51.7
17.5
18.0
28.5
34.3
9.9
9.1
Indoco Remedies
Neutral
264
-
2,430
1,033
1,199
15.9
18.2
9.4
13.6
28.1
19.4
4.2
3.5
15.7
19.7
2.4
2.1
Ipca labs
Buy
472
750
5,955
3,363
3,909
12.9
18.6
13.4
28.0
35.2
16.9
2.5
2.2
7.4
14.0
2.1
1.8
Lupin
Neutral
1,615
-
72,774
13,092
16,561
25.0
27.0
50.4
68.3
32.0
23.6
6.6
5.2
22.8
24.7
5.3
4.1
Sun Pharma
Buy
802
950
193,111
28,163
32,610
25.8
30.7
17.4
26.9
46.1
29.8
4.4
3.8
13.0
16.6
6.3
5.3
Power
Tata Power
Neutral
73
-
19,609
35,923
37,402
22.6
22.8
4.1
5.2
17.9
14.1
1.4
1.3
7.5
9.3
1.5
1.4
NTPC
Neutral
141
-
115,972
87,271
99,297
23.5
23.5
11.8
13.3
12.0
10.6
1.3
1.3
11.5
12.2
2.4
2.1
Power Grid
Buy
142
170
74,079
20,702
23,361
86.7
86.4
12.1
13.2
11.7
10.7
1.7
1.5
15.6
15.1
8.5
7.9
Real Estate
MLIFE
Buy
452
554
1,853
826
1,133
20.1
21.8
22.6
30.7
20.0
14.7
1.2
1.1
6.0
7.4
4.1
2.8
Telecom
Bharti Airtel
Neutral
369
-
147,444
101,748
109,191
32.1
31.7
12.0
12.5
30.7
29.5
2.1
2.0
6.9
6.7
2.1
1.9
Idea Cellular
Neutral
113
-
40,650
34,282
36,941
32.0
31.5
5.9
6.2
19.1
18.2
1.8
1.6
9.9
9.3
1.8
1.7
zOthers
Abbott India
Neutral
4,636
-
9,850
2,715
3,153
14.5
14.1
134.3
152.2
34.5
30.5
8.6
7.1
27.4
25.6
3.3
2.8
Bajaj Electricals
Neutral
232
-
2,340
4,719
5,287
5.2
5.8
8.6
12.7
27.1
18.3
3.1
2.7
11.4
14.8
0.5
0.4
Finolex Cables
Neutral
290
-
4,430
2,520
2,883
12.2
12.0
12.7
14.2
22.9
20.4
3.1
2.8
13.6
13.5
1.5
1.3
Goodyear India*
Buy
503
582
1,159
1,800
1,600
11.7
11.5
58.7
52.9
8.6
9.5
1.9
1.7
24.6
18.7
0.4
0.4
Hitachi
Neutral
1,388
-
3,774
1,779
2,081
7.8
8.8
21.8
33.4
63.7
41.5
10.3
8.3
17.4
22.1
2.2
1.9
Jyothy Laboratories
Neutral
310
-
5,615
1,620
1,847
11.5
11.5
7.3
8.5
42.5
36.6
5.5
5.1
13.3
14.4
3.3
2.8
Stock Watch
May 11, 2016
Company Name
Reco
CMP
Target
Mkt Cap
Sales ( Čcr )
OPM(%)
EPS (Č)
PER(x)
P/BV(x)
RoE(%)
EV/Sales(x)
(Č)
Price ( Č)
( Č cr )
FY16E
FY17E
FY16E
FY17E
FY16E
FY17E
FY16E
FY17E
FY16E
FY17E
FY16E
FY17E
FY16E
FY17E
zOthers
MRF
Buy
33,338
45,575
14,139
20,316
14,488
21.4
21.1
5,488.0
3,798.0
6.1
8.8
2.1
1.7
41.1
21.2
0.6
0.9
Page Industries
Neutral
12,945
-
14,439
1,929
2,450
19.8
20.1
229.9
299.0
56.3
43.3
24.8
17.3
52.1
47.1
7.5
5.9
Relaxo Footwears
Neutral
502
-
6,026
1,767
2,152
12.3
12.5
19.3
25.1
26.1
20.0
6.4
4.9
27.7
27.8
3.5
2.8
Siyaram Silk Mills
Buy
1,069
1,354
1,002
1,636
1,815
11.5
11.5
89.9
104.1
11.9
10.3
2.0
1.7
17.9
17.8
0.8
0.7
Styrolution ABS India* Neutral
614
-
1,080
1,271
1,440
8.6
9.2
32.0
41.1
19.2
15.0
2.0
1.8
10.7
12.4
0.8
0.7
TVS Srichakra
Buy
2,420
3,217
1,853
2,035
2,252
15.9
15.3
248.6
268.1
9.7
9.0
4.3
3.1
43.6
33.9
1.0
0.8
HSIL
Neutral
309
-
2,233
2,123
2,384
16.1
16.5
15.0
18.9
20.5
16.4
1.6
1.5
8.0
9.4
1.4
1.2
Kirloskar Engines India
Neutral
232
-
3,362
2,403
2,554
8.6
9.9
9.2
10.5
25.3
22.2
2.4
2.3
9.7
10.7
1.0
1.0
Ltd
M M Forgings
Buy
462
614
558
511
615
21.7
21.6
43.1
55.8
10.7
8.3
2.0
1.6
19.9
21.2
1.3
1.0
Banco Products (India) Neutral
130
-
929
1,208
1,353
11.0
12.3
10.8
14.5
12.1
9.0
1.4
1.2
11.9
14.5
0.7
0.6
Competent Automobiles Neutral
150
-
92
1,040
1,137
3.2
3.1
25.7
28.0
5.8
5.4
0.9
0.8
15.0
14.3
0.1
0.1
Nilkamal
Neutral
1,230
-
1,836
1,871
2,031
10.7
10.5
63.2
69.8
19.5
17.6
3.2
2.7
17.6
16.6
1.0
0.9
Visaka Industries
Buy
121
143
192
1,020
1,120
8.7
9.1
13.9
20.1
8.7
6.0
0.6
0.5
6.4
8.7
0.4
0.4
Transport Corporation of
Neutral
265
-
2,019
2,830
3,350
8.8
9.0
14.4
18.3
18.5
14.5
2.8
2.5
15.4
17.1
0.8
0.7
India
Elecon Engineering
Neutral
64
-
699
1,359
1,482
10.3
13.7
0.8
3.9
79.9
16.5
1.3
1.3
1.6
7.8
0.9
0.8
Surya Roshni
Buy
152
201
665
2,992
3,223
8.1
8.4
14.7
18.3
10.3
8.3
1.0
0.9
9.7
11.0
0.5
0.5
MT Educare
Neutral
185
-
738
286
366
18.3
17.7
7.7
9.4
24.0
19.8
5.1
4.4
20.2
21.1
2.5
1.9
Radico Khaitan
Buy
92
156
1,224
1,517
1,635
12.7
13.4
5.8
7.1
15.8
12.9
1.4
1.2
8.6
9.6
1.3
1.2
Garware Wall Ropes
Buy
351
473
769
862
974
11.2
11.2
24.9
29.6
14.1
11.9
2.1
1.8
15.1
15.4
0.9
0.8
Wonderla Holidays
Neutral
381
-
2,151
206
308
44.0
43.6
9.0
12.9
42.3
29.5
5.8
5.2
13.7
17.8
10.3
6.9
Linc Pen & Plastics
Neutral
191
-
282
340
371
8.3
8.9
10.8
13.2
17.7
14.5
2.8
2.5
16.0
17.1
0.9
0.8
The Byke Hospitality
Neutral
156
-
625
222
287
20.5
20.5
5.6
7.6
27.7
20.6
5.2
4.3
18.9
20.8
2.9
2.2
Interglobe Aviation
Neutral
1,075
-
38,731
17,022
21,122
20.7
14.5
63.9
53.7
16.8
20.0
25.2
20.7
149.9
103.2
2.3
1.8
Coffee Day Enterprises
Neutral
266
-
5,476
2,692
2,964
17.0
18.6
-
4.7
-
56.1
3.3
3.1
0.2
5.5
2.4
2.3
Ltd
Navneet Education
Neutral
89
-
2,109
998
1,062
24.1
24.0
5.8
6.1
15.4
14.5
3.4
3.0
22.0
20.6
2.2
2.1
Navkar Corporation
Buy
176
265
2,508
365
436
38.3
37.5
5.6
5.9
31.2
29.9
2.0
1.8
6.3
6.1
7.7
6.6
UFO Moviez
Neutral
537
-
1,476
558
619
32.0
33.2
22.5
30.0
23.8
17.9
2.9
2.5
12.0
13.8
2.5
2.1
VRL Logistics
Neutral
394
-
3,593
1,725
1,902
16.5
16.7
12.2
14.6
32.4
27.0
6.7
5.9
20.8
21.9
2.2
2.0
Team Lease Serv.
Neutral
885
-
1,512
2,565
3,229
1.3
1.5
15.2
22.8
58.3
38.9
4.7
4.2
8.0
10.7
0.5
0.4
Stock Watch
May 11, 2016
Company Name
Reco
CMP
Target Mkt Cap
Sales ( Čcr )
OPM(%)
EPS (Č)
PER(x)
P/BV(x)
RoE(%)
EV/Sales(x)
(Č)
Price ( Č)
( Č cr )
FY16E FY17E FY16E FY17E FY16E FY17E FY16E FY17E FY16E FY17E FY16E FY17E FY16E FY17E
zOthers
S H Kelkar & Co.
Neutral
225
-
3,253
928
1,036
15.3
15.1
4.9
6.1
45.6
36.8
4.3
3.9
9.4
10.7
3.4
3.0
Quick Heal
Neutral
272
-
1,907
339
408
27.8
27.3
7.1
7.7
38.5
35.2
3.3
3.3
8.5
9.3
4.5
3.8
Narayana Hrudaya
Neutral
299
-
6,104
1,603
1,873
10.9
11.5
1.0
2.6
313.6
112.9
7.6
6.9
2.4
6.1
3.9
3.4
Manpasand Bever.
Neutral
514
-
2,573
540
836
19.9
19.6
10.2
16.9
50.2
30.4
4.1
3.7
8.1
12.0
4.4
2.8
Source: Company, Angel Research; Note: *December year end; #September year end; &October year end; Price as on May 10, 2016
Market Outlook
May 11, 2016
Research Team Tel: 022 - 39357800
DISCLAIMER
Angel Broking Private Limited (hereinafter referred to as “Angel”) is a registered Member of National Stock Exchange of India Limited,
Bombay Stock Exchange Limited and Metropolitian Stock Exchange of India Limited. It is also registered as a Depository Participant with
CDSL and Portfolio Manager with SEBI. It also has registration with AMFI as a Mutual Fund Distributor. Angel Broking Private Limited is a
registered entity with SEBI for Research Analyst in terms of SEBI (Research Analyst) Regulations, 2014 vide registration number
INH000000164. Angel or its associates has not been debarred/ suspended by SEBI or any other regulatory authority for accessing
/dealing in securities Market. Angel or its associates including its relatives/analyst do not hold any financial interest/beneficial ownership
of more than 1% in the company covered by Analyst. Angel or its associates/analyst has not received any compensation / managed or co
-managed public offering of securities of the company covered by Analyst during the past twelve months. Angel/analyst has not served as
an officer, director or employee of company covered by Analyst and has not been engaged in market making activity of the company
covered by Analyst.
This document is solely for the personal information of the recipient, and must not be singularly used as the basis of any investment
decision. Nothing in this document should be construed as investment or financial advice. Each recipient of this document should make
such investigations as they deem necessary to arrive at an independent evaluation of an investment in the securities of the companies
referred to in this document (including the merits and risks involved), and should consult their own advisors to determine the merits and
risks of such an investment.
Reports based on technical and derivative analysis center on studying charts of a stock's price movement, outstanding positions and
trading volume, as opposed to focusing on a company's fundamentals and, as such, may not match with a report on a company's
fundamentals.
The information in this document has been printed on the basis of publicly available information, internal data and other reliable sources
believed to be true, but we do not represent that it is accurate or complete and it should not be relied on as such, as this document is for
general guidance only. Angel Broking Pvt. Limited or any of its affiliates/ group companies shall not be in any way responsible for any
loss or damage that may arise to any person from any inadvertent error in the information contained in this report. Angel Broking Pvt.
Limited has not independently verified all the information contained within this document. Accordingly, we cannot testify, nor make any
representation or warranty, express or implied, to the accuracy, contents or data contained within this document. While Angel Broking
Pvt. Limited endeavors to update on a reasonable basis the information discussed in this material, there may be regulatory, compliance,
or other reasons that prevent us from doing so.
This document is being supplied to you solely for your information, and its contents, information or data may not be reproduced,
redistributed or passed on, directly or indirectly.
Neither Angel Broking Pvt. Limited, nor its directors, employees or affiliates shall be liable for any loss or damage that may arise from or
in connection with the use of this information.
Note: Please refer to the important ‘Stock Holding Disclosure' report on the Angel website (Research Section). Also, please refer to the
latest update on respective stocks for the disclosure status in respect of those stocks. Angel Broking Pvt. Limited and its affiliates may have
investment positions in the stocks recommended in this report.