Market Outlook
March 11, 2016
Market Cues
Domestic Indices
Chg (%)
(Pts)
(Close)
Indian markets are expected to open flat tracking the SGX Nifty and mixed Asian
BSE Sensex
(0.7)
(171)
24,623
cues.
Nifty
(0.6)
(46)
7,486
Mid Cap
(0.3)
(33)
10,262
US markets failed to sustain initial gains, witnessing a choppy session before closing
Small Cap
(0.2)
(19)
10,295
on a flat note. Markets opened higher after the ECB stimulus measures. However,
the positive sentiment was offset as ECB President said he does not anticipate the
Bankex
(0.7)
(128)
17,279
need for further rate cuts.
Global Indices
Chg (%)
(Pts)
(Close)
European markets opened on a cautious note ahead of the ECB meet. The
European Central Bank delivered more than what markets hoped by cutting its
Dow Jones
(0.0)
(5)
16,995
benchmark interest rate to zero and expanding its asset purchases, among other
Nasdaq
(0.3)
(12)
4,662
steps. Markets saw a sharp upmove post the announcement, but could not sustain
FTSE
(1.8)
(110)
6,037
the gains as investors took the opportunity to lock in some profits. Weakness in
Nikkei
1.3
210
16,852
crude oil prices also contributed to the late day sell-off.
Hang Seng
(0.1)
(12)
19,984
Markets witnessed some profit booking after a six day post budget rally as caution
Shanghai Com
(2.0)
(58)
2,805
ahead of a key European Central Bank meeting and January IIP data triggered
some profit taking.
Advances / Declines
BSE
NSE
News & Result Analysis
Advances
1,179
659
Rajya Sabha passes Real Estate Bill
Declines
1,437
881
Cabinet approves MMDR amendment; move to spur M&As
Unchanged
147
66
Govt lends HELP to revive oil sector
Detailed analysis on Pg2
Volumes (` Cr)
Investor’s Ready Reckoner
BSE
2,525
Key Domestic & Global Indicators
NSE
17,182
Stock Watch: Latest investment recommendations on 150+ stocks
Refer Pg5 onwards
Net Inflows (` Cr)
Net
Mtd
Ytd
FII
898
8,389
-24,803
Top Picks
MFs
(781)
(1,929)
80,619
CMP
Target
Upside
Company
Sector
Rating
(`)
(`)
(%)
Amara Raja Batteries Auto & Auto Ancillary
Buy
906
1,040
14.9
Top Gainers
Price (`)
Chg (%)
HCL Tech
IT
Buy
818
1,038
26.8
Torntpower
242
5.6
LIC Housing Finance Financials
Buy
458
592
29.2
Mfsl
333
5.4
Bharat Electronics
Capital Goods
Buy
1,084
1,414
30.5
Welcorp
93
5.0
Navkar Corporation Others
Buy
163
265
62.2
Pvr
744
4.3
More Top Picks on Pg4
Gmdcltd
67
4.1
Key Upcoming Events
Previous
Consensus
Date
Region
Event Description
Reading
Expectations
Top Losers
Price (`)
Chg (%)
Mar 11 India
Industrial Production (YoY)
(1.30)
(0.50)
Jubilant
357
(5.4)
Mar 14 India
Monthly Wholesale Prices (YoY)
(0.90)
(0.23)
Renuka
13
(4.8)
Mar 15 US
Producer Price Index (mom)
(0.50)
--
Ucobank
36
(4.2)
Mar 16 US
Housing Starts
1099
1150
6.(
Ibrealest
52
(4.0)
Emamiltd
941
(4.0)
As on March 10, 2016
Market Outlook
March 11, 2016
Rajya Sabha passes Real Estate Bill
The Rajya Sabha passed the Real Estate (Regulation and Development) Bill, 2015,
paving way for regulation in the real estate sector. The law will protect home
buyers against erring developers besides bringing in investments as well as
transparency in the sector. In December last year, the Cabinet had approved 20
major amendments to the Bill based on the recommendations of a Rajya Sabha
committee.
The developers will now have to deposit 70% of the sale proceeds, including the
land cost, in a separate escrow account, which was earlier brought down to 50%
by the NDA government. Also, an equal rate of interest has to be paid by
promoters and buyers in case of default or delays. Currently, developers pay only
2-3% interest in case of default, but a buyer pays 16-18% interest for his default,
as per reports.
Apart from three years' imprisonment for developers proposed by the government,
the liability of promoters for structural defects has been increased from the earlier
two years to five years now. Developers will have to register projects with 500 sq
mt area or 8 flats with a regulatory authority instead of 1,000 sq mt and 12 flats
earlier. A minimum of 50% of sale proceeds will have to be kept in a separate
bank account and used for construction of that project.
Cabinet approves MMDR amendment; move to spur M&As
The Cabinet today cleared an amendment in the new mining law that permits
transfer of captive mines granted on discretion. Major deals among cement
companies such as those of UltraTech, Reliance Cements and Lafarge, are stuck
because the Mines and Minerals (Development and Regulation) Amendment Act,
2015, permits transfer of mining leases only for auctioned mines.
With the amendment cleared by the Cabinet, the government would be tabling it
in Parliament soon so that such deals, which involve transfer of non auctioned
mines, may go through smoothly. Auction of non-coal mines was introduced in the
new mining law. Earlier, all non-coal mines in India were handed out by state
governments on discretion.
In the biggest deal in the cement industry, UltraTech Cement is acquiring the
22.4MT cement capacity of debt-ridden Jaiprakash Associates for `17,000cr. To
reduce its debt, Reliance Infrastructure is selling its cement subsidiary to Birla Corp
for `4,800cr. And, as a condition for its merger with Holcim, the Competition
Commission of India had asked Lafarge to sell two units. The company was
unable to sell its two units to Birla Corp because the mining rights could not be
transferred.
In January, the government proposed the amendment to "spur merger and
acquisitions in the mining sector and help in checking the stressed and non-
performing assets of banks by allowing them to liquidate assets where a firm or its
captive mining lease is mortgaged".
Market Outlook
March 11, 2016
Govt lends HELP to revive oil sector
Faced with an investment challenge in the upstream oil and gas production sector,
the Union Cabinet announced major reforms to woo foreign investors and boost
the performance of the sector. The Cabinet Committee on Economic Affairs
(CCEA) approved a much-awaited policy, granting pricing and marketing freedom
to companies exploiting hydrocarbon reserves in difficult geological areas. The
aim is to ramp up domestic output to cut energy imports. It approved a new
Hydrocarbon Exploration Licensing Policy (HELP) that will replace the existing New
Exploration Licensing Policy (NELP) regime with more investor-friendly provisions of
revenue sharing and open acreage licensing.
Pricing freedom will benefit exploitation of 28 discoveries with 2.6 trillion cubic feet
of hydrocarbon reserves located in deep water, ultra deep water and high
pressure-high temperature areas, benefiting two of the country's largest upstream
companies - Oil and Natural Gas Corporation (ONGC) and Reliance Industries
Ltd (RIL).
The pricing and marketing freedom for exploitation would be capped by a ceiling
price that will be determined on the basis of landed price of alternative fuels. The
ceiling price (in $ per mmBtu) will be the lowest of three prices - landed price of
fuel oil; weighted average of the landed price of substitute fuels including coal,
fuel oil and naphtha; and landed price of imported liquefied natural gas (LNG).
The new HELP approval will allow exploration and production of conventional and
unconventional oil and gas including CBM (coalbed methane), shale gas, etc.
under a single license. The concept of Open Acreage Policy will also enable
exploration & production companies choose the blocks from designated areas.
The Union Cabinet also approved a policy for grant of extension to the production
sharing contracts (PSCs) for
28 small and medium-sized fields where the
recoverable reserves are unlikely to be produced within the remaining duration of
the contract periods. During the extended period of contracts for these blocks, the
government's share of profit petroleum will be 10% higher but royalty and cess will
be applicable at prevailing rates of nomination regime.
The Cabinet also approved cancellation of the award of medium-sized discovered
field of Ratna and R-Series to a consortium of Essar Oil and Oil Pacific UK, and
decided to revert the allocation of the fields to state-owned ONGC, the original
licensee.
Economic and Political News
Cabinet gives nod to `8,000cr rural LPG scheme
Siam cuts passenger vehicles growth forecast due to infrastructure cess
Movement rationalisation of coal leads to `1,371 crore savings
Corporate News
JSPL to reschedule foreign banks' debt in 4-6 weeks
BHEL starts 500 Mw thermal unit at Anpara-D power plant
IndiGo takes delivery of its first A320neo
Market Outlook
March 11, 2016
Top Picks ★★★★★
Large Cap
Market Cap
CMP
Target
Upside
Company
Rationale
(` Cr)
(`)
(`)
(%)
To outpace battery industry growth due to better technological
Amara Raja Batteries
15,467
906
1,040
14.9
products leading to market share gains in both the automotive
OEM and replacement segments.
Earnings to grow strongly given the MHCV cyclical upturn.
Ashok Leyland
27,448
96
111
15.1
Focus on exports and LCV's provides additional growth
avenue.
Uptick in defense capex by government when coupled with
Bharat Electronics
26,014
1,084
1,414
30.5
BELs strong market positioning, indicate that good times are
ahead for BEL.
The stock is trading at attractive valuations and is factoring all
HCL Tech
1,15,391
818
1,038
26.8
the bad news.
Strong visibility for a robust 20% earnings trajectory, coupled
HDFC Bank
2,57,838
1,021
1,262
23.7
with high quality of earnings on account of high quality retail
business and strategic focus on highly rated corporates.
Back on the growth trend, expect a long term growth of 14%
Infosys
2,63,218
1,146
1,347
17.5
to be a US$20bn in FY2020.
LICHF continues to grow its retail loan book at a healthy pace
with improvement in asset quality. We expect the company to
LIC Housing Finance
23,111
458
592
29.2
post a healthy loan book which is likely to reflect in a strong
earnings growth.
Huge bid pipeline of re-development works at Delhi and other
NBCC
11,094
925
1,089
17.8
State Governments and opportunity from Smart City, positions
NBCC to report strong growth, going forward.
New launches to enable outpace industry growth; margins
TVS Motors
13,469
284
330
16.4
expansion to boost earnings.
Source: Company, Angel Research
Mid Cap
Market Cap
CMP
Target
Upside
Company
Rationale
(` Cr)
(`)
(`)
(%)
Favourable outlook for the AC industry to augur well for
Cooling products business which is out pacing the market
Blue Star
2,964
330
439
33.2
growth. EMPPAC division's profitability to improve once
operating environment turns around.
Economic recovery to have favourable impact on advertising &
circulation revenue growth. Further, the acquisition of a radio
Jagran Prakashan
5,028
154
189
22.9
business (Radio City) would also boost the company's revenue
growth.
Massive capacity expansion along with rail advantage at ICD
Navkar Corporation
2,330
163
265
62.2
as well CFS augurs well for the company
Earnings boost on back of stable material prices and
Radico Khaitan
1,336
100
156
55.4
favourable pricing environment. Valuation discount to peers
provides additional comfort
Strong brands and distribution network would boost growth
Siyaram Silk Mills
935
997
1,354
35.8
going ahead. Stock currently trades at an inexpensive
valuation.
Source: Company, Angel Research
Market Outlook
March 11, 2016
Key Upcoming Events
Global economic events release calendar
Date
Time
Country
Event Description
Unit
Period
Bloomberg Data
Last Reported Estimated
Mar 11, 2016 5:30PM
India
Industrial Production YoY
% Change
Jan
(1.30)
(0.50)
Mar 14, 2016 12:00PM
India
Monthly Wholesale Prices YoY%
% Change
Feb
(0.90)
(0.23)
Mar 15, 2016
US
Producer Price Index (mom)
% Change
Feb
(0.50)
--
Mar 16, 2016 6:00PM
US
Consumer price index (mom)
% Change
Feb
--
(0.20)
6:00PM
US
Housing Starts
Thousands
Feb
1,099.00
1,150.00
6:00PM
US
Building permits
Thousands
Feb
1,202.00
1,201.00
3:00PM
UK
Jobless claims change
% Change
Feb
(14.80)
(9.00)
11:30PM
US
FOMC rate decision
%
Mar 16
0.50
0.50
Mar 17, 2016 3:30PM
Euro Zone
Euro-Zone CPI (YoY)
%
Feb F
(0.20)
(0.20)
Mar 21, 2016 7:30PM
US
Existing home sales
Million
Feb
5.47
--
Mar 22, 2016 3:00PM
UK
CPI (YoY)
% Change
Feb
0.30
--
Mar 23, 2016 8:30PM
Euro Zone
Euro-Zone Consumer Confidence
Value
Mar A
(8.80)
--
7:30PM
US
New home sales
Thousands
Feb
494.00
--
Mar 24, 2016 2:00PM
Germany
PMI Manufacturing
Value
Mar P
50.50
--
2:00PM
Germany
PMI Services
Value
Mar P
55.30
--
Mar 25, 2016 6:00PM
US
GDP Qoq (Annualised)
% Change
4Q T
1.00
--
Mar 29, 2016 7:30PM
US
Consumer Confidence
S.A./ 1985=100
Mar
92.20
--
Mar 31, 2016 1:25PM
Germany
Unemployment change (000's)
Thousands
Mar
(10.00)
--
2:00PM
UK
GDP (YoY)
% Change
4Q F
1.90
--
Apr 1, 2016
2:00PM
UK
PMI Manufacturing
Value
Mar
50.80
--
6:30AM
China
PMI Manufacturing
Value
Mar
49.00
--
6:00PM
US
Change in Nonfarm payrolls
Thousands
Mar
242.00
--
6:00PM
US
Unnemployment rate
%
Mar
4.90
--
Apr 5, 2016
11:00AM
India
RBI Reverse Repo rate
%
Apr 5
5.75
--
11:00AM
India
RBI Repo rate
%
Apr 5
6.75
--
Apr 13, 2016
China
Exports YoY%
% Change
Mar
(25.40)
--
Apr 15, 2016
7:30AM
China
Industrial Production (YoY)
% Change
Mar
5.90
--
7:30AM
China
Real GDP (YoY)
% Change
1Q
6.80
--
Source: Bloomberg, Angel Research
Market Outlook
March 11, 2016
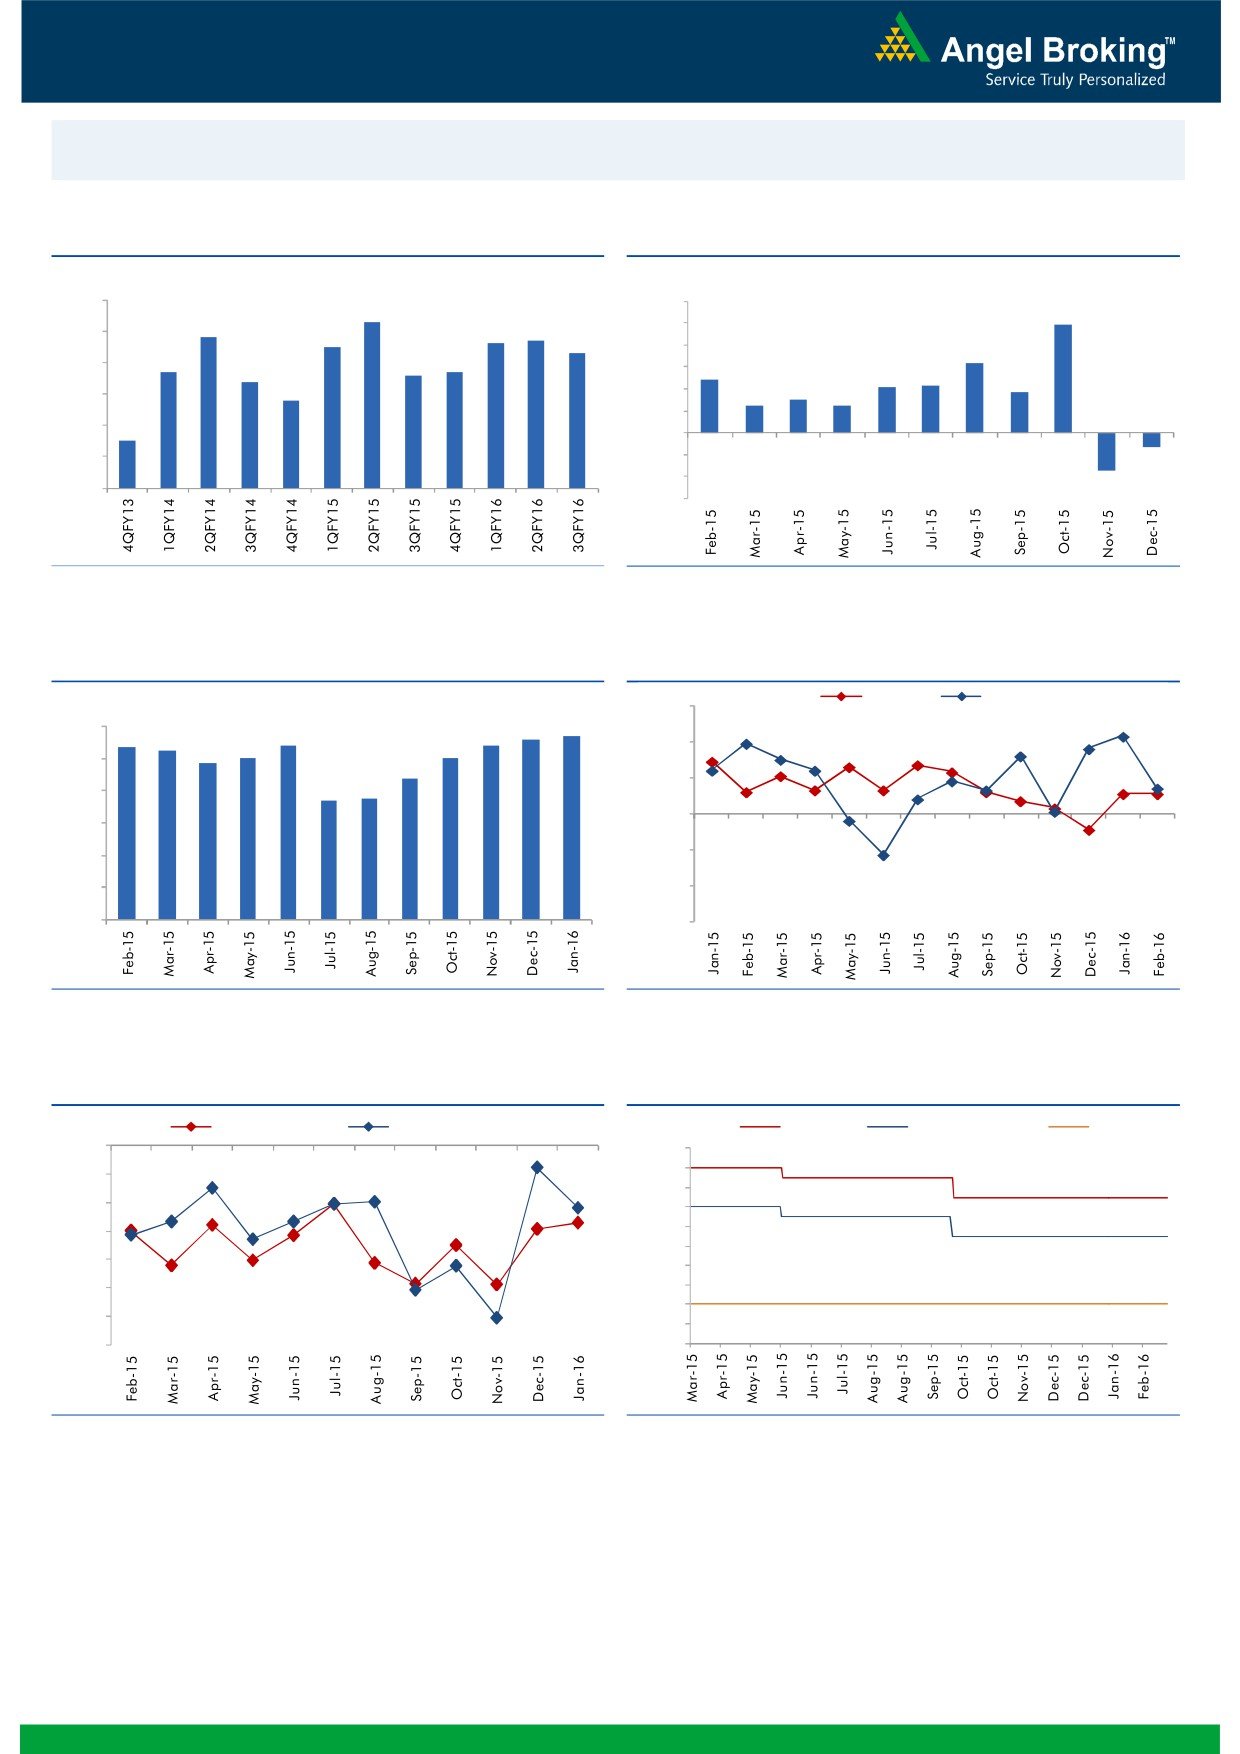
Macro watch
Exhibit 1: Quarterly GDP trends
Exhibit 2: IIP trends
(%)
(%)
9.0
12.0
8.3
9.9
7.8
7.7
10.0
8.0
7.5
7.6
7.3
8.0
6.3
6.7
6.6
6.7
7.0
6.4
4.8
6.0
4.2
4.3
3.7
5.8
4.0
2.5
3.0
2.5
6.0
2.0
5.0
4.5
-
4.0
(2.0)
(1.3)
(4.0)
3.0
(3.4)
(6.0)
Source: CSO, Angel Research
Source: MOSPI, Angel Research
Exhibit 3: Monthly CPI inflation trends
Exhibit 4: Manufacturing and services PMI
Mfg. PMI
Services PMI
(%)
56.0
5.6
5.7
6.0
5.4
5.4
5.4
5.3
4.9
5.0
5.0
54.0
5.0
4.4
52.0
3.7
3.7
4.0
50.0
3.0
48.0
2.0
1.0
46.0
-
44.0
Source: MOSPI, Angel Research
Source: Market, Angel Research; Note: Level above 50 indicates expansion
Exhibit 5: Exports and imports growth trends
Exhibit 6: Key policy rates
(%)
Exports yoy growth
Imports yoy growth
(%)
Repo rate
Reverse Repo rate
CRR
0.0
8.00
7.50
(5.0)
7.00
(10.0)
6.50
(15.0)
6.00
5.50
(20.0)
5.00
(25.0)
4.50
4.00
(30.0)
3.50
(35.0)
3.00
Source: Bloomberg, Angel Research
Source: RBI, Angel Research
Market Outlook
March 11, 2016
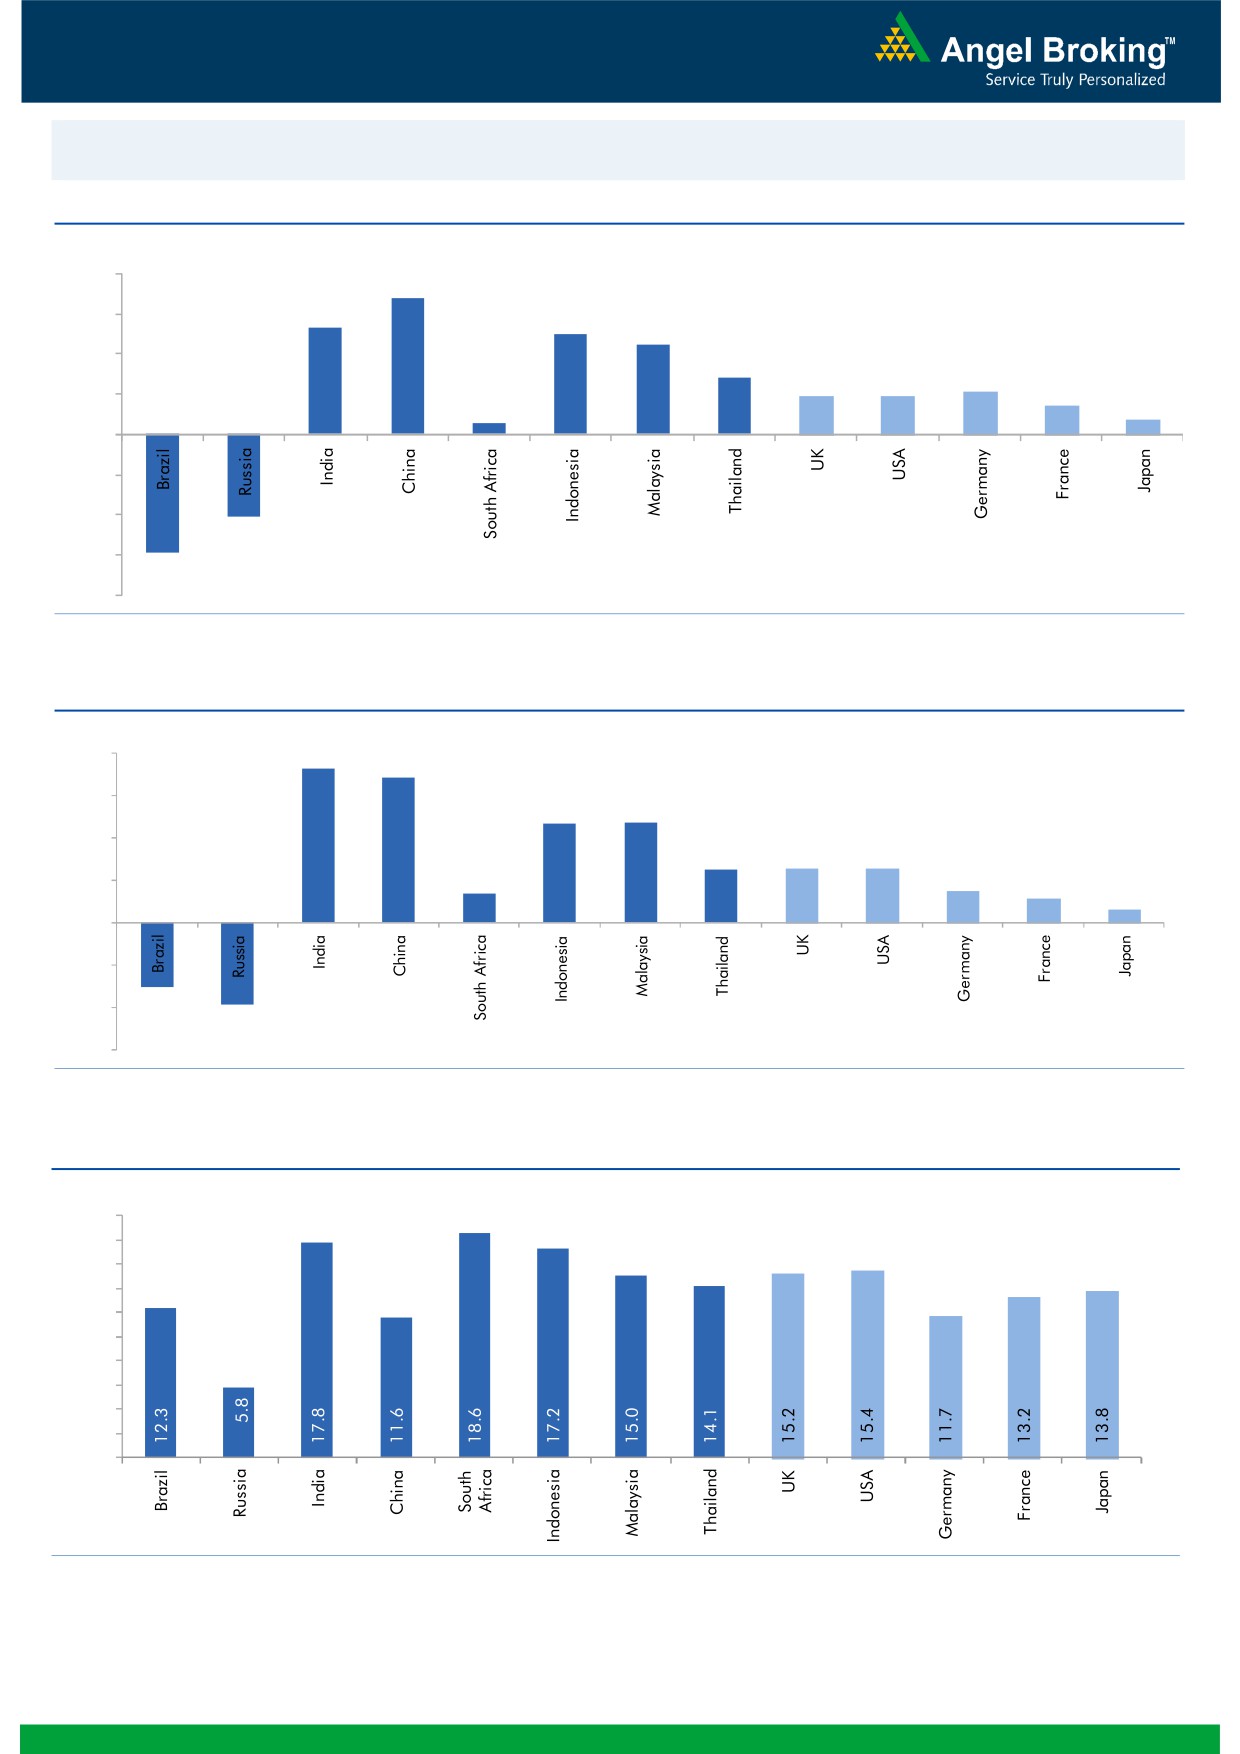
Global watch
Exhibit 1: Latest quarterly GDP Growth (%, yoy) across select developing and developed countries
(%)
8.0
6.8
6.0
5.3
5.0
4.5
4.0
2.8
1.9
1.9
2.1
1.4
2.0
0.6
0.7
-
(2.0)
(4.0)
(4.1)
(6.0)
(5.9)
(8.0)
Source: Bloomberg, Angel Research
Exhibit 2: 2015 GDP Growth projection by IMF (%, yoy) across select developing and developed countries
(%)
8.0
7.3
6.8
6.0
4.7
4.7
4.0
2.5
2.5
2.6
1.4
1.5
2.0
1.2
0.6
-
(2.0)
(3.0)
(4.0)
(3.8)
(6.0)
Source: IMF, Angel Research
Exhibit 3: One year forward P-E ratio across select developing and developed countries
(x)
20.0
18.0
16.0
14.0
12.0
10.0
8.0
6.0
4.0
2.0
-
Source: IMF, Angel Research
Market Outlook
March 11, 2016
Exhibit 4: Relative performance of indices across globe
Returns (%)
Country
Name of index
Closing price
1M
3M
1YR
Brazil
Bovespa
49,571
22.1
10.4
(3.4)
Russia
Micex
1,885
5.8
5.4
13.2
India
Nifty
7,486
1.3
(2.8)
(16.2)
China
Shanghai Composite
2,805
1.9
(20.8)
(14.9)
South Africa
Top 40
45,548
6.0
3.2
(0.6)
Mexico
Mexbol
44,337
4.6
5.0
2.6
Indonesia
LQ45
834
(0.7)
6.2
(12.7)
Malaysia
KLCI
1,691
1.7
0.8
(7.4)
Thailand
SET 50
888
7.6
3.8
(14.9)
USA
Dow Jones
16,995
6.0
(4.1)
(5.0)
UK
FTSE
6,037
7.2
(1.6)
(10.4)
Japan
Nikkei
16,852
(0.9)
(13.6)
(10.4)
Germany
DAX
9,498
7.0
(12.7)
(20.2)
France
CAC
4,350
8.8
(6.2)
(13.6)
Source: Bloomberg, Angel Research
Stock Watch
March 11, 2016
Company Name
Reco
CMP
Target
Mkt Cap
Sales ( Čcr )
OPM(%)
EPS (Č)
PER(x)
P/BV(x)
RoE(%)
EV/Sales(x)
(Č)
Price ( Č)
( Č cr )
FY16E FY17E
FY16E
FY17E
FY16E
FY17E
FY16E
FY17E
FY16E
FY17E
FY16E
FY17E
FY16E
FY17E
Agri / Agri Chemical
Rallis
Neutral
154
-
2,990
2,097
2,415
14.4
14.4
9.5
11.0
16.2
14.0
3.2
2.8
21.1
21.3
1.5
1.3
United Phosphorus
Accumulate
447
480
19,161
12,500
14,375
18.3
18.3
29.8
35.9
15.0
12.5
2.8
2.3
20.0
20.3
1.6
1.3
Auto & Auto Ancillary
Ashok Leyland
Buy
96
111
27,448
17,995
21,544
11.4
11.6
3.4
4.7
28.4
20.5
5.0
4.6
17.7
22.2
1.5
1.2
Bajaj Auto
Accumulate
2,320
2,585
67,130
22,709
25,860
20.9
20.1
129.0
143.6
18.0
16.2
5.5
4.8
30.7
29.4
2.5
2.2
Bharat Forge
Accumulate
822
875
19,136
7,351
8,318
19.9
19.7
31.2
36.5
26.4
22.5
4.7
4.0
19.3
19.2
2.7
2.4
Eicher Motors
Neutral
19,800
-
53,779
15,556
16,747
15.5
17.3
464.8
597.5
42.6
33.1
15.6
11.4
36.2
34.3
3.4
3.1
Gabriel India
Accumulate
88
101
1,264
1,415
1,544
8.7
9.0
4.6
5.4
19.1
16.3
3.5
3.1
18.1
18.9
0.9
0.8
Hero Motocorp
Neutral
2,812
-
56,154
28,244
30,532
15.5
15.9
156.7
168.5
18.0
16.7
7.2
6.1
39.9
36.4
1.8
1.7
Jamna Auto Industries Buy
137
160
1,094
1,281
1,473
11.2
11.5
7.6
9.2
18.0
14.9
4.6
3.7
25.4
25.2
0.9
0.8
L G Balakrishnan & Bros Neutral
422
-
663
1,254
1,394
11.6
11.8
35.9
41.7
11.8
10.1
1.6
1.4
13.5
13.8
0.6
0.6
Mahindra and Mahindra Accumulate
1,226
1,364
76,149
38,416
42,904
13.7
13.9
54.8
63.4
22.4
19.3
3.5
3.1
15.4
15.8
1.6
1.4
Maruti
Neutral
3,627
-
109,569
57,865
68,104
16.4
16.7
176.3
225.5
20.6
16.1
4.0
3.4
19.4
21.2
1.7
1.4
Minda Industries
Accumulate
914
1,047
1,450
2,523
2,890
8.7
9.0
55.0
65.4
16.6
14.0
3.2
2.6
19.3
18.7
0.7
0.6
Motherson Sumi
Buy
240
313
31,686
39,343
45,100
8.8
9.1
10.1
12.5
23.7
19.2
7.5
5.9
35.3
34.4
0.9
0.8
Rane Brake Lining
Buy
365
465
289
454
511
11.5
12.0
25.2
31.0
14.5
11.8
2.2
2.0
14.9
16.6
0.8
0.7
Setco Automotive
Neutral
31
-
413
594
741
12.7
13.7
1.7
3.2
18.2
9.7
1.9
1.7
10.4
16.9
1.1
0.9
Tata Motors
Accumulate
348
371
100,590
259,686
273,957
13.0
13.4
25.9
29.5
13.5
11.8
1.8
1.5
8.0
9.0
0.6
0.6
TVS Motor
Buy
284
330
13,469
11,263
13,122
6.9
8.5
9.2
15.0
30.8
18.9
7.0
5.6
22.7
29.6
1.2
1.0
Amara Raja Batteries
Accumulate
906
1,040
15,467
4,892
5,871
17.4
17.6
28.8
37.1
31.4
24.4
7.3
5.9
23.4
24.1
3.1
2.5
Exide Industries
Buy
133
162
11,339
6,950
7,784
14.4
14.8
6.6
7.3
20.2
18.3
2.6
2.3
12.6
12.8
1.3
1.2
Apollo Tyres
Accumulate
168
183
8,575
12,056
12,714
17.2
16.4
23.0
20.3
7.3
8.3
1.3
1.1
17.7
13.6
0.8
0.8
Ceat
Accumulate
1,063
1,119
4,301
6,041
6,597
14.1
13.7
99.5
111.9
10.7
9.5
2.1
1.8
19.6
18.5
0.9
0.7
JK Tyres
Neutral
82
-
1,852
7,446
7,669
15.2
14.0
19.6
18.4
4.2
4.4
1.1
0.9
25.2
19.5
0.6
0.6
Swaraj Engines
Accumulate
843
919
1,047
552
630
14.2
14.7
44.6
54.1
18.9
15.6
4.4
4.0
23.2
25.6
1.7
1.5
Subros
Neutral
87
-
522
1,293
1,527
11.8
11.9
4.2
6.7
20.7
13.0
1.6
1.4
7.7
11.5
0.7
0.6
Indag Rubber
Neutral
166
-
436
283
329
17.0
17.2
13.0
15.4
12.8
10.8
2.8
2.3
21.8
21.6
1.3
1.0
Capital Goods
ACE
Neutral
38
-
372
660
839
4.7
8.2
1.0
3.9
37.6
9.6
1.2
1.0
3.2
11.3
0.7
0.6
BEML
Accumulate
1,038
1,157
4,321
3,277
4,006
6.0
8.9
36.2
64.3
28.7
16.1
2.0
1.8
5.7
11.7
1.4
1.1
Bharat Electronics
Buy
1,084
1,414
26,014
7,737
8,634
16.8
17.2
54.0
61.5
20.1
17.6
2.9
2.5
39.3
45.6
2.5
2.1
Stock Watch
March 11, 2016
Company Name
Reco
CMP
Target
Mkt Cap
Sales ( Čcr )
OPM(%)
EPS (Č)
PER(x)
P/BV(x)
RoE(%)
EV/Sales(x)
(Č)
Price ( Č)
( Č cr )
FY16E
FY17E
FY16E
FY17E
FY16E
FY17E
FY16E
FY17E
FY16E
FY17E
FY16E
FY17E
FY16E
FY17E
Capital Goods
Voltas
Buy
238
353
7,865
5,363
5,963
8.0
9.1
11.0
13.8
21.6
17.2
3.3
2.9
16.2
17.9
1.4
1.3
BGR Energy
Neutral
104
-
748
3,615
3,181
9.5
9.4
16.7
12.4
6.2
8.4
0.6
0.6
10.0
7.0
0.6
0.8
BHEL
Neutral
104
-
25,541
33,722
35,272
10.8
11.7
10.5
14.2
9.9
7.4
0.7
0.7
7.0
9.0
0.8
0.8
Blue Star
Buy
330
439
2,964
3,548
3,977
6.3
6.9
13.7
17.2
24.1
19.2
6.1
3.9
26.1
25.4
0.9
0.8
Crompton Greaves
Neutral
151
-
9,458
13,484
14,687
4.9
6.2
4.5
7.1
33.5
21.3
2.4
2.2
7.2
10.8
0.8
0.8
Greaves Cotton
Neutral
126
-
3,073
1,655
1,755
16.6
16.8
7.4
7.8
17.0
16.1
3.4
3.2
21.1
20.6
1.8
1.7
Inox Wind
Buy
270
458
5,998
4,980
5,943
17.0
17.5
26.6
31.6
10.2
8.6
3.0
2.2
35.0
30.0
1.4
1.1
KEC International
Neutral
115
-
2,951
8,791
9,716
6.1
6.8
5.4
8.2
21.3
14.0
2.1
2.0
10.0
14.0
0.6
0.5
Thermax
Neutral
755
-
9,000
6,413
7,525
7.4
8.5
30.5
39.3
24.8
19.2
3.8
3.3
15.0
17.0
1.4
1.1
Cement
ACC
Neutral
1,230
-
23,089
13,151
14,757
16.4
18.3
63.9
83.4
19.3
14.8
2.5
2.3
13.3
16.1
1.6
1.3
Ambuja Cements
Neutral
201
-
31,255
11,564
12,556
19.4
20.7
8.9
10.1
22.6
19.9
2.8
2.7
12.8
13.8
2.3
2.1
HeidelbergCement
Neutral
70
-
1,591
1,772
1,926
13.3
15.4
1.0
3.0
70.2
23.4
1.8
1.6
2.6
7.9
1.5
1.3
India Cements
Neutral
75
-
2,316
4,216
4,840
18.0
19.5
4.0
9.9
18.9
7.6
0.8
0.7
4.0
9.5
0.9
0.7
JK Cement
Accumulate
559
605
3,909
3,661
4,742
10.1
15.8
7.5
28.5
74.6
19.6
2.2
2.0
7.5
22.9
1.5
1.2
J K Lakshmi Cement
Neutral
300
-
3,531
2,947
3,616
16.7
19.9
11.5
27.2
26.1
11.0
2.5
2.1
9.8
20.8
1.6
1.3
Mangalam Cements
Neutral
184
-
492
1,053
1,347
10.5
13.3
8.4
26.0
21.9
7.1
0.9
0.9
4.3
12.5
0.8
0.6
Orient Cement
Neutral
138
-
2,830
1,854
2,524
21.2
22.2
7.7
11.1
17.9
12.5
2.6
2.2
13.3
15.7
2.3
1.6
Ramco Cements
Neutral
379
-
9,015
4,036
4,545
20.8
21.3
15.1
18.8
25.1
20.1
3.1
2.7
12.9
14.3
2.7
2.4
Shree Cement^
Neutral
11,150
-
38,844
7,150
8,742
26.7
28.6
228.0
345.5
48.9
32.3
7.2
6.0
15.7
20.3
5.2
4.2
UltraTech Cement
Neutral
2,996
-
82,205
24,669
29,265
18.2
20.6
82.0
120.0
36.5
25.0
3.9
3.4
11.3
14.7
3.4
2.9
Construction
ITNL
Neutral
72
-
2,377
7,360
8,825
34.0
35.9
7.0
9.0
10.3
8.0
0.4
0.3
3.2
3.7
3.7
3.6
KNR Constructions
Buy
517
603
1,454
937
1,470
14.3
14.0
44.2
38.6
11.7
13.4
2.3
2.0
15.4
15.4
1.6
1.1
Larsen & Toubro
Accumulate
1,186
1,310
110,473
58,870
65,708
8.3
10.3
42.0
53.0
28.2
22.4
2.0
1.8
8.8
11.2
2.1
1.9
Gujarat Pipavav Port
Neutral
158
-
7,638
629
684
51.0
52.2
6.4
5.9
24.7
26.8
3.3
3.0
15.9
12.7
11.8
10.6
MBL Infrastructures
Buy
140
285
580
2,313
2,797
12.2
14.6
19.0
20.0
7.4
7.0
0.8
0.7
11.3
10.6
1.0
0.9
Nagarjuna Const.
Neutral
69
-
3,814
7,892
8,842
8.8
9.1
3.0
5.3
22.9
12.9
1.1
1.1
5.0
8.5
0.7
0.6
PNC Infratech
Accumulate
489
558
2,511
1,873
2,288
13.2
13.5
24.0
32.0
20.4
15.3
2.0
1.8
12.1
12.3
1.4
1.2
Simplex Infra
Neutral
215
-
1,063
5,955
6,829
10.3
10.5
16.0
31.0
13.4
6.9
0.7
0.7
5.3
9.9
0.7
0.6
Power Mech Projects
Neutral
577
-
849
1,539
1,801
12.8
12.7
59.0
72.1
9.8
8.0
1.5
1.2
18.6
16.8
0.6
0.5
Stock Watch
March 11, 2016
Company Name
Reco
CMP
Target
Mkt Cap
Sales ( Čcr )
OPM(%)
EPS (Č)
PER(x)
P/BV(x)
RoE(%)
EV/Sales(x)
(Č)
Price ( Č)
( Č cr )
FY16E
FY17E
FY16E
FY17E
FY16E
FY17E
FY16E
FY17E
FY16E
FY17E
FY16E
FY17E
FY16E
FY17E
Construction
Sadbhav Engineering
Buy
244
289
4,184
3,481
4,219
10.7
10.8
8.2
11.7
29.7
20.9
2.8
2.5
10.3
13.5
1.5
1.2
NBCC
Buy
925
1,089
11,094
5,816
7,382
6.9
7.7
29.6
39.8
31.2
23.2
5.6
4.4
24.1
26.7
1.6
1.3
MEP Infra
Neutral
39
-
639
1,956
1,876
28.1
30.5
1.3
3.0
30.2
13.1
6.3
4.3
21.2
32.8
1.7
1.7
SIPL
Neutral
89
-
3,149
675
1,042
62.4
64.7
-
-
3.4
3.8
-
-
16.3
11.0
Financials
Allahabad Bank
Neutral
51
-
3,084
8,569
9,392
2.8
2.9
16.3
27.5
3.2
1.9
0.3
0.2
7.6
11.9
-
-
Axis Bank
Buy
413
494
98,381
26,473
31,527
3.5
3.6
35.7
43.5
11.6
9.5
1.9
1.7
17.9
18.9
-
-
Bank of Baroda
Neutral
139
-
32,108
18,485
21,025
1.9
2.0
13.5
21.1
10.4
6.6
0.8
0.7
7.3
10.6
-
-
Bank of India
Neutral
94
-
7,612
15,972
17,271
1.9
2.0
15.3
33.4
6.1
2.8
0.3
0.2
3.6
7.6
-
-
Canara Bank
Neutral
180
-
9,766
15,441
16,945
2.0
2.1
46.6
70.4
3.9
2.6
0.3
0.3
8.0
11.2
-
-
Dena Bank
Neutral
29
-
1,842
3,440
3,840
2.1
2.3
7.3
10.0
3.9
2.8
0.3
0.2
6.1
7.9
-
-
Federal Bank
Neutral
49
-
8,409
3,477
3,999
3.0
3.0
5.0
6.2
9.8
7.8
1.0
0.9
10.6
11.9
-
-
HDFC
Neutral
1,153
-
182,034
10,358
11,852
3.3
3.3
41.1
47.0
28.1
24.5
5.3
4.9
24.7
24.9
-
-
HDFC Bank
Buy
1,021
1,262
257,838
38,309
47,302
4.3
4.3
49.3
61.1
20.7
16.7
3.6
3.1
18.5
19.7
-
-
ICICI Bank
Buy
215
254
125,243
34,279
39,262
3.3
3.3
21.0
24.4
10.3
8.8
1.7
1.5
14.4
14.7
-
-
IDBI Bank
Neutral
66
-
12,550
9,625
10,455
1.8
1.8
8.5
14.2
7.8
4.7
0.5
0.4
5.9
9.3
-
-
Indian Bank
Neutral
103
-
4,942
6,160
6,858
2.5
2.5
24.5
29.8
4.2
3.5
0.3
0.3
7.7
8.6
-
-
LIC Housing Finance
Buy
458
592
23,111
3,101
3,745
2.5
2.5
33.0
40.2
13.9
11.4
2.6
2.2
19.7
20.5
-
-
Oriental Bank
Neutral
89
-
2,681
7,643
8,373
2.4
2.4
37.2
45.4
2.4
2.0
0.2
0.2
8.2
9.4
-
-
Punjab Natl.Bank
Neutral
82
-
16,052
23,638
26,557
2.8
2.8
17.9
27.2
4.6
3.0
0.5
0.4
8.5
12.0
-
-
South Ind.Bank
Neutral
18
-
2,390
1,965
2,185
2.5
2.5
2.5
3.3
7.1
5.4
0.7
0.6
9.5
11.7
-
-
St Bk of India
Neutral
181
-
140,235
79,958
86,061
2.6
2.6
13.4
20.7
13.5
8.7
1.1
1.0
11.5
12.8
-
-
Union Bank
Neutral
124
-
8,538
12,646
14,129
2.3
2.4
31.0
39.1
4.0
3.2
0.4
0.4
9.8
11.4
-
-
Vijaya Bank
Neutral
32
-
2,745
3,536
3,827
1.9
1.9
5.5
6.7
5.8
4.8
0.5
0.4
7.8
8.8
-
-
Yes Bank
Neutral
792
-
33,300
7,190
9,011
3.2
3.3
58.2
69.7
13.6
11.4
2.4
2.1
19.2
19.6
-
-
FMCG
Asian Paints
Neutral
893
-
85,671
16,553
19,160
16.0
16.2
17.7
21.5
50.5
41.5
13.4
12.1
29.4
31.2
5.0
4.3
Britannia
Neutral
2,829
-
33,940
8,481
9,795
14.0
14.1
65.5
78.3
43.2
36.1
20.4
16.8
38.3
41.2
3.9
3.3
Colgate
Neutral
808
-
21,972
4,836
5,490
19.5
19.7
48.5
53.2
16.7
15.2
12.2
10.6
99.8
97.5
4.4
3.9
Dabur India
Accumulate
246
267
43,275
9,370
10,265
17.1
17.2
7.3
8.1
33.5
30.4
10.1
8.2
33.7
30.6
4.5
4.1
GlaxoSmith Con*
Accumulate
5,673
6,118
23,857
4,919
5,742
17.2
17.4
168.3
191.2
33.7
29.7
9.6
8.1
28.8
28.9
4.4
3.7
Stock Watch
March 11, 2016
Company Name
Reco
CMP
Target
Mkt Cap
Sales ( Čcr )
OPM(%)
EPS (Č)
PER(x)
P/BV(x)
RoE(%)
EV/Sales(x)
(Č)
Price ( Č)
( Č cr )
FY16E FY17E
FY16E
FY17E
FY16E
FY17E
FY16E
FY17E
FY16E
FY17E
FY16E
FY17E
FY16E
FY17E
FMCG
Godrej Consumer
Neutral
1,248
-
42,505
10,168
12,886
16.1
16.1
32.1
38.4
38.9
32.5
7.9
7.3
19.7
21.0
4.3
3.4
HUL
Neutral
838
-
181,235
34,940
38,957
17.5
17.7
20.8
24.7
40.3
33.9
44.8
35.8
110.5
114.2
5.0
4.5
ITC
Accumulate
316
359
254,049
36,804
38,776
37.9
37.9
12.2
12.9
25.9
24.5
7.2
6.3
27.7
25.8
6.5
6.1
Marico
Neutral
238
-
30,674
6,551
7,766
15.7
16.0
10.4
12.5
22.9
19.0
6.7
5.5
33.2
32.4
4.6
3.9
Nestle*
Buy
5,186
6,646
50,000
11,291
12,847
22.2
22.3
158.9
184.6
32.6
28.1
17.1
15.3
55.0
57.3
4.3
3.7
Tata Global
Buy
116
144
7,350
8,635
9,072
9.8
9.9
6.5
7.6
17.9
15.3
1.8
1.7
6.8
7.4
0.8
0.8
IT
HCL Tech^
Buy
818
1,038
115,391
42,038
47,503
21.2
21.5
51.5
57.7
15.9
14.2
3.4
2.7
21.5
18.8
2.4
1.9
Infosys
Buy
1,146
1,347
263,218
61,850
69,981
27.5
27.5
59.4
65.7
19.3
17.4
4.1
3.5
21.2
20.1
3.5
3.0
TCS
Buy
2,348
2,854
462,656
108,487
122,590
28.3
28.5
122.8
138.4
19.1
17.0
7.3
6.6
38.0
38.9
3.9
3.4
Tech Mahindra
Accumulate
466
530
45,095
26,524
29,177
16.2
17.0
28.8
33.6
16.2
13.9
3.1
2.7
19.3
19.1
1.5
1.3
Wipro
Buy
536
680
132,424
50,808
56,189
23.7
23.8
37.3
40.7
14.4
13.2
2.7
2.5
19.2
17.7
2.1
1.7
Media
D B Corp
Accumulate
325
356
5,971
2,241
2,495
27.8
27.9
21.8
25.6
14.9
12.7
3.9
3.4
26.7
28.5
2.6
2.3
HT Media
Neutral
82
-
1,911
2,495
2,603
11.2
11.2
7.3
8.6
11.3
9.6
0.9
0.8
7.4
8.1
0.3
0.3
Jagran Prakashan
Buy
154
189
5,028
2,170
2,355
27.2
26.2
8.9
9.9
17.3
15.5
3.6
3.2
20.9
20.5
2.2
2.0
Sun TV Network
Neutral
342
-
13,460
2,779
3,196
70.2
70.5
22.8
27.3
15.0
12.5
3.7
3.3
26.7
28.3
4.6
4.0
Hindustan Media
Neutral
261
-
1,914
920
1,031
20.0
20.0
19.2
20.9
13.6
12.5
2.2
1.9
16.4
15.3
1.6
1.4
Ventures
Metals & Mining
Coal India
Buy
322
380
203,513
76,167
84,130
19.9
22.3
22.4
25.8
14.4
12.5
5.2
5.1
35.5
41.0
2.0
1.8
Hind. Zinc
Neutral
169
-
71,598
14,641
14,026
50.4
50.4
17.7
16.0
9.6
10.6
1.5
1.3
16.2
13.2
2.5
2.4
Hindalco
Neutral
84
-
17,274
104,356
111,186
8.7
9.5
6.7
11.1
12.5
7.6
0.4
0.4
3.5
5.9
0.7
0.6
JSW Steel
Neutral
1,184
-
28,621
42,308
45,147
16.4
20.7
(10.3)
49.5
23.9
1.3
1.3
(1.0)
5.6
1.7
1.6
NMDC
Neutral
93
-
36,931
8,237
10,893
46.6
44.5
10.0
11.7
9.4
8.0
1.0
0.9
12.5
13.0
4.3
3.3
SAIL
Neutral
43
-
17,656
45,915
53,954
7.2
10.5
1.5
4.4
28.4
9.8
0.4
0.4
2.3
4.1
1.0
0.9
Vedanta
Neutral
88
-
26,163
71,445
81,910
26.2
26.3
12.9
19.2
6.9
4.6
0.5
0.4
7.2
8.9
0.8
0.6
Tata Steel
Neutral
296
-
28,763
126,760
137,307
8.9
11.3
6.4
23.1
46.6
12.8
0.9
0.9
2.0
7.1
0.8
0.8
Oil & Gas
Cairn India
Neutral
141
-
26,379
11,323
12,490
49.4
51.0
20.7
20.7
6.8
6.8
0.4
0.4
6.4
6.1
1.4
0.8
GAIL
Neutral
341
-
43,299
64,856
70,933
9.1
9.6
24.0
28.9
14.3
11.8
1.2
1.1
8.8
9.6
0.9
0.8
ONGC
Neutral
206
-
175,986
154,564
167,321
36.8
37.4
28.6
32.5
7.2
6.3
0.9
0.8
12.7
13.5
1.3
1.3
Petronet LNG
Neutral
248
-
18,608
29,691
31,188
5.8
6.2
12.8
13.4
19.4
18.5
2.9
2.6
15.8
14.8
0.7
0.7
Indian Oil Corp
Buy
386
455
93,743
359,607
402,760
5.9
6.1
42.5
48.7
9.1
7.9
1.2
1.1
14.1
14.4
0.4
0.3
Stock Watch
March 11, 2016
Company Name
Reco
CMP
Target
Mkt Cap
Sales ( Čcr )
OPM(%)
EPS (Č)
PER(x)
P/BV(x)
RoE(%)
EV/Sales(x)
(Č)
Price ( Č)
( Č cr )
FY16E FY17E
FY16E
FY17E
FY16E
FY17E
FY16E
FY17E
FY16E
FY17E
FY16E
FY17E
FY16E
FY17E
Oil & Gas
Reliance Industries
Accumulate
1,012
1,150
327,899
304,775
344,392
12.6
13.4
91.3
102.6
11.1
9.9
1.3
1.1
11.8
12.0
1.0
0.8
Pharmaceuticals
Alembic Pharma
Neutral
623
-
11,744
3,274
3,802
26.9
19.4
35.0
28.7
17.8
21.7
7.9
5.9
55.6
31.2
3.6
3.0
Aurobindo Pharma
Buy
724
856
42,323
14,923
17,162
22.0
23.0
35.7
42.8
20.3
16.9
6.0
4.5
34.0
30.2
3.2
2.7
Aventis*
Neutral
4,395
-
10,122
2,082
2,371
17.4
20.8
118.2
151.5
37.2
29.0
5.4
4.4
19.9
25.5
4.5
3.8
Cadila Healthcare
Neutral
345
-
35,309
10,224
11,840
21.0
22.0
14.6
17.6
23.6
19.6
6.5
5.1
30.8
29.0
3.5
3.0
Cipla
Accumulate
534
605
42,936
13,979
16,447
20.2
18.6
25.7
27.5
20.8
19.4
3.4
2.9
17.6
16.1
3.1
2.5
Dr Reddy's
Buy
3,184
3,933
54,303
16,838
19,575
25.0
23.1
167.5
178.8
19.0
17.8
4.0
3.3
23.1
20.4
3.2
2.7
Dishman Pharma
Neutral
363
-
2,932
1,733
1,906
21.5
21.5
17.0
19.9
21.4
18.3
2.2
1.9
10.5
11.2
2.2
1.9
GSK Pharma*
Neutral
3,218
-
27,260
2,870
3,158
20.0
22.1
59.5
68.3
54.1
47.1
16.0
16.4
28.5
34.3
9.0
8.2
Indoco Remedies
Neutral
282
-
2,595
1,033
1,199
15.9
18.2
9.4
13.6
30.0
20.7
4.4
3.8
15.7
19.7
2.6
2.3
Ipca labs
Buy
545
900
6,875
3,363
3,909
12.9
18.6
13.4
28.0
40.7
19.5
2.9
2.6
7.4
14.0
2.3
2.0
Lupin
Neutral
1,821
-
82,044
13,092
16,561
25.0
27.0
50.4
68.3
36.1
26.7
7.5
5.9
22.8
24.7
6.0
4.6
Sun Pharma
Accumulate
865
950
208,213
28,163
32,610
25.8
30.7
17.4
26.9
49.7
32.2
4.7
4.1
13.0
16.6
6.9
5.7
Power
Tata Power
Neutral
59
-
15,930
35,923
37,402
22.6
22.8
4.1
5.2
14.5
11.4
1.1
1.0
7.5
9.3
1.4
1.3
NTPC
Buy
127
146
104,676
87,271
99,297
23.5
23.5
11.8
13.3
10.8
9.6
1.2
1.1
11.5
12.2
2.2
2.0
Power Grid
Buy
140
170
72,981
20,702
23,361
86.7
86.4
12.1
13.2
11.6
10.6
1.7
1.5
15.6
15.1
8.5
7.9
Telecom
Bharti Airtel
Neutral
336
-
134,293
101,748
109,191
32.1
31.7
12.0
12.5
28.0
26.9
1.9
1.8
6.9
6.7
2.0
1.8
Idea Cellular
Neutral
105
-
37,679
34,282
36,941
32.0
31.5
5.9
6.2
17.7
16.9
1.6
1.5
9.9
9.3
1.7
1.6
zOthers
Abbott India
Neutral
4,904
-
10,420
2,715
3,153
14.5
14.1
134.3
152.2
36.5
32.2
9.1
7.5
27.4
25.6
3.6
3.0
Bajaj Electricals
Buy
188
237
1,895
4,719
5,287
5.2
5.8
8.6
12.7
21.9
14.8
2.5
2.2
11.4
14.8
0.4
0.4
Finolex Cables
Neutral
232
-
3,547
2,520
2,883
12.2
12.0
12.7
14.2
18.3
16.3
2.5
2.2
13.6
13.5
1.2
1.0
Goodyear India*
Buy
475
582
1,095
1,800
1,600
11.7
11.5
58.7
52.9
8.1
9.0
1.8
1.6
24.6
18.7
0.4
0.4
Hitachi
Neutral
1,135
-
3,085
1,779
2,081
7.8
8.8
21.8
33.4
52.0
33.9
8.4
6.8
17.4
22.1
1.8
1.5
Jyothy Laboratories
Neutral
289
-
5,226
1,620
1,847
11.5
11.5
7.3
8.5
39.6
34.1
5.1
4.7
13.3
14.4
3.1
2.6
MRF
Buy
34,387
45,575
14,584
20,316
14,488
21.4
21.1
5,488.0
3,798.0
6.3
9.1
2.1
1.7
41.1
21.2
0.7
0.9
Page Industries
Neutral
11,372
-
12,684
1,929
2,450
19.8
20.1
229.9
299.0
49.5
38.0
21.8
15.2
52.1
47.1
6.6
5.2
Relaxo Footwears
Neutral
388
-
4,652
1,767
2,152
12.3
12.5
19.3
25.1
20.1
15.5
4.9
3.8
27.7
27.8
2.7
2.2
Siyaram Silk Mills
Buy
997
1,354
935
1,636
1,815
11.5
11.5
89.9
104.1
11.1
9.6
1.8
1.6
17.9
17.8
0.7
0.7
Styrolution ABS India*
Neutral
564
-
992
1,271
1,440
8.6
9.2
32.0
41.1
17.6
13.7
1.8
1.6
10.7
12.4
0.7
0.6
Stock Watch
March 11, 2016
Company Name
Reco
CMP
Target
Mkt Cap
Sales ( Čcr )
OPM(%)
EPS (Č)
PER(x)
P/BV(x)
RoE(%)
EV/Sales(x)
(Č)
Price ( Č)
( Č cr )
FY16E
FY17E
FY16E
FY17E
FY16E
FY17E
FY16E
FY17E
FY16E
FY17E
FY16E
FY17E
FY16E
FY17E
zOthers
TVS Srichakra
Buy
2,242
3,217
1,717
2,035
2,252
15.9
15.3
248.6
268.1
9.0
8.4
3.9
2.8
43.6
33.9
0.9
0.7
HSIL
Accumulate
271
302
1,960
2,123
2,384
16.1
16.5
15.0
18.9
18.0
14.4
1.4
1.3
8.0
9.4
1.3
1.1
Kirloskar Engines India
Neutral
210
-
3,043
2,403
2,554
8.6
9.9
9.2
10.5
22.9
20.1
2.2
2.1
9.7
10.7
0.9
0.8
Ltd
M M Forgings
Buy
422
614
509
511
615
21.7
21.6
43.1
55.8
9.8
7.6
1.8
1.5
19.9
21.2
1.2
0.9
Banco Products (India) Neutral
101
-
721
1,208
1,353
11.0
12.3
10.8
14.5
9.4
7.0
1.1
1.0
11.9
14.5
0.6
0.5
Competent Automobiles Neutral
126
-
77
1,040
1,137
3.2
3.1
25.7
28.0
4.9
4.5
0.7
0.6
15.0
14.3
0.1
0.1
Nilkamal
Neutral
1,100
-
1,642
1,871
2,031
10.7
10.5
63.2
69.8
17.4
15.8
2.8
2.4
17.6
16.6
0.9
0.8
Visaka Industries
Buy
113
144
179
1,086
1,197
9.9
10.3
21.5
28.8
5.2
3.9
0.5
0.5
9.6
11.6
0.4
0.3
Transport Corporation of
Neutral
275
-
2,092
2,830
3,350
8.8
9.0
14.4
18.3
19.1
15.0
3.0
2.6
15.4
17.1
0.9
0.7
India
Elecon Engineering
Neutral
57
-
619
1,359
1,482
10.3
13.7
0.8
3.9
70.7
14.6
1.2
1.1
1.6
7.8
0.8
0.7
Surya Roshni
Buy
134
201
587
2,992
3,223
8.1
8.4
14.7
18.3
9.1
7.3
0.9
0.8
9.7
11.0
0.5
0.4
MT Educare
Neutral
154
-
614
286
366
18.3
17.7
7.7
9.4
20.0
16.5
4.2
3.7
20.2
21.1
2.0
1.6
Radico Khaitan
Buy
100
156
1,336
1,517
1,635
12.7
13.4
5.8
7.1
17.2
14.1
1.5
1.4
8.6
9.6
1.4
1.2
Garware Wall Ropes
Buy
301
473
659
862
974
11.2
11.2
24.9
29.6
12.1
10.2
1.8
1.6
15.1
15.4
0.8
0.6
Wonderla Holidays
Neutral
372
-
2,101
206
308
44.0
43.6
9.0
12.9
41.3
28.8
5.6
5.1
13.7
17.8
10.1
6.7
Linc Pen & Plastics
Neutral
182
-
269
340
371
8.3
8.9
10.8
13.2
16.9
13.8
2.7
2.4
16.0
17.1
0.8
0.8
The Byke Hospitality
Neutral
155
-
622
222
287
20.5
20.5
5.6
7.6
27.5
20.5
5.2
4.3
18.9
20.8
2.8
2.2
Interglobe Aviation
Neutral
807
-
29,068
17,022
21,122
20.7
14.5
63.9
53.7
12.6
15.0
18.9
15.5
149.9
103.2
1.7
1.4
Coffee Day Enterprises
Neutral
226
-
4,663
2,692
2,964
17.0
18.6
-
4.7
-
47.8
2.8
2.6
0.2
5.5
2.1
2.0
Ltd
Navneet Education
Neutral
82
-
1,947
998
1,062
24.1
24.0
5.8
6.1
14.2
13.4
3.1
2.8
22.0
20.6
2.0
1.9
Navkar Corporation
Buy
163
265
2,330
365
436
38.3
37.5
5.6
5.9
29.0
27.8
1.8
1.7
6.3
6.1
7.2
6.2
Source: Company, Angel Research; Note: *December year end; #September year end; &October year end; Price as on March 10, 2016
Market Outlook
March 11, 2016
Research Team Tel: 022 - 39357800
DISCLAIMER
Angel Broking Private Limited (hereinafter referred to as “Angel”) is a registered Member of National Stock Exchange of India Limited,
Bombay Stock Exchange Limited and Metropolitian Stock Exchange of India Limited. It is also registered as a Depository Participant with
CDSL and Portfolio Manager with SEBI. It also has registration with AMFI as a Mutual Fund Distributor. Angel Broking Private Limited is a
registered entity with SEBI for Research Analyst in terms of SEBI (Research Analyst) Regulations, 2014 vide registration number
INH000000164. Angel or its associates has not been debarred/ suspended by SEBI or any other regulatory authority for accessing
/dealing in securities Market. Angel or its associates including its relatives/analyst do not hold any financial interest/beneficial ownership
of more than 1% in the company covered by Analyst. Angel or its associates/analyst has not received any compensation / managed or co
-managed public offering of securities of the company covered by Analyst during the past twelve months. Angel/analyst has not served as
an officer, director or employee of company covered by Analyst and has not been engaged in market making activity of the company
covered by Analyst.
This document is solely for the personal information of the recipient, and must not be singularly used as the basis of any investment
decision. Nothing in this document should be construed as investment or financial advice. Each recipient of this document should make
such investigations as they deem necessary to arrive at an independent evaluation of an investment in the securities of the companies
referred to in this document (including the merits and risks involved), and should consult their own advisors to determine the merits and
risks of such an investment.
Reports based on technical and derivative analysis center on studying charts of a stock's price movement, outstanding positions and
trading volume, as opposed to focusing on a company's fundamentals and, as such, may not match with a report on a company's
fundamentals.
The information in this document has been printed on the basis of publicly available information, internal data and other reliable sources
believed to be true, but we do not represent that it is accurate or complete and it should not be relied on as such, as this document is for
general guidance only. Angel Broking Pvt. Limited or any of its affiliates/ group companies shall not be in any way responsible for any
loss or damage that may arise to any person from any inadvertent error in the information contained in this report. Angel Broking Pvt.
Limited has not independently verified all the information contained within this document. Accordingly, we cannot testify, nor make any
representation or warranty, express or implied, to the accuracy, contents or data contained within this document. While Angel Broking
Pvt. Limited endeavors to update on a reasonable basis the information discussed in this material, there may be regulatory, compliance,
or other reasons that prevent us from doing so.
This document is being supplied to you solely for your information, and its contents, information or data may not be reproduced,
redistributed or passed on, directly or indirectly.
Neither Angel Broking Pvt. Limited, nor its directors, employees or affiliates shall be liable for any loss or damage that may arise from or
in connection with the use of this information.
Note: Please refer to the important ‘Stock Holding Disclosure' report on the Angel website (Research Section). Also, please refer to the
latest update on respective stocks for the disclosure status in respect of those stocks. Angel Broking Pvt. Limited and its affiliates may have
investment positions in the stocks recommended in this report.