Market Outlook
December 10, 2015
Market Cues
Domestic Indices
Chg (%)
(Pts)
(Close)
Indian markets are expected to open on a Flat to Negative note tracking the SGX
BSE Sensex
(1.1)
(274)
25,036
Nifty and most Global markets.
Nifty
(1.2)
(89)
7,613
After an early move in the Wednesday’s trading session, the US stocks failed to
Mid Cap
(1.8)
(190)
10,607
sustain the upside move and closed in the negative territory. The positive movement
Small Cap
(2.2)
(256)
11,166
was mainly fueled by slight rebound in oil prices.
Bankex
(0.9)
(164)
19,054
The European markets also continued to slide and closed on a negative note. The
encouraging economic data from Japan and China failed to boost investor
Global Indices
Chg (%)
(Pts)
(Close)
sentiment amidst lower crude and commodity prices.
Dow Jones
(0.4)
(76)
17,492
Indian continued to slide for sixth consecutive day on concerns over passage of GST
Nasdaq
(1.5)
(75)
5,023
bill and on continued selling by the FIIs.
FTSE
(0.1)
(9)
6,127
News & Result Analysis
Nikkei
(1.0)
(192)
19,301
Tata Motors group November 2015 global wholesales grow 8% to 90,965 units
Hang Seng
(0.5)
(101)
21,804
Aurobindo gets USFDA approvals for two products
Shanghai Com
0.1
2
3,472
Detailed analysis on Pg2
Investor’s Ready Reckoner
Advances / Declines
BSE
NSE
Key Domestic & Global Indicators
Advances
515
188
Stock Watch: Latest investment recommendations on 150+ stocks
Declines
2,263
1,375
Refer P4 onwards
Unchanged
151
43
Top Picks
CMP
Target
Upside
Volumes (` Cr)
Company
Sector
Rating
(`)
(`)
(%)
BSE
2,604
Axis Bank
Financials
Buy
451
630
39.6
NSE
14,890
HCL Tech
IT
Buy
843
1,132
34.4
ICICI Bank
Financials
Buy
260
354
36.4
Net Inflows (` Cr)
Net
Mtd
Ytd
Ashok Leyland
Automobiles
Buy
87
111
28.2
Larsen & Toubro
Construction
Buy
1,301
1,646
26.6
FII
(442)
(2,733)
(25,182)
More Top Picks on Pg3
MFs
148
1,271
58,166
Key Upcoming Events
Previous
Consensus
Top Gainers
Price (`)
Chg (%)
Date
Region
Event Description
Reading
Expectations
Ibrealest
58
3.8
Dec 10
US
Initial Jobless claims
269
268
Bhel
169
2.6
India
Imports (YoY) %
(21.15)
-
Cyient
479
2.2
India
Imports (YoY) %
(17.53)
-
Mphasis
478
1.9
UK
BOE Announces rates
0.50
0.50
Pfc
205
1.9
Top Losers
Price (`)
Chg (%)
Gati
152
(8.0)
Ncc
72
(6.9)
Rtnpower
11
(6.0)
Tataelxsi
1,847
(5.7)
Concor
1,340
(5.6)
As on December 09, 2015
Market Outlook
December 10, 2015
Tata Motors group November 2015 global wholesales grow 8%
to 90,965 units
Tata Motors Group global wholesales grew by 8% yoy in November 2015 at
90,695 units. Global wholesales of all Tata Motors’ commercial vehicles and Tata
Daewoo range in November 2015 were 29,066 units, (a decline of 4% compared
to November 2014 mainly on account of weakness in the Indian LCV market).
Global wholesales of passenger vehicles in November 2015 were at 61,629 units,
a healthy growth of 15% yoy. Tata branded passenger vehicle sales were flattish at
10,608 units on account of lack of new launches. Global wholesales for Jaguar
Land Rover were 51,021vehicles, a strong growth of 24% yoy led by success of
new launches. Jaguar wholesales for the month grew strongly 47% yoy to 9,069
vehicles led by ramp up of Jaguar XE (XE volumes have now reaches about 4,000
units/month), while Land Rover wholesales for the month grew 19% yoy to 41,952
vehicles led by encouraging response to the Discovery Sport and Defender. JLR is
seeing strong traction in the developed markets of Europe and US, while the China
markets continue to remain under pressure. We currently have Neutral rating on
the stock.
Aurobindo gets USFDA approvals for two products
Aurobindo Pharma Limited announced that it has received final approval from the
US Food and Drug Administration (USFDA) to manufacture and market
Eptifibatide injection which is expected to be launched in this month. It has also
received final approval from USFDA to manufacture and market Levonorgestrel
Tablet, 1.5 mg.
Eptifibatide injection is used in the treatment of acute coronary syndrome. The
approved product has an estimated market size of $137 million for the twelve
months ending October 2015 according to IMS. Levonorgestrel tablet is an oral
contraceptive used for prevention of pregnancy. As per IMS, the approved product
has an estimated market size of $64 million for the twelve months ending October
2015. We currently have an Accumulate rating on the stock.
Economic and Political News
Indirect tax collection grows 24% in Nov
NITI Aayog nod to India-Japan bullet train agreement
Corporate News
SBI to sell its 15% stake in NSE; may garner up to `6,000cr
SEZs oppose government’s move to phase out corporate tax exemptions
NTPC exploring solar power projects in UP
Biocon Unit in Licensing pact with Novartis Middle East FZE
Market Outlook
December 10, 2015
Top Picks ★★★★★
Large Cap
Market Cap
CMP
Target
Upside
Company
Rationale
(` Cr)
(`)
(`)
(%)
To outpace battery industry growth due to better technological
Amara Raja Batteries
14,329
839
1,040
24.0
products leading to market share gains in both the automotive
OEM and replacement segments.
Earnings to grow strongly given the MHCV cyclical upturn.
Ashok Leyland
24,631
87
111
28.2
Focus on exports and LCV's provides additional growth
avenue.
Healthy pace of branch expansion, backed by distribution
Axis Bank
1,07,240
451
630
39.6
network, will be the driving force for the bank’s retail business
and overall earnings.
The stock is trading at attractive valuations and is factoring all
HCL Tech
1,18,705
843
1,132
34.4
the bad news.
Strong visibility for a robust 20% earnings trajectory, coupled
HDFC Bank
2,64,511
1,048
1,262
20.4
with high quality of earnings on account of high quality retail
business and strategic focus on highly rated corporates.
Due to its robust franchise and capital adequacy position, the
bank is well positioned to grow by at least a few percentage
ICICI Bank
1,50,819
260
354
36.4
points higher than the average industry growth rate from a
structural point of view.
Back on the growth trend, expect a long term growth of 14%
Infosys
2,36,436
1,029
1,306
26.9
to be a US$20bn in FY2020.
Well positioned to benefit from such expected gradual
recovery in the overall domestic capex cycle, given its presence
Larsen & Toubro
1,21,109
1,301
1,646
26.6
across various infrastructure segments, its execution
capabilities, and its strong balance sheet.
LICHF continues to grow its retail loan book at a healthy pace
with improvement in asset quality. We expect the company to
LIC Housing Finance
22,844
453
571
26.1
post a healthy loan book which is likely to reflect in a strong
earnings growth.
Source: Company, Angel Research
Mid Cap
Market Cap
CMP
Target
Upside
Company
Rationale
(` Cr)
(`)
(`)
(%)
Favourable outlook for the AC industry to augur well for
Cooling products business which is out pacing the market
Blue Star
3,193
355
429
20.8
growth. EMPPAC division's profitability to improve once
operating environment turns around.
Change in business focus towards high-margin chronic &
Ipca labs
9,578
759
900
18.6
lifestyle segments and increasing penetration in Europe and
US
Economic recovery to have favourable impact on advertising &
circulation revenue growth. Further, the acquisition of a radio
Jagran Prakashan
4,964
152
169
11.3
business (Radio City) would also boost the company's revenue
growth.
Strong brand & quality teaching with innovative technologies &
MT Educare
526
132
169
27.8
higher government educational spending to boost growth
Earnings boost on back of stable material prices and
Radico Khaitan
1,348
101
156
53.9
favourable pricing environment. Valuation discount to peers
provides additional comfort
Strong brands and distribution network would boost growth
Siyaram Silk Mills
1,032
1,101
1,354
23.0
going ahead. Stock currently trades at an inexpensive
valuation.
Structural shift in the Lighting industry towards LED lighting will
Surya Roshni
563
129
183
42.4
drive growth.
Source: Company, Angel Research
Market Outlook
December 10, 2015
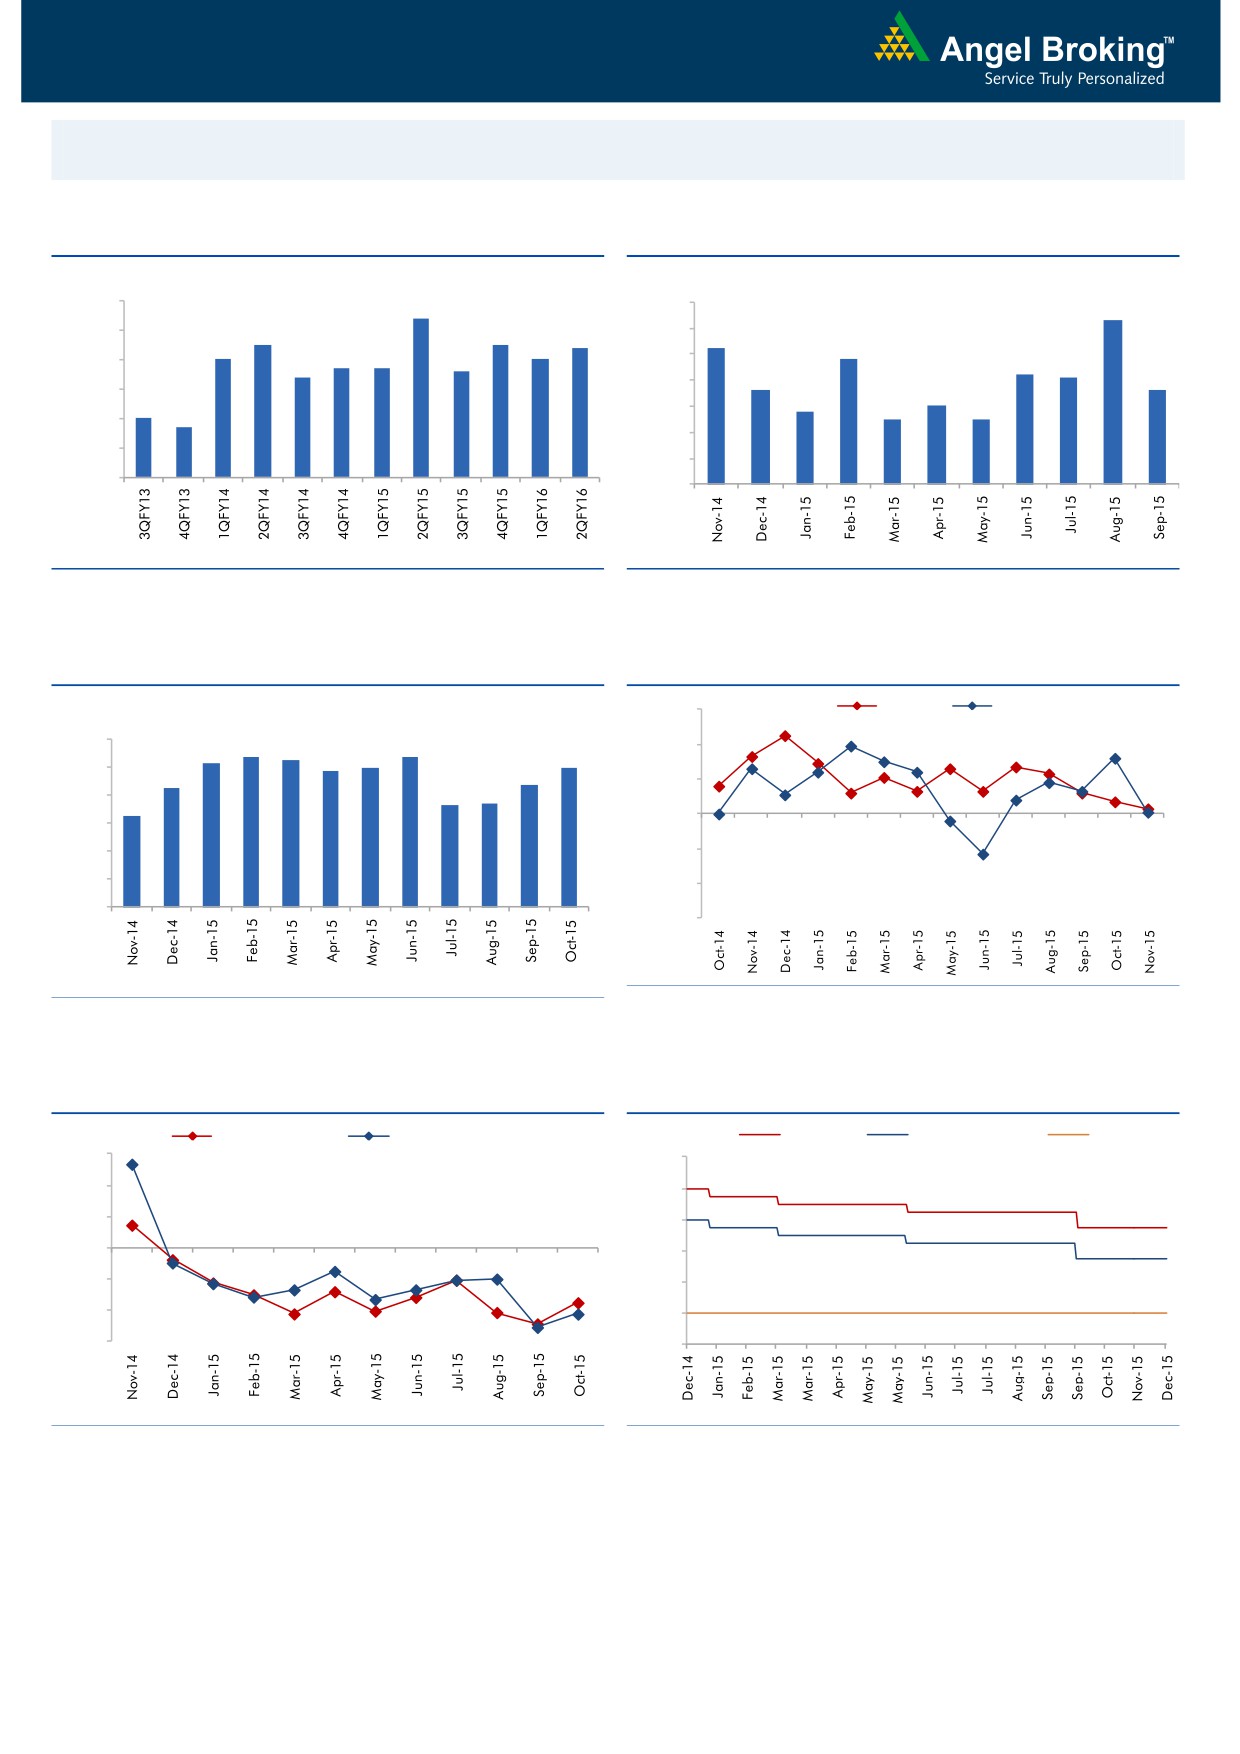
Macro watch
Exhibit 1: Quarterly GDP trends
Exhibit 2: IIP trends
(%)
(%)
9.0
8.4
7.0
6.3
8.0
7.5
7.5
7.4
6.0
5.2
7.0
7.0
4.8
6.7
6.7
6.6
5.0
7.0
6.4
4.2
4.1
3.6
3.6
4.0
6.0
2.8
3.0
5.0
3.0
2.5
2.5
4.7
5.0
2.0
4.0
1.0
3.0
-
Source: CSO, Angel Research
Source: MOSPI, Angel Research
Exhibit 3: Monthly CPI inflation trends
Exhibit 4: Manufacturing and services PMI
(%)
56.0
Mfg. PMI
Services PMI
6.0
5.4
5.3
5.4
54.0
5.2
5.0
5.0
4.9
5.0
4.3
4.4
52.0
3.7
3.7
4.0
3.3
50.0
3.0
2.0
48.0
1.0
46.0
-
44.0
Source: Market, Angel Research; Note: Level above 50 indicates expansion
Source: MOSPI, Angel Research
Exhibit 5: Exports and imports growth trends
Exhibit 6: Key policy rates
(%)
Exports yoy growth
Imports yoy growth
(%)
Repo rate
Reverse Repo rate
CRR
30.0
9.00
20.0
8.00
10.0
7.00
0.0
6.00
(10.0)
5.00
(20.0)
4.00
(30.0)
3.00
Source: Bloomberg, Angel Research
Source: RBI, Angel Research
Market Outlook
December 10, 2015
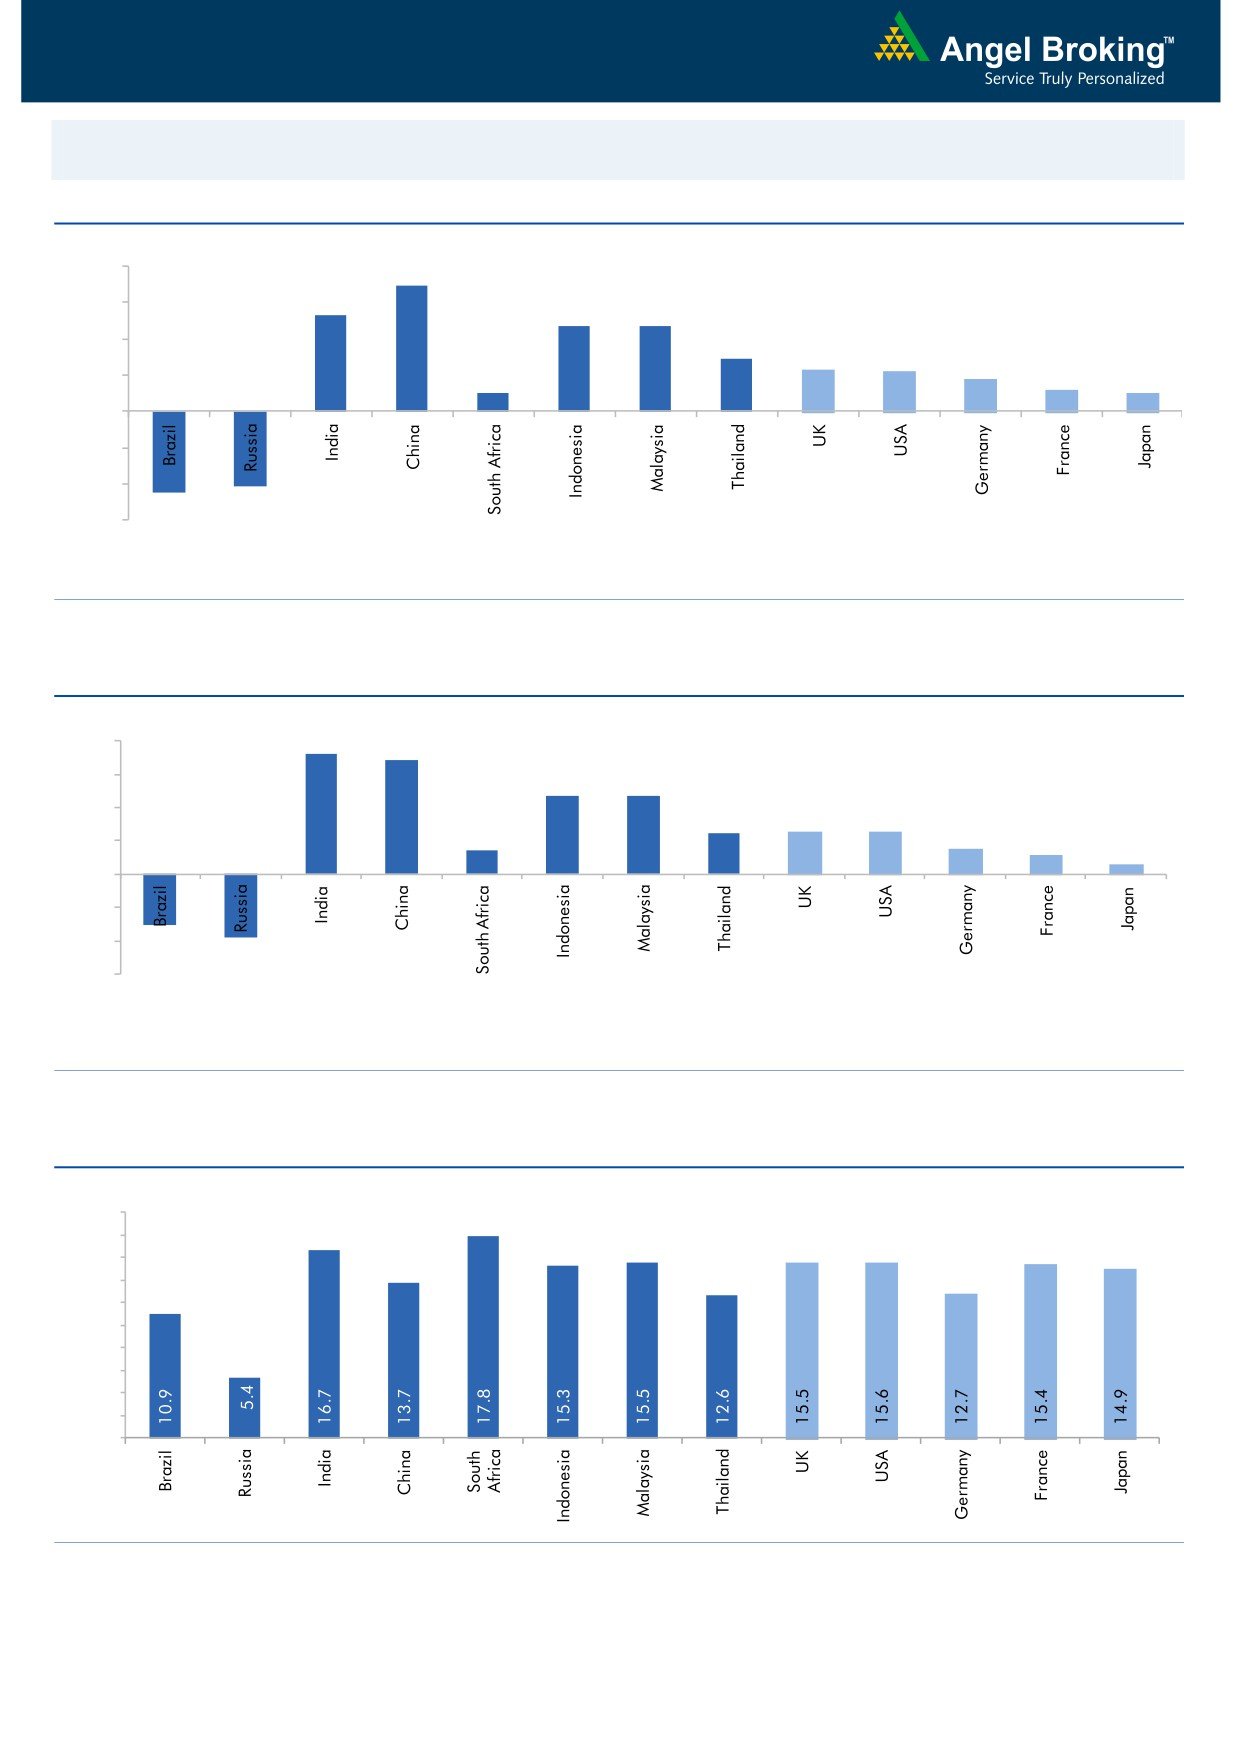
Global watch
Exhibit 1: Latest quarterly GDP Growth (%, yoy) across select developing and developed countries
(%)
8.0
6.9
5.3
6.0
4.7
4.7
4.0
2.9
2.3
2.2
1.8
2.0
1.0
1.2
1.0
-
(2.0)
(4.0)
(4.1)
(4.5)
(6.0)
Source: Bloomberg, Angel Research
Exhibit 2: 2015 GDP Growth projection by IMF (%, yoy) across select developing and developed countries
(%)
7.3
8.0
6.8
6.0
4.7
4.7
4.0
2.5
2.5
2.6
1.4
1.5
2.0
1.2
0.6
-
(2.0)
(4.0)
(3.0)
(3.8)
(6.0)
Source: IMF, Angel Research
Exhibit 3: One year forward P-E ratio across select developing and developed countries
(x)
20.0
18.0
16.0
14.0
12.0
10.0
8.0
6.0
4.0
2.0
-
Source: IMF, Angel Research
Market Outlook
December 10, 2015
Exhibit 4: Relative performance of indices across globe
Returns (%)
Country
Name of index
Closing price
1M
3M
1YR
Brazil
Bovespa
46,108
(1.7)
(0.8)
(10.7)
Russia
Micex
1,733
(1.0)
0.6
17.0
India
Nifty
7,613
(4.3)
(1.4)
(11.1)
China
Shanghai Composite
3,472
(4.6)
9.9
29.6
South Africa
Top 40
44,545
(7.1)
0.7
1.3
Mexico
Mexbol
42,398
(6.3)
(0.8)
(1.3)
Indonesia
LQ45
768
(2.1)
6.1
(13.4)
Malaysia
KLCI
1,659
(1.6)
4.4
(5.6)
Thailand
SET 50
831
(9.1)
(7.4)
(22.3)
USA
Dow Jones
17,492
(2.3)
7.6
(0.2)
UK
FTSE
6,127
(2.7)
(0.5)
(5.2)
Japan
Nikkei
19,301
0.2
6.7
10.5
Germany
DAX
10,592
(2.1)
3.7
8.1
France
CAC
4,637
(5.6)
0.9
15.8
Source: Bloomberg, Angel Research
Stock Watch
December 10, 2015
Company Name
Reco
CMP
Target
Mkt Cap
Sales ( Čcr )
OPM(%)
EPS (Č)
PER(x)
P/BV(x)
RoE(%)
EV/Sales(x)
(Č)
Price ( Č)
( Č cr )
FY16E FY17E
FY16E
FY17E
FY16E
FY17E
FY16E
FY17E
FY16E
FY17E
FY16E
FY17E
FY16E
FY17E
Agri / Agri Chemical
Rallis
Neutral
168
-
3,258
2,075
2,394
14.4
14.4
9.5
11.0
17.6
15.2
3.5
3.0
21.1
21.3
1.6
1.4
United Phosphorus
Buy
395
510
16,930
13,698
15,752
17.6
17.6
32.1
38.5
12.3
10.3
2.4
2.0
21.4
21.3
1.3
1.1
Auto & Auto Ancillary
Ashok Leyland
Buy
87
111
24,631
17,995
21,544
11.4
11.6
3.4
4.7
25.5
18.4
4.5
4.1
17.7
22.2
1.3
1.1
Bajaj Auto
Accumulate
2,390
2,728
69,172
23,695
27,298
21.3
20.4
134.6
151.5
17.8
15.8
5.6
4.8
31.8
30.6
2.5
2.1
Bharat Forge
Buy
793
943
18,462
7,867
8,881
20.0
20.3
34.4
41.0
23.1
19.3
4.5
3.7
21.1
20.9
2.5
2.1
Eicher Motors
Buy
15,728
19,036
42,708
15,379
16,498
15.6
16.6
473.2
574.8
33.2
27.4
12.3
9.2
36.7
33.2
2.7
2.5
Hero Motocorp
Accumulate
2,547
2,774
50,856
28,561
31,559
14.7
14.7
151.1
163.2
16.9
15.6
6.5
5.6
38.7
35.6
1.6
1.4
Jamna Auto Industries Accumulate
116
129
924
1,292
1,486
9.3
9.8
6.0
7.5
19.3
15.4
4.0
3.4
20.7
21.8
0.8
0.7
L G Balakrishnan & Bros Neutral
501
-
786
1,254
1,394
11.6
11.8
35.9
41.7
14.0
12.0
1.9
1.7
13.5
13.8
0.7
0.7
Mahindra and Mahindra Accumulate
1,313
1,449
81,537
39,031
44,440
13.8
13.9
57.9
67.6
22.7
19.4
3.7
3.2
16.1
16.6
1.7
1.5
Maruti
Neutral
4,477
-
135,252
57,865
68,104
16.4
16.7
176.3
225.5
25.4
19.9
4.9
4.2
19.4
21.2
2.1
1.7
Minda Industries
Accumulate
809
867
1,283
2,567
2,965
8.0
8.3
46.1
57.8
17.5
14.0
2.9
2.4
16.7
17.3
0.6
0.5
Motherson Sumi
Accumulate
277
313
36,646
39,343
45,100
8.8
9.1
10.1
12.5
27.4
22.2
8.7
6.8
35.3
34.4
1.0
0.9
Rane Brake Lining
Accumulate
323
366
255
454
511
11.1
11.4
23.8
28.1
13.6
11.5
1.9
1.8
14.2
15.3
0.7
0.6
Setco Automotive
Neutral
216
-
576
594
741
12.7
13.7
8.4
15.8
25.7
13.6
2.7
2.3
10.4
16.9
1.4
1.2
Tata Motors
Neutral
394
-
113,741
255,254
301,772
12.9
13.4
23.7
37.3
16.6
10.6
2.0
1.7
7.4
12.1
0.6
0.6
TVS Motor
Buy
270
338
12,846
11,569
13,648
7.3
8.7
10.3
16.1
26.3
16.8
6.5
5.1
24.8
30.5
1.1
0.9
Amara Raja Batteries
Buy
839
1,040
14,329
4,892
5,871
17.4
17.6
28.8
37.1
29.1
22.6
6.8
5.4
23.4
24.1
2.9
2.3
Exide Industries
Buy
137
162
11,671
6,950
7,784
14.4
14.8
6.6
7.3
20.8
18.8
2.6
2.4
12.6
12.8
1.4
1.3
Apollo Tyres
Accumulate
151
171
7,676
12,146
12,689
16.8
16.0
21.2
19.0
7.1
7.9
1.2
1.0
16.5
13.0
0.7
0.7
Ceat
Accumulate
989
1,119
4,000
6,041
6,597
14.1
13.7
99.5
111.9
9.9
8.8
2.0
1.6
19.6
18.5
0.8
0.7
JK Tyres
Neutral
104
-
2,358
7,446
7,669
15.2
14.0
19.6
18.4
5.3
5.7
1.3
1.1
25.2
19.5
0.7
0.6
Swaraj Engines
Neutral
896
-
1,113
552
630
14.2
14.7
44.6
54.1
20.1
16.6
4.7
4.3
23.2
25.6
1.9
1.6
Subros
Neutral
92
-
550
1,268
1,488
11.6
11.9
3.7
6.6
24.8
13.9
1.7
1.5
6.8
11.4
0.7
0.6
Indag Rubber
Neutral
213
-
558
283
329
17.0
17.2
13.0
15.4
16.4
13.8
3.6
3.0
21.8
21.6
1.7
1.4
Capital Goods
ACE
Neutral
41
-
402
660
839
4.7
8.2
1.0
3.9
40.7
10.4
1.3
1.1
3.2
11.3
0.8
0.6
BEML
Neutral
1,051
-
4,377
3,277
4,006
6.0
8.9
29.2
64.3
36.0
16.4
2.0
1.8
5.7
11.7
1.4
1.1
BGR Energy
Neutral
112
-
810
3,615
3,181
9.5
9.4
16.7
12.4
6.7
9.1
0.6
0.6
10.0
7.0
0.6
0.8
BHEL
Neutral
169
-
41,352
33,722
35,272
10.8
11.7
10.5
14.2
16.1
11.9
1.2
1.1
7.0
9.0
1.3
1.2
Stock Watch
December 10, 2015
Company Name
Reco
CMP
Target
Mkt Cap
Sales ( Čcr )
OPM(%)
EPS (Č)
PER(x)
P/BV(x)
RoE(%)
EV/Sales(x)
(Č)
Price ( Č)
( Č cr )
FY16E
FY17E
FY16E
FY17E
FY16E
FY17E
FY16E
FY17E
FY16E
FY17E
FY16E
FY17E
FY16E
FY17E
Capital Goods
Blue Star
Buy
355
429
3,193
3,548
3,977
6.3
6.9
13.7
17.2
25.9
20.7
6.5
4.2
26.1
25.4
1.0
0.8
Crompton Greaves
Accumulate
186
204
11,686
13,484
14,687
4.9
6.2
4.5
7.1
41.4
26.3
2.9
2.7
7.2
10.8
1.0
0.9
Inox Wind
Buy
348
505
7,722
4,980
5,943
17.0
17.5
26.6
31.6
13.1
11.0
3.9
2.9
35.0
30.0
1.7
1.4
KEC International
Neutral
147
-
3,784
8,791
9,716
6.1
6.8
5.4
8.2
27.3
18.0
2.7
2.5
10.0
14.0
0.6
0.6
Thermax
Neutral
893
-
10,639
6,413
7,525
7.4
8.5
30.5
39.3
29.3
22.7
4.5
3.9
15.0
17.0
1.6
1.3
Cement
ACC
Buy
1,316
1,630
24,705
13,151
14,757
16.4
18.3
63.9
83.4
20.6
15.8
2.7
2.4
13.3
16.1
1.7
1.5
Ambuja Cements
Buy
190
233
29,408
11,564
12,556
19.4
20.7
8.9
10.1
21.3
18.8
2.7
2.5
12.8
13.8
2.2
2.0
HeidelbergCement
Neutral
73
-
1,643
1,772
1,926
13.3
15.4
1.0
3.0
72.5
24.2
1.8
1.7
2.6
7.9
1.5
1.3
India Cements
Buy
80
112
2,442
4,216
4,840
18.0
19.5
4.0
9.9
19.9
8.0
0.8
0.7
4.0
9.5
0.9
0.7
JK Cement
Buy
644
744
4,503
3,661
4,742
10.1
15.8
18.0
61.0
35.8
10.6
2.6
2.3
7.5
22.9
1.7
1.3
J K Lakshmi Cement
Buy
326
430
3,835
2,947
3,616
16.7
19.9
11.5
27.2
28.3
12.0
2.7
2.3
9.8
20.8
1.7
1.4
Mangalam Cements
Neutral
199
-
531
1,053
1,347
10.5
13.3
8.4
26.0
23.7
7.7
1.0
0.9
4.3
12.5
0.9
0.7
Orient Cement
Buy
158
183
3,231
1,854
2,524
21.2
22.2
7.7
11.1
20.5
14.2
2.9
2.5
13.3
15.7
2.5
1.7
Ramco Cements
Neutral
365
-
8,699
4,036
4,545
20.8
21.3
15.1
18.8
24.2
19.4
3.0
2.6
12.9
14.3
2.7
2.3
Shree Cement^
Neutral
10,494
-
36,558
7,150
8,742
26.7
28.6
228.0
345.5
46.0
30.4
6.8
5.7
15.7
20.3
4.9
3.9
UltraTech Cement
Buy
2,785
3,282
76,438
25,021
30,023
19.1
21.6
89.0
132.0
31.3
21.1
3.6
3.1
12.2
15.9
3.1
2.6
Construction
ITNL
Neutral
81
-
2,655
7,360
8,825
34.0
35.9
7.0
9.0
11.5
9.0
0.4
0.4
3.2
3.7
3.7
3.6
KNR Constructions
Buy
581
673
1,635
937
1,470
14.3
14.0
33.5
38.6
17.4
15.1
2.6
2.3
15.4
15.4
1.8
1.2
Larsen & Toubro
Buy
1,301
1,646
121,109
65,065
77,009
11.5
11.7
61.5
65.6
21.2
19.8
2.1
2.0
13.4
14.0
2.1
1.8
Gujarat Pipavav Port
Neutral
154
-
7,440
629
684
51.0
52.2
6.4
5.9
24.1
26.1
3.2
2.9
15.9
12.7
11.5
10.4
MBL Infrastructures
Buy
206
285
852
2,313
2,797
12.2
14.6
19.0
20.0
10.8
10.3
1.1
1.0
11.3
10.6
1.1
1.0
Nagarjuna Const.
Neutral
72
-
3,997
7,892
8,842
8.8
9.1
3.0
5.3
24.0
13.6
1.2
1.1
5.0
8.5
0.7
0.6
PNC Infratech
Accumulate
531
558
2,724
1,873
2,288
13.2
13.5
24.0
32.0
22.1
16.6
2.2
1.9
12.1
12.3
1.6
1.3
Simplex Infra
Neutral
323
-
1,597
5,955
6,829
10.3
10.5
16.0
31.0
20.2
10.4
1.1
1.0
5.3
9.9
0.8
0.7
Power Mech Projects
Neutral
608
-
894
1,539
1,801
12.8
12.7
59.0
72.1
10.3
8.4
1.6
1.3
18.6
16.8
0.6
0.5
Sadbhav Engineering
Neutral
316
-
5,428
3,481
4,219
10.7
10.8
8.0
12.0
39.6
26.4
3.7
3.2
10.3
13.5
1.8
1.5
NBCC
Buy
921
1,089
11,051
7,382
9,506
7.7
8.6
39.8
54.4
23.1
16.9
5.6
4.4
26.7
29.1
1.3
0.9
SIPL
Neutral
98
-
3,457
675
1,042
62.4
64.7
-
-
3.7
4.2
-
-
16.8
11.3
Financials
Allahabad Bank
Neutral
70
-
4,177
8,569
9,392
2.8
2.9
16.3
27.5
4.3
2.5
0.4
0.3
7.6
11.9
-
-
Stock Watch
December 10, 2015
Company Name
Reco
CMP
Target
Mkt Cap
Sales ( Čcr )
OPM(%)
EPS (Č)
PER(x)
P/BV(x)
RoE(%)
EV/Sales(x)
(Č)
Price ( Č)
( Č cr )
FY16E
FY17E
FY16E
FY17E
FY16E
FY17E
FY16E
FY17E
FY16E
FY17E
FY16E
FY17E
FY16E
FY17E
Financials
Axis Bank
Buy
451
630
107,240
26,473
31,527
3.5
3.6
35.7
43.5
12.6
10.4
2.4
2.1
17.9
18.9
-
-
Bank of Baroda
Neutral
160
-
36,970
18,485
21,025
1.9
2.0
13.5
21.1
11.9
7.6
0.9
0.8
7.3
10.6
-
-
Bank of India
Neutral
117
-
9,281
15,972
17,271
1.9
2.0
15.3
33.4
7.7
3.5
0.3
0.3
3.6
7.6
-
-
Canara Bank
Neutral
247
-
13,434
15,441
16,945
2.0
2.1
46.6
70.4
5.3
3.5
0.5
0.4
8.0
11.2
-
-
Dena Bank
Neutral
41
-
2,636
3,440
3,840
2.1
2.3
7.3
10.0
5.6
4.1
0.4
0.4
6.1
7.9
-
-
Federal Bank
Neutral
55
-
9,454
3,477
3,999
3.0
3.0
5.0
6.2
11.0
8.8
1.1
1.0
10.6
11.9
-
-
HDFC
Neutral
1,155
-
182,210
10,358
11,852
3.3
3.3
41.1
47.0
28.1
24.6
5.4
4.9
24.7
24.9
-
-
HDFC Bank
Buy
1,048
1,262
264,511
38,309
47,302
4.3
4.3
49.3
61.1
21.3
17.2
3.7
3.2
18.5
19.7
-
-
ICICI Bank
Buy
260
354
150,819
34,279
39,262
3.3
3.3
21.0
24.4
12.4
10.7
2.1
1.8
14.4
14.7
-
-
IDBI Bank
Neutral
84
-
13,497
9,625
10,455
1.8
1.8
8.5
14.2
9.9
5.9
0.6
0.6
5.9
9.3
-
-
Indian Bank
Neutral
124
-
5,965
6,160
6,858
2.5
2.5
24.5
29.8
5.1
4.2
0.4
0.4
7.7
8.6
-
-
LIC Housing Finance
Buy
453
571
22,844
3,101
3,745
2.5
2.5
33.0
40.2
13.7
11.3
2.6
2.2
19.7
20.5
-
-
Oriental Bank
Neutral
135
-
4,043
7,643
8,373
2.4
2.4
37.2
45.4
3.6
3.0
0.3
0.3
8.2
9.4
-
-
Punjab Natl.Bank
Neutral
130
-
25,615
23,638
26,557
2.8
2.8
17.9
27.2
7.3
4.8
0.7
0.6
8.5
12.0
-
-
South Ind.Bank
Neutral
19
-
2,619
1,965
2,185
2.5
2.5
2.5
3.3
7.8
5.9
0.8
0.7
9.5
11.7
-
-
St Bk of India
Buy
234
283
181,921
82,520
93,299
2.7
2.8
20.0
24.5
11.7
9.6
1.3
1.1
11.5
12.8
-
-
Union Bank
Neutral
157
-
10,803
12,646
14,129
2.3
2.4
31.0
39.1
5.1
4.0
0.5
0.5
9.8
11.4
-
-
Vijaya Bank
Neutral
34
-
2,904
3,536
3,827
1.9
1.9
5.5
6.7
6.1
5.1
0.5
0.5
7.8
8.8
-
-
Yes Bank
Buy
716
921
30,024
7,190
9,011
3.2
3.3
58.2
69.7
12.3
10.3
2.2
1.9
19.2
19.6
-
-
FMCG
Asian Paints
Neutral
840
-
80,597
16,553
19,160
16.0
16.2
17.7
21.5
47.5
39.1
12.6
11.4
29.4
31.2
4.7
4.1
Britannia
Neutral
2,798
-
33,569
8,065
9,395
9.6
10.2
47.2
65.5
59.3
42.7
19.7
18.6
38.3
41.2
4.0
3.4
Colgate
Neutral
964
-
26,225
4,836
5,490
19.5
19.7
48.5
53.2
19.9
18.1
14.6
12.7
99.8
97.5
5.3
4.7
Dabur India
Neutral
270
-
47,426
9,370
10,265
17.1
17.2
7.3
8.1
36.8
33.3
11.1
9.0
33.7
30.6
5.0
4.5
GlaxoSmith Con*
Neutral
6,180
-
25,991
4,919
5,742
17.2
17.4
168.3
191.2
36.7
32.3
10.4
8.9
28.8
28.9
4.8
4.1
Godrej Consumer
Neutral
1,239
-
42,178
10,168
12,886
16.1
16.1
32.1
38.4
38.6
32.3
7.9
7.2
19.7
21.0
4.2
3.3
HUL
Neutral
820
-
177,481
34,940
38,957
17.5
17.7
20.8
24.7
39.4
33.2
43.9
35.1
110.5
114.2
4.9
4.4
ITC
Buy
317
382
254,990
41,068
45,068
37.8
37.4
13.9
15.9
22.8
20.0
7.6
6.7
34.1
33.8
5.8
5.3
Marico
Neutral
424
-
27,319
6,551
7,766
15.7
16.0
10.4
12.5
40.8
33.9
11.8
9.9
33.2
32.4
4.1
3.5
Nestle*
Buy
5,759
6,646
55,526
11,291
12,847
22.2
22.3
158.9
184.6
36.2
31.2
18.9
17.0
55.0
57.3
4.8
4.1
Stock Watch
December 10, 2015
Company Name
Reco
CMP
Target
Mkt Cap
Sales ( Čcr )
OPM(%)
EPS (Č)
PER(x)
P/BV(x)
RoE(%)
EV/Sales(x)
(Č)
Price ( Č)
( Č cr )
FY16E FY17E
FY16E
FY17E
FY16E
FY17E
FY16E
FY17E
FY16E
FY17E
FY16E
FY17E
FY16E
FY17E
FMCG
Tata Global
Accumulate
132
144
8,340
8,635
9,072
9.8
9.9
6.5
7.6
20.3
17.4
2.0
1.9
6.8
7.4
0.9
0.9
IT
HCL Tech^
Buy
843
1,132
118,705
42,038
47,503
23.2
23.5
55.8
62.9
15.1
13.4
3.5
2.7
23.0
19.8
2.4
1.9
Infosys
Buy
1,029
1,306
236,436
60,250
66,999
28.0
28.0
58.3
63.7
17.7
16.2
3.7
3.2
20.9
19.7
3.2
2.8
TCS
Buy
2,366
3,165
466,144
111,274
126,852
28.4
28.7
125.4
143.9
18.9
16.4
7.5
6.9
39.9
42.2
3.8
3.3
Tech Mahindra
Buy
527
646
50,964
25,566
28,890
16.0
17.0
26.3
31.9
20.1
16.5
3.6
3.1
17.9
18.6
1.8
1.5
Wipro
Buy
565
719
139,607
52,414
58,704
23.7
23.8
38.4
42.3
14.7
13.4
2.9
2.6
19.5
18.0
2.2
1.8
Media
D B Corp
Accumulate
328
356
6,031
2,241
2,495
27.8
27.9
21.8
25.6
15.1
12.8
3.9
3.5
26.7
28.5
2.6
2.4
HT Media
Neutral
79
-
1,842
2,495
2,603
11.2
11.2
7.3
8.6
10.8
9.2
0.9
0.8
7.4
8.1
0.2
0.2
Jagran Prakashan
Accumulate
152
169
4,964
2,170
2,355
27.2
26.2
8.9
9.9
17.1
15.3
3.6
3.1
20.9
20.5
2.2
2.0
Sun TV Network
Neutral
377
-
14,857
2,779
3,196
70.2
70.5
22.8
27.3
16.5
13.8
4.1
3.7
26.7
28.3
5.1
4.4
Hindustan Media
Neutral
274
-
2,014
920
1,031
20.0
20.0
19.2
20.9
14.3
13.1
2.3
2.0
16.4
15.3
1.7
1.5
Ventures
Metals & Mining
Coal India
Buy
308
380
194,323
76,167
84,130
19.9
22.3
22.4
25.8
13.7
11.9
5.0
4.8
35.5
41.0
1.9
1.7
Hind. Zinc
Buy
142
175
60,042
14,641
14,026
50.4
50.4
17.7
16.0
8.1
8.9
1.2
1.1
16.2
13.2
1.7
1.5
Hindalco
Neutral
74
-
15,229
104,356
111,186
8.7
9.5
6.7
11.1
11.0
6.7
0.4
0.4
3.5
5.9
0.7
0.6
JSW Steel
Neutral
943
-
22,787
42,308
45,147
16.4
20.7
(10.3)
49.5
19.0
1.1
1.0
(1.0)
5.6
1.6
1.5
NMDC
Neutral
87
-
34,473
8,237
10,893
46.6
44.5
10.0
11.7
8.7
7.5
1.0
0.9
12.5
13.0
4.0
3.0
SAIL
Neutral
44
-
18,028
45,915
53,954
7.2
10.5
1.5
4.4
29.0
10.0
0.4
0.4
2.3
4.1
1.0
0.9
Vedanta
Neutral
82
-
24,385
71,445
81,910
26.2
26.3
12.9
19.2
6.4
4.3
0.4
0.4
7.2
8.9
0.8
0.6
Tata Steel
Neutral
227
-
22,032
126,760
137,307
8.9
11.3
6.4
23.1
35.7
9.8
0.7
0.7
2.0
7.1
0.8
0.7
Oil & Gas
Cairn India
Neutral
126
-
23,614
11,323
12,490
49.4
51.0
20.7
20.7
6.1
6.1
0.4
0.4
6.4
6.1
1.2
0.5
GAIL
Neutral
337
-
42,729
64,856
70,933
9.1
9.6
24.0
28.9
14.1
11.7
1.2
1.1
8.8
9.6
0.8
0.8
ONGC
Neutral
217
-
185,782
154,564
167,321
36.8
37.4
28.6
32.5
7.6
6.7
1.0
0.9
12.7
13.5
1.4
1.3
Petronet LNG
Neutral
242
-
18,180
29,691
31,188
5.8
6.2
12.8
13.4
19.0
18.1
2.8
2.5
15.8
14.8
0.7
0.6
Indian Oil Corp
Accumulate
413
455
100,299
359,607
402,760
5.9
6.1
42.5
48.7
9.7
8.5
1.3
1.2
14.1
14.4
0.4
0.3
Reliance Industries
Accumulate
916
1,050
296,696
304,775
344,392
12.6
13.4
91.3
102.6
10.0
8.9
1.1
1.0
11.8
12.0
0.9
0.7
Pharmaceuticals
Alembic Pharma
Neutral
669
-
12,604
2,658
3,112
24.1
20.2
24.6
23.9
27.2
28.0
9.8
7.5
42.5
30.2
4.7
4.0
Aurobindo Pharma
Accumulate
787
872
45,938
14,923
17,162
23.0
23.0
38.2
43.6
20.6
18.0
6.3
4.8
36.0
30.2
3.4
2.9
Aventis*
Neutral
4,240
-
9,764
2,082
2,371
17.4
20.8
118.2
151.5
35.9
28.0
5.2
4.2
19.9
25.5
4.4
3.6
Cadila Healthcare
Neutral
385
-
39,414
10,224
11,840
21.0
22.0
14.6
17.6
26.4
21.9
7.2
5.7
30.8
29.0
3.9
3.3
Stock Watch
December 10, 2015
Company Name
Reco
CMP
Target
Mkt Cap
Sales ( Čcr )
OPM(%)
EPS (Č)
PER(x)
P/BV(x)
RoE(%)
EV/Sales(x)
(Č)
Price ( Č)
( Č cr )
FY16E FY17E
FY16E
FY17E
FY16E
FY17E
FY16E
FY17E
FY16E
FY17E
FY16E
FY17E
FY16E
FY17E
Pharmaceuticals
Cipla
Neutral
623
-
50,070
14,211
16,611
20.6
19.0
27.0
28.9
23.1
21.6
3.9
3.4
18.4
16.8
3.5
2.9
Dr Reddy's
Buy
2,997
3,933
51,109
16,838
19,575
25.0
23.1
167.5
178.8
17.9
16.8
3.8
3.2
23.1
20.4
3.0
2.5
Dishman Pharma
Neutral
308
-
2,487
1,733
1,906
21.5
21.5
17.0
19.9
18.1
15.5
1.8
1.6
10.5
11.2
2.0
1.7
GSK Pharma*
Neutral
3,255
-
27,569
2,870
3,158
20.0
22.1
59.5
68.3
54.7
47.7
16.1
16.6
28.5
34.3
9.1
8.3
Indoco Remedies
Neutral
317
-
2,918
1,033
1,199
15.9
18.2
9.4
13.6
33.7
23.3
5.0
4.3
15.7
19.7
2.9
2.5
Ipca labs
Buy
759
900
9,578
3,363
3,909
12.9
18.6
13.4
28.0
56.7
27.1
4.1
3.6
7.4
14.0
3.1
2.7
Lupin
Neutral
1,761
-
79,317
13,092
16,561
25.0
27.0
50.4
68.3
34.9
25.8
7.2
5.7
22.8
24.7
5.8
4.4
Sun Pharma
Buy
759
950
182,613
28,163
32,610
25.8
30.7
17.4
26.9
43.6
28.2
4.1
3.6
13.0
16.6
6.0
4.9
Power
Tata Power
Neutral
62
-
16,769
35,923
37,402
22.6
22.8
4.1
5.2
15.3
12.0
1.2
1.1
7.5
9.3
1.4
1.3
NTPC
Buy
130
157
107,356
87,064
98,846
23.5
23.5
11.7
13.2
11.1
9.9
1.2
1.2
11.4
12.1
2.3
2.0
Power Grid
Buy
130
170
68,011
20,702
23,361
86.7
86.4
12.1
13.2
10.8
9.8
1.6
1.4
15.6
15.1
8.2
7.6
Telecom
Bharti Airtel
Neutral
311
-
124,279
101,748
109,191
32.1
31.7
12.0
12.5
25.9
24.9
1.8
1.7
6.9
6.7
1.9
1.7
Idea Cellular
Neutral
134
-
48,078
34,282
36,941
32.0
31.5
5.9
6.2
22.6
21.5
2.1
1.9
9.9
9.3
2.0
1.9
zOthers
Abbott India
Neutral
5,306
-
11,274
2,715
3,153
14.5
14.1
134.3
152.2
39.5
34.9
9.9
8.1
27.4
25.6
3.9
3.3
Bajaj Electricals
Buy
203
341
2,053
4,719
5,287
5.2
5.8
8.6
12.7
23.8
16.1
2.7
2.4
11.4
14.8
0.4
0.4
Finolex Cables
Neutral
246
-
3,755
2,520
2,883
12.2
12.0
12.7
14.2
19.4
17.3
2.6
2.3
13.6
13.5
1.2
1.0
Goodyear India*
Accumulate
552
622
1,272
1,888
1,680
12.1
11.9
62.2
56.6
8.9
9.8
2.1
1.8
25.9
19.7
0.5
0.5
Hitachi
Neutral
1,281
-
3,484
1,779
2,081
7.8
8.8
21.8
33.4
58.8
38.3
9.5
7.7
17.4
22.1
2.0
1.7
Jyothy Laboratories
Neutral
304
-
5,507
1,620
1,847
11.5
11.5
7.3
8.5
41.7
35.9
5.4
5.0
13.3
14.4
3.3
2.8
MRF
Buy
39,041
45,575
16,558
20,316
14,488
21.4
21.1
5,488.0
3,798.0
7.1
10.3
2.4
2.0
41.1
21.2
0.8
1.0
Page Industries
Neutral
12,693
-
14,157
1,929
2,450
19.8
20.1
229.9
299.0
55.2
42.5
24.4
16.9
52.1
47.1
7.4
5.8
Relaxo Footwears
Neutral
484
-
5,807
1,767
2,152
12.3
12.5
19.3
25.1
25.1
19.3
6.2
4.7
27.7
27.8
3.3
2.7
Siyaram Silk Mills
Buy
1,101
1,354
1,032
1,636
1,815
11.5
11.5
89.9
104.1
12.2
10.6
2.0
1.8
17.9
17.8
0.8
0.7
Styrolution ABS India*
Neutral
691
-
1,214
1,271
1,440
8.6
9.2
32.0
41.1
21.6
16.8
2.2
2.0
10.7
12.4
0.9
0.8
TVS Srichakra
Buy
2,720
3,240
2,083
2,101
2,338
15.7
15.0
248.6
270.0
10.9
10.1
4.8
3.4
43.6
34.0
1.0
0.9
HSIL
Neutral
304
-
2,200
2,123
2,384
16.1
16.5
15.0
18.9
20.2
16.1
1.6
1.5
8.0
9.4
1.4
1.2
Kirloskar Engines India
Neutral
255
-
3,683
2,471
2,826
8.8
10.4
9.1
13.3
27.9
19.1
2.7
2.5
9.7
13.4
1.1
1.0
Ltd
M M Forgings
Buy
524
614
632
511
615
21.7
21.6
43.1
55.8
12.2
9.4
2.2
1.8
19.9
21.2
1.4
1.1
Banco Products (India)
Neutral
137
-
981
1,208
1,353
11.0
12.3
10.8
14.5
12.7
9.5
1.5
1.3
11.9
14.5
0.8
0.7
Stock Watch
December 10, 2015
Company Name
Reco
CMP
Target Mkt Cap
Sales ( Čcr )
OPM(%)
EPS (Č)
PER(x)
P/BV(x)
RoE(%)
EV/Sales(x)
(Č)
Price ( Č)
( Č cr )
FY16E FY17E FY16E FY17E FY16E FY17E FY16E FY17E FY16E FY17E FY16E FY17E FY16E FY17E
zOthers
Competent Automobiles Neutral
138
-
85
1,040
1,137
3.2
3.1
25.7
28.0
5.4
4.9
0.8
0.7
15.0
14.3
0.1
0.1
Nilkamal
Neutral
1,008
-
1,503
1,910
2,083
10.5
10.3
63.3
69.2
15.9
14.6
2.6
2.2
17.6
16.5
0.8
0.7
Visaka Industries
Buy
122
144
194
1,086
1,197
9.9
10.3
21.5
28.8
5.7
4.3
0.5
0.5
9.6
11.6
0.4
0.3
Transport Corporation of
Neutral
291
-
2,211
2,830
3,350
8.8
9.0
14.4
18.3
20.2
15.9
3.1
2.7
15.4
17.1
0.9
0.8
India
Elecon Engineering
Neutral
81
-
887
1,369
1,533
13.7
14.9
3.3
6.1
24.5
13.4
1.6
1.5
6.6
11.4
1.0
0.9
Surya Roshni
Buy
129
183
563
2,992
3,223
8.1
8.4
14.7
18.3
8.8
7.0
0.8
0.7
9.7
11.0
0.5
0.4
MT Educare
Buy
132
169
526
286
366
18.3
17.7
7.7
9.4
17.1
14.1
3.6
3.2
20.2
21.1
1.7
1.3
Radico Khaitan
Buy
101
156
1,348
1,565
1,687
12.2
13.0
5.7
7.1
17.8
14.3
1.5
1.4
8.3
9.6
1.3
1.2
Garware Wall Ropes
Accumulate
376
423
823
861
967
10.9
10.9
24.0
28.2
15.7
13.3
2.3
2.0
14.6
14.9
1.0
0.8
Wonderla Holidays
Neutral
362
-
2,046
206
308
44.0
43.6
9.0
12.9
40.2
28.1
5.5
5.0
13.7
17.8
9.8
6.5
Linc Pen & Plastics
Accumulate
172
185
255
340
371
8.3
8.9
10.8
13.2
16.0
13.1
2.6
2.2
16.0
17.1
0.8
0.7
The Byke Hospitality
Accumulate
163
181
655
222
287
20.5
20.5
5.6
7.6
29.0
21.6
5.5
4.5
18.9
20.8
3.0
2.3
Interglobe Aviation
Neutral
1,013
-
36,495
17,022
21,122
20.7
14.5
63.9
53.7
15.9
18.9
23.8
19.5
149.9
103.2
2.2
1.7
Coffee Day Enterprises
Neutral
253
-
5,211
2,692
2,964
17.0
18.6
-
4.7
-
53.4
3.1
2.9
0.2
5.5
2.3
2.2
Ltd
Navneet Education
Buy
82
97
1,946
998
1,062
24.1
24.0
5.8
6.1
14.2
13.4
3.1
2.8
22.0
20.6
2.0
1.9
Source: Company, Angel Research; Note: *December year end; #September year end; &October year end; Price as on December 09, 2015
Market Outlook
December 10, 2015
Research Team Tel: 022 - 39357800
DISCLAIMER
Angel Broking Private Limited (hereinafter referred to as “Angel”) is a registered Member of National Stock Exchange of India Limited,
Bombay Stock Exchange Limited and Metropolitian Stock Exchange of India Limited. It is also registered as a Depository Participant with
CDSL and Portfolio Manager with SEBI. It also has registration with AMFI as a Mutual Fund Distributor. Angel Broking Private Limited is a
registered entity with SEBI for Research Analyst in terms of SEBI (Research Analyst) Regulations, 2014 vide registration number
INH000000164. Angel or its associates has not been debarred/ suspended by SEBI or any other regulatory authority for accessing
/dealing in securities Market. Angel or its associates including its relatives/analyst do not hold any financial interest/beneficial ownership
of more than 1% in the company covered by Analyst. Angel or its associates/analyst has not received any compensation / managed or co
-managed public offering of securities of the company covered by Analyst during the past twelve months. Angel/analyst has not served as
an officer, director or employee of company covered by Analyst and has not been engaged in market making activity of the company
covered by Analyst.
This document is solely for the personal information of the recipient, and must not be singularly used as the basis of any investment
decision. Nothing in this document should be construed as investment or financial advice. Each recipient of this document should make
such investigations as they deem necessary to arrive at an independent evaluation of an investment in the securities of the companies
referred to in this document (including the merits and risks involved), and should consult their own advisors to determine the merits and
risks of such an investment.
Reports based on technical and derivative analysis center on studying charts of a stock's price movement, outstanding positions and
trading volume, as opposed to focusing on a company's fundamentals and, as such, may not match with a report on a company's
fundamentals.
The information in this document has been printed on the basis of publicly available information, internal data and other reliable sources
believed to be true, but we do not represent that it is accurate or complete and it should not be relied on as such, as this document is for
general guidance only. Angel Broking Pvt. Limited or any of its affiliates/ group companies shall not be in any way responsible for any
loss or damage that may arise to any person from any inadvertent error in the information contained in this report. Angel Broking Pvt.
Limited has not independently verified all the information contained within this document. Accordingly, we cannot testify, nor make any
representation or warranty, express or implied, to the accuracy, contents or data contained within this document. While Angel Broking
Pvt. Limited endeavors to update on a reasonable basis the information discussed in this material, there may be regulatory, compliance,
or other reasons that prevent us from doing so.
This document is being supplied to you solely for your information, and its contents, information or data may not be reproduced,
redistributed or passed on, directly or indirectly.
Neither Angel Broking Pvt. Limited, nor its directors, employees or affiliates shall be liable for any loss or damage that may arise from or
in connection with the use of this information.
Note: Please refer to the important ‘Stock Holding Disclosure' report on the Angel website (Research Section). Also, please refer to the
latest update on respective stocks for the disclosure status in respect of those stocks. Angel Broking Pvt. Limited and its affiliates may have
investment positions in the stocks recommended in this report.