Market Outlook
November 10, 2015
Market Cues
Domestic Indices
Chg (%)
(Pts)
(Close)
Indian markets are expected to open in red tracking SGX Nifty and Asian peers.
BSE Sensex
(0.6)
(144)
26,121
The increased prospect that 6-years of near-zero U.S. borrowing costs may soon be
Nifty
(0.5)
(39)
7,915
brought to an end rippled through global markets, as companies hurt most by the
Mid Cap
0.4
45
10,872
stronger dollar led a selloff in American equities. U.S. stocks opened lower and soon
Small Cap
0.8
86
11,138
proceeded to extend losses, with Dow Jones industrial average falling as much as
Bankex
(0.3)
(66)
19,431
242pts at its session lows, before recovering ahead of the close.
European markets pulled back on first day of new trading week. Investor sentiment
Global Indices
Chg (%)
(Pts)
(Close)
was weak as Chinese trade data was disappointing and OECD decided to slash its
outlook for next year. Traders are keeping close eye on worrisome developments
Dow Jones
(1.0)
(180)
17,730
within Europe from Greece and Portugal. Eurozone ministers refused to release 2-bn
Nasdaq
(1.0)
(52)
5,095
euro tranche of loans to Greece after they failed to reach agreement on several
FTSE
(0.9)
(59)
6,295
reforms.
Nikkei
2.0
377
19,643
Indian markets opened 2.3% down, after BJP suffered surprise defeat in Bihar state
Hang Seng
(0.6)
(141)
22,727
elections raising concerns that his government will struggle to pass policy reforms.
Shanghai Com
1.6
57
3,647
Over the course of day, key Indian indices slowly recovered to close at half a percent
down. Select Pharma and Banking stocks pulled down the key indices, whereas Auto
and Metal stocks ended in green.
Advances / Declines
BSE
NSE
Advances
1,484
838
News & Result Analysis
Declines
1,132
632
Result Review: Page Industries, Radico Khaitan
Unchanged
131
88
Detailed analysis on Pg2
Investor’s Ready Reckoner
Volumes (` Cr)
Key Domestic & Global Indicators
BSE
2,903
Stock Watch: Latest investment recommendations on 150+ stocks
NSE
17,639
Refer P5 onwards
Net Inflows (` Cr)
Net
Mtd
Ytd
Top Picks
CMP
Target
Upside
FII
283
276
(14,543)
Company
Sector
Rating
(`)
(`)
(%)
MFs
956
1,123
51,470
Axis Bank
Financials
Buy
465
630
35.4
HCL Tech
IT
Buy
883
1,132
28.3
Top Gainers
Price (`)
Chg (%)
ICICI Bank
Financials
Buy
263
348
32.3
Essaroil
204
10.0
Ashok Leyland
Automobiles
Buy
89
111
24.9
Larsen & Toubro
Construction
Buy
1,359
1,646
21.1
Gitanjali
41
9.5
More Top Picks on Pg3
Geship
403
8.3
Balramchin
64
8.2
Key Upcoming Events
Rajeshexpo
689
7.2
Previous
Consensus
Date
Region
Event Description
Reading
Expectations
Nov 11
CNY
Industrial Production (YOY) (Oct)
5.7%
5.8%
Top Losers
Price (`)
Chg (%)
Nov 11
AUD
Employment Change (Oct)
-5.1k
15.0k
Sunpharma
757
(5.8)
Nov 13
EUR
German GDP (QoQ) (Q3)
0.4%
0.3%
Adanipower
27
(4.9)
Nov 13
USD
Core Retail Sales (MOM) (Oct)
-0.3%
0.4%
Eichermot
15,933
(4.6)
Hdil
65
(4.5)
Srtransfin
891
(4.4)
As on November 09, 2015
Market Outlook
November 10, 2015
Result Review
Page Industries (CMP: `13,017/ TP: -/ Upside: -)
Page Industries (Page) reported numbers that came in below our estimates. The
company’s top-line grew by 16.4% yoy to `454cr, which is lower than our estimate
of `500cr. The EBIDTA was higher by 38.4% yoy and came in at `94cr. The
EBIDTA margins improved by 328bp yoy and came in at 20.6%, led by 129bp
yoy, 53bp yoy and 146bp yoy decline in raw material, employee and other
expenses to 46.7%, 16.8% and 15.8% of sales, respectively. The EBITDA margin
was in-line with our estimate of 20.4%. Depreciation expense increased by 68.1%
yoy to `6cr and other income declined by 39.7% yoy to `8cr. As a result, the net
profit increased by 20.8% yoy to `60 vis-à-vis our estimate of `69cr.
On the valuation front, it is currently trading at an expensive P/E multiple of 49.3x
on FY2017E earnings. Hence, on account of higher valuations we recommend a
Neutral rating on the stock.
Y/E
Sales
OPM
PAT EPS ROE P/E P/BV EV/EBITDA EV/Sales
March
(` cr)
(%)
(` cr)
(`)
(%)
(x)
(x)
(x)
(x)
FY2016E
1,891
19.5
239
214.2 52.8 60.8 28.0
39.8
7.8
FY2017E
2,372
19.4
295
264.2 48.1 49.3 20.5
31.8
6.2
Radico Khaitan (CMP: `109/ TP: -`119/ Upside: -9%)
Radico Khaitan’s 2QFY2016 results outperformed our estimates. The company’s
top-line grew by ~2% yoy to ~`370cr (our estimates was of around `364cr),
mainly due to growth in prestige and above products segment. On the operating
front, the company reported margin expansion (up by 174bp yoy to 13.6%),
primarily on account of lower selling & distribution expenses and other costs. The
reported net profit grew by 25% yoy to ~`19cr (our estimates was of around
`15cr) on account of strong operating performance and lower interest cost (in
FY2015 the company repaid a significant amount of its debt; further debt
reduction is also on the cards) and lower taxes.
Further, the company has not performed well in the last two years due to
increasing raw material costs (ENA is a key raw material) and with it not receiving
significant price hikes from various states. We expect the company to perform well
going forward in anticipation of easing material costs and on expectation of better
price hikes. This would result in an overall improvement in the operating margin of
the company. We currently have a positive view on Radico Khaitan.
Economic and Political News
Coal imports drop 5% to 14.52mn tn in October
FIPB clears four FDI proposals worth `384cr
GE to supply 1,000 diesel locomotives to Railways
Corporate News
Centre may allocate Pottangi mines to Nalco in a month
DLF aims to start Bhubaneswar project from Dec
Jet Airways to acquire 75 Boeing 737 Max 8 Planes
Market Outlook
November 10, 2015
Top Picks ★★★★★
Large Cap
Market Cap
CMP
Target
Upside
Company
Rationale
(` Cr)
(`)
(`)
(%)
To outpace battery industry growth due to better technological
Amara Raja Batteries
15,474
906
1,040
14.8
products leading to market share gains in both the automotive
OEM and replacement segments.
Earnings to grow strongly given the MHCV cyclical upturn.
Ashok Leyland
25,300
89
111
24.9
Focus on exports and LCV's provides additional growth
avenue.
Healthy pace of branch expansion, backed by distribution
Axis Bank
110,558
465
630
35.4
network, will be the driving force for the bank’s retail business
and overall earnings.
The stock is trading at attractive valuations and is factoring all
HCL Tech
124,126
883
1,132
28.3
the bad news.
Strong visibility for a robust 20% earnings trajectory, coupled
HDFC Bank
268,376
1,066
1,262
18.4
with high quality of earnings on account of high quality retail
business and strategic focus on highly rated corporates.
Due to its robust franchise and capital adequacy position, the
bank is well positioned to grow by at least a few percentage
ICICI Bank
152,684
263
348
32.3
points higher than the average industry growth rate from a
structural point of view.
Back on the growth trend, expect a long term growth of 14%
Infosys
260,462
1,134
1,306
15.2
to be a US$20bn in FY2020.
Well positioned to benefit from such expected gradual
recovery in the overall domestic capex cycle, given its presence
Larsen & Toubro
126,463
1,359
1,646
21.1
across various infrastructure segments, its execution
capabilities, and its strong balance sheet.
LICHF continues to grow its retail loan book at a healthy pace
with improvement in asset quality. We expect the company to
LIC Housing Finance
23,966
475
571
20.2
post a healthy loan book which is likely to reflect in a strong
earnings growth.
Source: Company, Angel Research
Mid Cap
Market Cap
CMP
Target
Upside
Company
Rationale
(` Cr)
(`)
(`)
(%)
Government thrust on Renewable sector and strong order
Inox Wind
8,229
371
505
36.2
book would drive future growth.
Change in business focus towards high-margin chronic and
Ipca labs
9,093
721
900
24.9
lifestyle segments and increasing penetration in Europe and
US
Economic recovery to have favourable impact on advertising &
circulation revenue growth. Further, the acquisition of a radio
Jagran Prakashan
4,701
144
169
17.5
business (Radio City) would also boost the company's revenue
growth.
Strong brand & quality teaching with innovative technologies
MT Educare
548
138
169
22.9
& higher government educational spending to boost growth
Earnings boost on back of stable material prices and
Radico Khaitan
1,450
109
119
9.2
favourable pricing environment. Valuation discount to peers
provides additional comfort
Strong brands and distribution network would boost growth
Siyaram Silk Mills
862
920
1,145
24.6
going ahead. Stock currently trades at an inexpensive
valuation.
Structural shift in the Lighting industry towards LED lighting will
Surya Roshni
568
130
183
41.3
drive growth.
Source: Company, Angel Research
Market Outlook
November 10, 2015
Quarterly Bloomberg Brokers Consensus Estimate
Hindalco Industries Ltd - November 10, 2015
Particulars (` cr)
2QFY16E
2QFY15
y-o-y (%)
1QFY16
q-o-q (%)
Net sales
8,026
8,473
(5.3)
8,517
(5.8)
EBITDA
600
466
28.8
877
(31.6)
EBITDA margin (%)
7.5
5.5
10.3
Net profit
(96)
79
410.1
79
(222.0)
NMDC Ltd - November 10, 2015
Particulars (` cr)
2QFY16E
2QFY15
y-o-y (%)
1QFY16
q-o-q (%)
Net sales
1,586
3,102
(48.9)
1,805
(12.1)
EBITDA
793
1,894
(58.1)
1,103
(28.1)
EBITDA margin (%)
50.0
61.0
61.1
Net profit
827
1,567
(47.2)
1,010
(18.1)
Market Outlook
November 10, 2015
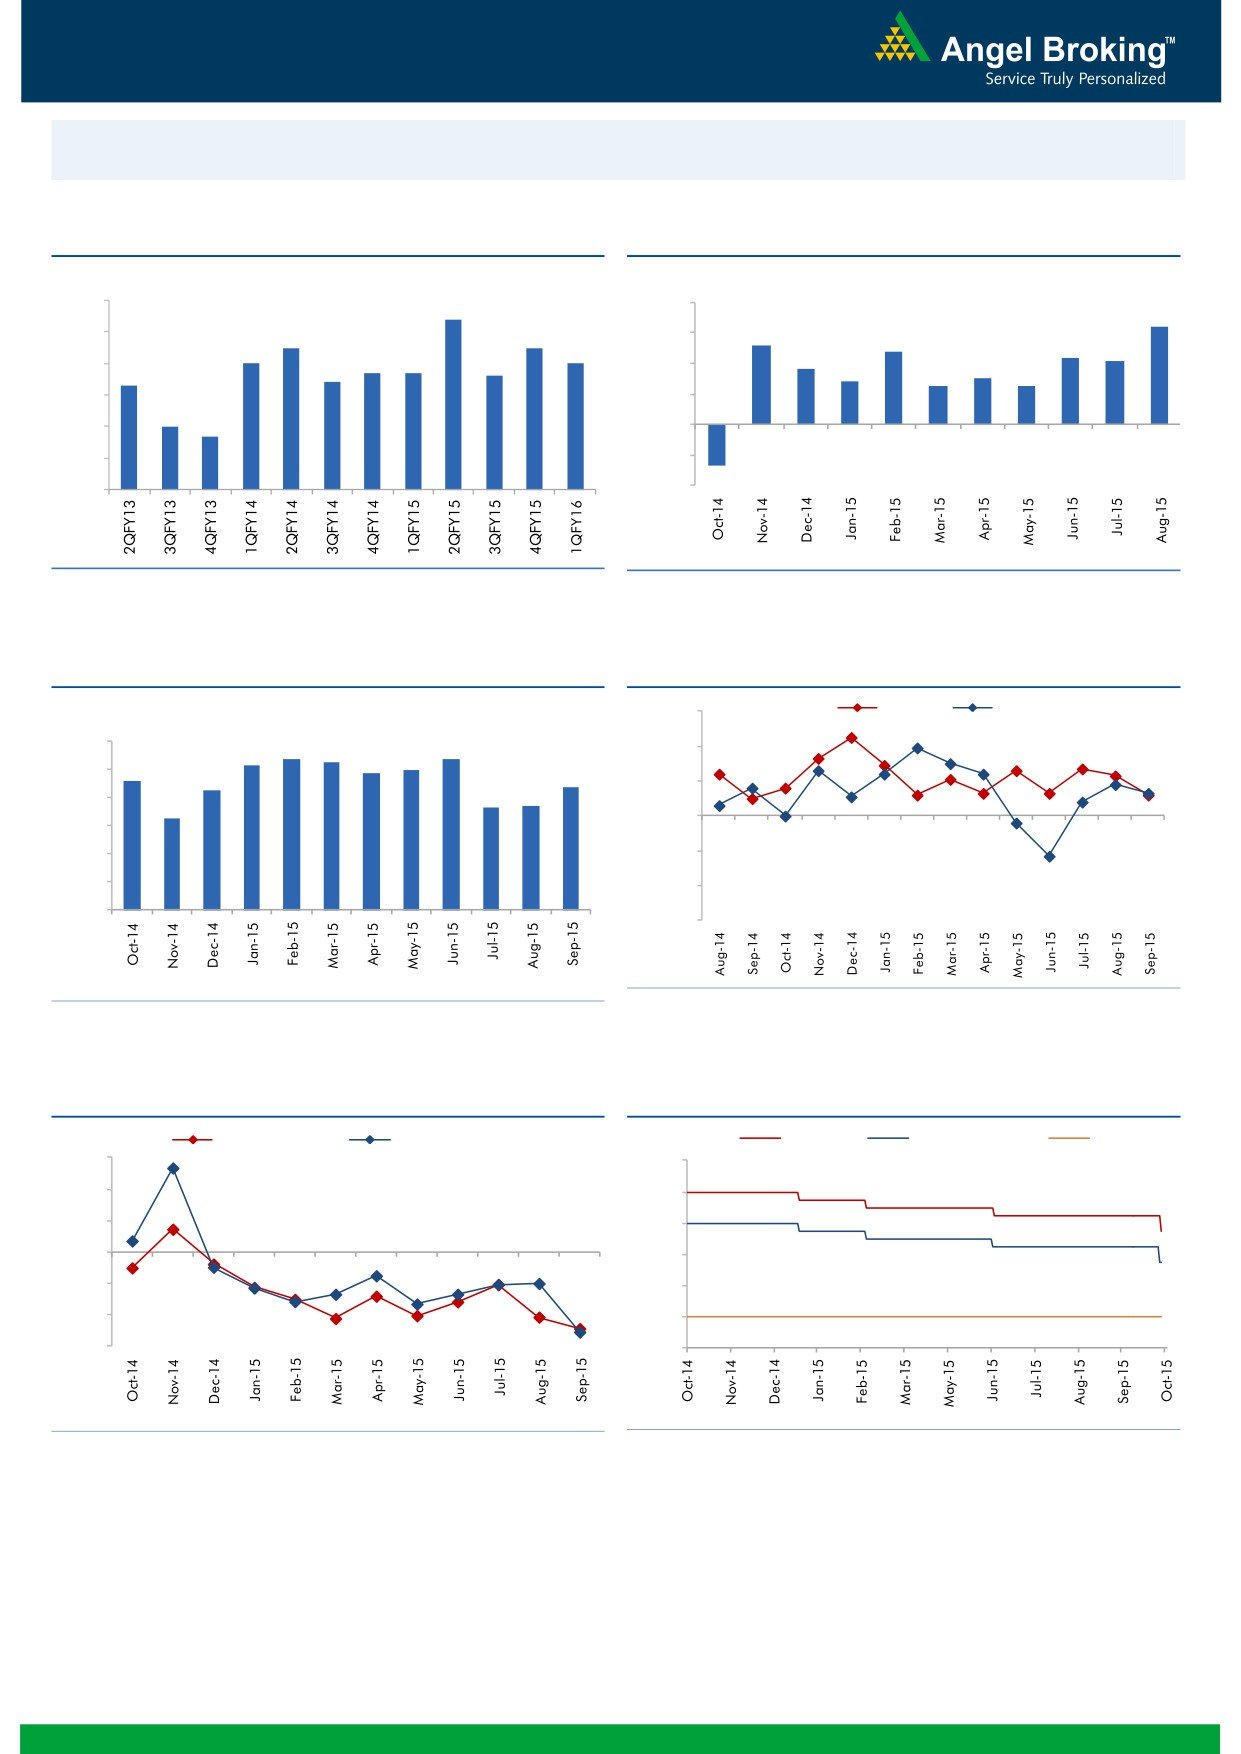
Macro watch
Exhibit 1: Quarterly GDP trends
Exhibit 2: IIP trends
(%)
(%)
9.0
8.4
8.0
6.4
7.5
7.5
5.2
8.0
6.0
4.8
7.0
7.0
4.4
4.1
6.7
6.7
3.6
7.0
6.4
6.6
4.0
2.8
3.0
6.3
2.5
2.5
6.0
2.0
5.0
4.7
5.0
-
4.0
(2.0)
3.0
(4.0)
(2.7)
Source: CSO, Angel Research
Source: MOSPI, Angel Research
Exhibit 3: Monthly CPI inflation trends
Exhibit 4: Manufacturing and services PMI
(%)
56.0
Mfg. PMI
Services PMI
6.0
5.4
5.3
5.4
54.0
5.2
5.0
4.9
4.6
5.0
4.3
4.4
52.0
3.7
3.7
4.0
3.3
50.0
3.0
2.0
48.0
1.0
46.0
-
44.0
Source: Market, Angel Research; Note: Level above 50 indicates expansion
Source: MOSPI, Angel Research
Exhibit 5: Exports and imports growth trends
Exhibit 6: Key policy rates
(%)
Exports yoy growth
Imports yoy growth
(%)
Repo rate
Reverse Repo rate
CRR
30.0
9.00
20.0
8.00
10.0
7.00
0.0
6.00
(10.0)
5.00
(20.0)
4.00
(30.0)
3.00
Source: Bloomberg, Angel Research
Source: RBI, Angel Research
Market Outlook
November 10, 2015
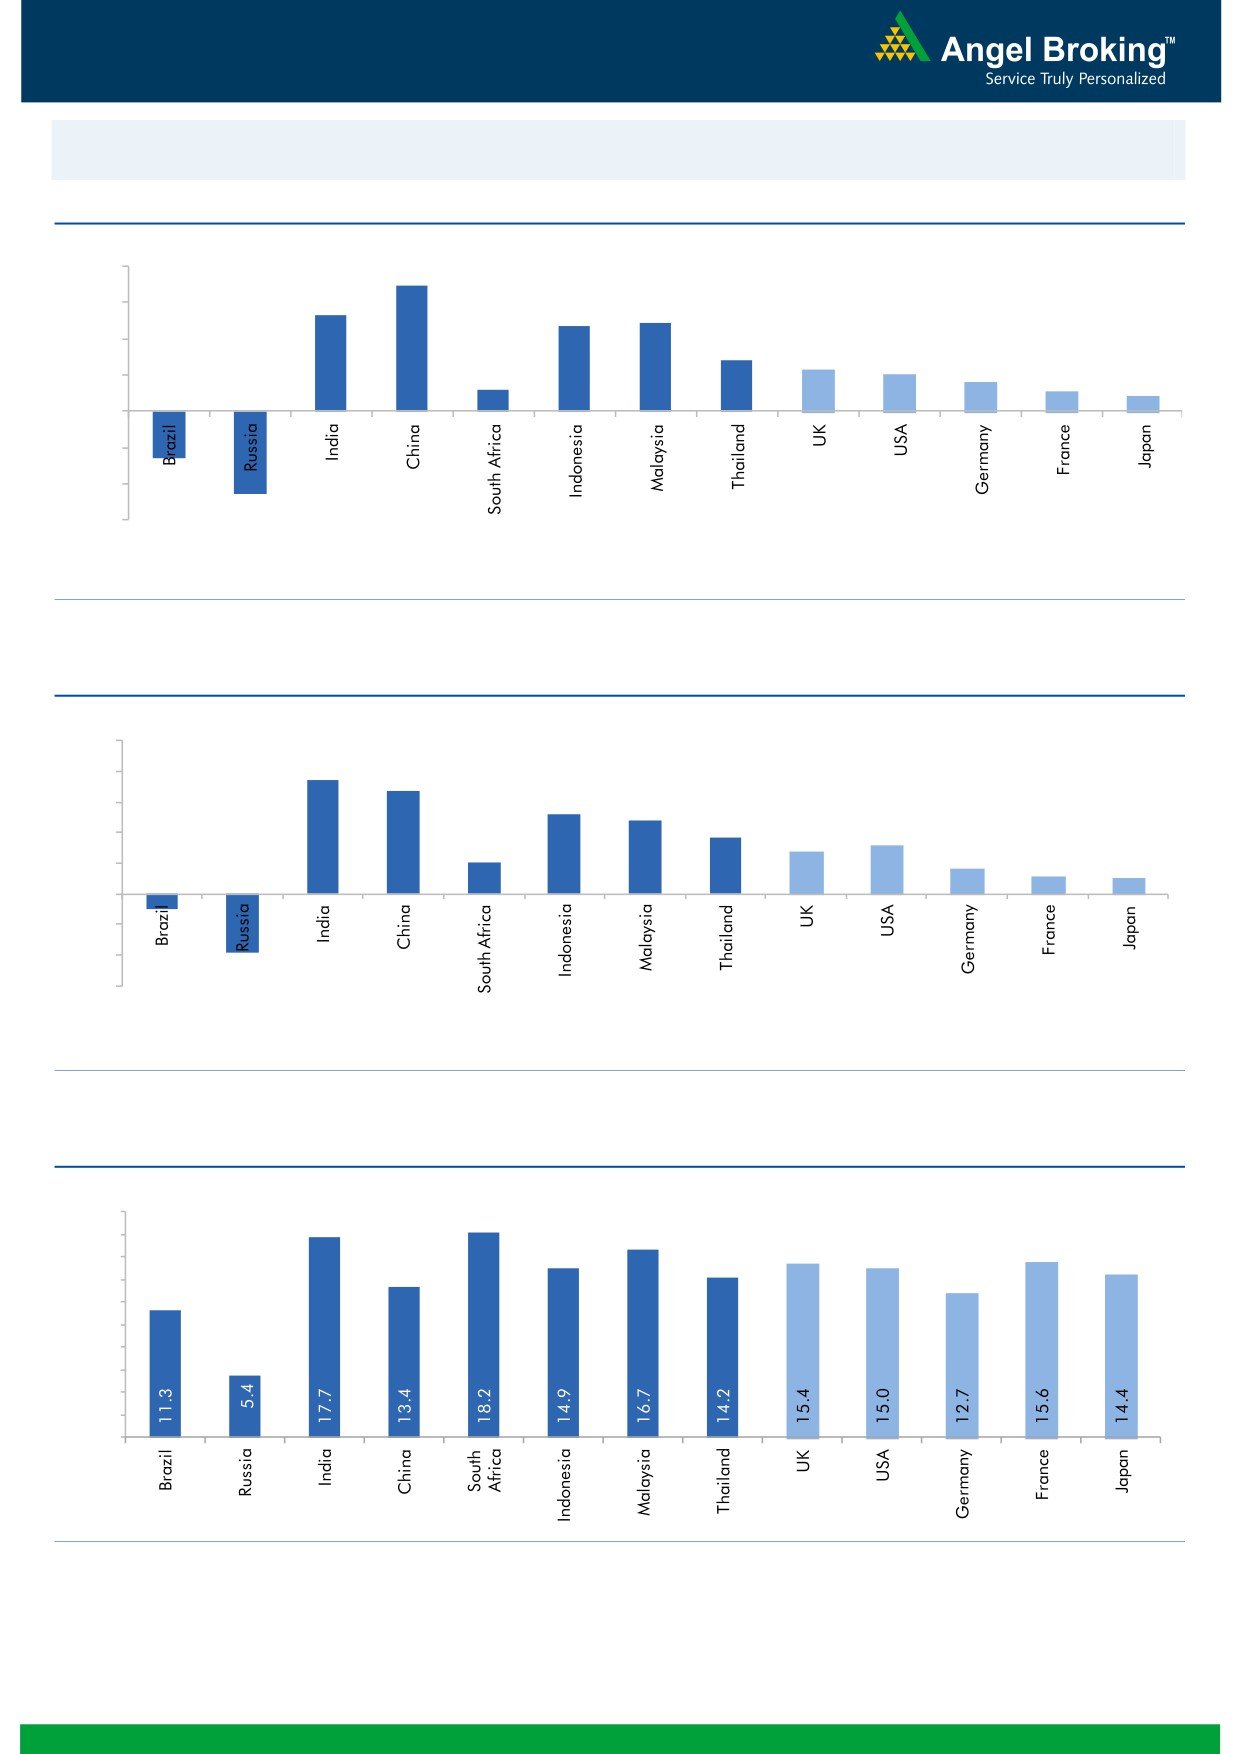
Global watch
Exhibit 1: Latest quarterly GDP Growth (%, yoy) across select developing and developed countries
(%)
8.0
6.9
5.3
6.0
4.9
4.7
4.0
2.8
2.3
2.0
1.6
2.0
1.2
1.1
0.8
(2.6)
-
(2.0)
(4.0)
(4.6)
(6.0)
Source: Bloomberg, Angel Research
Exhibit 2: 2015 GDP Growth projection by IMF (%, yoy) across select developing and developed countries
(%)
10.0
7.5
8.0
6.8
5.2
6.0
4.8
3.7
3.1
4.0
2.7
2.0
1.6
2.0
1.2
1.0
-
(2.0)
(4.0)
(1.0)
(3.8)
(6.0)
Source: IMF, Angel Research
Exhibit 3: One year forward P-E ratio across select developing and developed countries
(x)
20.0
18.0
16.0
14.0
12.0
10.0
8.0
6.0
4.0
2.0
-
Source: IMF, Angel Research
Market Outlook
November 10, 2015
Exhibit 4: Relative performance of indices across globe
Returns (%)
Country
Name of index
Closing price
1M
3M
1YR
Brazil
Bovespa
46,559
(1.6)
(5.5)
(12.4)
Russia
Micex
1,751
2.4
2.9
15.7
India
Nifty
7,915
(2.8)
(7.2)
(5.1)
China
Shanghai Composite
3,647
10.9
(7.2)
47.4
South Africa
Top 40
47,965
1.5
2.9
6.2
Mexico
Mexbol
44,479
0.4
(1.9)
(0.1)
Indonesia
LQ45
768
(3.4)
(4.7)
(8.7)
Malaysia
KLCI
1,686
(1.4)
1.9
(7.8)
Thailand
SET 50
903
(1.8)
(2.6)
(13.4)
USA
Dow Jones
17,730
3.5
1.9
0.7
UK
FTSE
6,295
(1.2)
(5.5)
(4.8)
Japan
Nikkei
19,643
7.7
(5.6)
14.7
Germany
DAX
10,815
6.9
(6.8)
17.4
France
CAC
4,911
4.7
(5.5)
16.3
Source: Bloomberg, Angel Research
Stock Watch
November 10, 2015
Company Name
Reco
CMP
Target
Mkt Cap
Sales ( Čcr )
OPM(%)
EPS (Č)
PER(x)
P/BV(x)
RoE(%)
EV/Sales(x)
(Č)
Price ( Č)
( Č cr )
FY16E FY17E
FY16E
FY17E
FY16E
FY17E
FY16E
FY17E
FY16E
FY17E
FY16E
FY17E
FY16E
FY17E
Agri / Agri Chemical
Rallis
Neutral
195
-
3,784
2,075
2,394
14.4
14.4
9.5
11.0
20.5
17.7
4.1
3.5
21.1
21.3
1.9
1.6
United Phosphorus
Buy
460
510
19,724
13,698
15,752
17.6
17.6
32.1
38.5
14.3
12.0
2.8
2.3
21.4
21.3
1.5
1.2
Auto & Auto Ancillary
Ashok Leyland
Buy
89
111
25,300
18,763
22,357
11.1
11.2
3.6
4.8
24.7
18.5
4.6
4.2
18.7
22.6
1.3
1.0
Bajaj Auto
Accumulate
2,409
2,672
69,709
24,115
27,600
21.3
21.0
136.8
157.2
17.6
15.3
5.7
4.8
32.2
31.5
2.5
2.1
Eicher Motors
Buy
15,933
22,900
43,247
11,809
15,609
15.5
17.0
362.9
567.0
43.9
28.1
13.3
9.9
30.1
35.0
4.0
3.0
Hero Motocorp
Neutral
2,619
-
52,288
28,561
31,559
14.7
14.7
151.1
163.2
17.3
16.0
6.7
5.7
38.7
35.6
1.7
1.5
L G Balakrishnan & Bros Neutral
462
-
726
1,254
1,394
11.6
11.8
35.9
41.7
12.9
11.1
1.8
1.5
13.5
13.8
0.7
0.6
Mahindra and Mahindra Neutral
1,248
-
77,503
37,231
41,710
12.4
12.8
48.8
58.3
25.6
21.4
3.6
3.2
14.0
14.9
1.8
1.5
Maruti
Accumulate
4,638
4,960
140,093
57,865
68,104
16.4
16.7
176.3
225.5
26.3
20.6
5.1
4.4
19.4
21.2
2.1
1.8
Minda Industries
Accumulate
736
809
1,168
2,567
2,965
8.0
8.3
46.1
57.8
16.0
12.7
2.7
2.2
16.7
17.3
0.5
0.4
Rane Brake Lining
Accumulate
326
366
258
454
511
11.1
11.4
23.8
28.1
13.7
11.6
1.9
1.8
14.2
15.3
0.7
0.6
Setco Automotive
Neutral
208
-
557
594
741
12.7
13.7
8.4
15.8
24.8
13.2
2.6
2.2
10.4
16.9
1.4
1.2
Tata Motors
Accumulate
412
424
118,852
264,038
297,882
13.8
13.9
34.5
38.9
11.9
10.6
2.0
1.7
17.6
16.8
0.6
0.6
TVS Motor
Accumulate
291
313
13,808
11,845
14,040
7.2
9.0
10.4
17.4
28.0
16.7
7.0
5.3
25.1
32.0
1.1
0.9
Amara Raja Batteries
Buy
906
1,040
15,474
4,892
5,871
17.4
17.6
28.8
37.1
31.5
24.4
7.3
5.9
23.4
24.1
3.0
2.5
Exide Industries
Accumulate
145
162
12,300
6,950
7,784
14.4
14.8
6.6
7.3
21.9
19.8
2.8
2.5
12.6
12.8
1.5
1.3
Apollo Tyres
Neutral
160
-
8,167
12,576
12,978
16.8
16.1
22.3
19.9
7.2
8.1
1.2
1.1
17.2
13.4
0.7
0.8
Ceat
Accumulate
987
1,119
3,992
6,041
6,597
14.1
13.7
99.5
111.9
9.9
8.8
2.0
1.6
19.6
18.5
0.8
0.7
JK Tyres
Neutral
93
-
2,118
7,446
7,669
15.2
14.0
19.6
18.4
4.8
5.1
1.2
1.0
25.2
19.5
0.7
0.6
Swaraj Engines
Neutral
942
-
1,170
552
630
14.2
14.7
44.6
54.1
21.1
17.4
4.9
4.5
23.2
25.6
2.0
1.7
Subros
Neutral
84
-
503
1,268
1,488
11.6
11.9
3.7
6.6
22.7
12.7
1.5
1.4
6.8
11.4
0.7
0.6
Indag Rubber
Neutral
193
-
507
283
329
17.0
17.2
13.0
15.4
14.9
12.5
3.3
2.7
21.8
21.6
1.6
1.3
Capital Goods
ACE
Neutral
44
-
431
660
839
4.7
8.2
1.0
3.9
43.6
11.2
1.4
1.2
3.2
11.3
0.8
0.6
BEML
Neutral
1,130
-
4,707
3,277
4,006
6.0
8.9
29.2
64.3
38.7
17.6
2.2
2.0
5.7
11.7
1.5
1.2
BGR Energy
Neutral
110
-
795
3,615
3,181
9.5
9.4
16.7
12.4
6.6
8.9
0.6
0.6
10.0
7.0
0.6
0.8
BHEL
Neutral
184
-
45,134
33,722
35,272
10.8
11.7
10.5
14.2
17.6
13.0
1.3
1.2
7.0
9.0
1.5
1.4
Blue Star
Accumulate
351
382
3,160
3,624
4,157
5.3
6.0
9.6
14.5
36.5
24.3
6.7
5.7
18.6
25.4
1.0
0.9
Crompton Greaves
Buy
169
204
10,576
13,484
14,687
4.9
6.2
4.5
7.1
37.5
23.8
2.7
2.5
7.2
10.8
0.9
0.8
Inox Wind
Buy
371
505
8,229
4,980
5,943
17.0
17.5
26.6
31.6
13.9
11.7
4.2
3.1
35.0
30.0
1.9
1.5
Stock Watch
November 10, 2015
Company Name
Reco
CMP
Target
Mkt Cap
Sales ( Čcr )
OPM(%)
EPS (Č)
PER(x)
P/BV(x)
RoE(%)
EV/Sales(x)
(Č)
Price ( Č)
( Č cr )
FY16E
FY17E
FY16E
FY17E
FY16E
FY17E
FY16E
FY17E
FY16E
FY17E
FY16E
FY17E
FY16E
FY17E
Capital Goods
KEC International
Neutral
139
-
3,561
8,791
9,716
6.1
6.8
5.4
8.2
25.7
16.9
2.6
2.4
10.0
14.0
0.6
0.6
Thermax
Neutral
854
-
10,181
6,413
7,525
7.4
8.5
30.5
39.3
28.0
21.7
4.3
3.8
15.0
17.0
1.6
1.3
Cement
ACC
Buy
1,364
1,630
25,608
13,151
14,757
16.4
18.3
63.9
83.4
21.4
16.4
2.7
2.5
13.3
16.1
1.8
1.5
Ambuja Cements
Accumulate
205
233
31,845
11,564
12,556
19.4
20.7
8.9
10.1
23.1
20.3
2.9
2.7
12.8
13.8
2.4
2.2
India Cements
Buy
80
112
2,450
4,216
4,840
18.0
19.5
4.0
9.9
19.9
8.1
0.8
0.7
4.0
9.5
0.9
0.7
JK Cement
Accumulate
645
744
4,511
3,661
4,742
10.1
15.8
18.0
61.0
35.9
10.6
2.6
2.3
7.5
22.9
1.7
1.3
J K Lakshmi Cement
Buy
352
430
4,147
2,947
3,616
16.7
19.9
11.5
27.2
30.7
13.0
2.9
2.5
9.8
20.8
1.8
1.5
Mangalam Cements
Neutral
207
-
552
1,053
1,347
10.5
13.3
8.4
26.0
24.6
8.0
1.0
1.0
4.3
12.5
0.9
0.7
Orient Cement
Accumulate
165
183
3,375
1,854
2,524
21.2
22.2
7.7
11.1
21.4
14.8
3.1
2.7
13.3
15.7
2.6
1.8
Ramco Cements
Neutral
365
-
8,701
4,036
4,545
20.8
21.3
15.1
18.8
24.2
19.4
3.0
2.6
12.9
14.3
2.7
2.3
Shree Cement^
Neutral
11,804
-
41,122
7,150
8,742
26.7
28.6
228.0
345.5
51.8
34.2
7.6
6.4
15.7
20.3
5.6
4.5
UltraTech Cement
Buy
2,755
3,282
75,592
25,021
30,023
19.1
21.6
89.0
132.0
31.0
20.9
3.6
3.1
12.2
15.9
3.2
2.7
Construction
ITNL
Neutral
89
-
2,941
7,360
8,825
34.0
35.9
1.0
5.0
89.4
17.9
0.4
0.4
0.3
1.4
3.8
3.7
KNR Constructions
Neutral
551
-
1,550
915
1,479
14.3
13.9
20.3
37.2
27.1
14.8
2.5
2.2
9.6
15.6
1.9
1.2
Larsen & Toubro
Buy
1,359
1,646
126,463
64,148
73,241
11.5
11.7
62.0
66.0
21.9
20.6
2.2
2.0
13.4
14.0
2.2
1.9
Gujarat Pipavav Port
Neutral
164
-
7,916
629
684
51.0
52.2
6.4
5.9
25.6
27.8
3.4
3.1
15.9
12.7
12.2
11.0
MBL Infrastructures
Buy
212
285
877
2,313
2,797
12.2
14.6
19.0
20.0
11.1
10.6
1.2
1.1
11.3
10.6
1.1
1.0
Nagarjuna Const.
Neutral
77
-
4,278
7,892
8,842
8.3
9.1
2.4
5.3
32.1
14.5
1.3
1.2
4.2
8.6
0.8
0.7
PNC Infratech
Neutral
528
-
2,706
1,798
2,132
13.2
13.5
22.0
30.0
24.0
17.6
2.2
1.9
11.5
11.4
1.6
1.3
Simplex Infra
Neutral
305
-
1,509
6,241
7,008
10.4
10.7
20.0
36.0
15.3
8.5
1.2
1.1
6.8
11.1
0.8
0.6
Financials
Allahabad Bank
Neutral
78
-
4,696
8,332
9,259
2.8
2.8
21.0
25.6
3.7
3.1
0.4
0.3
9.8
10.9
-
-
Axis Bank
Buy
465
630
110,558
26,473
31,527
3.5
3.6
35.7
43.5
13.0
10.7
2.5
2.2
17.9
18.9
-
-
Bank of Baroda
Neutral
171
-
39,401
19,105
21,474
2.0
2.0
19.1
24.8
8.9
6.9
0.9
0.8
10.2
12.1
-
-
Bank of India
Neutral
133
-
10,568
15,972
17,271
1.9
2.0
15.3
33.4
8.7
4.0
0.4
0.3
3.6
7.6
-
-
Canara Bank
Neutral
277
-
15,033
15,251
16,725
2.0
2.0
59.3
68.6
4.7
4.0
0.5
0.5
10.1
10.7
-
-
Dena Bank
Neutral
42
-
2,332
3,440
3,840
2.1
2.3
7.3
10.0
5.7
4.1
0.4
0.4
6.1
7.9
-
-
Federal Bank
Neutral
54
-
9,303
3,477
3,999
3.0
3.0
5.0
6.2
10.8
8.7
1.1
1.0
10.6
11.9
-
-
HDFC
Neutral
1,191
-
187,870
10,358
11,852
3.3
3.3
41.1
47.0
29.0
25.3
5.5
5.0
24.7
24.9
-
-
HDFC Bank
Buy
1,066
1,262
268,376
38,309
47,302
4.3
4.3
49.3
61.1
21.6
17.5
3.7
3.2
18.5
19.7
-
-
Stock Watch
November 10, 2015
Company Name
Reco
CMP
Target
Mkt Cap
Sales ( Čcr )
OPM(%)
EPS (Č)
PER(x)
P/BV(x)
RoE(%)
EV/Sales(x)
(Č)
Price ( Č)
( Č cr )
FY16E
FY17E
FY16E
FY17E
FY16E
FY17E
FY16E
FY17E
FY16E
FY17E
FY16E
FY17E
FY16E
FY17E
Financials
ICICI Bank
Buy
263
348
152,684
35,168
40,517
3.4
3.4
21.4
25.2
12.3
10.5
2.1
1.8
14.7
15.2
-
-
IDBI Bank
Neutral
85
-
13,602
9,625
10,455
1.8
1.8
8.5
14.2
10.0
6.0
0.6
0.6
5.9
9.3
-
-
Indian Bank
Neutral
127
-
6,114
6,160
6,858
2.5
2.5
24.5
29.8
5.2
4.3
0.4
0.4
7.7
8.6
-
-
LIC Housing Finance
Buy
475
571
23,966
3,101
3,745
2.5
2.5
33.0
40.2
14.4
11.8
2.7
2.3
19.7
20.5
-
-
Oriental Bank
Neutral
147
-
4,411
7,643
8,373
2.4
2.4
37.2
45.4
4.0
3.2
0.4
0.3
8.2
9.4
-
-
Punjab Natl.Bank
Neutral
135
-
26,558
23,638
26,557
2.8
2.8
17.9
27.2
7.6
5.0
0.8
0.6
8.5
12.0
-
-
South Ind.Bank
Neutral
21
-
2,775
1,965
2,185
2.5
2.5
2.5
3.3
8.3
6.2
0.8
0.7
9.5
11.7
-
-
St Bk of India
Buy
246
283
191,042
82,520
93,299
2.7
2.8
20.0
24.5
12.3
10.1
1.3
1.2
11.5
12.8
-
-
Union Bank
Neutral
163
-
11,236
12,646
14,129
2.3
2.4
31.0
39.1
5.3
4.2
0.6
0.5
9.8
11.4
-
-
Vijaya Bank
Neutral
33
-
2,861
3,536
3,827
1.9
1.9
5.5
6.7
6.0
5.0
0.5
0.5
7.8
8.8
-
-
Yes Bank
Buy
762
914
31,925
7,228
9,043
3.2
3.3
57.7
69.4
13.2
11.0
2.4
2.0
19.1
19.6
-
-
FMCG
Asian Paints
Neutral
815
-
78,213
16,553
19,160
16.0
16.2
17.7
21.5
46.1
37.9
12.2
11.0
29.4
31.2
4.5
3.9
Britannia
Neutral
3,046
-
36,548
8,065
9,395
9.6
10.2
47.2
65.5
64.5
46.5
21.5
20.3
38.3
41.2
4.6
3.9
Colgate
Neutral
959
-
26,096
4,836
5,490
19.5
19.7
48.5
53.2
19.8
18.0
14.5
12.6
99.8
97.5
5.2
4.6
Dabur India
Neutral
267
-
46,846
9,370
10,265
17.1
17.2
7.3
8.1
36.4
32.9
11.0
8.9
33.7
30.6
4.9
4.5
GlaxoSmith Con*
Neutral
5,872
-
24,696
4,919
5,742
17.2
17.4
168.3
191.2
34.9
30.7
9.9
8.4
28.8
28.9
4.6
3.9
Godrej Consumer
Neutral
1,350
-
45,974
10,168
12,886
16.1
16.1
32.1
38.4
42.1
35.2
8.6
7.9
19.7
21.0
4.3
3.4
HUL
Neutral
801
-
173,229
34,940
38,957
17.5
17.7
20.8
24.7
38.5
32.4
42.8
34.2
110.5
114.2
4.8
4.3
ITC
Buy
342
409
274,707
41,068
45,068
37.8
37.4
13.9
15.9
24.6
21.5
8.2
7.3
34.1
33.8
6.2
5.6
Marico
Neutral
405
-
26,132
6,551
7,766
15.7
16.0
10.4
12.5
39.0
32.4
11.3
9.4
33.2
32.4
3.9
3.3
Nestle*
Accumulate
6,137
6,646
59,167
11,291
12,847
22.2
22.3
158.9
184.6
38.6
33.2
20.2
18.2
55.0
57.3
5.1
4.5
Tata Global
Accumulate
129
144
8,126
8,635
9,072
9.8
9.9
6.5
7.6
19.8
17.0
2.0
1.9
6.8
7.4
0.9
0.8
IT
HCL Tech^
Buy
883
1,132
124,126
42,038
47,503
23.2
23.5
55.8
62.9
15.8
14.0
3.6
2.8
23.0
19.8
2.5
2.0
Infosys
Buy
1,134
1,306
260,462
60,250
66,999
28.0
28.0
58.3
63.7
19.5
17.8
4.1
3.5
20.9
19.7
3.6
3.1
TCS
Buy
2,475
3,165
487,691
111,274
126,852
28.4
28.7
125.4
143.9
19.7
17.2
7.8
7.2
39.9
42.2
4.0
3.5
Tech Mahindra
Buy
531
646
51,064
25,566
28,890
16.0
17.0
26.3
31.9
20.2
16.6
3.6
3.1
17.9
18.6
1.8
1.5
Wipro
Buy
560
719
138,351
52,414
58,704
23.7
23.8
38.4
42.3
14.6
13.2
2.9
2.5
19.5
18.0
2.3
1.9
Media
D B Corp
Accumulate
320
356
5,872
2,241
2,495
27.8
27.9
21.8
25.6
14.7
12.5
3.8
3.4
26.7
28.5
2.5
2.2
HT Media
Neutral
75
-
1,740
2,495
2,603
11.2
11.2
7.3
8.6
10.2
8.7
0.8
0.7
7.4
8.1
0.2
0.2
Stock Watch
November 10, 2015
Company Name
Reco
CMP
Target
Mkt Cap
Sales ( Čcr )
OPM(%)
EPS (Č)
PER(x)
P/BV(x)
RoE(%)
EV/Sales(x)
(Č)
Price ( Č)
( Č cr )
FY16E FY17E
FY16E
FY17E
FY16E
FY17E
FY16E
FY17E
FY16E
FY17E
FY16E
FY17E
FY16E
FY17E
Media
Jagran Prakashan
Buy
144
169
4,701
2,170
2,355
27.0
27.6
12.8
10.3
11.2
14.0
3.1
2.9
21.8
19.4
1.9
1.6
Sun TV Network
Neutral
372
-
14,646
2,779
3,196
70.2
70.5
22.8
27.3
16.3
13.6
4.0
3.6
26.7
28.3
5.2
4.5
Hindustan Media
Neutral
280
-
2,051
920
1,031
20.0
20.0
19.2
20.9
14.6
13.4
2.4
2.1
16.4
15.3
1.7
1.5
Ventures
Metals & Mining
Coal India
Buy
339
400
214,219
77,508
85,330
21.4
23.7
24.8
27.6
13.7
12.3
5.3
5.0
38.6
41.6
2.1
1.8
Hind. Zinc
Accumulate
155
175
65,535
14,641
14,026
50.4
50.4
17.7
16.0
8.8
9.7
1.3
1.2
16.2
13.2
2.1
1.9
Hindalco
Neutral
80
-
16,479
104,356
111,186
8.7
9.5
6.7
11.1
11.9
7.2
0.4
0.4
3.5
5.9
0.7
0.6
JSW Steel
Neutral
882
-
21,317
42,308
45,147
16.4
20.7
(10.3)
49.5
17.8
1.0
1.0
(1.0)
5.6
1.5
1.4
NMDC
Neutral
93
-
36,951
8,237
10,893
46.6
44.5
10.0
11.7
9.4
8.0
1.0
0.9
12.5
13.0
4.3
3.3
SAIL
Neutral
46
-
19,102
45,915
53,954
7.2
10.5
1.5
4.4
30.7
10.6
0.4
0.4
2.3
4.1
1.1
1.0
Vedanta
Neutral
94
-
27,764
71,445
81,910
26.2
26.3
12.9
19.2
7.3
4.9
0.5
0.5
7.2
8.9
0.8
0.6
Tata Steel
Neutral
222
-
21,576
126,760
137,307
8.9
11.3
6.4
23.1
34.9
9.6
0.7
0.7
2.0
7.1
0.8
0.7
Oil & Gas
Cairn India
Neutral
145
-
27,148
11,323
12,490
49.4
51.0
20.7
20.7
7.0
7.0
0.5
0.4
6.4
6.1
1.6
0.9
GAIL
Neutral
284
-
36,012
64,856
70,933
9.1
9.6
24.0
28.9
11.9
9.8
1.0
1.0
8.8
9.6
0.8
0.7
ONGC
Neutral
249
-
213,160
154,564
167,321
36.8
37.4
28.6
32.5
8.7
7.7
1.1
1.0
12.7
13.5
1.6
1.5
Petronet LNG
Neutral
212
-
15,866
29,691
31,188
5.8
6.2
12.8
13.4
16.6
15.8
2.5
2.2
15.8
14.8
0.6
0.5
Indian Oil Corp
Accumulate
414
455
100,457
359,607
402,760
5.9
6.1
42.5
48.7
9.8
8.5
1.3
1.2
14.1
14.4
0.4
0.3
Reliance Industries
Accumulate
960
1,050
310,889
304,775
344,392
12.6
13.4
91.3
102.6
10.5
9.4
1.2
1.1
11.8
12.0
0.9
0.8
Pharmaceuticals
Alembic Pharma
Neutral
673
-
12,694
2,601
3,115
21.2
20.2
20.8
23.9
32.4
28.2
10.4
7.9
37.2
31.8
4.9
4.0
Aurobindo Pharma
Accumulate
856
872
49,982
14,923
17,162
23.0
23.0
38.2
43.6
22.4
19.6
6.9
5.2
36.0
30.2
3.6
3.0
Aventis*
Neutral
4,462
-
10,275
2,082
2,371
17.4
20.8
118.2
151.5
37.8
29.5
5.5
4.4
19.9
25.5
4.4
3.7
Cadila Healthcare
Neutral
416
-
42,618
10,224
11,840
21.0
22.0
14.6
17.6
28.5
23.7
7.8
6.1
30.8
29.0
4.4
3.7
Cipla
Neutral
647
-
51,981
14,211
16,611
20.6
19.0
27.0
28.9
24.0
22.4
4.1
3.5
18.4
16.8
3.7
3.1
Dr Reddy's
Neutral
3,505
-
59,759
18,213
21,214
22.6
22.7
163.0
192.5
21.5
18.2
4.4
3.6
22.5
20.0
3.9
3.3
Dishman Pharma
Neutral
397
-
3,202
1,716
1,888
20.2
20.2
16.3
21.6
24.4
18.4
2.3
2.0
9.7
11.7
2.1
1.7
GSK Pharma*
Neutral
3,218
-
27,260
2,870
3,158
20.0
22.1
59.5
68.3
54.1
47.1
16.0
16.4
28.5
34.3
8.9
8.2
Indoco Remedies
Neutral
307
-
2,830
1,033
1,199
15.9
18.2
9.4
13.6
32.7
22.6
4.8
4.1
15.7
19.7
2.9
2.5
Ipca labs
Buy
721
900
9,093
3,363
3,909
12.9
18.6
13.4
28.0
53.8
25.7
7.0
5.6
7.4
14.0
3.0
2.6
Lupin
Neutral
1,864
-
83,905
14,864
17,244
26.9
26.9
62.1
71.1
30.0
26.2
7.3
5.8
27.4
24.6
5.3
4.4
Sun Pharma
Buy
757
950
182,143
28,163
32,610
25.8
30.7
17.4
26.9
43.5
28.1
4.1
3.6
13.0
16.6
6.4
5.3
Stock Watch
November 10, 2015
Company Name
Reco
CMP
Target
Mkt Cap
Sales ( Čcr )
OPM(%)
EPS (Č)
PER(x)
P/BV(x)
RoE(%)
EV/Sales(x)
(Č)
Price ( Č)
( Č cr )
FY16E FY17E
FY16E
FY17E
FY16E
FY17E
FY16E
FY17E
FY16E
FY17E
FY16E
FY17E
FY16E
FY17E
Power
Tata Power
Neutral
68
-
18,486
35,923
37,402
22.6
22.8
4.1
5.2
16.9
13.3
1.3
1.2
7.5
9.3
1.5
1.3
NTPC
Buy
134
157
110,077
87,064
98,846
23.5
23.5
11.7
13.2
11.4
10.1
1.3
1.2
11.4
12.1
2.3
2.1
Power Grid
Buy
130
170
67,958
20,702
23,361
86.7
86.4
12.1
13.2
10.8
9.8
1.6
1.4
15.6
15.1
8.2
7.7
Telecom
Bharti Airtel
Neutral
335
-
133,853
101,748
109,191
32.1
31.7
12.0
12.5
27.9
26.8
1.9
1.8
6.9
6.7
2.0
1.8
Idea Cellular
Neutral
134
-
48,397
34,282
36,941
32.0
31.5
5.9
6.2
22.8
21.7
2.1
1.9
9.9
9.3
2.0
1.9
zOthers
Abbott India
Neutral
5,110
-
10,859
2,715
3,153
14.5
14.1
134.3
152.2
38.1
33.6
9.5
7.8
27.4
25.6
4.0
3.4
Bajaj Electricals
Buy
237
341
2,388
4,719
5,287
5.2
5.8
8.6
12.7
27.7
18.7
3.2
2.8
11.4
14.8
0.5
0.5
Finolex Cables
Neutral
241
-
3,681
2,728
3,036
10.8
11.0
14.4
16.8
16.7
14.4
2.5
2.2
15.2
15.3
1.1
0.9
Goodyear India*
Accumulate
564
622
1,300
1,888
1,680
12.1
11.9
62.2
56.6
9.1
10.0
2.1
1.8
25.9
19.7
0.5
0.5
Hitachi
Neutral
1,366
-
3,715
1,779
2,081
7.8
8.8
21.8
33.4
62.7
40.9
10.1
8.2
17.4
22.1
2.1
1.8
Jyothy Laboratories
Neutral
303
-
5,494
1,620
1,847
11.5
11.5
7.3
8.5
41.6
35.8
5.4
5.0
13.3
14.4
3.3
2.8
MRF
Buy
38,982
45,575
16,533
20,316
14,488
21.4
21.1
5,488.0
3,798.0
7.1
10.3
2.4
2.0
41.1
21.2
0.8
1.0
Page Industries
Neutral
13,017
-
14,519
1,929
2,450
19.8
20.1
229.9
299.0
56.6
43.5
25.0
17.4
52.1
47.1
7.9
6.2
Relaxo Footwears
Neutral
519
-
6,231
1,767
2,152
12.3
12.5
19.3
25.1
27.0
20.7
6.6
5.1
27.7
27.8
3.6
2.9
Siyaram Silk Mills
Buy
920
1,145
862
1,636
1,815
11.5
11.5
89.9
104.1
10.2
8.8
1.7
1.5
17.9
17.8
0.7
0.6
Styrolution ABS India*
Neutral
718
-
1,262
1,271
1,440
8.6
9.2
32.0
41.1
22.4
17.5
2.3
2.1
10.7
12.4
1.0
0.9
Tree House
Buy
249
347
1,052
259
324
56.8
56.8
17.0
21.7
14.6
11.5
1.5
1.3
10.1
11.5
4.3
3.6
TVS Srichakra
Buy
2,726
3,210
2,087
2,127
2,388
15.2
14.9
237.7
267.5
11.5
10.2
4.9
3.5
51.7
39.8
1.1
0.9
HSIL
Accumulate
287
302
2,075
2,123
2,384
16.1
16.5
15.0
18.9
19.1
15.2
1.5
1.4
8.0
9.4
1.3
1.1
Kirloskar Engines India
Neutral
262
-
3,793
2,634
3,252
10.1
12.0
10.9
17.4
24.1
15.0
2.7
2.4
11.4
16.8
1.1
0.8
Ltd
M M Forgings
Buy
517
670
623
541
634
21.7
21.4
47.8
55.9
10.8
9.3
2.1
1.8
21.8
20.9
1.3
1.1
Banco Products (India)
Neutral
131
-
935
1,208
1,353
11.0
12.3
10.8
14.5
12.1
9.0
1.4
1.2
11.9
14.5
0.7
0.6
Competent Automobiles Neutral
134
-
82
1,007
1,114
3.1
3.1
23.7
28.2
5.7
4.8
0.8
0.7
13.9
14.6
0.1
0.1
Nilkamal
Neutral
1,010
-
1,507
1,910
2,083
10.5
10.3
63.3
69.2
16.0
14.6
2.6
2.2
17.6
16.5
0.9
0.8
Visaka Industries
Buy
135
166
214
1,158
1,272
8.6
9.5
23.7
32.7
5.7
4.1
0.6
0.5
10.1
12.5
0.3
0.3
Transport Corporation of
Neutral
271
-
2,065
2,830
3,350
8.8
9.0
14.4
18.3
18.9
14.8
2.9
2.5
15.4
17.1
0.9
0.7
India
Elecon Engineering
Accumulate
76
85
831
1,369
1,533
13.7
14.9
3.3
6.1
23.0
12.6
1.5
1.4
6.6
11.4
1.0
0.9
Surya Roshni
Buy
130
183
568
2,992
3,223
8.1
8.4
14.7
18.3
8.8
7.1
0.8
0.7
9.7
11.0
0.5
0.4
MT Educare
Buy
138
169
548
286
366
18.3
17.7
7.7
9.4
17.8
14.7
3.8
3.3
20.2
21.1
1.8
1.4
Stock Watch
November 10, 2015
Company Name
Reco
CMP
Target Mkt Cap
Sales ( Čcr )
OPM(%)
EPS (Č)
PER(x)
P/BV(x)
RoE(%)
EV/Sales(x)
(Č)
Price ( Č)
( Č cr )
FY16E FY17E FY16E FY17E FY16E FY17E FY16E FY17E FY16E FY17E FY16E FY17E FY16E FY17E
zOthers
Radico Khaitan
Accumulate
109
119
1,450
1,565
1,687
11.9
12.4
5.4
6.6
20.1
16.6
1.6
1.5
8.0
9.0
1.4
1.3
Garware Wall Ropes
Buy
354
423
775
875
983
10.4
10.6
23.1
27.8
15.3
12.7
2.2
1.9
14.1
14.8
0.9
0.7
Wonderla Holidays
Neutral
333
-
1,882
206
308
44.0
43.6
9.0
12.9
37.0
25.8
5.1
4.6
13.7
17.8
9.0
6.0
Linc Pen & Plastics
Accumulate
164
185
242
340
371
8.3
8.9
10.8
13.2
15.2
12.4
2.4
2.1
16.0
17.1
0.8
0.7
The Byke Hospitality
Buy
164
181
658
222
287
20.5
20.5
5.6
7.6
29.1
21.7
5.5
4.5
18.9
20.8
2.8
2.2
Source: Company, Angel Research; Note: *December year end; #September year end; &October year end; Price as on November 09, 2015
Market Outlook
November 10, 2015
Research Team Tel: 022 - 39357800
DISCLAIMER
Angel Broking Private Limited (hereinafter referred to as “Angel”) is a registered Member of National Stock Exchange of India Limited,
Bombay Stock Exchange Limited and Metropolitian Stock Exchange of India Limited. It is also registered as a Depository Participant with
CDSL and Portfolio Manager with SEBI. It also has registration with AMFI as a Mutual Fund Distributor. Angel Broking Private Limited is a
registered entity with SEBI for Research Analyst in terms of SEBI (Research Analyst) Regulations, 2014 vide registration number
INH000000164. Angel or its associates has not been debarred/ suspended by SEBI or any other regulatory authority for accessing
/dealing in securities Market. Angel or its associates including its relatives/analyst do not hold any financial interest/beneficial ownership
of more than 1% in the company covered by Analyst. Angel or its associates/analyst has not received any compensation / managed or co
-managed public offering of securities of the company covered by Analyst during the past twelve months. Angel/analyst has not served as
an officer, director or employee of company covered by Analyst and has not been engaged in market making activity of the company
covered by Analyst.
This document is solely for the personal information of the recipient, and must not be singularly used as the basis of any investment
decision. Nothing in this document should be construed as investment or financial advice. Each recipient of this document should make
such investigations as they deem necessary to arrive at an independent evaluation of an investment in the securities of the companies
referred to in this document (including the merits and risks involved), and should consult their own advisors to determine the merits and
risks of such an investment.
Reports based on technical and derivative analysis center on studying charts of a stock's price movement, outstanding positions and
trading volume, as opposed to focusing on a company's fundamentals and, as such, may not match with a report on a company's
fundamentals.
The information in this document has been printed on the basis of publicly available information, internal data and other reliable sources
believed to be true, but we do not represent that it is accurate or complete and it should not be relied on as such, as this document is for
general guidance only. Angel Broking Pvt. Limited or any of its affiliates/ group companies shall not be in any way responsible for any
loss or damage that may arise to any person from any inadvertent error in the information contained in this report. Angel Broking Pvt.
Limited has not independently verified all the information contained within this document. Accordingly, we cannot testify, nor make any
representation or warranty, express or implied, to the accuracy, contents or data contained within this document. While Angel Broking
Pvt. Limited endeavors to update on a reasonable basis the information discussed in this material, there may be regulatory, compliance,
or other reasons that prevent us from doing so.
This document is being supplied to you solely for your information, and its contents, information or data may not be reproduced,
redistributed or passed on, directly or indirectly.
Neither Angel Broking Pvt. Limited, nor its directors, employees or affiliates shall be liable for any loss or damage that may arise from or
in connection with the use of this information.
Note: Please refer to the important ‘Stock Holding Disclosure' report on the Angel website (Research Section). Also, please refer to the
latest update on respective stocks for the disclosure status in respect of those stocks. Angel Broking Pvt. Limited and its affiliates may have
investment positions in the stocks recommended in this report.