Market Outlook
June 10, 2016
Market Cues
Domestic Indices
Chg (%)
(Pts)
(Close)
Indian Markets are expected to open flat tracking SGX Nifty & Global Markets.
BSE Sensex
(1.0)
(257)
26,763
The US markets ended marginally negative as traders booked profit amid renewed
Nifty
(0.8)
(69)
8,204
concern over domestic economy. Weakness emerged in the energy sector as July
Mid Cap
(0.5)
(54)
11,422
WTI oil fell.
Small Cap
0.0
4
11,385
Euorpean stocks ended in red yesterday on the back of rising concern over Breexit.
Bankex
(0.3)
(57)
20,503
The FTSE closed 1.1% down while France’s CAC went down by 0.97% and
Germany’s DAX ended deep in red losing by 128 points down 1.25%.
Global Indices
Chg (%)
(Pts)
(Close)
The Indian market opened with negative note and saw selling during the day.
Dow Jones
(0.1)
(20)
17,985
Market heavy weight like Infosys saw selling pressure during the day as the company
Nasdaq
(0.3)
(16)
4,959
said it is expecting short term quarterly bumps in some of the key sector that it had
FTSE
(1.1)
(70)
6,232
not anticipated during the beginning of the quarter. Selling was witnessed in the
large Pharma and FMCG stocks also which put further pressure on the overall
Nikkei
(1.0)
(163)
16,668
markets.
Hang Seng
(0.1)
(30)
21,298
Shanghai Com
(0.3)
(9)
2,927
News Analysis
Govt plans 25% export uty on sugal
Detailed analysis on Pg2
Advances / Declines
BSE
NSE
Advances
1,220
714
Investor’s Ready Reckoner
Declines
1,353
828
Key Domestic & Global Indicators
Unchanged
183
95
Stock Watch: Latest investment recommendations on 150+ stocks
Refer Pg4 onwards
Volumes (` Cr)
Top Picks
BSE
2,801
CMP
Target
Upside
Company
Sector
Rating
NSE
16,684
(`)
(`)
(%)
Amara Raja
Auto/Auto Ancillary
Buy
844
1,076
27.5
Net Inflows (` Cr)
Net
Mtd
Ytd
HCL Tech
IT
Buy
744
1,000
34.5
LIC Housing
Financials
Buy
480
592
23.4
FII
541
3,707
18,076
Bharat Electronics
Capital Goods
Buy
1,289
1,414
9.7
MFs
(154)
(342)
9,089
Navkar Corporation Others
Buy
198
265
33.8
More Top Picks on Pg3
Top Gainers
Price (`)
Chg (%)
Mmtc
45
17.0
Key Upcoming Events
Previous
Consensus
Jpinfratec
6
12.7
Date
Region
Event Description
Reading
Expectations
Hindcopper
53
12.5
June 10 India
Imports YoY%
(23.1)
--
Sail
45
6.8
June 10 India
Exports YoY%
(6.7)
--
Gvkpil
5
6.6
June 10 India
Industrial Production YoY
0.1
--
June 10 China
Industrial Production YoY
6.0
--
6.(
More Events on Pg4
Top Losers
Price (`)
Chg (%)
Muthootfin
256
(5.8)
Infy
1,185
(4.3)
Shreecem
13,492
(3.8)
Pvr
905
(3.7)
Vakrangee
163
(3.4)
As on June9, 2016
Market Outlook
June 10, 2016
Center planning to impose 25% duty on sugar exports:
Looking at the increasing trend in the sugar prices in the international market the
central Government might put a 25% export duty on sugar. Exports might take the
opportunity to encash on the rising prices in the overseas markets which can put
pressure in the prices in domestic markets as well. If implement this will be the first
ever implementation of such high export duty on this essential commodity. Brazil
which is the largest producer of sugar has seen delayed harvest and this has
resulted in 50% rise in sugar prices in the international market.
India is the second largest producer of sugar however, it is the largest consumer of
the commodity and hence there is fear that any export from the Indian market can
create shortage and subsequent rise in prices. Sugar prices in the retail markets
have gone up by as sigh as Rs 7 per kg in the last 2-3 months expecting lower
production. A good monsoon and subsequent harvest can result in easing prices in
the domestic market.
Economic and Political News
IKEA plans to double sourcing from India
NITI Ayog concerned over total ban on tobacco products
Russia eyes manufacture of nuclear power components in India.
RBI officials meet senior bankers to formulate new debt rejig plan
Corporate News
Visa steel to seek share holders nod for merger of Visa Bar.
TVS auto invests `75 cr in start up.
Steel ministry seeks extension of floor price on imports.
Market Outlook
June 10, 2016
Top Picks ★★★★★
Large Cap
Market Cap
CMP
Target
Upside
Company
Rationale
(` Cr)
(`)
(`)
(%)
To outpace battery industry growth due to better technological
Amara Raja Batteries
14,376
842
1,076
27.8
products leading to market share gains in both the automotive
OEM and replacement segments.
Uptick in defense capex by government, coupled with BELs
Bharat Electronics
30,280
1,262
1,414
12.1
strong market positioning, indicate good times ahead for BEL.
HCL Tech
1,06,257
753
1,000
32.7
Stock is trading at attractive valuations & factors all bad news.
Strong visibility for a robust 20% earnings trajectory, coupled
HDFC Bank
2,93,669
1,160
1,262
8.8
with high quality of earnings on account of high quality retail
business and strategic focus on highly rated corporates.
Back on the growth trend, expect a long term growth of 14% to
Infosys
2,72,291
1,185
1,374
15.9
be a US$20bn in FY2020.
Continues to grow its retail loan book at healthy pace with
LIC Housing Finance
24,014
476
592
24.3
improvement in asset quality. Expect LICHF to post a healthy
loan book which is likely to reflect in a strong earnings growth.
Huge bid pipeline of re-development works at Delhi and other
NBCC
11,337
189
220
16.4
State Governments and opportunity from Smart City, positions
NBCC to report strong growth, going forward.
Strong market positioning within the domestic AC markets to
Voltas
11,048
334
407
21.9
continue, EMP business set to revive
Source: Company, Angel Research
Mid Cap
Market Cap
CMP
Target
Upside
Company
Rationale
(` Cr)
(`)
(`)
(%)
Among the top 4 players in the consumer durables segment.
Bajaj Electricals
2,317
229
268
16.9
Improved profitability backed by turn around in E&P segment.
Strong order book lends earnings visibility.
Favourable outlook for AC industry to augur well for Cooling
Blue Star
3,980
442
495
11.9
products business. EMPPAC division's profitability to improve
once operating environment turns around.
With a focus on the low and medium income (LMI) consumer
Dewan Housing
6,186
212
270
27.4
segment, the company has increased its presence in tier-II & III
cities where the growth opportunity is immense.
Strong loan growth backed by diversified loan portfolio and
Equitas Holdings
5,894
176
235
33.7
adequate CAR. ROE & ROA likely to remain decent as risk of
dilution remains low. Attractive valuations considering growth.
Commencement of new projects, downtrend in the interest rate
IL&FS Transport
2,444
74
93
25.2
cycle, to lead to stock re-rating
Economic recovery to have favourable impact on advertising &
circulation revenue growth. Further, the acquisition of a radio
Jagran Prakashan
5,641
173
205
18.8
business (Radio City) would also boost the company's revenue
growth.
Speedier execution and speedier sales, strong revenue visibility
Mahindra Lifespace
1,870
456
554
21.5
in short-to-long run, attractive valuations
Massive capacity expansion along with rail advantage at ICD
Navkar Corporation
2,795
196
265
35.2
as well CFS augurs well for the company
Earnings boost on back of stable material prices and
Radico Khaitan
1,211
91
125
37.3
favourable pricing environment. Valuation discount to peers
provides additional comfort
Strong brands and distribution network would boost growth
Siyaram Silk Mills
988
1,054
1,347
27.9
going ahead. Stock currently trades at an inexpensive
valuation.
Source: Company, Angel Research
Market Outlook
June 10, 2016
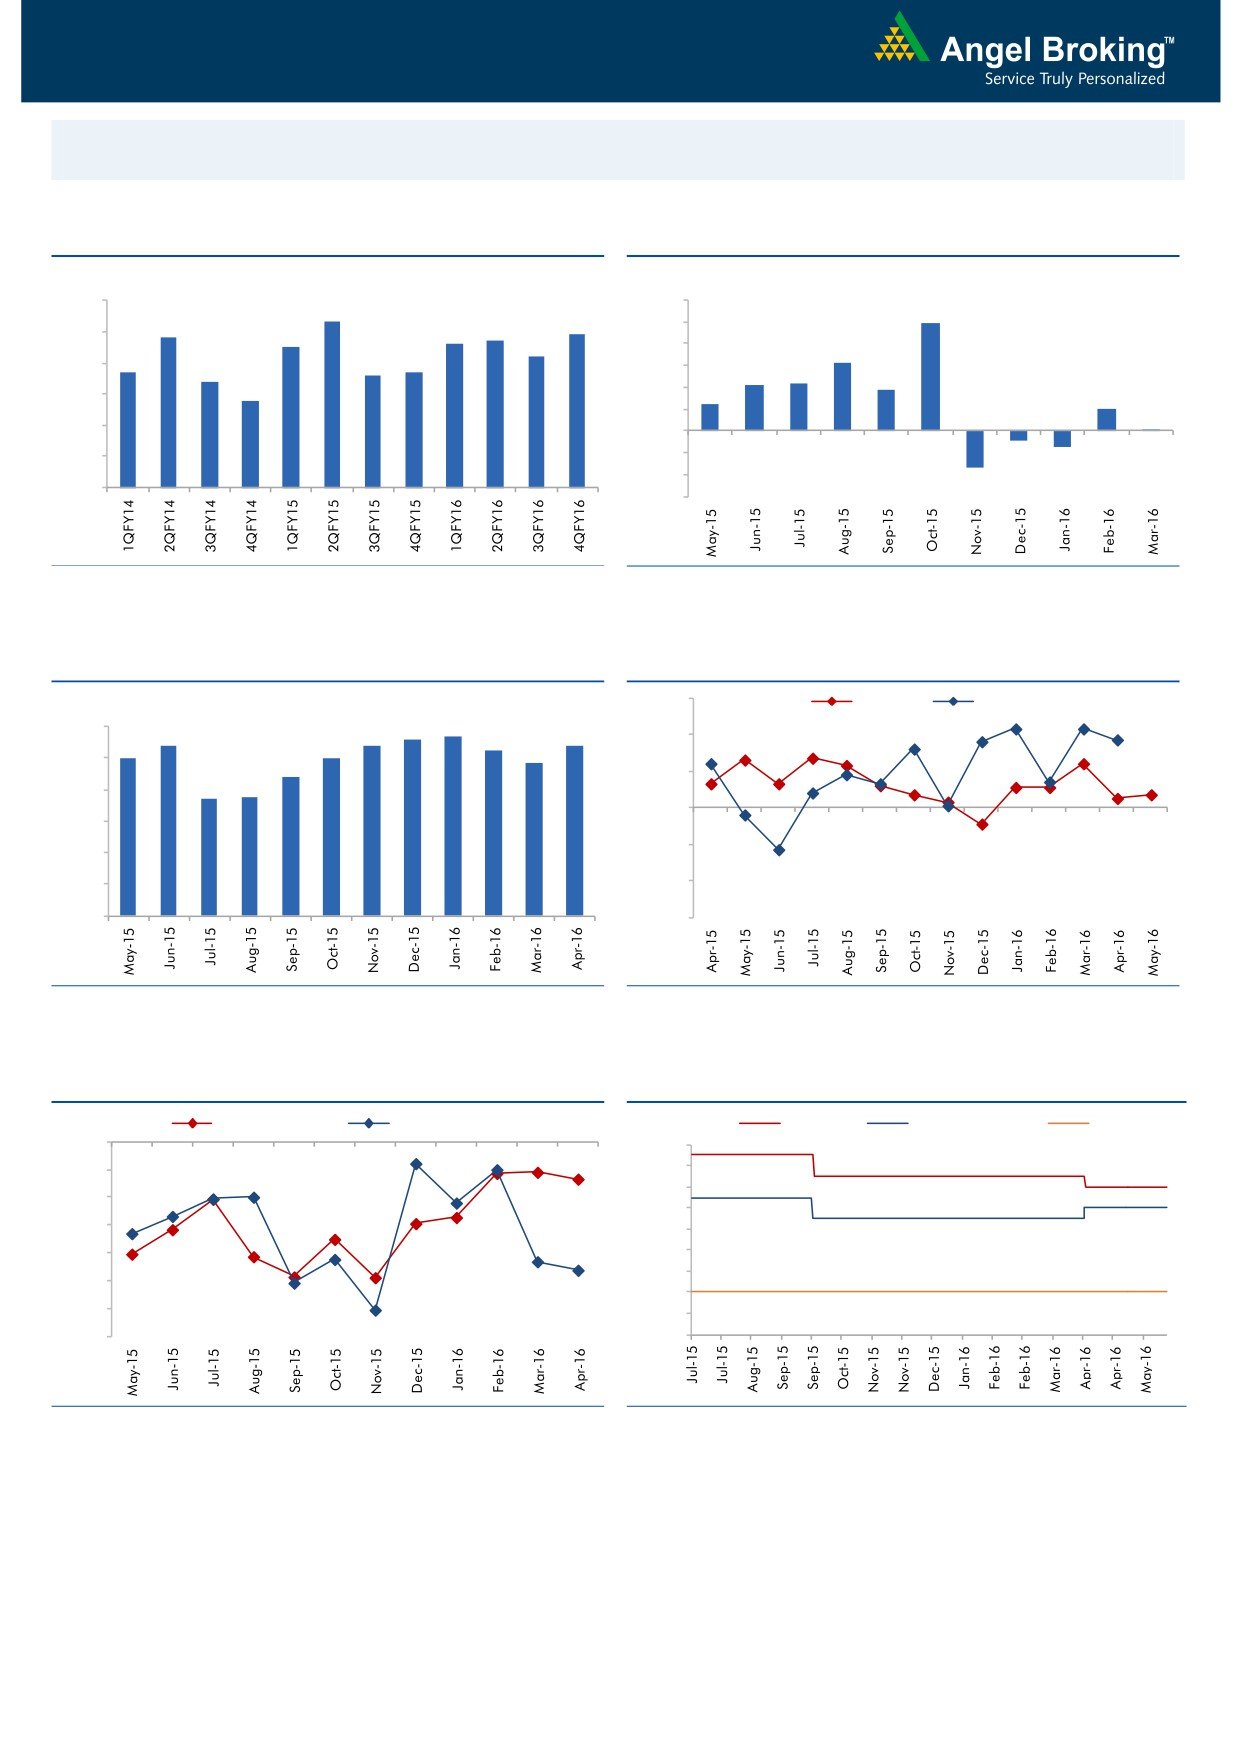
Macro watch
Exhibit 1: Quarterly GDP trends
Exhibit 2: IIP trends
(%)
(%)
9.0
8.3
12.0
9.9
7.8
7.7
7.9
10.0
8.0
7.5
7.6
7.2
8.0
6.3
6.7
6.6
6.7
7.0
6.4
6.0
4.2
4.3
3.7
5.8
4.0
2.5
6.0
2.0
2.0
0.1
5.0
-
4.0
(2.0)
(0.9)
(1.5)
(4.0)
3.0
(3.4)
(6.0)
Source: CSO, Angel Research
Source: MOSPI, Angel Research
Exhibit 3: Monthly CPI inflation trends
Exhibit 4: Manufacturing and services PMI
56.0
Mfg. PMI
Services PMI
(%)
5.6
5.7
6.0
5.4
5.4
5.4
5.3
54.0
5.0
5.0
4.8
5.0
4.4
52.0
3.7
3.7
4.0
50.0
3.0
48.0
2.0
1.0
46.0
-
44.0
Source: MOSPI, Angel Research
Source: Market, Angel Research; Note: Level above 50 indicates expansion
Exhibit 5: Exports and imports growth trends
Exhibit 6: Key policy rates
(%)
Exports yoy growth
Imports yoy growth
(%)
Repo rate
Reverse Repo rate
CRR
0.0
7.50
(5.0)
7.00
6.50
(10.0)
6.00
(15.0)
5.50
(20.0)
5.00
4.50
(25.0)
4.00
(30.0)
3.50
(35.0)
3.00
Source: Bloomberg, Angel Research
Source: RBI, Angel Research
Market Outlook
June 10, 2016
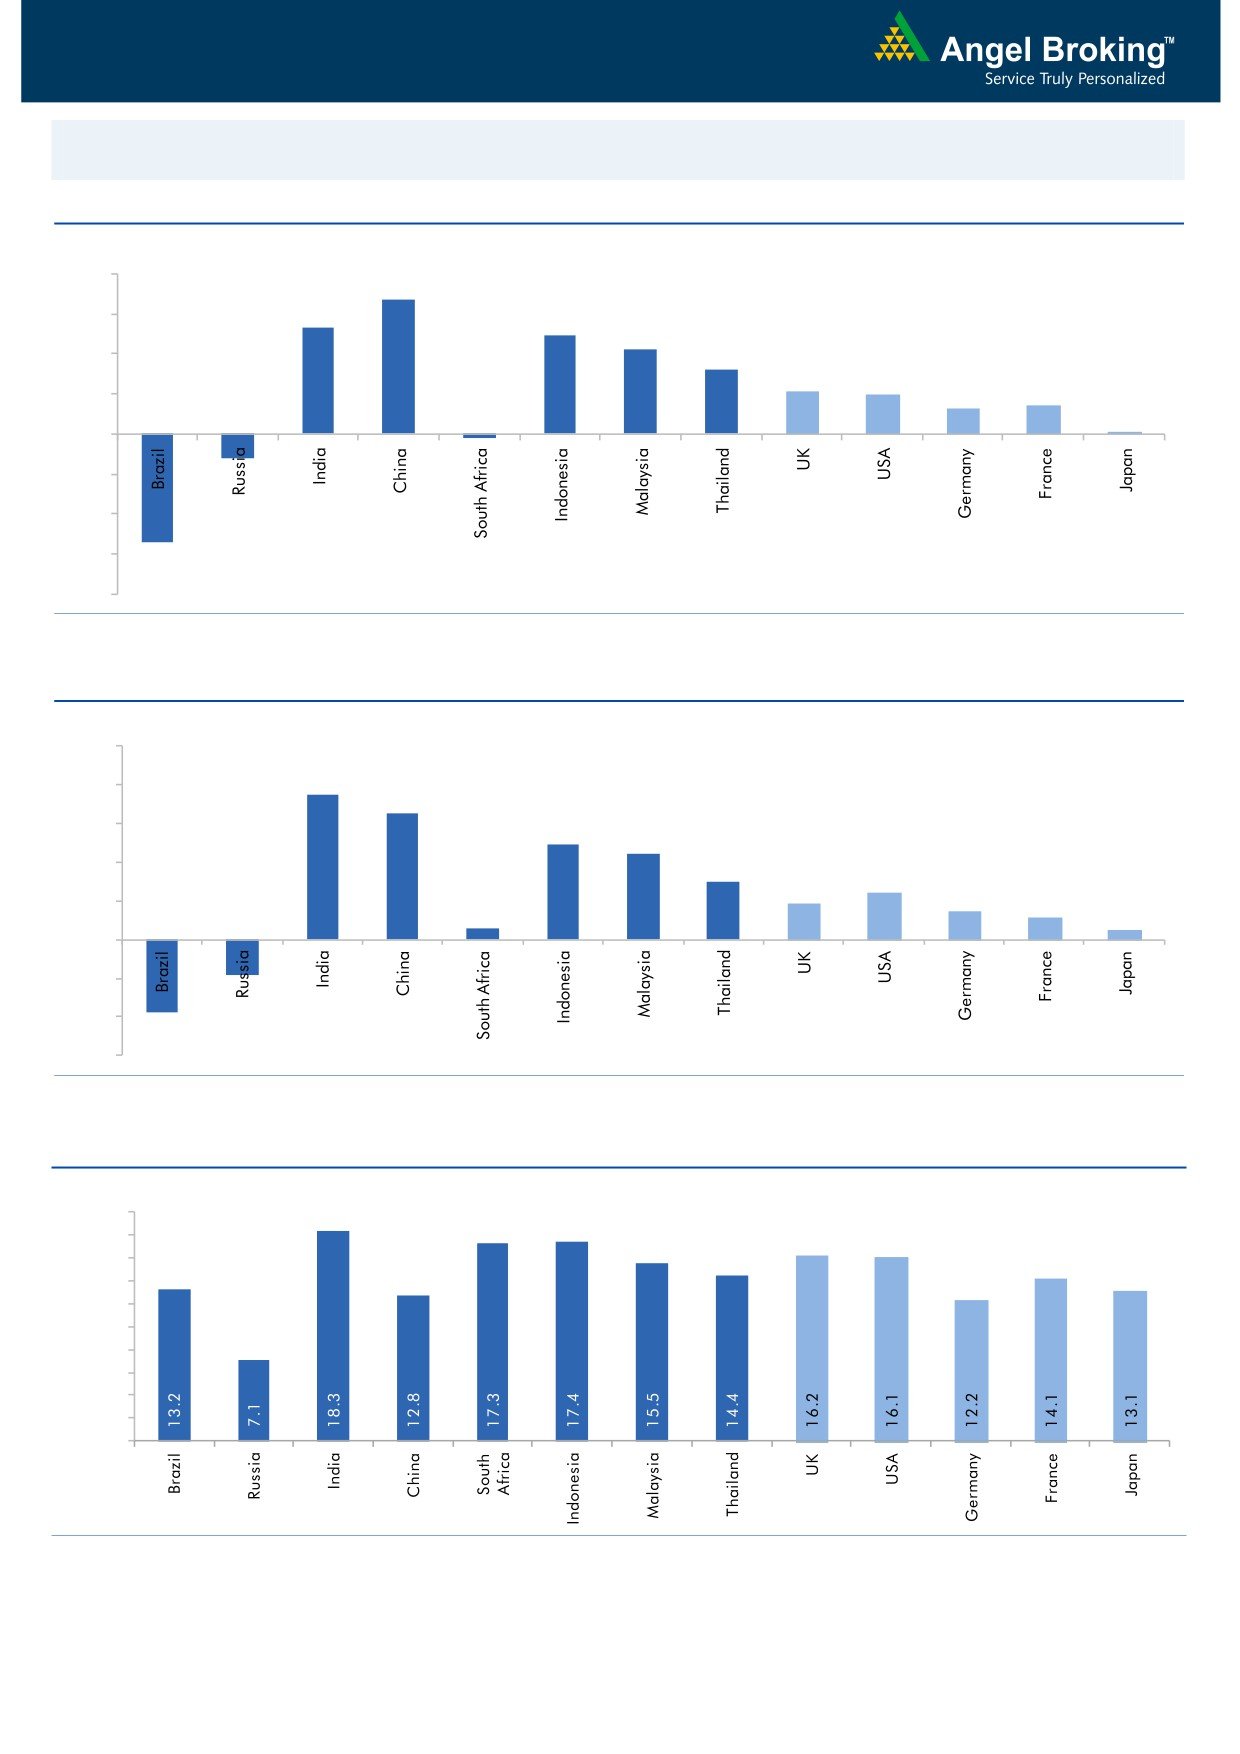
Global watch
Exhibit 1: Latest quarterly GDP Growth (%, yoy) across select developing and developed countries
(%)
8.0
6.7
6.0
5.3
4.9
4.2
4.0
3.2
2.1
2.0
1.3
1.4
2.0
0.1
-
(0.2)
(2.0)
(4.0)
(1.2)
(6.0)
(5.4)
(8.0)
Source: Bloomberg, Angel Research
Exhibit 2: 2016 GDP Growth projection by IMF (%, yoy) across select developing and developed countries
(%)
10.0
7.5
8.0
6.5
6.0
4.9
4.4
4.0
3.0
2.4
1.9
1.5
2.0
1.1
0.6
0.5
(3.8)
(1.8)
-
(2.0)
(4.0)
(6.0)
Source: IMF, Angel Research
Exhibit 3: One year forward P-E ratio across select developing and developed countries
(x)
20.0
18.0
16.0
14.0
12.0
10.0
8.0
6.0
4.0
2.0
-
Source: IMF, Angel Research
Market Outlook
June 10, 2016
Exhibit 4: Relative performance of indices across globe
Returns (%)
Country
Name of index
Closing price
1M
3M
1YR
Brazil
Bovespa
51,118
0.3
4.1
(5.7)
Russia
Micex
1,935
2.6
1.3
16.3
India
Nifty
8,204
4.0
9.7
0.9
China
Shanghai Composite
2,927
3.4
0.9
(39.4)
South Africa
Top 40
47,177
3.2
2.1
3.9
Mexico
Mexbol
45,663
(0.0)
2.6
2.3
Indonesia
LQ45
835
1.1
(0.3)
(7.6)
Malaysia
KLCI
1,651
0.9
(2.4)
(5.2)
Thailand
SET 50
914
3.1
5.6
(7.2)
USA
Dow Jones
17,985
1.6
5.8
(0.3)
UK
FTSE
6,232
1.9
0.8
(8.2)
Japan
Nikkei
16,668
0.6
(2.0)
(19.0)
Germany
DAX
10,089
1.1
4.1
(8.2)
France
CAC
4,406
1.6
(0.5)
(8.3)
Source: Bloomberg, Angel Research
Stock Watch
June 10, 2016
Company Name
Reco
CMP
Target
Mkt Cap
Sales ( Čcr )
OPM(%)
EPS (Č)
PER(x)
P/BV(x)
RoE(%)
EV/Sales(x)
(Č)
Price ( Č)
( Č cr )
FY16E FY17E
FY16E
FY17E
FY16E
FY17E
FY16E
FY17E
FY16E
FY17E
FY16E
FY17E
FY16E
FY17E
Agri / Agri Chemical
Rallis
Neutral
216
-
4,193
1,612
1,911
13.3
13.3
7.4
9.5
29.1
22.7
4.7
4.2
16.7
18.4
2.6
2.2
United Phosphorus
Buy
591
684
25,322
13,083
15,176
18.5
18.5
31.5
37.4
18.8
15.8
3.7
3.1
21.4
21.4
2.1
1.8
Auto & Auto Ancillary
Ashok Leyland
Neutral
107
-
30,465
17,995
21,544
11.4
11.6
3.4
4.7
31.5
22.8
5.5
5.1
17.7
22.2
1.7
1.3
Bajaj Auto
Neutral
2,593
-
75,040
22,709
25,860
20.9
20.1
129.0
143.6
20.1
18.1
6.2
5.3
30.7
29.4
2.8
2.5
Bharat Forge
Accumulate
761
875
17,716
7,351
8,318
19.9
19.7
31.2
36.5
24.4
20.9
4.4
3.7
19.3
19.2
2.5
2.2
Eicher Motors
Accumulate
18,584
20,044
50,476
15,556
16,747
15.5
17.3
464.8
597.5
40.0
31.1
14.6
10.7
36.2
34.3
3.2
2.9
Gabriel India
Accumulate
89
101
1,278
1,415
1,544
8.7
9.0
4.6
5.4
19.4
16.5
3.5
3.1
18.1
18.9
0.9
0.8
Hero Motocorp
Neutral
3,083
-
61,569
28,244
30,532
15.5
15.9
156.7
168.5
19.7
18.3
7.9
6.7
39.9
36.4
2.0
1.8
Jamna Auto Industries Neutral
160
-
1,282
1,281
1,473
11.2
11.5
7.6
9.2
21.1
17.4
5.3
4.4
25.4
25.2
1.1
0.9
L G Balakrishnan & Bros Neutral
486
-
763
1,254
1,394
11.6
11.8
35.9
41.7
13.6
11.7
1.8
1.6
13.5
13.8
0.7
0.6
Mahindra and Mahindra Neutral
1,377
-
85,503
38,416
42,904
13.7
13.9
54.8
63.4
25.1
21.7
3.9
3.4
15.4
15.8
1.9
1.6
Maruti
Neutral
4,169
-
125,937
57,865
68,104
16.4
16.7
176.3
225.5
23.7
18.5
4.6
3.9
19.4
21.2
2.0
1.6
Minda Industries
Neutral
1,167
-
1,851
2,523
2,890
8.7
9.0
55.0
65.4
21.2
17.8
4.1
3.3
19.3
18.7
0.8
0.7
Motherson Sumi
Accumulate
290
313
38,340
39,343
45,100
8.8
9.1
10.1
12.5
28.7
23.2
9.1
7.1
35.3
34.4
1.1
0.9
Rane Brake Lining
Buy
374
465
296
454
511
11.5
12.0
25.2
31.0
14.8
12.1
2.2
2.0
14.9
16.6
0.8
0.7
Setco Automotive
Neutral
46
-
612
594
741
12.7
13.7
1.7
3.2
26.9
14.3
2.8
2.5
10.4
16.9
1.5
1.2
Tata Motors
Neutral
467
-
134,746
259,686
273,957
13.0
13.4
25.9
29.5
18.0
15.8
2.4
2.1
8.0
9.0
0.7
0.7
TVS Motor
Accumulate
290
330
13,797
11,263
13,122
6.9
8.5
9.2
15.0
31.6
19.4
7.2
5.7
22.7
29.6
1.2
1.0
Amara Raja Batteries
Buy
842
1,076
14,376
4,690
5,429
17.5
17.5
28.5
35.3
29.6
23.8
6.8
5.6
23.1
25.9
3.1
2.6
Exide Industries
Neutral
160
-
13,587
6,950
7,784
14.4
14.8
6.6
7.3
24.2
21.9
3.1
2.8
12.6
12.8
1.7
1.5
Apollo Tyres
Buy
153
183
7,770
12,056
12,714
17.2
16.4
23.0
20.3
6.6
7.5
1.2
1.0
17.7
13.6
0.7
0.7
Ceat
Buy
905
1,119
3,661
6,041
6,597
14.1
13.7
99.5
111.9
9.1
8.1
1.8
1.5
19.6
18.5
0.8
0.6
JK Tyres
Neutral
92
-
2,092
7,446
7,669
15.2
14.0
19.6
18.4
4.7
5.0
1.2
1.0
25.2
19.5
0.7
0.6
Swaraj Engines
Neutral
1,115
-
1,385
552
630
14.2
14.7
44.6
54.1
25.0
20.6
5.8
5.3
23.2
25.6
2.4
2.0
Subros
Neutral
94
-
562
1,293
1,527
11.8
11.9
4.2
6.7
22.3
14.0
1.7
1.5
7.7
11.5
0.8
0.6
Indag Rubber
Neutral
182
-
479
283
329
17.0
17.2
13.0
15.4
14.1
11.8
3.1
2.6
21.8
21.6
1.4
1.2
Capital Goods
ACE
Neutral
40
-
398
660
839
4.7
8.2
1.0
3.9
40.3
10.3
1.3
1.1
3.2
11.3
0.8
0.6
BEML
Buy
870
1,157
3,625
3,277
4,006
6.0
8.9
36.2
64.3
24.0
13.5
1.7
1.5
5.7
11.7
1.2
0.9
Bharat Electronics
Accumulate
1,262
1,414
30,280
7,295
8,137
20.0
16.8
56.5
58.7
22.3
21.5
3.3
3.0
42.1
44.6
3.4
2.9
Stock Watch
June 10, 2016
Company Name
Reco
CMP
Target
Mkt Cap
Sales ( Čcr )
OPM(%)
EPS (Č)
PER(x)
P/BV(x)
RoE(%)
EV/Sales(x)
(Č)
Price ( Č)
( Č cr )
FY16E
FY17E
FY16E
FY17E
FY16E
FY17E
FY16E
FY17E
FY16E
FY17E
FY16E
FY17E
FY16E
FY17E
Capital Goods
Voltas
Buy
334
407
11,048
5,857
6,511
7.5
7.9
11.7
12.9
28.5
25.9
4.7
4.1
17.1
16.7
1.9
1.7
BGR Energy
Neutral
117
-
848
3,615
3,181
9.5
9.4
16.7
12.4
7.0
9.5
0.7
0.7
10.0
7.0
0.6
0.8
BHEL
Neutral
121
-
29,665
33,722
35,272
10.8
11.7
10.5
14.2
11.5
8.5
0.9
0.8
7.0
9.0
1.0
0.9
Blue Star
Accumulate
442
495
3,980
3,770
4,351
5.7
6.4
11.4
17.2
38.7
25.8
6.0
5.6
18.4
23.1
1.1
1.0
Crompton Greaves
Neutral
71
-
4,469
13,484
14,687
4.9
6.2
4.5
7.1
15.8
10.0
1.1
1.1
7.2
10.8
0.5
0.4
Greaves Cotton
Neutral
139
-
3,386
1,655
1,755
16.6
16.8
7.4
7.8
18.7
17.8
3.8
3.6
21.1
20.6
2.0
1.9
Inox Wind
Buy
233
286
5,177
4,406
5,605
15.5
15.7
20.4
24.8
11.4
9.4
2.6
1.9
27.9
25.9
1.4
1.1
KEC International
Neutral
139
-
3,574
8,791
9,716
6.1
6.8
5.4
8.2
25.7
17.0
2.6
2.4
10.0
14.0
0.6
0.6
Thermax
Neutral
789
-
9,404
6,413
7,525
7.4
8.5
30.5
39.3
25.9
20.1
4.0
3.5
15.0
17.0
1.4
1.2
VATech Wabag
Neutral
639
-
3,480
2,722
3,336
7.9
8.1
19.5
24.6
32.8
26.0
3.4
3.0
11.1
12.4
1.4
1.1
Cement
ACC
Neutral
1,533
-
28,773
13,151
14,757
16.4
18.3
63.9
83.4
24.0
18.4
3.1
2.8
13.3
16.1
2.0
1.7
Ambuja Cements
Neutral
233
-
36,082
11,564
12,556
19.4
20.7
8.9
10.1
26.1
23.0
3.3
3.1
12.8
13.8
2.8
2.5
HeidelbergCement
Neutral
112
-
2,548
1,772
1,926
13.3
15.4
1.0
3.0
112.5
37.5
2.9
2.6
2.6
7.9
2.0
1.8
India Cements
Neutral
96
-
2,961
4,216
4,840
18.0
19.5
4.0
9.9
24.1
9.7
1.0
0.9
4.0
9.5
1.0
0.8
JK Cement
Neutral
616
-
4,309
3,661
4,742
10.1
15.8
7.5
28.5
82.2
21.6
2.5
2.2
7.5
22.9
1.7
1.2
J K Lakshmi Cement
Neutral
353
-
4,158
2,947
3,616
16.7
19.9
11.5
27.2
30.7
13.0
2.9
2.5
9.8
20.8
1.8
1.5
Mangalam Cements
Neutral
287
-
766
1,053
1,347
10.5
13.3
8.4
26.0
34.2
11.0
1.4
1.3
4.3
12.5
1.1
0.8
Orient Cement
Neutral
168
-
3,450
1,854
2,524
21.2
22.2
7.7
11.1
21.9
15.2
3.1
2.7
13.3
15.7
2.6
1.8
Ramco Cements
Neutral
536
-
12,764
4,036
4,545
20.8
21.3
15.1
18.8
35.5
28.5
4.3
3.9
12.9
14.3
3.7
3.2
Shree Cement^
Neutral
13,492
-
47,001
7,150
8,742
26.7
28.6
228.0
345.5
59.2
39.1
8.7
7.3
15.7
20.3
6.3
5.1
UltraTech Cement
Neutral
3,381
-
92,786
24,669
29,265
18.2
20.6
82.0
120.0
41.2
28.2
4.4
3.9
11.3
14.7
3.8
3.2
Construction
ITNL
Buy
74
93
2,444
7,360
8,682
34.0
32.2
7.0
8.6
10.6
8.6
0.4
0.4
3.2
2.5
3.7
3.5
KNR Constructions
Accumulate
573
603
1,610
937
1,470
14.3
14.0
44.2
38.6
13.0
14.8
2.6
2.2
15.4
15.4
1.8
1.2
Larsen & Toubro
Accumulate
1,492
1,700
139,084
58,870
65,708
8.3
10.3
42.0
53.0
35.5
28.2
2.5
2.2
8.8
11.2
2.6
2.3
Gujarat Pipavav Port
Neutral
159
-
7,708
629
684
51.0
52.2
6.4
5.9
24.9
27.0
3.3
3.0
15.9
12.7
11.9
10.8
MBL Infrastructures
Buy
121
285
503
2,313
2,797
12.2
14.6
19.0
20.0
6.4
6.1
0.7
0.6
11.3
10.6
0.9
0.8
Nagarjuna Const.
Neutral
76
-
4,228
7,892
8,842
8.8
9.1
3.0
5.3
25.4
14.4
1.3
1.2
5.0
8.5
0.8
0.7
PNC Infratech
Neutral
563
-
2,888
1,873
2,288
13.2
13.5
24.0
32.0
23.5
17.6
2.3
2.0
12.1
12.3
1.6
1.4
Simplex Infra
Neutral
271
-
1,340
5,955
6,829
10.3
10.5
16.0
31.0
16.9
8.7
0.9
0.8
5.3
9.9
0.7
0.6
Stock Watch
June 10, 2016
Company Name
Reco
CMP
Target
Mkt Cap
Sales ( Čcr )
OPM(%)
EPS (Č)
PER(x)
P/BV(x)
RoE(%)
EV/Sales(x)
(Č)
Price ( Č)
( Č cr )
FY16E
FY17E
FY16E
FY17E
FY16E
FY17E
FY16E
FY17E
FY16E
FY17E
FY16E
FY17E
FY16E
FY17E
Construction
Power Mech Projects
Neutral
561
-
826
1,539
1,801
12.8
12.7
59.0
72.1
9.5
7.8
1.4
1.2
18.6
16.8
0.5
0.5
Sadbhav Engineering
Neutral
287
-
4,930
3,186
3,598
10.2
10.3
8.0
9.0
35.9
31.9
3.3
2.9
9.4
9.9
1.9
1.7
NBCC
Buy
189
220
11,337
5,838
7,428
6.0
7.9
5.2
8.2
36.3
23.0
1.2
0.9
21.9
28.2
1.7
1.2
MEP Infra
Neutral
38
-
616
1,956
1,876
28.1
30.5
1.3
3.0
29.2
12.6
6.1
4.1
21.2
32.8
1.7
1.7
SIPL
Neutral
97
-
3,411
675
1,042
62.4
64.7
-
-
3.6
4.1
-
-
16.7
11.3
Engineers India
Neutral
193
-
6,503
1,667
1,725
13.5
16.0
9.7
11.4
19.9
16.9
2.3
2.3
11.7
13.4
2.7
2.7
Financials
Allahabad Bank
Neutral
54
-
3,919
8,569
9,392
2.8
2.9
16.3
27.5
3.3
2.0
0.3
0.2
7.6
11.9
-
-
Axis Bank
Neutral
542
-
129,378
26,204
29,738
3.6
3.5
34.5
35.4
15.7
15.3
2.5
2.2
16.8
14.9
-
-
Bank of Baroda
Neutral
149
-
34,320
18,802
21,088
2.0
2.2
(7.4)
13.0
11.5
1.2
0.9
(4.2)
7.3
-
-
Bank of India
Neutral
90
-
8,378
15,972
17,271
1.9
2.0
15.3
33.4
5.9
2.7
0.3
0.2
3.6
7.6
-
-
Canara Bank
Neutral
197
-
10,691
15,441
16,945
2.0
2.1
46.6
70.4
4.2
2.8
0.4
0.3
8.0
11.2
-
-
Dena Bank
Neutral
30
-
2,001
3,440
3,840
2.1
2.3
7.3
10.0
4.1
3.0
0.3
0.3
6.1
7.9
-
-
Dewan Housing Finance Buy
212
270
6,186
1,828
2,225
2.9
3.0
24.9
29.7
8.5
7.2
1.3
1.2
15.1
16.1
-
-
Federal Bank
Neutral
58
-
10,034
3,279
3,787
2.8
2.9
3.9
5.5
14.8
10.6
1.2
1.1
8.4
10.8
-
-
HDFC
Neutral
1,238
-
195,717
10,358
11,852
3.3
3.3
41.1
47.0
30.2
26.3
5.7
5.2
24.7
24.9
-
-
HDFC Bank
Accumulate
1,160
1,262
293,669
38,606
47,696
4.4
4.5
48.8
61.4
23.8
18.9
4.0
3.5
18.7
20.0
-
-
ICICI Bank
Neutral
255
-
148,053
34,279
39,262
3.3
3.3
21.0
24.4
12.1
10.4
2.0
1.7
14.4
14.7
-
-
IDBI Bank
Neutral
68
-
13,907
9,625
10,455
1.8
1.8
8.5
14.2
7.9
4.8
0.5
0.4
5.9
9.3
-
-
Indian Bank
Neutral
106
-
5,086
6,160
6,858
2.5
2.5
24.5
29.8
4.3
3.6
0.3
0.3
7.7
8.6
-
-
LIC Housing Finance
Buy
476
592
24,014
3,179
3,758
2.6
2.6
32.9
40.6
14.5
11.7
2.7
2.3
19.6
20.7
-
-
Oriental Bank
Neutral
91
-
3,135
7,643
8,373
2.4
2.4
37.2
45.4
2.4
2.0
0.2
0.2
8.2
9.4
-
-
Punjab Natl.Bank
Neutral
82
-
16,121
23,122
26,022
2.8
2.8
7.0
21.6
11.7
3.8
0.6
0.5
3.4
10.0
-
-
South Ind.Bank
Neutral
20
-
2,748
1,965
2,185
2.5
2.5
2.5
3.3
8.2
6.2
0.8
0.7
9.5
11.7
-
-
St Bk of India
Neutral
210
-
163,018
79,958
86,061
2.6
2.6
13.4
20.7
15.7
10.2
1.3
1.2
11.5
12.8
-
-
Union Bank
Neutral
121
-
8,328
12,646
14,129
2.3
2.4
31.0
39.1
3.9
3.1
0.4
0.4
9.8
11.4
-
-
Vijaya Bank
Neutral
32
-
3,196
3,536
3,827
1.9
1.9
5.5
6.7
5.8
4.8
0.5
0.4
7.8
8.8
-
-
Yes Bank
Neutral
1,040
-
43,789
7,190
9,011
3.2
3.3
58.2
69.7
17.9
14.9
3.2
2.7
19.2
19.6
-
-
FMCG
Asian Paints
Neutral
1,000
-
95,877
15,534
17,445
17.7
16.8
18.4
19.6
54.4
51.0
19.2
18.1
34.6
35.6
6.0
5.4
Britannia
Neutral
2,760
-
33,111
8,481
9,795
14.0
14.1
65.5
78.3
42.1
35.3
19.9
16.4
38.3
41.2
3.8
3.3
Stock Watch
June 10, 2016
Company Name
Reco
CMP
Target
Mkt Cap
Sales ( Čcr )
OPM(%)
EPS (Č)
PER(x)
P/BV(x)
RoE(%)
EV/Sales(x)
(Č)
Price ( Č)
( Č cr )
FY16E FY17E
FY16E
FY17E
FY16E
FY17E
FY16E
FY17E
FY16E
FY17E
FY16E
FY17E
FY16E
FY17E
FMCG
Colgate
Neutral
855
-
23,252
4,136
4,632
22.5
23.3
22.2
25.3
38.5
33.8
23.4
20.9
68.6
67.5
5.5
4.9
Dabur India
Neutral
303
-
53,346
9,370
10,265
17.6
17.3
7.3
8.1
41.3
37.4
10.7
9.8
31.7
30.6
5.5
5.0
GlaxoSmith Con*
Accumulate
5,687
6,118
23,916
4,519
5,142
19.6
19.8
164.3
191.2
34.6
29.7
9.6
8.2
30.8
29.9
4.7
4.1
Godrej Consumer
Neutral
1,522
-
51,816
9,003
10,335
18.1
18.7
34.1
41.8
44.6
36.4
9.6
8.3
23.9
24.8
5.9
5.2
HUL
Neutral
877
-
189,770
33,299
35,497
17.1
17.1
18.9
20.0
46.4
43.8
40.7
35.4
87.6
80.8
5.5
5.2
ITC
Accumulate
354
380
285,153
36,837
39,726
38.8
38.7
12.2
13.5
29.0
26.3
8.1
7.1
27.8
26.9
7.2
6.7
Marico
Neutral
251
-
32,364
6,151
6,966
17.2
17.3
5.4
6.4
46.5
39.2
14.6
11.5
33.2
32.4
5.1
4.5
Nestle*
Neutral
6,444
-
62,125
9,393
10,507
22.2
22.3
106.8
121.8
60.3
52.9
21.2
19.1
34.8
36.7
6.4
5.7
Tata Global
Accumulate
125
137
7,886
8,635
9,072
9.8
9.9
5.8
7.2
21.5
17.4
1.9
1.8
6.8
7.4
1.0
0.9
Procter & Gamble
Buy
6,240
7,369
20,256
2,588
2,939
23.3
23.2
130.2
146.2
47.9
42.7
95.6
91.6
27.6
25.3
7.4
6.4
Hygiene
IT
HCL Tech^
Buy
753
1,000
106,257
37,061
30,781
21.5
20.5
51.4
40.0
14.7
18.8
3.8
2.8
20.1
20.3
2.6
2.8
Infosys
Buy
1,185
1,374
272,291
62,441
70,558
27.5
27.5
59.0
65.3
20.1
18.2
4.0
3.7
22.2
22.4
3.8
3.3
TCS
Buy
2,578
3,004
507,878
108,646
122,770
28.3
28.3
123.7
141.0
20.8
18.3
6.9
6.3
33.1
34.6
4.2
3.7
Tech Mahindra
Buy
535
700
51,898
26,494
30,347
16.3
17.0
32.2
37.5
16.6
14.3
3.6
3.1
21.7
21.8
1.7
1.4
Wipro
Buy
545
680
134,629
50,808
56,189
23.7
23.8
37.3
40.7
14.6
13.4
2.8
2.5
19.2
17.7
2.1
1.8
Media
D B Corp
Neutral
373
-
6,853
2,025
2,187
27.4
27.4
17.4
18.9
21.4
19.8
4.8
4.4
22.9
23.7
3.4
3.1
HT Media
Neutral
80
-
1,856
2,495
2,673
12.9
13.2
6.8
7.2
11.7
11.1
0.9
0.9
7.5
7.8
0.3
0.3
Jagran Prakashan
Buy
173
205
5,641
2,107
2,355
33.5
28.0
10.1
10.8
17.2
16.0
4.0
3.5
23.3
21.7
2.8
2.4
Sun TV Network
Neutral
359
-
14,138
2,510
2,763
71.8
71.5
21.9
24.8
16.4
14.5
3.9
3.5
22.8
24.3
5.1
4.6
Hindustan Media
Neutral
275
-
2,019
914
1,016
21.7
21.5
21.9
23.3
12.6
11.8
2.3
1.9
18.0
16.2
1.6
1.4
Ventures
Metals & Mining
Coal India
Buy
313
380
197,923
76,167
84,130
19.9
22.3
22.4
25.8
14.0
12.1
5.0
4.9
35.5
41.0
1.9
1.7
Hind. Zinc
Neutral
177
-
74,725
14,641
14,026
50.4
50.4
17.7
16.0
10.0
11.1
1.5
1.4
16.2
13.2
2.7
2.6
Hindalco
Neutral
111
-
22,901
104,356
111,186
8.7
9.5
6.7
11.1
16.5
10.0
0.6
0.6
3.5
5.9
0.8
0.7
JSW Steel
Neutral
1,416
-
34,234
42,308
45,147
16.4
20.7
(10.3)
49.5
28.6
1.6
1.5
(1.0)
5.6
1.9
1.7
NMDC
Neutral
91
-
36,099
8,237
10,893
46.6
44.5
10.0
11.7
9.2
7.8
1.0
0.9
12.5
13.0
4.2
3.2
SAIL
Neutral
45
-
18,523
45,915
53,954
7.2
10.5
1.5
4.4
29.8
10.3
0.4
0.4
2.3
4.1
1.0
0.9
Vedanta
Neutral
113
-
33,442
71,445
81,910
26.2
26.3
12.9
19.2
8.8
5.9
0.6
0.5
7.2
8.9
0.9
0.7
Tata Steel
Neutral
342
-
33,220
126,760
137,307
8.9
11.3
6.4
23.1
53.8
14.8
1.1
1.0
2.0
7.1
0.8
0.8
Oil & Gas
Cairn India
Neutral
146
-
27,448
11,323
12,490
49.4
51.0
20.7
20.7
7.1
7.1
0.5
0.4
6.4
6.1
1.5
0.8
Stock Watch
June 10, 2016
Company Name
Reco
CMP
Target
Mkt Cap
Sales ( Čcr )
OPM(%)
EPS (Č)
PER(x)
P/BV(x)
RoE(%)
EV/Sales(x)
(Č)
Price ( Č)
( Č cr )
FY16E FY17E
FY16E
FY17E
FY16E
FY17E
FY16E
FY17E
FY16E
FY17E
FY16E
FY17E
FY16E
FY17E
Oil & Gas
GAIL
Neutral
375
-
47,606
64,856
70,933
9.1
9.6
24.0
28.9
15.7
13.0
1.3
1.3
8.8
9.6
0.9
0.8
ONGC
Neutral
220
-
188,221
154,564
145,998
36.8
37.4
20.8
22.6
10.6
9.7
1.0
0.9
10.1
9.7
1.4
1.6
Petronet LNG
Neutral
274
-
20,550
29,691
31,188
5.8
6.2
12.8
13.4
21.4
20.4
3.2
2.9
15.8
14.8
0.8
0.7
Indian Oil Corp
Accumulate
415
455
100,857
359,607
402,760
5.9
6.1
42.5
48.7
9.8
8.5
1.3
1.2
14.1
14.4
0.4
0.3
Reliance Industries
Buy
971
1,150
314,987
304,775
344,392
12.6
13.4
91.3
102.6
10.7
9.5
1.2
1.1
11.8
12.0
1.0
0.8
Pharmaceuticals
Alembic Pharma
Neutral
557
-
10,494
3,274
3,802
26.9
19.4
35.0
28.7
15.9
19.4
7.1
5.3
55.6
31.2
3.2
2.7
Aurobindo Pharma
Accumulate
752
856
44,008
14,923
17,162
22.0
23.0
35.7
42.8
21.1
17.6
6.2
4.7
34.0
30.2
3.3
2.8
Aventis*
Accumulate
4,209
4,738
9,694
2,049
2,375
15.4
17.3
115.4
153.5
36.5
27.4
6.0
4.7
19.3
25.8
4.5
3.8
Cadila Healthcare
Buy
319
400
32,611
9,469
11,246
21.2
22.0
14.9
17.1
21.4
18.6
6.1
4.8
28.8
26.6
3.4
2.8
Cipla
Neutral
480
-
38,554
13,372
15,378
16.4
17.4
19.6
18.8
24.5
25.5
3.2
2.8
13.1
13.8
2.9
2.8
Dr Reddy's
Accumulate
3,071
3,476
52,381
15,471
17,479
24.6
24.6
138.2
152.4
22.2
20.2
4.1
3.5
19.7
18.7
3.3
3.0
Dishman Pharma
Neutral
151
-
2,431
1,733
1,906
21.5
21.5
10.1
10.0
14.9
15.1
1.8
1.6
10.5
11.2
1.9
1.6
GSK Pharma*
Neutral
3,491
-
29,572
2,870
3,158
20.0
22.1
59.5
68.3
58.7
51.1
17.3
17.8
28.5
34.3
9.8
9.0
Indoco Remedies
Neutral
282
-
2,599
1,033
1,199
15.9
18.2
9.4
13.6
30.0
20.7
4.5
3.8
15.7
19.7
2.6
2.3
Ipca labs
Buy
445
750
5,620
3,363
3,909
12.9
18.6
13.4
28.0
33.2
15.9
2.4
2.1
7.4
14.0
2.0
1.7
Lupin
Buy
1,428
1,809
64,366
13,702
15,912
23.7
26.4
50.5
58.1
28.3
24.6
5.8
4.8
22.9
21.4
5.2
4.1
Sun Pharma
Buy
743
950
178,721
28,163
32,610
25.8
30.7
17.4
26.9
42.7
27.6
4.1
3.5
13.0
16.6
5.8
4.8
Power
Tata Power
Neutral
76
-
20,461
35,923
37,402
22.6
22.8
4.1
5.2
18.7
14.7
1.4
1.3
7.5
9.3
1.5
1.4
NTPC
Neutral
150
-
124,012
87,271
99,297
23.5
23.5
11.8
13.3
12.8
11.3
1.4
1.3
11.5
12.2
2.4
2.2
Power Grid
Accumulate
153
170
79,991
20,702
23,361
86.7
86.4
12.1
13.2
12.7
11.6
1.9
1.7
15.6
15.1
8.8
8.2
Real Estate
MLIFE
Buy
456
554
1,871
826
1,011
20.1
21.9
22.7
30.7
20.1
14.9
1.2
1.1
6.0
7.4
4.2
3.1
Telecom
Bharti Airtel
Neutral
351
-
140,269
101,748
109,191
32.1
31.7
12.0
12.5
29.2
28.1
2.0
1.9
6.9
6.7
2.0
1.8
Idea Cellular
Neutral
105
-
37,753
34,282
36,941
32.0
31.5
5.9
6.2
17.8
16.9
1.6
1.5
9.9
9.3
1.7
1.6
zOthers
Abbott India
Neutral
4,469
-
9,497
2,715
3,153
14.5
14.1
134.3
152.2
33.3
29.4
8.3
6.8
27.4
25.6
3.2
2.7
Bajaj Electricals
Buy
229
268
2,317
4,612
5,351
5.6
5.7
23.4
18.0
9.8
12.8
3.0
2.7
12.5
14.4
0.5
0.4
Finolex Cables
Neutral
358
-
5,478
2,520
2,883
12.2
12.0
12.7
14.2
28.3
25.2
3.9
3.4
13.6
13.5
1.9
1.6
Goodyear India*
Accumulate
515
582
1,187
1,800
1,600
11.7
11.5
58.7
52.9
8.8
9.7
2.0
1.7
24.6
18.7
0.4
0.4
Hitachi
Neutral
1,277
-
3,472
1,779
2,081
7.8
8.8
21.8
33.4
58.6
38.2
9.5
7.7
17.4
22.1
2.0
1.7
Jyothy Laboratories
Neutral
288
-
5,220
1,620
1,847
11.5
11.5
7.3
8.5
39.5
34.0
5.1
4.7
13.3
14.4
3.1
2.6
Stock Watch
June 10, 2016
Company Name
Reco
CMP
Target
Mkt Cap
Sales ( Čcr )
OPM(%)
EPS (Č)
PER(x)
P/BV(x)
RoE(%)
EV/Sales(x)
(Č)
Price ( Č)
( Č cr )
FY16E
FY17E
FY16E
FY17E
FY16E
FY17E
FY16E
FY17E
FY16E
FY17E
FY16E
FY17E
FY16E
FY17E
zOthers
MRF
Buy
32,586
45,575
13,820
20,316
14,488
21.4
21.1
5,488.0
3,798.0
5.9
8.6
2.0
1.6
41.1
21.2
0.6
0.8
Page Industries
Neutral
13,897
-
15,500
1,929
2,450
19.8
20.1
229.9
299.0
60.5
46.5
26.7
18.5
52.1
47.1
8.1
6.3
Relaxo Footwears
Neutral
464
-
5,575
1,767
2,152
12.3
12.5
19.3
25.1
24.1
18.5
5.9
4.6
27.7
27.8
3.2
2.6
Siyaram Silk Mills
Buy
1,054
1,347
988
1,619
1,799
11.6
11.6
93.5
104.9
11.3
10.0
1.9
1.7
17.1
16.4
0.8
0.8
Styrolution ABS India* Neutral
633
-
1,113
1,271
1,440
8.6
9.2
32.0
41.1
19.8
15.4
2.0
1.8
10.7
12.4
0.8
0.7
TVS Srichakra
Buy
2,329
2,932
1,783
2,035
2,252
15.9
15.3
248.6
268.1
9.4
8.7
4.1
2.9
43.6
33.9
0.9
0.8
HSIL
Buy
266
310
1,920
2,123
2,384
16.1
16.5
15.0
18.9
17.7
14.1
1.4
1.3
8.0
9.4
1.2
1.1
Kirloskar Engines India
Neutral
256
-
3,699
2,403
2,554
8.6
9.9
9.2
10.5
27.8
24.4
2.7
2.6
9.7
10.7
1.2
1.1
Ltd
M M Forgings
Buy
440
546
531
511
615
21.7
21.6
43.1
55.8
10.2
7.9
1.9
1.5
19.9
21.2
1.2
0.9
Banco Products (India) Neutral
137
-
982
1,208
1,353
11.0
12.3
10.8
14.5
12.7
9.5
1.5
1.3
11.9
14.5
0.8
0.7
Competent Automobiles Neutral
139
-
86
1,040
1,137
3.2
3.1
25.7
28.0
5.4
5.0
0.8
0.7
15.0
14.3
0.1
0.1
Nilkamal
Neutral
1,194
-
1,781
1,871
2,031
10.7
10.5
63.2
69.8
18.9
17.1
3.1
2.6
17.6
16.6
1.0
0.9
Visaka Industries
Neutral
156
-
248
1,020
1,120
8.7
9.1
13.9
20.1
11.2
7.8
0.7
0.7
6.4
8.7
0.5
0.4
Transport Corporation of
Neutral
302
-
2,310
2,830
3,350
8.8
9.0
14.4
18.3
21.0
16.5
3.2
2.8
15.4
17.1
0.9
0.8
India
Elecon Engineering
Neutral
62
-
677
1,359
1,482
10.3
13.7
0.8
3.9
77.4
16.0
1.3
1.2
1.6
7.8
0.9
0.8
Surya Roshni
Buy
161
201
704
2,992
3,223
8.1
8.4
14.7
18.3
10.9
8.8
1.0
0.9
9.7
11.0
0.5
0.5
MT Educare
Neutral
174
-
694
286
366
18.3
17.7
7.7
9.4
22.6
18.6
4.8
4.2
20.2
21.1
2.3
1.8
Radico Khaitan
Buy
91
125
1,211
1,543
1,659
12.6
13.0
5.8
6.3
15.8
14.4
1.3
1.2
8.5
8.6
1.3
1.2
Garware Wall Ropes
Buy
352
460
770
828
898
11.2
10.3
28.3
29.0
12.5
12.1
2.1
1.8
16.8
14.9
0.9
0.8
Wonderla Holidays
Neutral
395
-
2,231
206
308
44.0
43.6
9.0
12.9
43.9
30.6
6.0
5.4
13.7
17.8
10.7
7.1
Linc Pen & Plastics
Accumulate
209
235
310
344
382
9.1
9.1
12.4
13.1
16.9
16.0
3.1
2.7
18.0
16.7
1.0
0.9
The Byke Hospitality
Neutral
168
-
673
222
287
20.5
20.5
5.6
7.6
29.8
22.2
5.6
4.6
18.9
20.8
3.1
2.4
Interglobe Aviation
Neutral
1,005
-
36,201
17,022
21,122
20.7
14.5
63.9
53.7
15.7
18.7
23.6
19.3
149.9
103.2
2.2
1.7
Coffee Day Enterprises
Neutral
257
-
5,291
2,692
2,964
17.0
18.6
-
4.7
-
54.2
3.1
3.0
0.2
5.5
2.4
2.2
Ltd
Navneet Education
Neutral
88
-
2,101
998
1,062
24.1
24.0
5.8
6.1
15.3
14.5
3.4
3.0
22.0
20.6
2.2
2.1
Navkar Corporation
Buy
196
265
2,795
347
408
43.2
42.9
6.7
6.8
29.4
28.9
2.2
2.0
7.3
6.9
8.5
7.8
UFO Moviez
Neutral
534
-
1,474
558
619
32.0
33.2
22.5
30.0
23.7
17.8
2.9
2.5
12.0
13.8
2.5
2.1
VRL Logistics
Neutral
307
-
2,798
1,725
1,902
16.5
16.7
12.2
14.6
25.2
21.1
5.2
4.6
20.8
21.9
1.8
1.6
Team Lease Serv.
Neutral
910
-
1,555
2,565
3,229
1.3
1.5
15.2
22.8
59.9
40.0
4.8
4.3
8.0
10.7
0.5
0.4
Stock Watch
June 10, 2016
Company Name
Reco
CMP
Target Mkt Cap
Sales ( Čcr )
OPM(%)
EPS (Č)
PER(x)
P/BV(x)
RoE(%)
EV/Sales(x)
(Č)
Price ( Č)
( Č cr )
FY16E FY17E FY16E FY17E FY16E FY17E FY16E FY17E FY16E FY17E FY16E FY17E FY16E FY17E
zOthers
S H Kelkar & Co.
Neutral
221
-
3,196
928
1,036
15.3
15.1
4.9
6.1
44.8
36.2
4.2
3.9
9.4
10.7
3.3
3.0
Quick Heal
Neutral
243
-
1,700
339
408
27.8
27.3
7.1
7.7
34.3
31.4
2.9
2.9
8.5
9.3
3.9
3.3
Narayana Hrudaya
Neutral
314
-
6,407
1,603
1,873
10.9
11.5
1.0
2.6
329.1
118.5
7.9
7.3
2.4
6.1
4.1
3.5
Manpasand Bever.
Neutral
554
-
2,775
540
836
19.9
19.6
10.2
16.9
54.1
32.8
4.4
3.9
8.1
12.0
4.8
3.1
Source: Company, Angel Research; Note: *December year end; #September year end; &October year end; Price as on June 09, 2016
Market Outlook
June 10, 2016
Research Team Tel: 022 - 39357800
DISCLAIMER
Angel Broking Private Limited (hereinafter referred to as “Angel”) is a registered Member of National Stock Exchange of India Limited,
Bombay Stock Exchange Limited and Metropolitian Stock Exchange of India Limited. It is also registered as a Depository Participant with
CDSL and Portfolio Manager with SEBI. It also has registration with AMFI as a Mutual Fund Distributor. Angel Broking Private Limited is a
registered entity with SEBI for Research Analyst in terms of SEBI (Research Analyst) Regulations, 2014 vide registration number
INH000000164. Angel or its associates has not been debarred/ suspended by SEBI or any other regulatory authority for accessing
/dealing in securities Market. Angel or its associates including its relatives/analyst do not hold any financial interest/beneficial ownership
of more than 1% in the company covered by Analyst. Angel or its associates/analyst has not received any compensation / managed or co
-managed public offering of securities of the company covered by Analyst during the past twelve months. Angel/analyst has not served as
an officer, director or employee of company covered by Analyst and has not been engaged in market making activity of the company
covered by Analyst.
This document is solely for the personal information of the recipient, and must not be singularly used as the basis of any investment
decision. Nothing in this document should be construed as investment or financial advice. Each recipient of this document should make
such investigations as they deem necessary to arrive at an independent evaluation of an investment in the securities of the companies
referred to in this document (including the merits and risks involved), and should consult their own advisors to determine the merits and
risks of such an investment.
Reports based on technical and derivative analysis center on studying charts of a stock's price movement, outstanding positions and
trading volume, as opposed to focusing on a company's fundamentals and, as such, may not match with a report on a company's
fundamentals.
The information in this document has been printed on the basis of publicly available information, internal data and other reliable sources
believed to be true, but we do not represent that it is accurate or complete and it should not be relied on as such, as this document is for
general guidance only. Angel Broking Pvt. Limited or any of its affiliates/ group companies shall not be in any way responsible for any
loss or damage that may arise to any person from any inadvertent error in the information contained in this report. Angel Broking Pvt.
Limited has not independently verified all the information contained within this document. Accordingly, we cannot testify, nor make any
representation or warranty, express or implied, to the accuracy, contents or data contained within this document. While Angel Broking
Pvt. Limited endeavors to update on a reasonable basis the information discussed in this material, there may be regulatory, compliance,
or other reasons that prevent us from doing so.
This document is being supplied to you solely for your information, and its contents, information or data may not be reproduced,
redistributed or passed on, directly or indirectly.
Neither Angel Broking Pvt. Limited, nor its directors, employees or affiliates shall be liable for any loss or damage that may arise from or
in connection with the use of this information.
Note: Please refer to the important ‘Stock Holding Disclosure' report on the Angel website (Research Section). Also, please refer to the
latest update on respective stocks for the disclosure status in respect of those stocks. Angel Broking Pvt. Limited and its affiliates may have
investment positions in the stocks recommended in this report.