Market Outlook
January 1, 2016
Market Cues
Domestic Indices
Chg (%)
(Pts)
(Close)
Indian markets are expected to open on a negative note tracking the SGX Nifty.
BSE Sensex
0.6
158
26,118
U.S. markets ended in red partly in reaction to the release of some disappointing
Nifty
0.6
50
7,946
U.S. economic data. The major averages turned in a mixed performance for the
Mid Cap
0.4
39
11,143
year, as the Nasdaq surged up by 5.7 percent but the Dow tumbled by 2.2 percent
Small Cap
0.5
58
11,837
and the S&P 500 slid by 0.7 percent
Bankex
(0.1)
(18)
19,329
The majority of the European markets that were open for business Thursday finished
in the red. Markets will be closed Friday for the New Year's Day holiday. Trading
Global Indices
Chg (%)
(Pts)
(Close)
activity was relatively light due to the holiday and the number of closures and early
Dow Jones
(1.0)
(179)
17,425
closes.
Nasdaq
(1.2)
(58)
5,007
Indian shares closed in positive on the last trading day of calendar year 2015
FTSE
(0.5)
(32)
6,242
despite mixed global cues. Stocks moved in a narrow range in early trade before
Nikkei
0.3
51
19,034
gaining some momentum in the afternoon. However, Nifty declined by 3.1 percent
for the calendar year 2015.
Hang Seng
0.1
32
21,914
Shanghai Com
(0.9)
(34)
3,539
News & Result Analysis
RasGas halves gas price under reworked term with Petronet
Detailed analysis on Pg2
Advances / Declines
BSE
NSE
Advances
1,456
880
Investor’s Ready Reckoner
Declines
1,201
660
Key Domestic & Global Indicators
Unchanged
267
65
Stock Watch: Latest investment recommendations on 150+ stocks
Refer P4 onwards
Volumes (` Cr)
BSE
2,746
Top Picks
CMP
Target
Upside
NSE
19,475
Company
Sector
Rating
(`)
(`)
(%)
Axis Bank
Financials
Buy
450
630
40.1
Net Inflows (` Cr)
Net
Mtd
Ytd
HCL Tech
IT
Buy
855
1,132
32.4
FII
(18)
(899)
17,251
ICICI Bank
Financials
Buy
261
354
35.4
MFs
233
4,319
68,910
Ashok Leyland
Automobiles
Buy
88
111
26.1
Larsen & Toubro
Construction
Buy
1,276
1,646
29.0
More Top Picks on Pg3
Top Gainers
Price (`)
Chg (%)
Pmcfin
1
10.0
Key Upcoming Events
Previous
Consensus
Kscl
351
10.0
Date
Region
Event Description
Reading
Expectations
Jetairways
702
6.8
Jan 1
China
PMI Manufacturing
49.6
49.8
Hdil
78
6.5
Jan 8
India
Imports YoY% - Dec (% change)
(30.30)
-
Sjvn
32
6.4
Jan 8
India
Exports YoY% - Dec (% change)
(24.43)
-
Jan 8
US
Change in Nonfarm payrolls (in thousands)
211.00
200.00
Top Losers
Price (`)
Chg (%)
Cadilahc
328
(14.9)
Oil
379
(3.6)
Network18
59
(3.2)
Kailash
2
(2.9)
Carerating
1,318
(2.6)
As on December 31, 2015
Market Outlook
January 1, 2016
RasGas halves gas price under reworked term with Petronet
Petronet LNG has reworked its long-term gas deal with Qatar's RasGas that will
halve the import price and waive the penalty of `12,000 crore for lifting lower
than the contracted amount, a sign of the changing global commodity market and
the related shift of power to the gas consumers.
The biggest Indian gas importer, Petronet had been forced to buy one of the most
expensive liquefied natural gas (LNG) in the world this year due to a 25-year
contract that didn't quickly reflect the global price crash. The spot LNG prices have
fallen to $6.7 per unit but Petronet had to purchase LNG at $12-13 per unit under
the contract.
This price will fall to $6-7 per unit from January under a reworked pricing formula,
following the agreement between the two companies after negotiations that lasted
several months and involved multiple interventions from Prime Minister Narendra
Modi, Pradhan and the head of the state of Qatar.
The company told that it took 51 meetings for the two companies to agree on a
deal that was clinched on November 10, adding that the fine print of the
agreement got settled in the following weeks.
A supply glut in the gas market and the bleak prospects for suppliers helped bring
RasGas to the negotiating table with the Indian firm that absorbs nearly onetenth
of the Qatari firm's supplies.
Global LNG output is expected to rise two-and-a half times to 500 billion cubic
meters (bcm) by 2020 as supplies increase, mainly from the United States and
Australia, putting further pressure on prices.
Economic and Political News
Petrol price down by 63 paise/litre, diesel by `1.06 a litre
Nov core sector data weak; fiscal deficit at 87% of estimate
CNG to be Sold at Discount at Odd Hours in Delhi
FM to Begin Pre-Budget Consultations From Jan 4
Corporate News
No data integrity issue at Moraiya facility: Cadila Health
Tatas, M&M may participate in Rs 12,700-crore Army fleet upgrade project
Videocon fully redeems FCCBs of $194 million
Thyrocare files draft IPO papers
Market Outlook
January 1, 2016
Top Picks ★★★★★
Large Cap
Market Cap
CMP
Target
Upside
Company
Rationale
(` Cr)
(`)
(`)
(%)
To outpace battery industry growth due to better technological
Amara Raja Batteries
14,718
862
1,040
20.7
products leading to market share gains in both the automotive
OEM and replacement segments.
Earnings to grow strongly given the MHCV cyclical upturn.
Ashok Leyland
25,044
88
111
26.1
Focus on exports and LCV's provides additional growth
avenue.
Healthy pace of branch expansion, backed by distribution
Axis Bank
1,06,926
450
630
40.1
network, will be the driving force for the bank’s retail business
and overall earnings.
The stock is trading at attractive valuations and is factoring all
HCL Tech
1,20,543
855
1,132
32.4
the bad news.
Strong visibility for a robust 20% earnings trajectory, coupled
HDFC Bank
2,73,404
1,083
1,262
16.6
with high quality of earnings on account of high quality retail
business and strategic focus on highly rated corporates.
Due to its robust franchise and capital adequacy position, the
bank is well positioned to grow by at least a few percentage
ICICI Bank
1,51,958
261
354
35.4
points higher than the average industry growth rate from a
structural point of view.
Back on the growth trend, expect a long term growth of 14%
Infosys
2,53,709
1,105
1,306
18.2
to be a US$20bn in FY2020.
Well positioned to benefit from such expected gradual
recovery in the overall domestic capex cycle, given its presence
Larsen & Toubro
1,18,790
1,276
1,646
29.0
across various infrastructure segments, its execution
capabilities, and its strong balance sheet.
LICHF continues to grow its retail loan book at a healthy pace
with improvement in asset quality. We expect the company to
LIC Housing Finance
25,667
509
571
12.3
post a healthy loan book which is likely to reflect in a strong
earnings growth.
Source: Company, Angel Research
Mid Cap
Market Cap
CMP
Target
Upside
Company
Rationale
(` Cr)
(`)
(`)
(%)
Favourable outlook for the AC industry to augur well for
Cooling products business which is out pacing the market
Blue Star
3,538
393
429
9.1
growth. EMPPAC division's profitability to improve once
operating environment turns around.
Change in business focus towards high-margin chronic &
Ipca labs
9,378
743
900
21.1
lifestyle segments and increasing penetration in Europe and
US
Economic recovery to have favourable impact on advertising &
circulation revenue growth. Further, the acquisition of a radio
Jagran Prakashan
5,203
159
169
6.2
business (Radio City) would also boost the company's revenue
growth.
Earnings boost on back of stable material prices and
Radico Khaitan
1,590
120
156
30.5
favourable pricing environment. Valuation discount to peers
provides additional comfort
Strong brands and distribution network would boost growth
Siyaram Silk Mills
1,139
1,215
1,354
11.4
going ahead. Stock currently trades at an inexpensive
valuation.
Structural shift in the Lighting industry towards LED lighting will
Surya Roshni
623
142
183
28.7
drive growth.
Source: Company, Angel Research
Market Outlook
January 01, 2016
Key Upcoming Events
Global economic events release calendar
Date
Time
Country
Event Description
Unit
Period
Bloomberg Data
Last Reported Estimated
Jan 1, 2016
6:30AM
China
PMI Manufacturing
Value
Dec
49.70
49.80
Jan 4, 2016
3:00PM
UK
PMI Manufacturing
Value
Dec
52.70
52.80
2:25PM
Germany
PMI Manufacturing
Value
Dec F
53.00
53.00
Jan 5, 2016
2:25PM
Germany
Unemployment change (000's)
Thousands
Dec
(13.00)
(8.00)
Jan 6, 2016
2:25PM
Germany
PMI Services
Value
Dec F
55.40
55.40
Jan 7, 2016
3:30PM
Euro Zone
Euro-Zone Consumer Confidence
Value
Dec F
(5.70)
(5.70)
Jan 8, 2016
India
Imports YoY%
% Change
Dec
(30.30)
--
India
Exports YoY%
% Change
Dec
(24.43)
--
China
Exports YoY%
% Change
Dec
(6.80)
(6.00)
7:00PM
US
Change in Nonfarm payrolls
Thousands
Dec
211.00
200.00
7:00PM
US
Unnemployment rate
%
Dec
5.00
5.00
Jan 9, 2016
7:00AM
China
Consumer Price Index (YoY)
% Change
Dec
1.50
1.70
Jan 12, 2016
5:30PM
India
Industrial Production YoY
% Change
Nov
9.80
--
3:00PM
UK
Industrial Production (YoY)
% Change
Nov
1.70
--
Jan 14, 2016
12:00PM
India
Monthly Wholesale Prices YoY%
% Change
Dec
(1.99)
--
5:30PM
UK
BOE Announces rates
% Ratio
Jan 14
0.50
0.50
Jan 15, 2016
7:45PM
US
Industrial Production
%
Dec
(0.56)
(0.05)
US
Producer Price Index (mom)
% Change
Dec
0.10
--
Jan 19, 2016
3:00PM
UK
CPI (YoY)
% Change
Dec
0.10
--
7:30AM
China
Industrial Production (YoY)
% Change
Dec
6.20
--
7:30AM
China
Real GDP (YoY)
% Change
4Q
6.90
--
Jan 20, 2016
7:00PM
US
Housing Starts
Thousands
Dec
1,173.00
--
7:00PM
US
Building permits
Thousands
Dec
1,282.00
--
3:00PM
UK
Jobless claims change
% Change
Dec
3.90
--
7:00PM
US
Consumer price index (mom)
% Change
Dec
--
--
Jan 21, 2016
3:30PM
Euro Zone
Euro-Zone CPI (YoY)
%
Dec F
0.20
--
6:15PM
Euro Zone
ECB announces interest rates
%
Jan 21
0.05
--
Jan 22, 2016
8:30PM
US
Existing home sales
Million
Dec
4.76
--
Jan 26, 2016
8:30PM
US
Consumer Confidence
S.A./ 1985=100
Jan
96.50
--
Jan 27, 2016
8:30PM
US
New home sales
Thousands
Dec
490.00
--
Jan 28, 2016
3:00PM
UK
GDP (YoY)
% Change
4Q A
2.10
--
12:30AM
US
FOMC rate decision
%
Jan 27
0.50
0.50
Jan 29, 2016
7:00PM
US
GDP Qoq (Annualised)
% Change
4Q A
2.00
--
Source: Bloomberg, Angel Research
Market Outlook
January 1, 2016
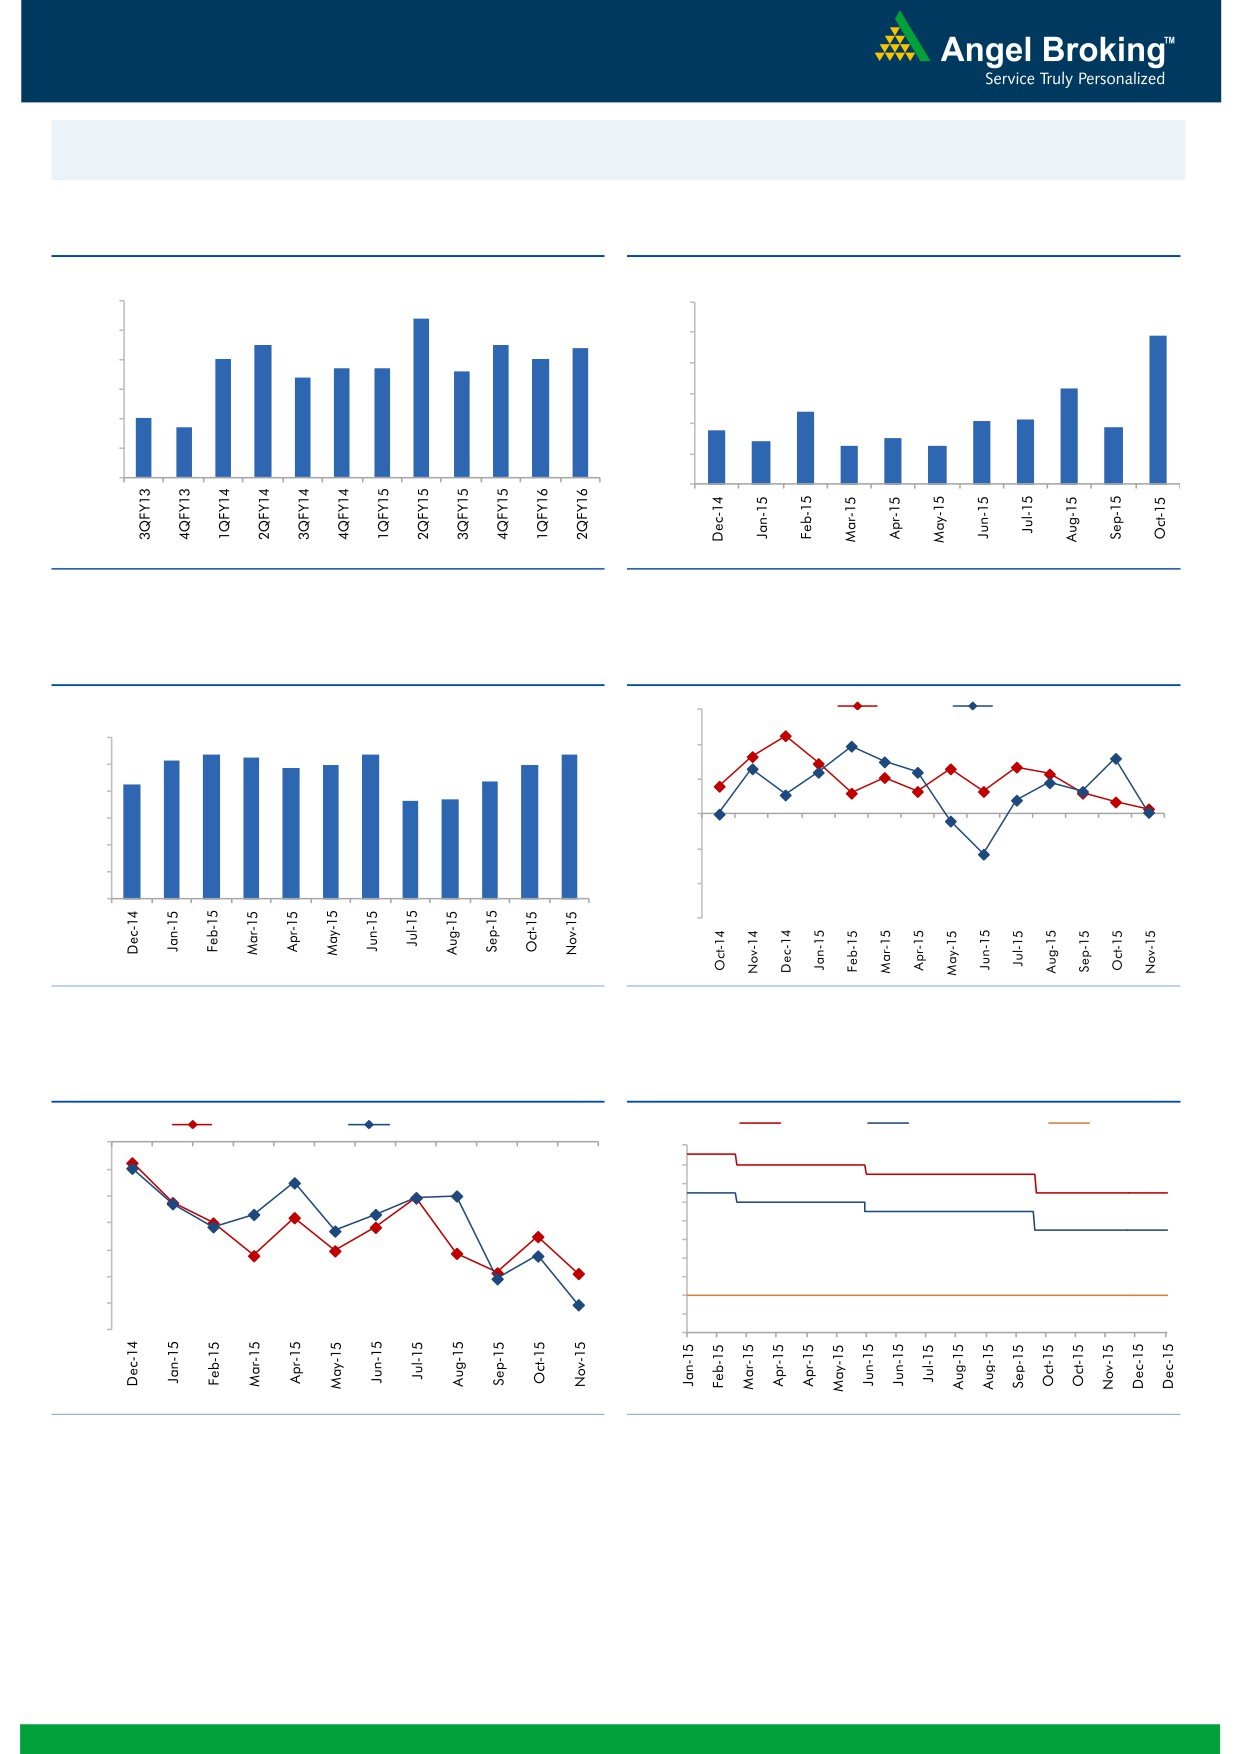
Macro watch
Exhibit 1: Quarterly GDP trends
Exhibit 2: IIP trends
(%)
(%)
9.0
8.4
12.0
9.8
8.0
7.5
7.5
7.4
10.0
7.0
7.0
6.7
6.7
6.6
7.0
6.4
8.0
6.3
6.0
6.0
4.8
5.0
4.2
4.3
4.7
3.6
3.8
5.0
4.0
3.0
2.8
2.5
2.5
4.0
2.0
3.0
-
Source: CSO, Angel Research
Source: MOSPI, Angel Research
Exhibit 3: Monthly CPI inflation trends
Exhibit 4: Manufacturing and services PMI
(%)
56.0
Mfg. PMI
Services PMI
6.0
5.4
5.3
5.4
5.4
5.2
5.0
5.0
54.0
4.9
5.0
4.3
4.4
3.7
3.7
52.0
4.0
3.0
50.0
2.0
48.0
1.0
46.0
-
44.0
Source: MOSPI, Angel Research
Source: Market, Angel Research; Note: Level above 50 indicates expansion
Exhibit 5: Exports and imports growth trends
Exhibit 6: Key policy rates
(%)
Exports yoy growth
Imports yoy growth
(%)
Repo rate
Reverse Repo rate
CRR
0.0
8.00
(5.0)
7.50
7.00
(10.0)
6.50
(15.0)
6.00
5.50
(20.0)
5.00
(25.0)
4.50
4.00
(30.0)
3.50
(35.0)
3.00
Source: Bloomberg, Angel Research
Source: RBI, Angel Research
Market Outlook
January 1, 2016
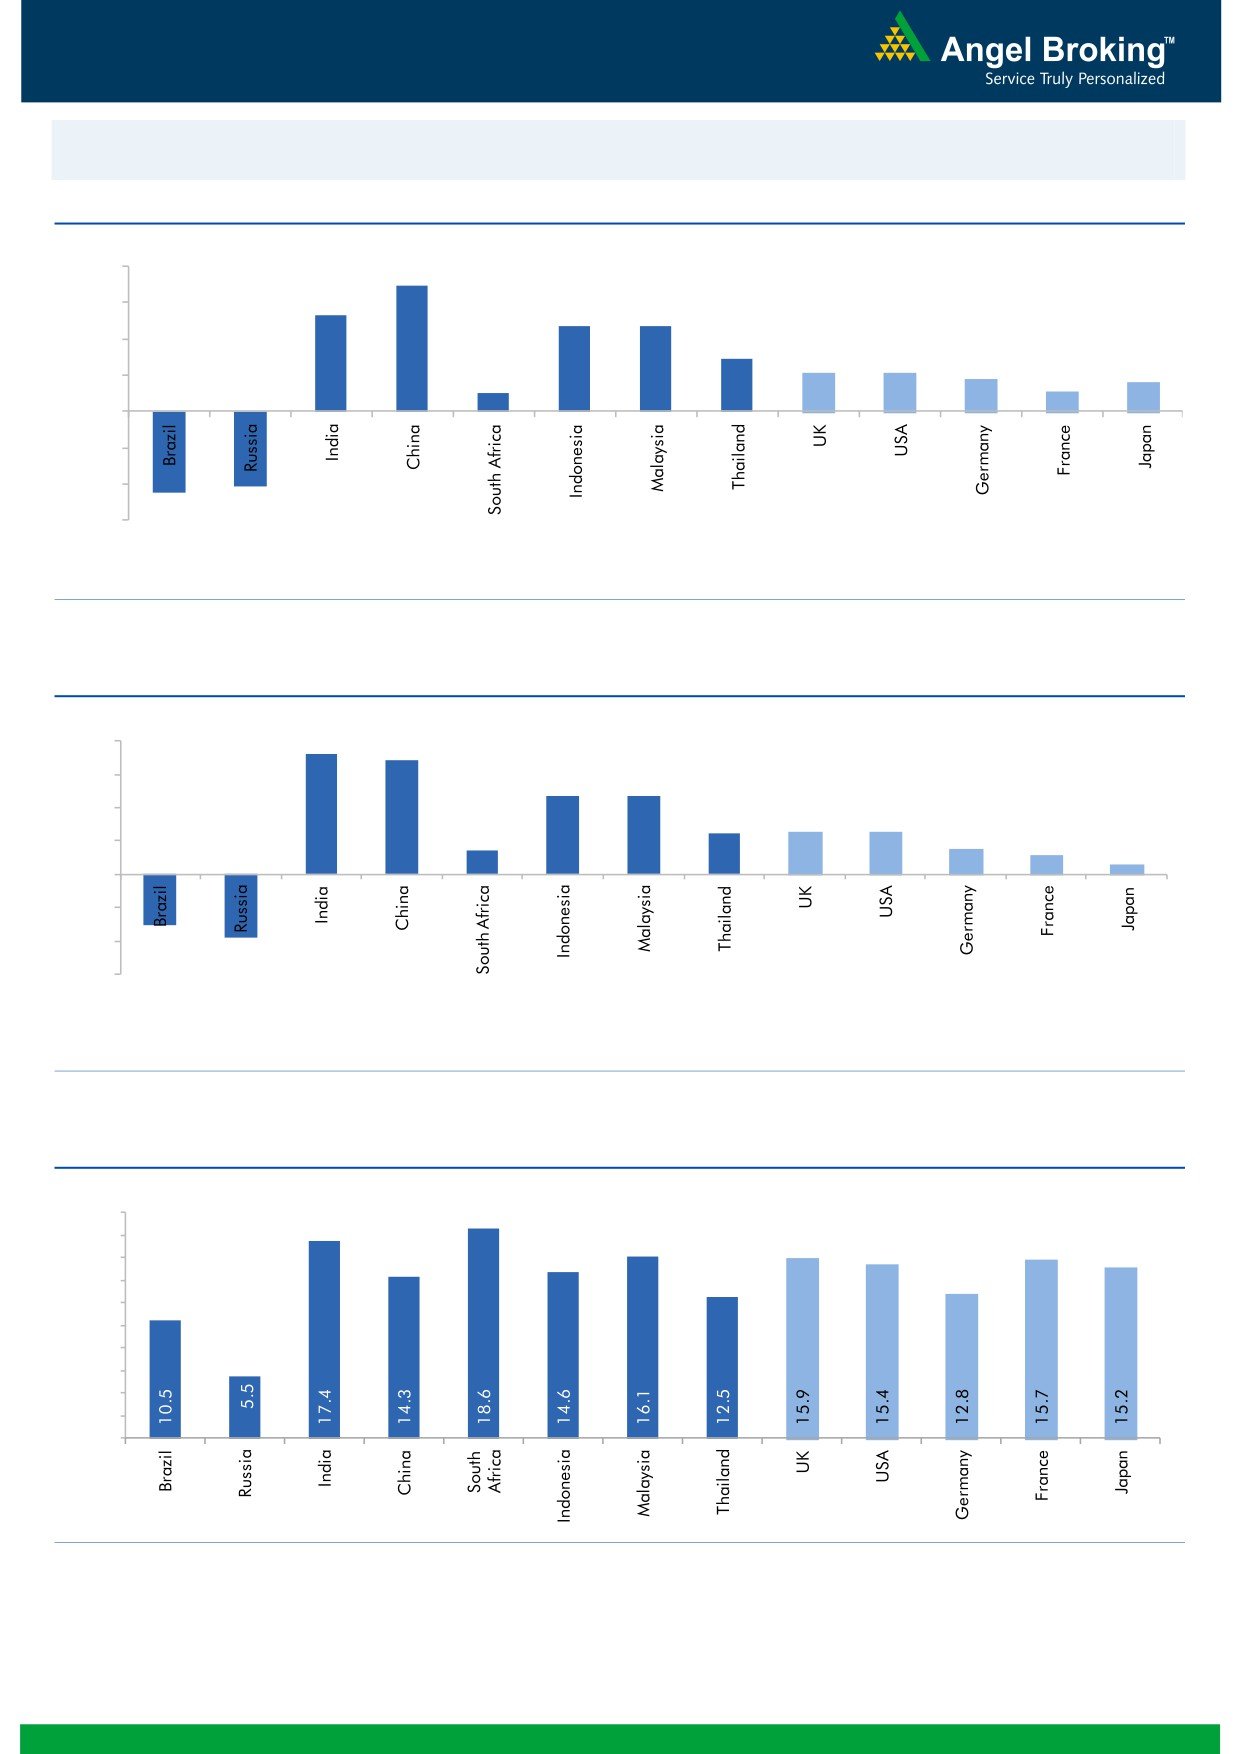
Global watch
Exhibit 1: Latest quarterly GDP Growth (%, yoy) across select developing and developed countries
(%)
8.0
6.9
5.3
6.0
4.7
4.7
4.0
2.9
2.1
2.1
1.8
2.0
1.0
1.1
1.6
-
(2.0)
(4.0)
(4.1)
(4.5)
(6.0)
Source: Bloomberg, Angel Research
Exhibit 2: 2015 GDP Growth projection by IMF (%, yoy) across select developing and developed countries
(%)
7.3
8.0
6.8
6.0
4.7
4.7
4.0
2.5
2.5
2.6
1.4
1.5
2.0
1.2
0.6
(3.8)
-
(2.0)
(4.0)
(3.0)
(6.0)
Source: IMF, Angel Research
Exhibit 3: One year forward P-E ratio across select developing and developed countries
(x)
20.0
18.0
16.0
14.0
12.0
10.0
8.0
6.0
4.0
2.0
-
Source: IMF, Angel Research
Market Outlook
January 1, 2016
Exhibit 4: Relative performance of indices across globe
Returns (%)
Country
Name of index
Closing price
1M
3M
1YR
Brazil
Bovespa
43,350
(8.1)
(4.3)
(12.7)
Russia
Micex
1,761
(0.5)
7.2
22.9
India
Nifty
7,946
0.1
1.0
(3.1)
China
Shanghai Composite
3,539
2.4
14.4
13.2
South Africa
Top 40
45,797
(1.1)
2.0
4.2
Mexico
Mexbol
42,978
(1.0)
2.0
(0.4)
Indonesia
LQ45
792
0.2
13.2
(8.4)
Malaysia
KLCI
1,693
0.6
5.2
(3.2)
Thailand
SET 50
814
(7.0)
(6.7)
(19.7)
USA
Dow Jones
17,425
(1.7)
7.0
(2.3)
UK
FTSE
6,242
(2.1)
3.0
(2.7)
Japan
Nikkei
19,034
(4.3)
6.4
10.6
Germany
DAX
10,743
(5.1)
13.7
13.4
France
CAC
4,637
(6.5)
4.8
8.8
Source: Bloomberg, Angel Research
Stock Watch
January 01, 2016
Company Name
Reco
CMP
Target
Mkt Cap
Sales ( Čcr )
OPM(%)
EPS (Č)
PER(x)
P/BV(x)
RoE(%)
EV/Sales(x)
(Č)
Price ( Č)
( Č cr )
FY16E FY17E
FY16E
FY17E
FY16E
FY17E
FY16E
FY17E
FY16E
FY17E
FY16E
FY17E
FY16E
FY17E
Agri / Agri Chemical
Rallis
Neutral
177
-
3,437
2,075
2,394
14.4
14.4
9.5
11.0
18.6
16.1
3.7
3.2
21.1
21.3
1.7
1.5
United Phosphorus
Buy
438
510
18,784
13,698
15,752
17.6
17.6
32.1
38.5
13.7
11.4
2.7
2.2
21.4
21.3
1.5
1.2
Auto & Auto Ancillary
Ashok Leyland
Buy
88
111
25,044
17,995
21,544
11.4
11.6
3.4
4.7
25.9
18.7
4.5
4.2
17.7
22.2
1.4
1.1
Bajaj Auto
Accumulate
2,534
2,728
73,311
23,695
27,298
21.3
20.4
134.6
151.5
18.8
16.7
6.0
5.1
31.8
30.6
2.7
2.3
Bharat Forge
Accumulate
890
943
20,721
7,867
8,881
20.0
20.3
34.4
41.0
25.9
21.7
5.0
4.2
21.1
20.9
2.8
2.4
Eicher Motors
Accumulate
16,856
19,036
45,770
15,379
16,498
15.6
16.6
473.2
574.8
35.6
29.3
13.2
9.8
36.7
33.2
2.9
2.7
Gabriel India
Neutral
99
-
1,423
1,415
1,544
8.7
9.0
4.6
5.4
21.5
18.3
3.9
3.5
18.1
18.9
1.0
0.9
Hero Motocorp
Neutral
2,695
-
53,821
28,561
31,559
14.7
14.7
151.1
163.2
17.8
16.5
6.9
5.9
38.7
35.6
1.7
1.5
Jamna Auto Industries Neutral
140
-
1,115
1,292
1,486
9.3
9.8
6.0
7.5
23.3
18.6
4.8
4.1
20.7
21.8
0.9
0.8
L G Balakrishnan & Bros Neutral
519
-
815
1,254
1,394
11.6
11.8
35.9
41.7
14.5
12.5
2.0
1.7
13.5
13.8
0.8
0.7
Mahindra and Mahindra Accumulate
1,272
1,449
78,975
39,031
44,440
13.8
13.9
57.9
67.6
22.0
18.8
3.6
3.1
16.1
16.6
1.7
1.4
Maruti
Neutral
4,615
-
139,421
57,865
68,104
16.4
16.7
176.3
225.5
26.2
20.5
5.1
4.3
19.4
21.2
2.2
1.8
Minda Industries
Neutral
925
-
1,468
2,567
2,965
8.0
8.3
46.1
57.8
20.1
16.0
3.4
2.8
16.7
17.3
0.7
0.6
Motherson Sumi
Accumulate
293
313
38,802
39,343
45,100
8.8
9.1
10.1
12.5
29.0
23.5
9.2
7.2
35.3
34.4
1.1
0.9
Rane Brake Lining
Accumulate
343
366
271
454
511
11.1
11.4
23.8
28.1
14.4
12.2
2.0
1.9
14.2
15.3
0.7
0.7
Setco Automotive
Neutral
42
-
565
594
741
12.7
13.7
1.7
3.2
24.9
13.2
2.6
2.3
10.4
16.9
1.4
1.1
Tata Motors
Neutral
391
-
112,962
255,254
301,772
12.9
13.4
23.7
37.3
16.5
10.5
2.0
1.7
7.4
12.1
0.6
0.6
TVS Motor
Buy
290
338
13,761
11,569
13,648
7.3
8.7
10.3
16.1
28.1
18.0
7.0
5.5
24.8
30.5
1.2
1.0
Amara Raja Batteries
Buy
862
1,040
14,718
4,892
5,871
17.4
17.6
28.8
37.1
29.9
23.2
7.0
5.6
23.4
24.1
3.0
2.4
Exide Industries
Accumulate
146
162
12,423
6,950
7,784
14.4
14.8
6.6
7.3
22.1
20.0
2.8
2.6
12.6
12.8
1.5
1.3
Apollo Tyres
Accumulate
156
171
7,948
12,146
12,689
16.8
16.0
21.2
19.0
7.4
8.2
1.2
1.1
16.5
13.0
0.7
0.8
Ceat
Accumulate
1,053
1,119
4,257
6,041
6,597
14.1
13.7
99.5
111.9
10.6
9.4
2.1
1.7
19.6
18.5
0.9
0.7
JK Tyres
Neutral
112
-
2,529
7,446
7,669
15.2
14.0
19.6
18.4
5.7
6.1
1.4
1.2
25.2
19.5
0.7
0.6
Swaraj Engines
Neutral
970
-
1,204
552
630
14.2
14.7
44.6
54.1
21.7
17.9
5.1
4.6
23.2
25.6
2.0
1.7
Subros
Neutral
109
-
651
1,268
1,488
11.6
11.9
3.7
6.6
29.4
16.5
2.0
1.8
6.8
11.4
0.8
0.7
Indag Rubber
Neutral
205
-
538
283
329
17.0
17.2
13.0
15.4
15.8
13.3
3.5
2.9
21.8
21.6
1.6
1.3
Capital Goods
ACE
Neutral
47
-
460
660
839
4.7
8.2
1.0
3.9
46.5
11.9
1.5
1.3
3.2
11.3
0.8
0.7
BEML
Neutral
1,279
-
5,327
3,277
4,006
6.0
8.9
29.2
64.3
43.8
19.9
2.5
2.2
5.7
11.7
1.7
1.4
Bharat Electronics
Neutral
1,371
-
32,906
7,737
8,634
16.8
17.2
54.0
61.0
25.4
22.5
3.6
3.2
39.3
45.6
3.4
2.9
Stock Watch
January 01, 2016
Company Name
Reco
CMP
Target
Mkt Cap
Sales ( Čcr )
OPM(%)
EPS (Č)
PER(x)
P/BV(x)
RoE(%)
EV/Sales(x)
(Č)
Price ( Č)
( Č cr )
FY16E
FY17E
FY16E
FY17E
FY16E
FY17E
FY16E
FY17E
FY16E
FY17E
FY16E
FY17E
FY16E
FY17E
Capital Goods
Voltas
Accumulate
324
353
10,711
5,363
5,963
8.0
9.1
11.0
13.8
29.4
23.5
4.5
4.0
16.2
17.9
1.9
1.7
BGR Energy
Neutral
131
-
943
3,615
3,181
9.5
9.4
16.7
12.4
7.8
10.5
0.7
0.7
10.0
7.0
0.7
0.8
BHEL
Neutral
169
-
41,426
33,722
35,272
10.8
11.7
10.5
14.2
16.1
11.9
1.2
1.1
7.0
9.0
1.3
1.3
Blue Star
Accumulate
393
429
3,538
3,548
3,977
6.3
6.9
13.7
17.2
28.7
22.9
7.2
4.7
26.1
25.4
1.1
0.9
Crompton Greaves
Accumulate
192
204
12,030
13,484
14,687
4.9
6.2
4.5
7.1
42.7
27.0
3.0
2.8
7.2
10.8
1.0
0.9
Inox Wind
Buy
360
458
7,979
4,980
5,943
17.0
17.5
26.6
31.6
13.5
11.4
4.0
3.0
35.0
30.0
1.8
1.4
KEC International
Neutral
155
-
3,986
8,791
9,716
6.1
6.8
5.4
8.2
28.7
18.9
2.9
2.6
10.0
14.0
0.7
0.6
Thermax
Neutral
903
-
10,762
6,413
7,525
7.4
8.5
30.5
39.3
29.6
23.0
4.6
4.0
15.0
17.0
1.7
1.4
Cement
ACC
Buy
1,360
1,630
25,525
13,151
14,757
16.4
18.3
63.9
83.4
21.3
16.3
2.7
2.5
13.3
16.1
1.8
1.5
Ambuja Cements
Accumulate
203
233
31,550
11,564
12,556
19.4
20.7
8.9
10.1
22.8
20.1
2.9
2.7
12.8
13.8
2.4
2.2
HeidelbergCement
Neutral
81
-
1,831
1,772
1,926
13.3
15.4
1.0
3.0
80.8
26.9
2.1
1.9
2.6
7.9
1.6
1.4
India Cements
Buy
97
112
2,964
4,216
4,840
18.0
19.5
4.0
9.9
24.1
9.8
1.0
0.9
4.0
9.5
1.0
0.8
JK Cement
Buy
587
744
4,102
3,661
4,742
10.1
15.8
18.0
61.0
32.6
9.6
2.4
2.1
7.5
22.9
1.6
1.2
J K Lakshmi Cement
Buy
326
430
3,833
2,947
3,616
16.7
19.9
11.5
27.2
28.3
12.0
2.7
2.3
9.8
20.8
1.7
1.4
Mangalam Cements
Neutral
195
-
520
1,053
1,347
10.5
13.3
8.4
26.0
23.2
7.5
1.0
0.9
4.3
12.5
0.9
0.6
Orient Cement
Buy
149
183
3,043
1,854
2,524
21.2
22.2
7.7
11.1
19.3
13.4
2.8
2.4
13.3
15.7
2.4
1.7
Ramco Cements
Neutral
393
-
9,345
4,036
4,545
20.8
21.3
15.1
18.8
26.0
20.9
3.2
2.8
12.9
14.3
2.8
2.4
Shree Cement^
Neutral
11,473
-
39,967
7,150
8,742
26.7
28.6
228.0
345.5
50.3
33.2
7.4
6.2
15.7
20.3
5.3
4.3
UltraTech Cement
Buy
2,785
3,282
76,424
25,021
30,023
19.1
21.6
89.0
132.0
31.3
21.1
3.6
3.1
12.2
15.9
3.1
2.6
Construction
ITNL
Neutral
85
-
2,799
7,360
8,825
34.0
35.9
7.0
9.0
12.2
9.5
0.4
0.4
3.2
3.7
3.7
3.6
KNR Constructions
Buy
569
673
1,600
937
1,470
14.3
14.0
33.5
38.6
17.0
14.7
2.6
2.2
15.4
15.4
1.8
1.2
Larsen & Toubro
Buy
1,276
1,646
118,790
65,065
77,009
11.5
11.7
61.5
65.6
20.7
19.5
2.1
1.9
13.4
14.0
2.0
1.7
Gujarat Pipavav Port
Neutral
142
-
6,858
629
684
51.0
52.2
6.4
5.9
22.2
24.0
2.9
2.7
15.9
12.7
10.6
9.5
MBL Infrastructures
Buy
227
285
942
2,313
2,797
12.2
14.6
19.0
20.0
12.0
11.4
1.3
1.2
11.3
10.6
1.1
1.0
Nagarjuna Const.
Neutral
76
-
4,220
7,892
8,842
8.8
9.1
3.0
5.3
25.3
14.3
1.3
1.2
5.0
8.5
0.8
0.7
PNC Infratech
Neutral
537
-
2,755
1,873
2,288
13.2
13.5
24.0
32.0
22.4
16.8
2.2
1.9
12.1
12.3
1.6
1.3
Simplex Infra
Neutral
312
-
1,542
5,955
6,829
10.3
10.5
16.0
31.0
19.5
10.1
1.0
0.9
5.3
9.9
0.8
0.7
Power Mech Projects
Neutral
660
-
971
1,539
1,801
12.8
12.7
59.0
72.1
11.2
9.2
1.7
1.4
18.6
16.8
0.6
0.5
Sadbhav Engineering
Neutral
342
-
5,865
3,481
4,219
10.7
10.8
8.0
12.0
42.7
28.5
4.0
3.5
10.3
13.5
2.0
1.6
Stock Watch
January 01, 2016
Company Name
Reco
CMP
Target
Mkt Cap
Sales ( Čcr )
OPM(%)
EPS (Č)
PER(x)
P/BV(x)
RoE(%)
EV/Sales(x)
(Č)
Price ( Č)
( Č cr )
FY16E
FY17E
FY16E
FY17E
FY16E
FY17E
FY16E
FY17E
FY16E
FY17E
FY16E
FY17E
FY16E
FY17E
Construction
NBCC
Accumulate
990
1,089
11,876
7,382
9,506
7.7
8.6
39.8
54.4
24.9
18.2
6.0
4.7
26.7
29.1
1.4
1.0
MEP Infra
Neutral
45
-
739
1,956
1,876
28.1
30.5
1.3
3.0
35.0
15.2
7.3
4.9
21.2
32.8
1.8
1.8
SIPL
Neutral
100
-
3,513
675
1,042
62.4
64.7
-
-
3.7
4.3
-
-
16.9
11.4
Financials
Allahabad Bank
Neutral
69
-
4,150
8,569
9,392
2.8
2.9
16.3
27.5
4.2
2.5
0.4
0.3
7.6
11.9
-
-
Axis Bank
Buy
450
630
106,926
26,473
31,527
3.5
3.6
35.7
43.5
12.6
10.3
2.4
2.1
17.9
18.9
-
-
Bank of Baroda
Neutral
157
-
36,118
18,485
21,025
1.9
2.0
13.5
21.1
11.7
7.4
0.9
0.8
7.3
10.6
-
-
Bank of India
Neutral
115
-
9,103
15,972
17,271
1.9
2.0
15.3
33.4
7.5
3.5
0.3
0.3
3.6
7.6
-
-
Canara Bank
Neutral
234
-
12,687
15,441
16,945
2.0
2.1
46.6
70.4
5.0
3.3
0.4
0.4
8.0
11.2
-
-
Dena Bank
Neutral
41
-
2,626
3,440
3,840
2.1
2.3
7.3
10.0
5.6
4.1
0.4
0.4
6.1
7.9
-
-
Federal Bank
Neutral
56
-
9,617
3,477
3,999
3.0
3.0
5.0
6.2
11.2
9.0
1.1
1.0
10.6
11.9
-
-
HDFC
Neutral
1,263
-
199,338
10,358
11,852
3.3
3.3
41.1
47.0
30.8
26.8
5.9
5.3
24.7
24.9
-
-
HDFC Bank
Buy
1,083
1,262
273,404
38,309
47,302
4.3
4.3
49.3
61.1
22.0
17.7
3.8
3.3
18.5
19.7
-
-
ICICI Bank
Buy
261
354
151,958
34,279
39,262
3.3
3.3
21.0
24.4
12.5
10.7
2.1
1.8
14.4
14.7
-
-
IDBI Bank
Neutral
89
-
14,259
9,625
10,455
1.8
1.8
8.5
14.2
10.4
6.3
0.7
0.6
5.9
9.3
-
-
Indian Bank
Neutral
115
-
5,545
6,160
6,858
2.5
2.5
24.5
29.8
4.7
3.9
0.4
0.3
7.7
8.6
-
-
LIC Housing Finance
Accumulate
509
571
25,667
3,101
3,745
2.5
2.5
33.0
40.2
15.4
12.7
2.9
2.5
19.7
20.5
-
-
Oriental Bank
Neutral
141
-
4,219
7,643
8,373
2.4
2.4
37.2
45.4
3.8
3.1
0.3
0.3
8.2
9.4
-
-
Punjab Natl.Bank
Neutral
116
-
22,709
23,638
26,557
2.8
2.8
17.9
27.2
6.5
4.3
0.6
0.5
8.5
12.0
-
-
South Ind.Bank
Neutral
19
-
2,619
1,965
2,185
2.5
2.5
2.5
3.3
7.8
5.9
0.8
0.7
9.5
11.7
-
-
St Bk of India
Buy
224
283
174,197
82,520
93,299
2.7
2.8
20.0
24.5
11.2
9.2
1.2
1.1
11.5
12.8
-
-
Union Bank
Neutral
149
-
10,212
12,646
14,129
2.3
2.4
31.0
39.1
4.8
3.8
0.5
0.4
9.8
11.4
-
-
Vijaya Bank
Neutral
34
-
2,934
3,536
3,827
1.9
1.9
5.5
6.7
6.2
5.1
0.5
0.5
7.8
8.8
-
-
Yes Bank
Buy
726
921
30,449
7,190
9,011
3.2
3.3
58.2
69.7
12.5
10.4
2.2
1.9
19.2
19.6
-
-
FMCG
Asian Paints
Neutral
884
-
84,779
16,553
19,160
16.0
16.2
17.7
21.5
50.0
41.1
13.3
11.9
29.4
31.2
5.0
4.3
Britannia
Neutral
2,964
-
35,557
8,065
9,395
9.6
10.2
47.2
65.5
62.8
45.3
20.9
19.7
38.3
41.2
4.3
3.7
Colgate
Neutral
970
-
26,392
4,836
5,490
19.5
19.7
48.5
53.2
20.0
18.2
14.7
12.8
99.8
97.5
5.3
4.7
Dabur India
Neutral
277
-
48,658
9,370
10,265
17.1
17.2
7.3
8.1
37.7
34.2
11.4
9.3
33.7
30.6
5.1
4.7
GlaxoSmith Con*
Neutral
6,407
-
26,944
4,919
5,742
17.2
17.4
168.3
191.2
38.1
33.5
10.8
9.2
28.8
28.9
5.0
4.3
Godrej Consumer
Neutral
1,319
-
44,908
10,168
12,886
16.1
16.1
32.1
38.4
41.1
34.3
8.4
7.7
19.7
21.0
4.5
3.6
Stock Watch
January 01, 2016
Company Name
Reco
CMP
Target
Mkt Cap
Sales ( Čcr )
OPM(%)
EPS (Č)
PER(x)
P/BV(x)
RoE(%)
EV/Sales(x)
(Č)
Price ( Č)
( Č cr )
FY16E FY17E
FY16E
FY17E
FY16E
FY17E
FY16E
FY17E
FY16E
FY17E
FY16E
FY17E
FY16E
FY17E
FMCG
HUL
Neutral
862
-
186,601
34,940
38,957
17.5
17.7
20.8
24.7
41.5
34.9
46.1
36.9
110.5
114.2
5.1
4.6
ITC
Buy
328
382
263,282
41,068
45,068
37.8
37.4
13.9
15.9
23.5
20.6
7.9
6.9
34.1
33.8
6.0
5.5
Marico
Buy
226
363
29,197
6,551
7,766
15.7
16.0
10.4
12.5
21.8
18.1
6.3
5.3
33.2
32.4
4.4
3.7
Nestle*
Accumulate
5,824
6,646
56,153
11,291
12,847
22.2
22.3
158.9
184.6
36.7
31.6
19.2
17.2
55.0
57.3
4.8
4.2
Tata Global
Neutral
146
-
9,227
8,635
9,072
9.8
9.9
6.5
7.6
22.5
19.2
2.2
2.2
6.8
7.4
1.0
1.0
IT
HCL Tech^
Buy
855
1,132
120,543
42,038
47,503
23.2
23.5
55.8
62.9
15.3
13.6
3.5
2.7
23.0
19.8
2.5
2.0
Infosys
Buy
1,105
1,306
253,709
60,250
66,999
28.0
28.0
58.3
63.7
19.0
17.3
4.0
3.4
20.9
19.7
3.5
3.0
TCS
Buy
2,439
3,165
480,627
111,274
126,852
28.4
28.7
125.4
143.9
19.5
17.0
7.7
7.1
39.9
42.2
3.9
3.4
Tech Mahindra
Buy
522
646
50,431
25,566
28,890
16.0
17.0
26.3
31.9
19.8
16.4
3.6
3.0
17.9
18.6
1.7
1.5
Wipro
Buy
560
719
138,291
52,414
58,704
23.7
23.8
38.4
42.3
14.6
13.2
2.8
2.5
19.5
18.0
2.2
1.8
Media
D B Corp
Accumulate
329
356
6,042
2,241
2,495
27.8
27.9
21.8
25.6
15.1
12.9
3.9
3.5
26.7
28.5
2.6
2.4
HT Media
Neutral
93
-
2,153
2,495
2,603
11.2
11.2
7.3
8.6
12.7
10.8
1.0
0.9
7.4
8.1
0.4
0.3
Jagran Prakashan
Accumulate
159
169
5,203
2,170
2,355
27.2
26.2
8.9
9.9
17.9
16.1
3.8
3.3
20.9
20.5
2.3
2.1
Sun TV Network
Neutral
426
-
16,794
2,779
3,196
70.2
70.5
22.8
27.3
18.7
15.6
4.6
4.2
26.7
28.3
5.8
5.0
Hindustan Media
Neutral
295
-
2,166
920
1,031
20.0
20.0
19.2
20.9
15.4
14.1
2.5
2.2
16.4
15.3
1.9
1.7
Ventures
Metals & Mining
Coal India
Buy
329
380
207,619
76,167
84,130
19.9
22.3
22.4
25.8
14.7
12.7
5.3
5.2
35.5
41.0
2.1
1.8
Hind. Zinc
Buy
147
175
61,943
14,641
14,026
50.4
50.4
17.7
16.0
8.3
9.2
1.3
1.2
16.2
13.2
1.9
1.7
Hindalco
Neutral
85
-
17,501
104,356
111,186
8.7
9.5
6.7
11.1
12.6
7.7
0.5
0.4
3.5
5.9
0.7
0.6
JSW Steel
Neutral
1,033
-
24,959
42,308
45,147
16.4
20.7
(10.3)
49.5
20.9
1.2
1.1
(1.0)
5.6
1.6
1.5
NMDC
Neutral
90
-
35,643
8,237
10,893
46.6
44.5
10.0
11.7
9.0
7.7
1.0
0.9
12.5
13.0
4.1
3.1
SAIL
Neutral
48
-
19,928
45,915
53,954
7.2
10.5
1.5
4.4
32.0
11.0
0.5
0.5
2.3
4.1
1.1
1.0
Vedanta
Neutral
90
-
26,801
71,445
81,910
26.2
26.3
12.9
19.2
7.0
4.7
0.5
0.4
7.2
8.9
0.8
0.6
Tata Steel
Neutral
260
-
25,208
126,760
137,307
8.9
11.3
6.4
23.1
40.8
11.3
0.8
0.8
2.0
7.1
0.8
0.7
Oil & Gas
Cairn India
Neutral
138
-
25,901
11,323
12,490
49.4
51.0
20.7
20.7
6.7
6.7
0.4
0.4
6.4
6.1
1.4
0.7
GAIL
Neutral
375
-
47,619
64,856
70,933
9.1
9.6
24.0
28.9
15.7
13.0
1.3
1.3
8.8
9.6
0.9
0.8
ONGC
Neutral
242
-
206,957
154,564
167,321
36.8
37.4
28.6
32.5
8.5
7.5
1.1
1.0
12.7
13.5
1.5
1.4
Petronet LNG
Neutral
255
-
19,114
29,691
31,188
5.8
6.2
12.8
13.4
19.9
19.0
3.0
2.7
15.8
14.8
0.7
0.7
Indian Oil Corp
Accumulate
429
455
104,050
359,607
402,760
5.9
6.1
42.5
48.7
10.1
8.8
1.4
1.2
14.1
14.4
0.4
0.3
Reliance Industries
Neutral
1,013
-
328,003
304,775
344,392
12.6
13.4
91.3
102.6
11.1
9.9
1.3
1.1
11.8
12.0
1.0
0.8
Stock Watch
January 01, 2016
Company Name
Reco
CMP
Target
Mkt Cap
Sales ( Čcr )
OPM(%)
EPS (Č)
PER(x)
P/BV(x)
RoE(%)
EV/Sales(x)
(Č)
Price ( Č)
( Č cr )
FY16E FY17E
FY16E
FY17E
FY16E
FY17E
FY16E
FY17E
FY16E
FY17E
FY16E
FY17E
FY16E
FY17E
Pharmaceuticals
Alembic Pharma
Neutral
694
-
13,084
2,658
3,112
24.1
20.2
24.6
23.9
28.2
29.0
10.1
7.8
42.5
30.2
4.9
4.1
Aurobindo Pharma
Neutral
875
-
51,120
14,923
17,162
23.0
23.0
38.2
43.6
22.9
20.1
7.1
5.3
36.0
30.2
3.8
3.2
Aventis*
Neutral
4,358
-
10,036
2,082
2,371
17.4
20.8
118.2
151.5
36.9
28.8
5.4
4.3
19.9
25.5
4.5
3.7
Cadila Healthcare
Neutral
328
-
33,558
10,224
11,840
21.0
22.0
14.6
17.6
22.5
18.6
6.2
4.8
30.8
29.0
3.3
2.8
Cipla
Neutral
650
-
52,170
14,211
16,611
20.6
19.0
27.0
28.9
24.1
22.5
4.1
3.5
18.4
16.8
3.7
3.1
Dr Reddy's
Buy
3,103
3,933
52,920
16,838
19,575
25.0
23.1
167.5
178.8
18.5
17.4
3.9
3.3
23.1
20.4
3.1
2.6
Dishman Pharma
Neutral
341
-
2,752
1,733
1,906
21.5
21.5
17.0
19.9
20.1
17.1
2.0
1.8
10.5
11.2
2.1
1.8
GSK Pharma*
Neutral
3,321
-
28,130
2,870
3,158
20.0
22.1
59.5
68.3
55.8
48.6
16.5
16.9
28.5
34.3
9.3
8.5
Indoco Remedies
Neutral
325
-
2,994
1,033
1,199
15.9
18.2
9.4
13.6
34.6
23.9
5.1
4.4
15.7
19.7
3.0
2.6
Ipca labs
Buy
743
900
9,378
3,363
3,909
12.9
18.6
13.4
28.0
55.5
26.5
4.0
3.5
7.4
14.0
3.1
2.6
Lupin
Neutral
1,838
-
82,792
13,092
16,561
25.0
27.0
50.4
68.3
36.5
26.9
7.5
6.0
22.8
24.7
6.0
4.7
Sun Pharma
Buy
820
950
197,330
28,163
32,610
25.8
30.7
17.4
26.9
47.1
30.5
4.5
3.9
13.0
16.6
6.5
5.4
Power
Tata Power
Neutral
68
-
18,364
35,923
37,402
22.6
22.8
4.1
5.2
16.8
13.2
1.3
1.2
7.5
9.3
1.5
1.3
NTPC
Accumulate
146
157
120,301
87,064
98,846
23.5
23.5
11.7
13.2
12.5
11.1
1.4
1.3
11.4
12.1
2.4
2.1
Power Grid
Buy
141
170
73,870
20,702
23,361
86.7
86.4
12.1
13.2
11.7
10.7
1.7
1.5
15.6
15.1
8.5
7.9
Telecom
Bharti Airtel
Neutral
340
-
135,872
101,748
109,191
32.1
31.7
12.0
12.5
28.3
27.2
2.0
1.8
6.9
6.7
2.0
1.8
Idea Cellular
Neutral
144
-
51,755
34,282
36,941
32.0
31.5
5.9
6.2
24.4
23.2
2.2
2.0
9.9
9.3
2.1
2.0
zOthers
Abbott India
Neutral
6,012
-
12,776
2,715
3,153
14.5
14.1
134.3
152.2
44.8
39.5
11.2
9.2
27.4
25.6
4.4
3.7
Bajaj Electricals
Buy
210
290
2,120
4,719
5,287
5.2
5.8
8.6
12.7
24.5
16.6
2.8
2.5
11.4
14.8
0.4
0.4
Finolex Cables
Neutral
253
-
3,862
2,520
2,883
12.2
12.0
12.7
14.2
19.9
17.8
2.7
2.4
13.6
13.5
1.3
1.1
Goodyear India*
Accumulate
570
622
1,314
1,888
1,680
12.1
11.9
62.2
56.6
9.2
10.1
2.2
1.8
25.9
19.7
0.5
0.5
Hitachi
Neutral
1,366
-
3,714
1,779
2,081
7.8
8.8
21.8
33.4
62.7
40.9
10.1
8.2
17.4
22.1
2.2
1.8
Jyothy Laboratories
Neutral
314
-
5,684
1,620
1,847
11.5
11.5
7.3
8.5
43.1
37.1
5.6
5.2
13.3
14.4
3.4
2.9
MRF
Accumulate
39,848
45,575
16,900
20,316
14,488
21.4
21.1
5,488.0
3,798.0
7.3
10.5
2.5
2.0
41.1
21.2
0.8
1.1
Page Industries
Neutral
13,342
-
14,882
1,929
2,450
19.8
20.1
229.9
299.0
58.0
44.6
25.6
17.8
52.1
47.1
7.7
6.1
Relaxo Footwears
Neutral
509
-
6,104
1,767
2,152
12.3
12.5
19.3
25.1
26.4
20.3
6.5
5.0
27.7
27.8
3.5
2.9
Siyaram Silk Mills
Accumulate
1,215
1,354
1,139
1,636
1,815
11.5
11.5
89.9
104.1
13.5
11.7
2.2
1.9
17.9
17.8
0.9
0.8
Styrolution ABS India*
Neutral
756
-
1,329
1,271
1,440
8.6
9.2
32.0
41.1
23.6
18.4
2.4
2.2
10.7
12.4
1.0
0.9
TVS Srichakra
Buy
2,796
3,240
2,141
2,101
2,338
15.7
15.0
248.6
270.0
11.3
10.4
4.9
3.5
43.6
34.0
1.1
0.9
Stock Watch
January 01, 2016
Company Name
Reco
CMP
Target
Mkt Cap
Sales ( Čcr )
OPM(%)
EPS (Č)
PER(x)
P/BV(x)
RoE(%)
EV/Sales(x)
(Č)
Price ( Č)
( Č cr )
FY16E
FY17E
FY16E
FY17E
FY16E
FY17E
FY16E
FY17E
FY16E
FY17E
FY16E
FY17E
FY16E
FY17E
zOthers
HSIL
Neutral
300
-
2,169
2,123
2,384
16.1
16.5
15.0
18.9
20.0
15.9
1.6
1.4
8.0
9.4
1.4
1.2
Kirloskar Engines India
Neutral
249
-
3,607
2,471
2,826
8.8
10.4
9.1
13.3
27.3
18.7
2.6
2.4
9.7
13.4
1.1
0.9
Ltd
M M Forgings
Buy
509
614
615
511
615
21.7
21.6
43.1
55.8
11.8
9.1
2.2
1.8
19.9
21.2
1.4
1.1
Banco Products (India) Neutral
144
-
1,027
1,208
1,353
11.0
12.3
10.8
14.5
13.3
9.9
1.5
1.4
11.9
14.5
0.8
0.7
Competent Automobiles Neutral
150
-
92
1,040
1,137
3.2
3.1
25.7
28.0
5.8
5.4
0.9
0.8
15.0
14.3
0.1
0.1
Nilkamal
Neutral
1,254
-
1,871
1,910
2,083
10.5
10.3
63.3
69.2
19.8
18.1
3.2
2.8
17.6
16.5
1.0
0.9
Visaka Industries
Buy
123
144
195
1,086
1,197
9.9
10.3
21.5
28.8
5.7
4.3
0.6
0.5
9.6
11.6
0.4
0.3
Transport Corporation of
Neutral
297
-
2,256
2,830
3,350
8.8
9.0
14.4
18.3
20.6
16.2
3.2
2.8
15.4
17.1
0.9
0.8
India
Elecon Engineering
Neutral
84
-
917
1,369
1,533
13.7
14.9
3.3
6.1
25.4
13.9
1.7
1.5
6.6
11.4
1.0
0.9
Surya Roshni
Buy
142
183
623
2,992
3,223
8.1
8.4
14.7
18.3
9.7
7.8
0.9
0.8
9.7
11.0
0.5
0.5
MT Educare
Neutral
183
-
729
286
366
18.3
17.7
7.7
9.4
23.7
19.5
5.0
4.4
20.2
21.1
2.5
1.9
Radico Khaitan
Buy
120
156
1,590
1,565
1,687
12.2
13.0
5.7
7.1
21.0
16.8
1.8
1.6
8.3
9.6
1.5
1.4
Garware Wall Ropes
Accumulate
423
473
926
861
967
10.9
10.9
24.0
28.2
17.6
15.0
2.6
2.2
14.6
14.9
1.1
0.9
Wonderla Holidays
Neutral
397
-
2,244
206
308
44.0
43.6
9.0
12.9
44.1
30.8
6.0
5.5
13.7
17.8
10.8
7.2
Linc Pen & Plastics
Neutral
217
-
321
340
371
8.3
8.9
10.8
13.2
20.1
16.5
3.2
2.8
16.0
17.1
1.0
0.9
The Byke Hospitality
Neutral
152
-
610
222
287
20.5
20.5
5.6
7.6
27.0
20.2
5.1
4.2
18.9
20.8
2.8
2.1
Interglobe Aviation
Neutral
1,235
-
44,500
17,022
21,122
20.7
14.5
63.9
53.7
19.3
23.0
29.0
23.7
149.9
103.2
2.6
2.1
Coffee Day Enterprises
Neutral
284
-
5,845
2,692
2,964
17.0
18.6
-
4.7
-
59.9
3.5
3.3
0.2
5.5
2.6
2.4
Ltd
Navneet Education
Neutral
96
-
2,296
998
1,062
24.1
24.0
5.8
6.1
16.8
15.8
3.7
3.3
22.0
20.6
2.4
2.2
Source: Company, Angel Research; Note: *December year end; #September year end; &October year end; Price as on December 31, 2015
Market Outlook
January 01, 2016
Research Team Tel: 022 - 39357800
DISCLAIMER
Angel Broking Private Limited (hereinafter referred to as “Angel”) is a registered Member of National Stock Exchange of India Limited,
Bombay Stock Exchange Limited and Metropolitian Stock Exchange of India Limited. It is also registered as a Depository Participant with
CDSL and Portfolio Manager with SEBI. It also has registration with AMFI as a Mutual Fund Distributor. Angel Broking Private Limited is a
registered entity with SEBI for Research Analyst in terms of SEBI (Research Analyst) Regulations, 2014 vide registration number
INH000000164. Angel or its associates has not been debarred/ suspended by SEBI or any other regulatory authority for accessing
/dealing in securities Market. Angel or its associates including its relatives/analyst do not hold any financial interest/beneficial ownership
of more than 1% in the company covered by Analyst. Angel or its associates/analyst has not received any compensation / managed or co
-managed public offering of securities of the company covered by Analyst during the past twelve months. Angel/analyst has not served as
an officer, director or employee of company covered by Analyst and has not been engaged in market making activity of the company
covered by Analyst.
This document is solely for the personal information of the recipient, and must not be singularly used as the basis of any investment
decision. Nothing in this document should be construed as investment or financial advice. Each recipient of this document should make
such investigations as they deem necessary to arrive at an independent evaluation of an investment in the securities of the companies
referred to in this document (including the merits and risks involved), and should consult their own advisors to determine the merits and
risks of such an investment.
Reports based on technical and derivative analysis center on studying charts of a stock's price movement, outstanding positions and
trading volume, as opposed to focusing on a company's fundamentals and, as such, may not match with a report on a company's
fundamentals.
The information in this document has been printed on the basis of publicly available information, internal data and other reliable sources
believed to be true, but we do not represent that it is accurate or complete and it should not be relied on as such, as this document is for
general guidance only. Angel Broking Pvt. Limited or any of its affiliates/ group companies shall not be in any way responsible for any
loss or damage that may arise to any person from any inadvertent error in the information contained in this report. Angel Broking Pvt.
Limited has not independently verified all the information contained within this document. Accordingly, we cannot testify, nor make any
representation or warranty, express or implied, to the accuracy, contents or data contained within this document. While Angel Broking
Pvt. Limited endeavors to update on a reasonable basis the information discussed in this material, there may be regulatory, compliance,
or other reasons that prevent us from doing so.
This document is being supplied to you solely for your information, and its contents, information or data may not be reproduced,
redistributed or passed on, directly or indirectly.
Neither Angel Broking Pvt. Limited, nor its directors, employees or affiliates shall be liable for any loss or damage that may arise from or
in connection with the use of this information.
Note: Please refer to the important ‘Stock Holding Disclosure' report on the Angel website (Research Section). Also, please refer to the
latest update on respective stocks for the disclosure status in respect of those stocks. Angel Broking Pvt. Limited and its affiliates may have
investment positions in the stocks recommended in this report.