Market Outlook
November 9, 2015
Market Cues
Domestic Indices
Chg (%)
(Pts)
(Close)
Indian markets are expected to open in red tracking SGX Nifty.
BSE Sensex
(0.2)
(39)
26,265
Labor department on Friday released its jobs report. Labor department said that
Nifty
(0.0)
(1)
7,954
economy added 271,000 jobs in October, largest monthly gain this year. Also
Mid Cap
(0.4)
(45)
10,826
employment rate fell to 5%, and hourly wages rose at the fastest year-over-year
Small Cap
(0.6)
(67)
11,052
pace since 2009. These strong numbers have raised concerns for traders to wrestle
Bankex
0.6
123
19,496
between the impact of end of ultra loose monetary policy and signs that U.S.
economy is on a healthy path. U.S. stocks mostly ended the Friday’s session higher.
Global Indices
Chg (%)
(Pts)
(Close)
European stock ended mixed on Friday after better than expected U.S. jobs report.
DAX and CAC ended in green, whereas FTSE ended in red.
Dow Jones
0.3
47
17,910
Nasdaq
0.4
19
5,147
After some struggle, Indian markets ended Friday’s trading session in red for third
consecutive session. Banking stocks perked up, but Pharma and Metal stocks lagged
FTSE
(0.2)
(11)
6,364
behind. With outcome of the Bihar Elections ahead, investors turned cautious.
Nikkei
0.8
149
19,266
Hang Seng
(0.8)
(184)
22,867
News & Result Analysis
Shanghai Com
1.9
67
3,590
Dr Reddy’s gets Warning Letter from USFDA
Result Review: BEML, ITNL, State Bank of India, Bank of Baroda, Punjab
National Bank, MT Educare, Tata Motors, Banco Products, Abbott India, TVS
Advances / Declines
BSE
NSE
Srichakra, MM Forgings
Advances
1,018
512
Detailed analysis on Pg2
Declines
1,646
983
Investor’s Ready Reckoner
Unchanged
146
107
Key Domestic & Global Indicators
Volumes (` Cr)
Stock Watch: Latest investment recommendations on 150+ stocks
Refer P10 onwards
BSE
2,539
NSE
16,443
Top Picks
CMP
Target
Upside
Company
Sector
Rating
(`)
(`)
(%)
Net Inflows (` Cr)
Net
Mtd
Ytd
Axis Bank
Financials
Buy
465
630
35.5
FII
(1,298)
(1,305)
(16,124)
HCL Tech
IT
Buy
885
1,132
27.9
MFs
840
1,007
51,354
ICICI Bank
Financials
Buy
267
348
30.0
Ashok Leyland
Automobiles
Buy
88
111
26.8
Top Gainers
Price (`)
Chg (%)
Larsen & Toubro
Construction
Buy
1,377
1,646
19.5
Mothersumi
266
9.6
More Top Picks on Pg8
Hexaware
258
5.4
Key Upcoming Events
BankBaroda
167
5.0
Previous
Consensus
Date
Region
Event Description
Reading
Expectations
Godrejcp
1,304
4.4
Nov 11
CNY
Industrial Production (YOY) (Oct)
5.7%
5.8%
Sbin
243
3.9
Nov 11
AUD
Employment Change (Oct)
-5.1k
15.0k
Nov 13
EUR
German GDP (QoQ) (Q3)
0.4%
0.3%
Top Losers
Price (`)
Chg (%)
Nov 13
USD
Core Retail Sales (MOM) (Oct)
-0.3%
0.4%
Drreddy
3,630
(14.7)
Recltd
239
(10.4)
Den
100
(9.6)
Pfc
232
(7.8)
Pmcfin
1
(7.3)
As on November 06, 2015
Market Outlook
November 9, 2015
Dr Reddy’s gets Warning Letter from USFDA
Dr Reddy’s has received a warning letter issued by the USFDA, relating to its three
plants Srikakulam, and Miryalaguda, Telegana along with the oncology
formulation business at Duvvada. Dr Reddys has mentioned that it will respond to
the letter in 15 days. The company has said that Srikakulam facilities itself
contribute around 10-12% of sales of the company. However, according to the
company’s SEC filling the company had set up a new manufacturing facility in a
Special Economic Zone in Duvvada, Visakhapatnam, Andhra Pradesh, India for
the manufacture of parenteral (injectable form) products, so we think the
contribution of the plant, should not be significant. Further the impact of the API
facilities would be depend upon how quick the company fixes the USFDA issues
plant transfers or does third party sources. Nonetheless, the near term
performance of the company will be impacted. The stock has corrected around
10-12% on back of the news, which we believe should discount most of the
negatives in the stock. We remain neutral on the stock.
Result Review
BEML (CMP: `1,109/ TP: / Upside: )
BEML reported standalone sales of
`617cr, up
38.0% YoY (ahead of our
expectation of `599cr). We were expecting EBITDA level losses at `13.1cr, and the
company has reported EBITDA level losses of `13.4cr. Noteworthy, the company
has reported lower EBITDA losses from the year ago levels of `31.1cr. Impact of
EBITDA level losses was seen at the PAT level too, as the company reported net
loss of `30.2cr, against our loss expectation of `12cr. PAT level loss has narrowed
down from previous year’s `55.1cr. Despite 2QFY2016 losses, considering the
company's strong market positioning across business segments and improving
award activity environment, we are optimistic that BEML should report order wins
going forward. Increase in the order book, should translate to better execution and
again lead to turn-around in profits. We continue to maintain our NEUTRAL rating
on the stock.
ITNL (CMP: `90/ TP: / Upside: )
For 2QFY2016, IL&FS Transportation Network (ITNL) reported a top-line
of `1,872cr, up 24.7% YoY and 13.8% QoQ. The quarter’s top-line numbers
include `136cr of compensation claims made to 3 SPVs (vs `261cr in 2QFY2015).
On adjusting for the same, on an evenly basis, the reported top-line grew 39.9%
YoY to `1,736cr, which is below our expectations of `1,755cr. On the operating
front, ITNL reported an EBITDA margin of
35.2% for the quarter vs our
expectations of 32.0% and vs 41.0% in 2QFY2015. The company reported a PAT
of `69cr for the quarter against our expectation of `4cr. The surprise on the PAT
front was aided by better than expected other income and lower than expected
interest expenses, apart from a favorable EBITDA margin. We believe the order
book is not a concern for the company as of now. The core concern area in our
view is its highly levered balance sheet (consol. D/E at 4.48x). With successful
completion of the company’s recent `740cr rights issue, we expect the near-term
equity requirements towards the ongoing BOT projects to be addressed. The
Market Outlook
November 9, 2015
company should see some ease in their cash flow cycle, as 9 of the BOT projects
are about to commence operations in the next 15 months. However, the concern
area is the company’s high debt composition in the near-term. We expect further
news flow on fund raising/ asset divestment to help the stock, get re-rated going
forward. We await more details on the company’s 2QFY2016 performance from
the Management; till then, we maintain our NEUTRAL rating on the stock.
State Bank of India (CMP: `243/ TP: `283/ Upside: 16.4%)
State Bank of India reported 2QFY2016 results, which were above our as well as
street expectations. Advances grew by 10.5% yoy, which resulted in NII growth of
7.4% yoy. Other income saw a jump of 35.6% yoy at `6,197cr resulting in an
increase of operating income by
14.6% yoy. Asset quality shows signs of
improvement with Gross as well as Net NPA ratio declining by 14bp and 10bp
respectively at 4.15% and 2.14% respectively. Fresh slippages for the quarter came
in at `5,875cr as against `7,318cr for Q1FY2016. Provisions came in at `4,361cr
which grew marginally at 2% yoy. Overall, the PAT for the bank grew 25.1% yoy to
`3,879cr led due to healthy performance on all fronts. SBI has been reporting
stable numbers with respect to slippages and NPA ratios over the past several
quarters as compared to its peers. The bank’s core strength has been its high
CASA and fee income, which has supported its core profitability in challenging
times. Its strong capital adequacy also provides comfort. In our view, the stock is
currently trading at a moderate valuation of 0.9x FY2017E ABV as compared to its
peers. Hence we recommend a BUY rating on the stock.
Y/E
Op. Inc
NIM
PAT
EPS ABV ROA ROE
P/E P/ABV
March
(` cr)
(%)
(` cr)
(`)
(`)
(%)
(%)
(x)
(x)
FY2016E
82,520
2.7 14,954
20.0
183.9
0.7
11.5
11.8
1.3
FY2017E
93,299
2.8 18,266
24.5
207.7
0.7
12.8
9.7
1.1
Bank of Baroda (CMP: `167/ TP: / Upside: )
Bank of Baroda reported 2QFY2016 results with PAT de-growth of 88.7% yoy to
`124cr. Advances growth was muted at 7.6% yoy, whereas NII also fell 3.9% yoy.
However, operating income registered a marginal decline of 0.1% yoy largely
supported due to other income which grew 15.4% yoy. However, the main factor
which led to the sharp decline in the PAT was provisions which spiked 113% yoy to
`1,892cr against `888cr in 2QFY2015. Asset quality declined sharply with the
Gross NPA increased rising sequentially to 5.56% in 2QFY2016 from 4.13% in
1QFY2016, whereas Net NPA at 3.08% in the current quarter as compared to
2.07% in 1QFY2016. Fresh Slippages for the quarter was higher at `6,816cr as
compared to `1,685cr in 1QFY2016. From the valuation perspective, the stock
currently trades at 0.7x FY2017E ABV. We maintain our NEUTRAL rating on this
stock.
Y/E
Op. Inc
NIM
PAT
EPS ABV ROA ROE
P/E P/ABV
March
(` cr)
(%)
(` cr)
(`)
(`)
(%)
(%)
(x)
(x)
FY2016E
18,485
1.9
2,984
13.5
170.0
0.4
7.3
11.2
0.9
FY2017E
21,025
2.0
4,688
21.1
192.2
0.6
10.6
7.1
0.8
Market Outlook
November 9, 2015
Punjab National Bank (CMP: `167/ TP: / Upside: )
PNB reported moderate set of numbers for the quarter with PAT growth of 7.9%
which was below consensus expectations. NII grew at a modest pace of 4.1% yoy
due to tepid loan book growth of 6.7%. Other income de-grew 12.9% yoy which
restricted the operating income growth at 1% yoy. Provisions increased by 6.5%
yoy, which led to 7.9% yoy growth in PAT. On the asset quality front, the bank
found some respite on asset quality with Gross NPA ratio decreasing by 11bp qoq
to 6.36%, while Net NPA decreased by 6bp qoq to 3.99%.At CMP, the stock is
trading at 0.6x FY2017E P/ABV. We recommend a NEUTRAL rating on the stock.
Y/E
Op. Inc
NIM
PAT
EPS ABV ROA ROE
P/E P/ABV
March
(` cr)
(%)
(` cr)
(`)
(`)
(%)
(%)
(x)
(x)
FY2016E
23,638
2.8
3,316
18
180
0.5
8.5
8.0
0.8
FY2017E
26,557
2.8
5,052
27
218
0.7
12.0
5.2
0.7
MT Educare (CMP: `134/ TP: `169 Upside: 26%)
MT Educare’s 2QFY2016 results outperformed our estimates on all parameters. Its
consolidated top-line grew by a healthy ~26% yoy to ~`83cr (our estimate was
of `78.6cr), mainly due to strong growth in Robomate product sales as well as
Government Projects segment. However, core coaching business was subdued
during the quarter. The company reported a consolidated operating profit of
~`22cr, up 19% yoy. The operating margin contracted by 163bp yoy to 27.0%,
primarily on account of higher other costs. The consolidated reported net profit
grew by ~21% yoy to ~`14cr (our estimate was of `12.1cr), due to strong top-line
growth.
Going forward, we expect MT Educare to report strong top-line and bottom-line
growth in the coming financial years (FY2016E and FY2017E) on back of healthy
growth in the coaching business. We expect additional revenue growth from
execution of government projects, Robomate product, and tie up with Shri Gayatri
Educational Society (SGES) in Hyderabad. Currently, we have a BUY rating on the
stock.
Tata Motors (CMP: `396/ TP: `424 /Upside:7%)
Tata Motors 2QFY2016 results were below estimates on the operating front.
Consolidated revenues grew marginally by 1% yoy to `61,318cr (coming slightly
ahead of our estimates of `57,484cr). Growth was subdued mainly due to flattish
growth in JLR. JLR volumes grew a healthy 12% during the quarter but an adverse
mix led to lower realization, thereby dragging the topline. The operating margins
at 11.2% were below our estimates of 13.4%. JLR EBIDTA margins at 12.2% were
significantly below our estimates of 15%. JLR margins were impacted by lower
China sales, adverse product mix and higher launch expenses. During the quarter,
Tata Motors reported a loss at the net level due to a one off charge of `2,493cr
due to JLR vehicles which were destroyed in explosions caused at the China port
location. The company has put an insurance claim for the same which would take
some time for processing but has recognised the loss in the current quarter. During
the quarter, Tata Motors realized tax credit to the tune of `704cr which resulted
into Adj profit at `2,223cr coming in better than our estimates of `2,041cr. We
Market Outlook
November 9, 2015
currently have Accumulate rating on the stock but would review our estimates post
the disappointing performance at JLR.
Y/E
Sales OPM
PAT
EPS ROE P/E P/BV
EV/Sales
March
(`cr)
(%)
(`cr)
(`)
(%)
(x)
(x)
(x)
FY2016E
264,038
13.8
11,105
34.5
17.6
11.5
2.0
0.6
FY2017E
297,882
13.9
12,521
38.9
16.8
10.2
1.7
0.6
Banco Products (CMP: `130/ TP: -/ Upside: -)
For 2QFY2016, Banco has posted a good set of numbers. The Consolidated top-
line has grown by 5.8% yoy to `329cr, against our expectation of `320 cr. The
operating performance has improved led by 238bp yoy decline in raw material
cost to `51.8% of sales and employee expense declining by 137bp yoy to 12.3%
of sales. The other expenses have increased by 194bp yoy to 23.2% of sales
resulting in 181bp yoy expansion in EBITDA margin to 12.6%. We had built in an
estimate of 12.1%. The other income was lower as last year the company has
received the proceeds from the sale of cement business. Adjusting for that the
bottom-line grew by 40.7% yoy to `25cr vis-à-vis our estimate of `24cr.
The company had been facing issues in the past year in terms of subdued
environment in Europe affecting its Netherland subsidiary, which accounts for
33.0% of total top-line and Euro depreciation against the Rupee adding to the
assault. There have been a slew of management changes within the company over
the past year.
At the current market price, the stock is trading at 8.4x its FY2017E earnings. We
maintain our Neutral rating on the stock as we await more clarity from the
company and the new management.
Y/E
Sales OPM
PAT
EPS ROE P/E P/BV EV/EBITDA EV/Sales
March
(` cr)
(%)
(` cr)
(`)
(%)
(x)
(x)
(x)
(x)
FY2016E
1,208
11.7
83
11.7
12.8
11.1
1.4
6.2
0.7
FY2017E
1,353
13.0
111
15.5
15.3
8.4
1.2
4.8
0.6
Abbott India (CMP: `5,350/ TP: -/ Upside: -)
For 2QFY2016, Abbott India reported numbers that were below our estimates. The
top-line for the quarter grew by 9.6% yoy to `645cr. The same was lower than our
estimate of `680cr. The other expenses increased during the quarter by 195bp yoy
to 16.1% of sales. The raw material and employee expenses were mostly flat
resulting in EBITDA margin declining by 157bp yoy to 13.4% against our estimate
of 14.5%. Depreciation expense declined by 22.8% yoy to `3cr while other income
increased by 7.0% yoy to `13cr. The net profit during the quarter declined by 1.3%
to `62cr vis-à-vis our estimate of `73cr.
At the current market price, the stock is trading at PE of 38.1x its FY2017E
earnings. We have a Neutral view on the stock.
Y/E
Sales OPM
PAT
EPS ROE P/E P/BV EV/EBITDA EV/Sales
March
(` cr)
(%)
(` cr)
(`)
(%)
(x)
(x)
(x)
(x)
FY2016E
2,677
13.4
261
122.8
25.4
43.6
10.2
29.6
4.0
FY2017E
3,108
13.1
299
140.5
24.3
38.1
8.5
25.5
3.4
Market Outlook
November 9, 2015
TVS Srichakra (CMP: `2,803/ TP: `3,240/ Upside: 15.6%)
For 2QFY2016, TVS Srichakra reported a good set of numbers. The top-line grew
by 6.5% yoy to `522cr, against our estimate of `532cr. This is a positive
considering that it is a major 2wheeler tyre manufacturer and the 2W sales have
been lackluster in the current financial year. The EBITDA margin has expanded by
539bp yoy to 15.7% mainly due to 997bp yoy decline in raw material cost (owing
to rubber prices declining by ~6% on qoq basis). We had built in EBITDA margin
estimate of 16.1%. The company has reduced the debt significantly (from `176cr
to `37cr and is now net debt free) in 1HFY2016 and as a result its interest expense
has declined by 57.0% yoy to `4cr. Owing to better operational performance and
lower interest outgo the net profit nearly doubled to `49cr from `36cr in the same
quarter of the previous year (against our estimate of `50cr).
TVS Srichakra has been a clear cut outperformer in the Tyre industry as the 2W
replacement market seems to be unaffected by the cheaper Chinese imports. The
company has been increasing its share in the aftermarket segment which has
enabled it to post strong growth and improve its margins. We remain bullish on
the Stock as it has a leadership position in the OEM segment and will perform well
once the 2W sales improve. Currently, the stock trades at 10.4x its FY2017E
earnings. We have a Buy rating on the stock with a target price of 10.4x its
FY2017E earnings. We have a Buy rating on the stock with a target price of
`3,240 based on target PE of 12.0x.
Y/E
Sales OPM
PAT
EPS ROE P/E P/BV EV/EBITDA EV/Sales
March
(` cr)
(%)
(` cr)
(`)
(%)
(x)
(x)
(x)
(x)
FY2016E
2,101
15.7
190
248.6
53.4
11.3
4.9
6.7
1.1
FY2017E
2,338
15.0
207
270.0
39.6
10.4
3.5
6.0
0.9
MM Forgings (CMP: `515/ TP: `614/ Upside:19.2%)
For 2QFY2016, the company reported numbers that disappointed on the top-line
front. The top-line during the quarter grew marginally by 1.8% yoy to `128cr. The
same was below our estimate of `139cr. The raw material cost declined by 111bp
yoy to 39.3% of sales, but the benefits were offset by an increase in employee cost
and power costs. Employee costs and power costs rose by 162bp yoy and 17bp
yoy to 11.1% and 10.4% of sales, respectively. As a result, the EBITDA margin
witnessed a slight decline of 31bp yoy to 21.69, which is in-line our estimate of
22.0%. Consequently, the net profit remained flat at
`13cr vis-à-vis our
expectation of `15cr.
At current market price, the stock is trading at 9.2x its FY2017E earnings. We
maintain our Buy rating on the stock with a revised target price of `614 based on
a target P/E of 11.0x for FY2017E.
Y/E
Sales OPM
PAT
EPS ROE P/E P/BV EV/EBITDA EV/Sales
Mar
(` cr)
(%)
(` cr)
(`)
(%)
(x)
(x)
(x)
(x)
FY2016E
511
21.7
52
43.1 19.9 16.0
2.2
6.5
1.4
FY2017E
615
21.6
67
55.8 21.2
9.2
1.8
5.0
1.1
Market Outlook
November 9, 2015
Economic and Political News
Grand Alliance secures majority in Bihar polls
Maharashtra govt to disinvest assets in 7 loss-making PSEs
PM announces `80,000cr plan for Jammu and Kashmir
Centre to revive 50 airports in two years
Swachh Bharat Cess of 0.5% on taxable services
Corporate News
Srei Equipment Finance chalks plans for $250-million ECB
Wipro restructures media and telecom business, company veteran Ayan
Mukerji quits
Orient Green Power to exit 20MW Kolhapur power plant
Crisis-hit Tata Steel asks suppliers to slash prices
Market Outlook
November 9, 2015
Top Picks ★★★★★
Large Cap
Market Cap
CMP
Target
Upside
Company
Rationale
(` Cr)
(`)
(`)
(%)
To outpace battery industry growth due to better technological
Amara Raja Batteries
15,145
887
1,040
17.3
products leading to market share gains in both the automotive
OEM and replacement segments.
Earnings to grow strongly given the MHCV cyclical upturn.
Ashok Leyland
24,916
88
111
26.8
Focus on exports and LCV's provides additional growth
avenue.
Healthy pace of branch expansion, backed by distribution
Axis Bank
110,535
465
630
35.5
network, will be the driving force for the bank’s retail business
and overall earnings.
The stock is trading at attractive valuations and is factoring all
HCL Tech
124,478
885
1,132
27.9
the bad news.
Strong visibility for a robust 20% earnings trajectory, coupled
HDFC Bank
272,166
1,081
1,262
16.8
with high quality of earnings on account of high quality retail
business and strategic focus on highly rated corporates.
Due to its robust franchise and capital adequacy position, the
bank is well positioned to grow by at least a few percentage
ICICI Bank
155,326
267
348
30.0
points higher than the average industry growth rate from a
structural point of view.
Back on the growth trend, expect a long term growth of 14%
Infosys
261,404
1,138
1,306
14.8
to be a US$20bn in FY2020.
Well positioned to benefit from such expected gradual
recovery in the overall domestic capex cycle, given its presence
Larsen & Toubro
128,189
1,377
1,646
19.5
across various infrastructure segments, its execution
capabilities, and its strong balance sheet.
LICHF continues to grow its retail loan book at a healthy pace
with improvement in asset quality. We expect the company to
LIC Housing Finance
23,608
468
571
22.0
post a healthy loan book which is likely to reflect in a strong
earnings growth.
Source: Company, Angel Research
Mid Cap
Market Cap
CMP
Target
Upside
Company
Rationale
(` Cr)
(`)
(`)
(%)
Government thrust on Renewable sector and strong order
Inox Wind
8,384
378
505
33.7
book would drive future growth.
Change in business focus towards high-margin chronic and
Ipca labs
8,870
703
900
28.0
lifestyle segments and increasing penetration in Europe and
US
Economic recovery to have favourable impact on advertising &
circulation revenue growth. Further, the acquisition of a radio
Jagran Prakashan
4,678
143
169
18.1
business (Radio City) would also boost the company's revenue
growth.
Strong brand & quality teaching with innovative technologies
MT Educare
534
134
169
25.9
& higher government educational spending to boost growth
Earnings boost on back of stable material prices and
Radico Khaitan
1,374
103
119
15.2
favourable pricing environment. Valuation discount to peers
provides additional comfort
Strong brands and distribution network would boost growth
Siyaram Silk Mills
866
924
1,145
23.9
going ahead. Stock currently trades at an inexpensive
valuation.
Structural shift in the Lighting industry towards LED lighting will
Surya Roshni
556
127
183
44.3
drive growth.
Source: Company, Angel Research
Market Outlook
November 9, 2015
Quarterly Bloomberg Brokers Consensus Estimate
Bank of India - November 9, 2015
Particulars (` cr)
2QFY16E
2QFY15
y-o-y (%)
1QFY16
q-o-q (%)
PAT
362
786
(53.9)
130
179.1
Bharat Petroleum Corp Ltd - November 9, 2015
Particulars (` cr)
2QFY16E
2QFY15
y-o-y (%)
1QFY16
q-o-q (%)
Net sales
43,158
61,979
(30.4)
51,917
(16.9)
EBITDA
1,674
1,118
49.8
3,818
(56.2)
EBITDA margin (%)
3.9
1.8
7.4
Net profit
989
464
113.1
2,376
(58.4)
Hindustan Petroleum Corp Ltd - November 9, 2015
Particulars (` cr)
2QFY16E
2QFY15
y-o-y (%)
1QFY16
q-o-q (%)
Net sales
42,205
51,633
(18.3)
51,720
(18.4)
EBITDA
1,185
1,600
(25.9)
3,063
(61.3)
EBITDA margin (%)
2.8
3.1
5.9
Net profit
493
850
(42.0)
1,588
(69.0)
NHPC Ltd - November 9, 2015
Particulars (` cr)
2QFY16E
2QFY15
y-o-y (%)
1QFY16
q-o-q (%)
Net sales
2,238
2,086
7.3
1,986
12.7
EBITDA
1,430
1,288
11.0
1,253
14.1
EBITDA margin (%)
63.9
61.7
63.1
Net profit
842
684
23.1
767
9.8
Rural Electrification Corp Ltd - November 9, 2015
Particulars (` cr)
2QFY16E
2QFY15
y-o-y (%)
1QFY16
q-o-q (%)
PAT
1,540
1,501
2.6
1,479
4.2
Tata Power Co Ltd (Consol.) - November 9, 2015
Particulars (` cr)
2QFY16E
2QFY15
y-o-y (%)
1QFY16
q-o-q (%)
Net sales
8,747
8,364
4.6
9,112
(4.0)
EBITDA
1,824
1,692
7.8
1,955
(6.7)
EBITDA margin (%)
20.9
20.2
21.5
Net profit
189
(32)
(684.4)
322
(41.4)
Market Outlook
November 9, 2015
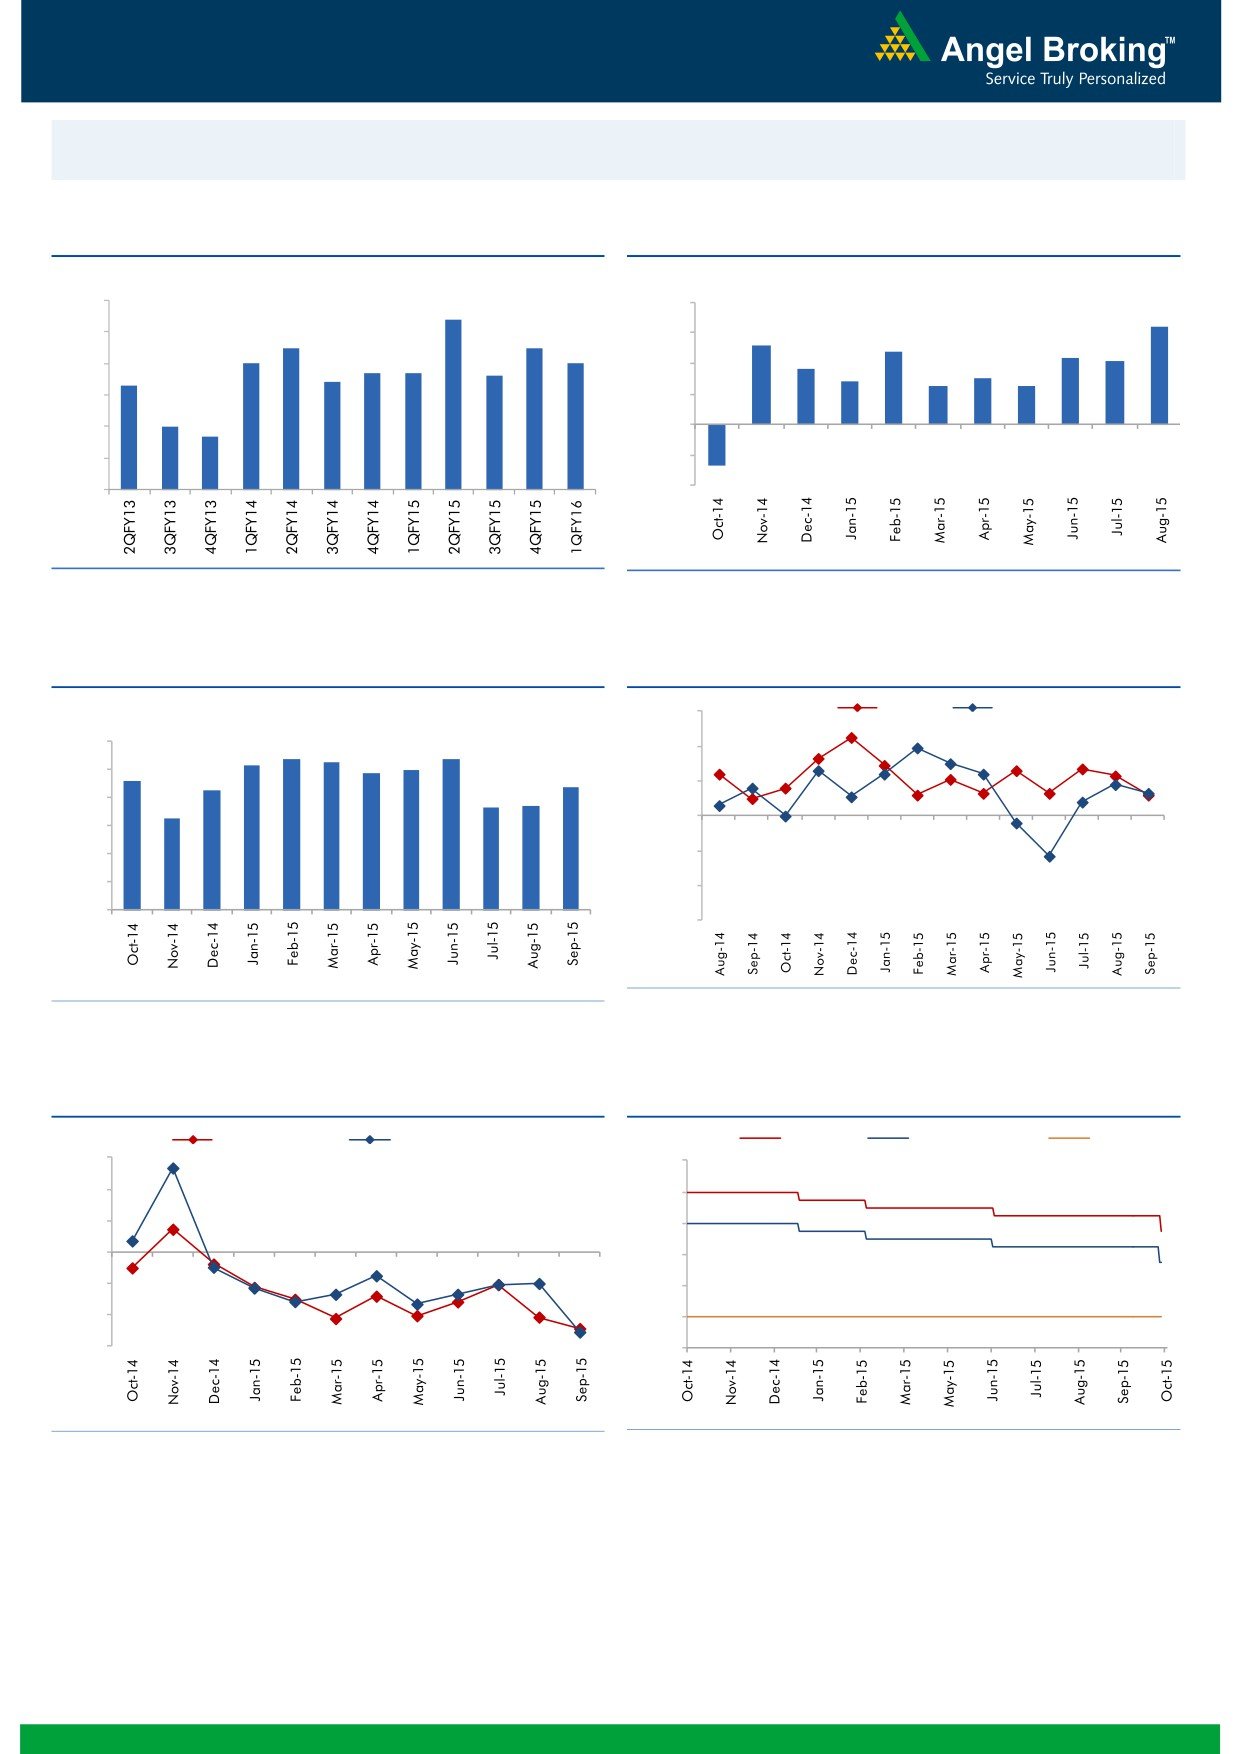
Macro watch
Exhibit 1: Quarterly GDP trends
Exhibit 2: IIP trends
(%)
(%)
9.0
8.4
8.0
6.4
7.5
7.5
5.2
8.0
6.0
4.8
7.0
7.0
4.4
4.1
6.7
6.7
3.6
7.0
6.4
6.6
4.0
2.8
3.0
6.3
2.5
2.5
6.0
2.0
5.0
4.7
5.0
-
4.0
(2.0)
3.0
(4.0)
(2.7)
Source: CSO, Angel Research
Source: MOSPI, Angel Research
Exhibit 3: Monthly CPI inflation trends
Exhibit 4: Manufacturing and services PMI
(%)
56.0
Mfg. PMI
Services PMI
6.0
5.4
5.3
5.4
54.0
5.2
5.0
4.9
4.6
5.0
4.3
4.4
52.0
3.7
3.7
4.0
3.3
50.0
3.0
2.0
48.0
1.0
46.0
-
44.0
Source: Market, Angel Research; Note: Level above 50 indicates expansion
Source: MOSPI, Angel Research
Exhibit 5: Exports and imports growth trends
Exhibit 6: Key policy rates
(%)
Exports yoy growth
Imports yoy growth
(%)
Repo rate
Reverse Repo rate
CRR
30.0
9.00
20.0
8.00
10.0
7.00
0.0
6.00
(10.0)
5.00
(20.0)
4.00
(30.0)
3.00
Source: Bloomberg, Angel Research
Source: RBI, Angel Research
Market Outlook
November 9, 2015
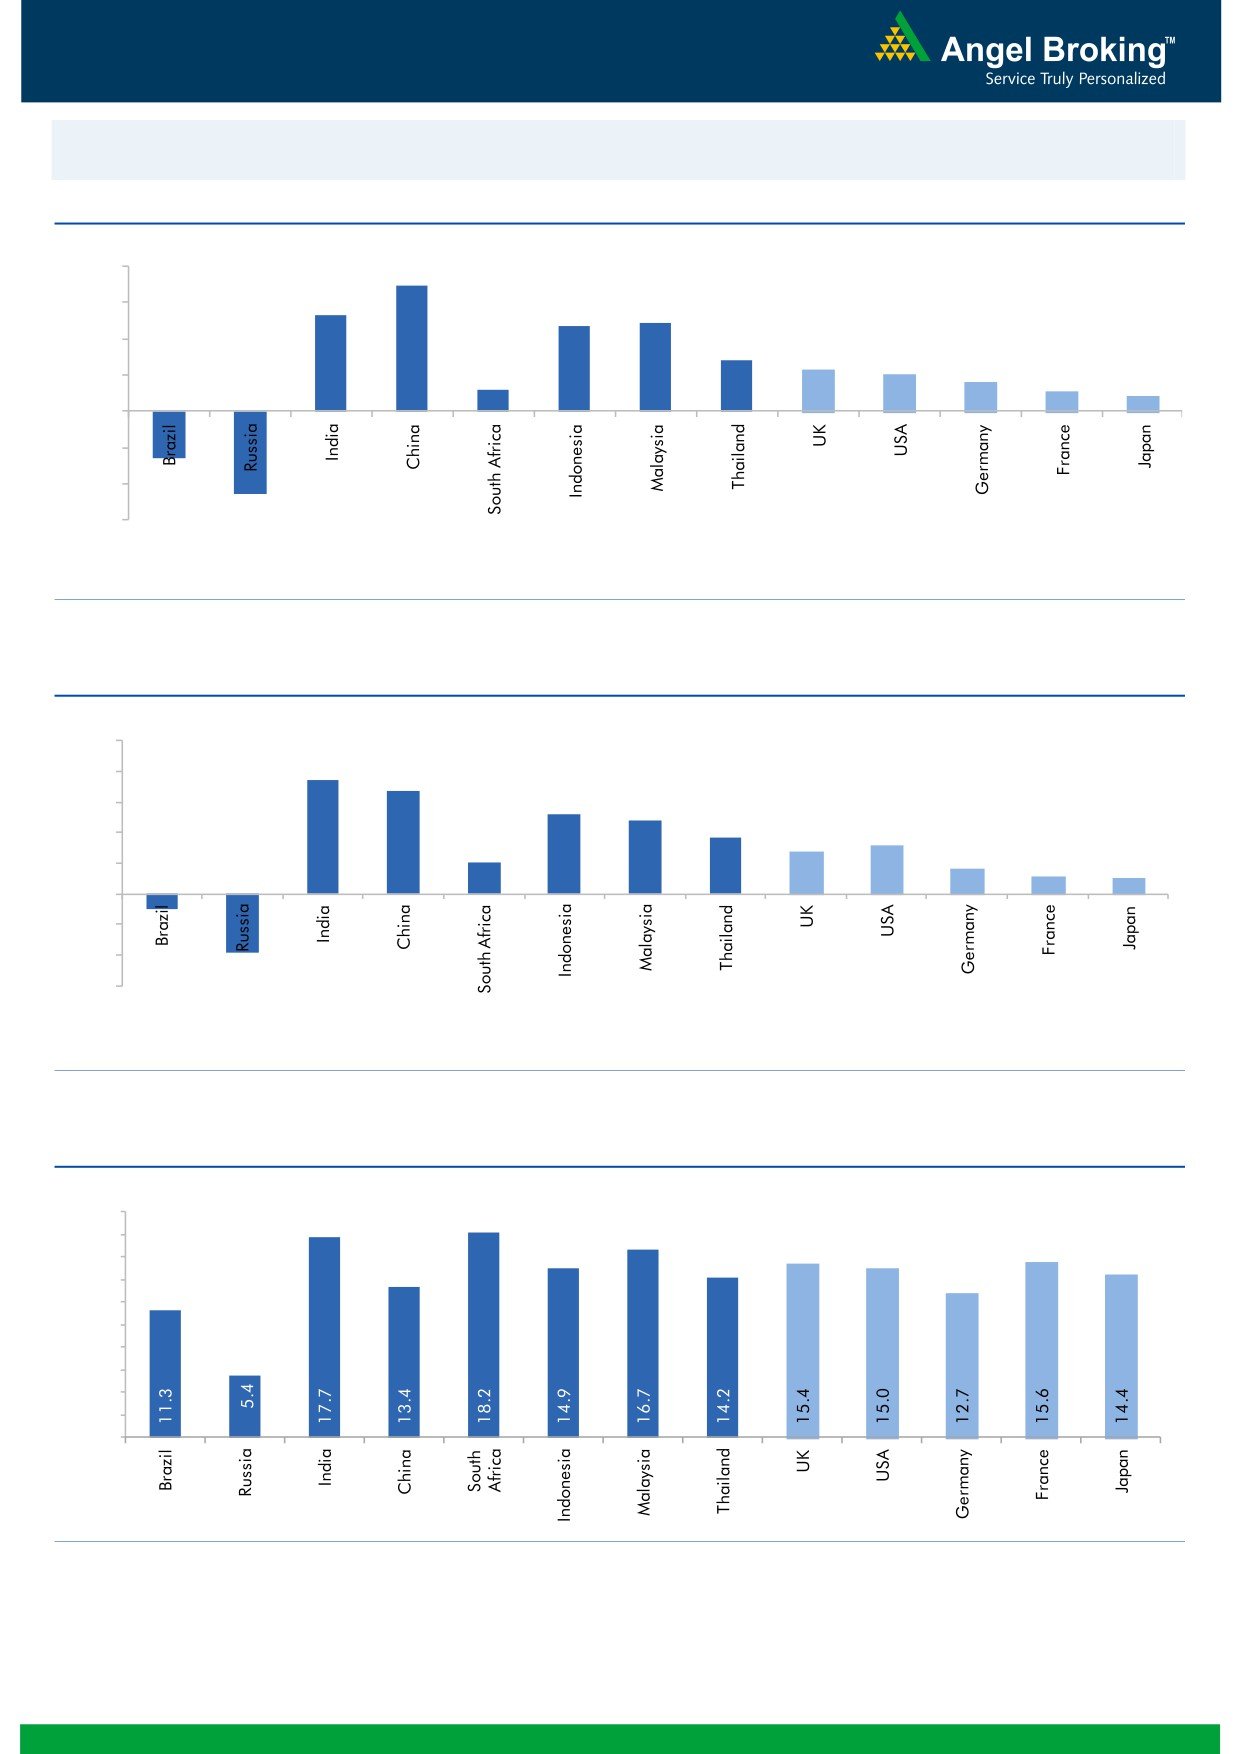
Global watch
Exhibit 1: Latest quarterly GDP Growth (%, yoy) across select developing and developed countries
(%)
8.0
6.9
5.3
6.0
4.9
4.7
4.0
2.8
2.3
2.0
1.6
2.0
1.2
1.1
0.8
(2.6)
-
(2.0)
(4.0)
(4.6)
(6.0)
Source: Bloomberg, Angel Research
Exhibit 2: 2015 GDP Growth projection by IMF (%, yoy) across select developing and developed countries
(%)
10.0
7.5
8.0
6.8
5.2
6.0
4.8
3.7
3.1
4.0
2.7
2.0
1.6
2.0
1.2
1.0
-
(2.0)
(4.0)
(1.0)
(3.8)
(6.0)
Source: IMF, Angel Research
Exhibit 3: One year forward P-E ratio across select developing and developed countries
(x)
20.0
18.0
16.0
14.0
12.0
10.0
8.0
6.0
4.0
2.0
-
Source: IMF, Angel Research
Market Outlook
November 9, 2015
Exhibit 4: Relative performance of indices across globe
Returns (%)
Country
Name of index
Closing price
1M
3M
1YR
Brazil
Bovespa
47,417
(3.2)
(3.5)
(10.8)
Russia
Micex
1,754
1.5
3.1
15.8
India
Nifty
7,954
(2.3)
(6.7)
(4.7)
China
Shanghai Composite
3,590
12.8
(8.6)
48.5
South Africa
Top 40
47,541
0.6
2.0
5.3
Mexico
Mexbol
45,244
2.1
(0.2)
1.6
Indonesia
LQ45
784
(1.6)
(3.0)
(7.1)
Malaysia
KLCI
1,686
(1.4)
1.9
(7.8)
Thailand
SET 50
914
(0.7)
(1.5)
(12.4)
USA
Dow Jones
17,910
4.8
1.7
1.9
UK
FTSE
6,364
(1.0)
(5.7)
(3.3)
Japan
Nikkei
19,266
4.5
(7.4)
14.1
Germany
DAX
10,988
8.6
(5.3)
17.5
France
CAC
4,984
6.3
(4.1)
18.0
Source: Bloomberg, Angel Research
Stock Watch
November 09, 2015
Company Name
Reco
CMP
Target
Mkt Cap
Sales ( Čcr )
OPM(%)
EPS (Č)
PER(x)
P/BV(x)
RoE(%)
EV/Sales(x)
(Č)
Price ( Č)
( Č cr )
FY16E FY17E
FY16E
FY17E
FY16E
FY17E
FY16E
FY17E
FY16E
FY17E
FY16E
FY17E
FY16E
FY17E
Agri / Agri Chemical
Rallis
Neutral
196
-
3,810
2,075
2,394
14.4
14.4
9.5
11.0
20.6
17.8
4.1
3.5
21.1
21.3
1.9
1.6
United Phosphorus
Buy
448
510
19,219
13,698
15,752
17.6
17.6
32.1
38.5
14.0
11.7
2.7
2.3
21.4
21.3
1.5
1.2
Auto & Auto Ancillary
Ashok Leyland
Buy
88
111
24,916
18,763
22,357
11.1
11.2
3.6
4.8
24.3
18.2
4.5
4.1
18.7
22.6
1.3
1.0
Bajaj Auto
Accumulate
2,423
2,672
70,111
24,115
27,600
21.3
21.0
136.8
157.2
17.7
15.4
5.7
4.9
32.2
31.5
2.5
2.1
Eicher Motors
Buy
16,693
22,900
45,308
11,809
15,609
15.5
17.0
362.9
567.0
46.0
29.4
14.0
10.4
30.1
35.0
4.0
3.0
Hero Motocorp
Neutral
2,633
-
52,576
28,561
31,559
14.7
14.7
151.1
163.2
17.4
16.1
6.8
5.8
38.7
35.6
1.7
1.5
L G Balakrishnan & Bros Neutral
470
-
738
1,254
1,394
11.6
11.8
35.9
41.7
13.1
11.3
1.8
1.6
13.5
13.8
0.7
0.6
Mahindra and Mahindra Neutral
1,248
-
77,522
37,231
41,710
12.4
12.8
48.8
58.3
25.6
21.4
3.6
3.2
14.0
14.9
1.8
1.5
Maruti
Accumulate
4,523
4,960
136,628
57,865
68,104
16.4
16.7
176.3
225.5
25.7
20.1
5.0
4.2
19.4
21.2
2.1
1.8
Minda Industries
Accumulate
749
809
1,188
2,567
2,965
8.0
8.3
46.1
57.8
16.3
13.0
2.7
2.2
16.7
17.3
0.5
0.4
Rane Brake Lining
Accumulate
333
366
263
454
511
11.1
11.4
23.8
28.1
14.0
11.8
2.0
1.8
14.2
15.3
0.7
0.6
Setco Automotive
Neutral
211
-
563
594
741
12.7
13.7
8.4
15.8
25.1
13.3
2.6
2.3
10.4
16.9
1.4
1.2
Tata Motors
Accumulate
396
424
114,405
264,038
297,882
13.8
13.9
34.5
38.9
11.5
10.2
1.9
1.6
17.6
16.8
0.6
0.6
TVS Motor
Accumulate
283
313
13,438
11,845
14,040
7.2
9.0
10.4
17.4
27.2
16.3
6.8
5.2
25.1
32.0
1.1
0.9
Amara Raja Batteries
Buy
887
1,040
15,145
4,892
5,871
17.4
17.6
28.8
37.1
30.8
23.9
7.2
5.8
23.4
24.1
3.0
2.5
Exide Industries
Accumulate
143
162
12,164
6,950
7,784
14.4
14.8
6.6
7.3
21.7
19.6
2.7
2.5
12.6
12.8
1.5
1.3
Apollo Tyres
Neutral
159
-
8,081
12,576
12,978
16.8
16.1
22.3
19.9
7.1
8.0
1.2
1.1
17.2
13.4
0.7
0.8
Ceat
Accumulate
1,015
1,119
4,107
6,041
6,597
14.1
13.7
99.5
111.9
10.2
9.1
2.0
1.7
19.6
18.5
0.8
0.7
JK Tyres
Neutral
93
-
2,108
7,446
7,669
15.2
14.0
19.6
18.4
4.7
5.1
1.2
1.0
25.2
19.5
0.7
0.6
Swaraj Engines
Neutral
945
-
1,173
552
630
14.2
14.7
44.6
54.1
21.2
17.5
4.9
4.5
23.2
25.6
2.0
1.7
Subros
Neutral
84
-
502
1,268
1,488
11.6
11.9
3.7
6.6
22.6
12.7
1.5
1.4
6.8
11.4
0.7
0.6
Indag Rubber
Neutral
194
-
508
283
329
17.0
17.2
13.0
15.4
14.9
12.5
3.3
2.7
21.8
21.6
1.6
1.3
Capital Goods
ACE
Neutral
43
-
428
660
839
4.7
8.2
1.0
3.9
43.3
11.1
1.4
1.2
3.2
11.3
0.8
0.6
BEML
Neutral
1,109
-
4,617
3,277
4,006
6.0
8.9
29.2
64.3
38.0
17.2
2.1
1.9
5.7
11.7
1.5
1.2
BGR Energy
Neutral
109
-
785
3,615
3,181
9.5
9.4
16.7
12.4
6.5
8.8
0.6
0.6
10.0
7.0
0.6
0.8
BHEL
Neutral
192
-
46,945
33,722
35,272
10.8
11.7
10.5
14.2
18.3
13.5
1.4
1.3
7.0
9.0
1.5
1.4
Blue Star
Accumulate
352
382
3,162
3,624
4,157
5.3
6.0
9.6
14.5
36.5
24.3
6.7
5.7
18.6
25.4
1.0
0.9
Crompton Greaves
Buy
169
204
10,586
13,484
14,687
4.9
6.2
4.5
7.1
37.5
23.8
2.7
2.5
7.2
10.8
0.9
0.8
Inox Wind
Buy
378
505
8,384
4,980
5,943
17.0
17.5
26.6
31.6
14.2
12.0
4.2
3.1
35.0
30.0
1.9
1.5
Stock Watch
November 09, 2015
Company Name
Reco
CMP
Target
Mkt Cap
Sales ( Čcr )
OPM(%)
EPS (Č)
PER(x)
P/BV(x)
RoE(%)
EV/Sales(x)
(Č)
Price ( Č)
( Č cr )
FY16E
FY17E
FY16E
FY17E
FY16E
FY17E
FY16E
FY17E
FY16E
FY17E
FY16E
FY17E
FY16E
FY17E
Capital Goods
KEC International
Neutral
137
-
3,523
8,791
9,716
6.1
6.8
5.4
8.2
25.4
16.7
2.5
2.3
10.0
14.0
0.6
0.6
Thermax
Neutral
848
-
10,107
6,413
7,525
7.4
8.5
30.5
39.3
27.8
21.6
4.3
3.7
15.0
17.0
1.6
1.3
Cement
ACC
Buy
1,386
1,630
26,016
13,151
14,757
16.4
18.3
63.9
83.4
21.7
16.6
2.8
2.6
13.3
16.1
1.8
1.5
Ambuja Cements
Accumulate
210
233
32,559
11,564
12,556
19.4
20.7
8.9
10.1
23.6
20.8
3.0
2.8
12.8
13.8
2.4
2.2
India Cements
Buy
79
112
2,419
4,216
4,840
18.0
19.5
4.0
9.9
19.7
8.0
0.8
0.7
4.0
9.5
0.9
0.7
JK Cement
Accumulate
648
744
4,528
3,661
4,742
10.1
15.8
18.0
61.0
36.0
10.6
2.6
2.3
7.5
22.9
1.7
1.3
J K Lakshmi Cement
Buy
354
430
4,168
2,947
3,616
16.7
19.9
11.5
27.2
30.8
13.0
2.9
2.5
9.8
20.8
1.8
1.5
Mangalam Cements
Neutral
209
-
557
1,053
1,347
10.5
13.3
8.4
26.0
24.9
8.0
1.1
1.0
4.3
12.5
0.9
0.7
Orient Cement
Accumulate
164
183
3,351
1,854
2,524
21.2
22.2
7.7
11.1
21.2
14.7
3.1
2.6
13.3
15.7
2.6
1.8
Ramco Cements
Neutral
374
-
8,898
4,036
4,545
20.8
21.3
15.1
18.8
24.8
19.9
3.0
2.7
12.9
14.3
2.7
2.3
Shree Cement^
Neutral
11,999
-
41,800
7,150
8,742
26.7
28.6
228.0
345.5
52.6
34.7
7.8
6.5
15.7
20.3
5.6
4.5
UltraTech Cement
Buy
2,792
3,282
76,604
25,021
30,023
19.1
21.6
89.0
132.0
31.4
21.2
3.6
3.2
12.2
15.9
3.2
2.7
Construction
ITNL
Neutral
90
-
2,957
7,360
8,825
34.0
35.9
1.0
5.0
89.9
18.0
0.4
0.4
0.3
1.4
3.8
3.7
KNR Constructions
Neutral
561
-
1,577
915
1,479
14.3
13.9
20.3
37.2
27.6
15.1
2.5
2.2
9.6
15.6
1.9
1.2
Larsen & Toubro
Buy
1,377
1,646
128,189
64,148
73,241
11.5
11.7
62.0
66.0
22.2
20.9
2.3
2.1
13.4
14.0
2.2
1.9
Gujarat Pipavav Port
Neutral
165
-
7,960
629
684
51.0
52.2
6.4
5.9
25.7
27.9
3.4
3.1
15.9
12.7
12.2
11.0
MBL Infrastructures
Buy
212
285
881
2,313
2,797
12.2
14.6
19.0
20.0
11.2
10.6
1.2
1.1
11.3
10.6
1.1
1.0
Nagarjuna Const.
Neutral
74
-
4,108
7,892
8,842
8.3
9.1
2.4
5.3
30.8
13.9
1.2
1.2
4.2
8.6
0.8
0.7
PNC Infratech
Neutral
523
-
2,681
1,798
2,132
13.2
13.5
22.0
30.0
23.8
17.4
2.1
1.9
11.5
11.4
1.6
1.3
Simplex Infra
Neutral
307
-
1,519
6,241
7,008
10.4
10.7
20.0
36.0
15.4
8.5
1.3
1.1
6.8
11.1
0.8
0.6
Financials
Allahabad Bank
Neutral
74
-
4,471
8,332
9,259
2.8
2.8
21.0
25.6
3.5
2.9
0.4
0.3
9.8
10.9
-
-
Axis Bank
Buy
465
630
110,535
26,473
31,527
3.5
3.6
35.7
43.5
13.0
10.7
2.5
2.2
17.9
18.9
-
-
Bank of Baroda
Neutral
167
-
38,572
19,105
21,474
2.0
2.0
19.1
24.8
8.8
6.8
0.9
0.8
10.2
12.1
-
-
Bank of India
Neutral
134
-
10,643
15,972
17,271
1.9
2.0
15.3
33.4
8.8
4.0
0.4
0.3
3.6
7.6
-
-
Canara Bank
Neutral
275
-
14,930
15,251
16,725
2.0
2.0
59.3
68.6
4.6
4.0
0.5
0.4
10.1
10.7
-
-
Dena Bank
Neutral
43
-
2,421
3,440
3,840
2.1
2.3
7.3
10.0
6.0
4.3
0.5
0.4
6.1
7.9
-
-
Federal Bank
Neutral
55
-
9,372
3,477
3,999
3.0
3.0
5.0
6.2
10.9
8.8
1.1
1.0
10.6
11.9
-
-
HDFC
Neutral
1,206
-
190,244
10,358
11,852
3.3
3.3
41.1
47.0
29.4
25.6
5.6
5.1
24.7
24.9
-
-
HDFC Bank
Buy
1,081
1,262
272,166
38,309
47,302
4.3
4.3
49.3
61.1
21.9
17.7
3.8
3.3
18.5
19.7
-
-
Stock Watch
November 09, 2015
Company Name
Reco
CMP
Target
Mkt Cap
Sales ( Čcr )
OPM(%)
EPS (Č)
PER(x)
P/BV(x)
RoE(%)
EV/Sales(x)
(Č)
Price ( Č)
( Č cr )
FY16E
FY17E
FY16E
FY17E
FY16E
FY17E
FY16E
FY17E
FY16E
FY17E
FY16E
FY17E
FY16E
FY17E
Financials
ICICI Bank
Buy
267
348
155,326
35,168
40,517
3.4
3.4
21.4
25.2
12.5
10.6
2.1
1.8
14.7
15.2
-
-
IDBI Bank
Neutral
85
-
13,578
9,625
10,455
1.8
1.8
8.5
14.2
9.9
6.0
0.6
0.6
5.9
9.3
-
-
Indian Bank
Neutral
128
-
6,138
6,160
6,858
2.5
2.5
24.5
29.8
5.2
4.3
0.4
0.4
7.7
8.6
-
-
LIC Housing Finance
Buy
468
571
23,608
3,101
3,745
2.5
2.5
33.0
40.2
14.2
11.7
2.7
2.3
19.7
20.5
-
-
Oriental Bank
Neutral
145
-
4,355
7,643
8,373
2.4
2.4
37.2
45.4
3.9
3.2
0.3
0.3
8.2
9.4
-
-
Punjab Natl.Bank
Neutral
133
-
26,077
23,638
26,557
2.8
2.8
17.9
27.2
7.4
4.9
0.7
0.6
8.5
12.0
-
-
South Ind.Bank
Neutral
21
-
2,775
1,965
2,185
2.5
2.5
2.5
3.3
8.3
6.2
0.8
0.7
9.5
11.7
-
-
St Bk of India
Buy
243
283
188,830
82,520
93,299
2.7
2.8
20.0
24.5
12.1
9.9
1.3
1.2
11.5
12.8
-
-
Union Bank
Neutral
163
-
11,205
12,646
14,129
2.3
2.4
31.0
39.1
5.3
4.2
0.6
0.5
9.8
11.4
-
-
Vijaya Bank
Neutral
34
-
2,921
3,536
3,827
1.9
1.9
5.5
6.7
6.2
5.1
0.5
0.5
7.8
8.8
-
-
Yes Bank
Buy
758
914
31,762
7,228
9,043
3.2
3.3
57.7
69.4
13.1
10.9
2.3
2.0
19.1
19.6
-
-
FMCG
Asian Paints
Neutral
802
-
76,947
16,553
19,160
16.0
16.2
17.7
21.5
45.4
37.3
12.1
10.8
29.4
31.2
4.5
3.9
Britannia
Neutral
3,123
-
37,470
8,065
9,395
9.6
10.2
47.2
65.5
66.2
47.7
22.0
20.8
38.3
41.2
4.6
3.9
Colgate
Neutral
939
-
25,533
4,836
5,490
19.5
19.7
48.5
53.2
19.4
17.6
14.2
12.4
99.8
97.5
5.2
4.6
Dabur India
Neutral
268
-
46,995
9,370
10,265
17.1
17.2
7.3
8.1
36.5
33.0
11.0
9.0
33.7
30.6
4.9
4.5
GlaxoSmith Con*
Neutral
5,902
-
24,820
4,919
5,742
17.2
17.4
168.3
191.2
35.1
30.9
10.0
8.5
28.8
28.9
4.6
3.9
Godrej Consumer
Neutral
1,304
-
44,392
10,168
12,886
16.1
16.1
32.1
38.4
40.6
34.0
8.3
7.6
19.7
21.0
4.3
3.4
HUL
Neutral
799
-
172,861
34,940
38,957
17.5
17.7
20.8
24.7
38.4
32.3
42.7
34.1
110.5
114.2
4.8
4.3
ITC
Buy
337
409
270,413
41,068
45,068
37.8
37.4
13.9
15.9
24.2
21.2
8.1
7.1
34.1
33.8
6.2
5.6
Marico
Neutral
403
-
25,968
6,551
7,766
15.7
16.0
10.4
12.5
38.8
32.2
11.3
9.4
33.2
32.4
3.9
3.3
Nestle*
Accumulate
6,172
6,646
59,506
11,291
12,847
22.2
22.3
158.9
184.6
38.8
33.4
20.3
18.3
55.0
57.3
5.1
4.5
Tata Global
Accumulate
126
144
7,933
8,635
9,072
9.8
9.9
6.5
7.6
19.4
16.6
1.9
1.9
6.8
7.4
0.9
0.8
IT
HCL Tech^
Buy
885
1,132
124,478
42,038
47,503
23.2
23.5
55.8
62.9
15.9
14.1
3.6
2.8
23.0
19.8
2.5
2.0
Infosys
Buy
1,138
1,306
261,404
60,250
66,999
28.0
28.0
58.3
63.7
19.5
17.9
4.1
3.5
20.9
19.7
3.6
3.1
TCS
Buy
2,506
3,165
493,740
111,274
126,852
28.4
28.7
125.4
143.9
20.0
17.4
7.9
7.3
39.9
42.2
4.0
3.5
Tech Mahindra
Buy
533
646
51,252
25,566
28,890
16.0
17.0
26.3
31.9
20.3
16.7
3.6
3.1
17.9
18.6
1.8
1.5
Wipro
Buy
572
719
141,167
52,414
58,704
23.7
23.8
38.4
42.3
14.9
13.5
2.9
2.6
19.5
18.0
2.3
1.9
Media
D B Corp
Accumulate
319
356
5,863
2,241
2,495
27.8
27.9
21.8
25.6
14.7
12.5
3.8
3.4
26.7
28.5
2.5
2.2
HT Media
Neutral
78
-
1,824
2,495
2,603
11.2
11.2
7.3
8.6
10.7
9.1
0.9
0.8
7.4
8.1
0.2
0.2
Stock Watch
November 09, 2015
Company Name
Reco
CMP
Target
Mkt Cap
Sales ( Čcr )
OPM(%)
EPS (Č)
PER(x)
P/BV(x)
RoE(%)
EV/Sales(x)
(Č)
Price ( Č)
( Č cr )
FY16E FY17E
FY16E
FY17E
FY16E
FY17E
FY16E
FY17E
FY16E
FY17E
FY16E
FY17E
FY16E
FY17E
Media
Jagran Prakashan
Buy
143
169
4,678
2,170
2,355
27.0
27.6
12.8
10.3
11.2
13.9
3.1
2.9
21.8
19.4
1.9
1.6
Sun TV Network
Neutral
364
-
14,349
2,779
3,196
70.2
70.5
22.8
27.3
16.0
13.3
3.9
3.6
26.7
28.3
5.2
4.5
Hindustan Media
Neutral
279
-
2,049
920
1,031
20.0
20.0
19.2
20.9
14.5
13.4
2.4
2.1
16.4
15.3
1.7
1.5
Ventures
Metals & Mining
Coal India
Buy
342
400
215,799
77,508
85,330
21.4
23.7
24.8
27.6
13.8
12.4
5.3
5.0
38.6
41.6
2.1
1.8
Hind. Zinc
Accumulate
153
175
64,626
14,641
14,026
50.4
50.4
17.7
16.0
8.7
9.6
1.3
1.2
16.2
13.2
2.1
1.9
Hindalco
Neutral
81
-
16,706
104,356
111,186
8.7
9.5
6.7
11.1
12.0
7.3
0.4
0.4
3.5
5.9
0.7
0.6
JSW Steel
Neutral
872
-
21,083
42,308
45,147
16.4
20.7
(10.3)
49.5
17.6
1.0
0.9
(1.0)
5.6
1.5
1.4
NMDC
Neutral
93
-
36,912
8,237
10,893
46.6
44.5
10.0
11.7
9.4
8.0
1.0
0.9
12.5
13.0
4.3
3.3
SAIL
Neutral
47
-
19,453
45,915
53,954
7.2
10.5
1.5
4.4
31.3
10.8
0.5
0.4
2.3
4.1
1.1
1.0
Vedanta
Neutral
92
-
27,349
71,445
81,910
26.2
26.3
12.9
19.2
7.2
4.8
0.5
0.4
7.2
8.9
0.8
0.6
Tata Steel
Neutral
220
-
21,376
126,760
137,307
8.9
11.3
6.4
23.1
34.6
9.5
0.7
0.7
2.0
7.1
0.8
0.7
Oil & Gas
Cairn India
Neutral
151
-
28,254
11,323
12,490
49.4
51.0
20.7
20.7
7.3
7.3
0.5
0.5
6.4
6.1
1.6
0.9
GAIL
Neutral
289
-
36,615
64,856
70,933
9.1
9.6
24.0
28.9
12.1
10.0
1.0
1.0
8.8
9.6
0.8
0.7
ONGC
Neutral
252
-
215,513
154,564
167,321
36.8
37.4
28.6
32.5
8.8
7.8
1.1
1.0
12.7
13.5
1.6
1.5
Petronet LNG
Neutral
201
-
15,094
29,691
31,188
5.8
6.2
12.8
13.4
15.7
15.0
2.4
2.1
15.8
14.8
0.6
0.5
Indian Oil Corp
Accumulate
412
455
99,947
359,607
402,760
5.9
6.1
42.5
48.7
9.7
8.5
1.3
1.2
14.1
14.4
0.4
0.3
Reliance Industries
Accumulate
952
1,050
308,444
304,775
344,392
12.6
13.4
91.3
102.6
10.4
9.3
1.2
1.1
11.8
12.0
0.9
0.8
Pharmaceuticals
Alembic Pharma
Neutral
667
-
12,566
2,601
3,115
21.2
20.2
20.8
23.9
32.1
27.9
10.3
7.8
37.2
31.8
4.9
4.0
Aurobindo Pharma
Accumulate
813
872
47,491
14,923
17,162
23.0
23.0
38.2
43.6
21.3
18.7
6.6
4.9
36.0
30.2
3.6
3.0
Aventis*
Neutral
4,310
-
9,926
2,082
2,371
17.4
20.8
118.2
151.5
36.5
28.5
5.3
4.3
19.9
25.5
4.4
3.7
Cadila Healthcare
Neutral
411
-
42,096
10,224
11,840
21.0
22.0
14.6
17.6
28.2
23.4
7.7
6.0
30.8
29.0
4.4
3.7
Cipla
Neutral
658
-
52,840
14,359
16,884
21.3
19.7
28.4
30.5
23.2
21.6
4.1
3.5
19.3
17.5
3.7
3.1
Dr Reddy's
Neutral
3,630
-
61,890
18,213
21,214
22.6
22.7
163.0
192.5
22.3
18.9
4.6
3.8
22.5
20.0
3.9
3.3
Dishman Pharma
Neutral
388
-
3,132
1,716
1,888
20.2
20.2
16.3
21.6
23.8
18.0
2.2
2.0
9.7
11.7
2.1
1.7
GSK Pharma*
Neutral
3,192
-
27,036
2,870
3,158
20.0
22.1
59.5
68.3
53.6
46.7
15.8
16.3
28.5
34.3
8.9
8.2
Indoco Remedies
Neutral
305
-
2,810
1,088
1,262
18.2
18.2
13.1
15.5
23.3
19.7
4.6
3.8
21.2
21.1
2.7
2.3
Ipca labs
Buy
703
900
8,870
3,363
3,909
12.9
18.6
13.4
28.0
52.5
25.1
6.8
5.5
7.4
14.0
3.0
2.6
Lupin
Neutral
1,853
-
83,432
14,864
17,244
26.9
26.9
62.1
71.1
29.8
26.1
7.2
5.7
27.4
24.6
5.3
4.4
Sun Pharma
Buy
804
950
193,405
28,163
32,610
25.8
30.7
17.4
26.9
46.2
29.9
4.4
3.8
13.0
16.6
6.4
5.3
Stock Watch
November 09, 2015
Company Name
Reco
CMP
Target
Mkt Cap
Sales ( Čcr )
OPM(%)
EPS (Č)
PER(x)
P/BV(x)
RoE(%)
EV/Sales(x)
(Č)
Price ( Č)
( Č cr )
FY16E FY17E
FY16E
FY17E
FY16E
FY17E
FY16E
FY17E
FY16E
FY17E
FY16E
FY17E
FY16E
FY17E
Power
Tata Power
Neutral
68
-
18,283
35,923
37,402
22.6
22.8
4.1
5.2
16.7
13.1
1.3
1.2
7.5
9.3
1.5
1.3
NTPC
Buy
135
157
111,520
87,064
98,846
23.5
23.5
11.7
13.2
11.6
10.3
1.3
1.2
11.4
12.1
2.3
2.1
Power Grid
Buy
131
170
68,586
20,702
23,361
86.7
86.4
12.1
13.2
10.9
9.9
1.6
1.4
15.6
15.1
8.2
7.7
Telecom
Bharti Airtel
Neutral
339
-
135,512
101,748
109,191
32.1
31.7
12.0
12.5
28.3
27.1
1.9
1.8
6.9
6.7
2.0
1.8
Idea Cellular
Neutral
139
-
50,107
34,282
36,941
32.0
31.5
5.9
6.2
23.6
22.5
2.2
2.0
9.9
9.3
2.0
1.9
zOthers
Abbott India
Neutral
5,350
-
11,369
2,715
3,153
14.5
14.1
134.3
152.2
39.9
35.1
9.9
8.2
27.4
25.6
4.0
3.4
Bajaj Electricals
Buy
239
341
2,408
4,719
5,287
5.2
5.8
8.6
12.7
27.9
18.9
3.2
2.8
11.4
14.8
0.5
0.5
Finolex Cables
Neutral
240
-
3,665
2,728
3,036
10.8
11.0
14.4
16.8
16.6
14.3
2.5
2.2
15.2
15.3
1.1
0.9
Goodyear India*
Accumulate
560
622
1,292
1,888
1,680
12.1
11.9
62.2
56.6
9.0
9.9
2.1
1.8
25.9
19.7
0.5
0.5
Hitachi
Neutral
1,347
-
3,662
1,779
2,081
7.8
8.8
21.8
33.4
61.8
40.3
10.0
8.1
17.4
22.1
2.1
1.8
Jyothy Laboratories
Neutral
305
-
5,515
1,620
1,847
11.5
11.5
7.3
8.5
41.8
35.9
5.4
5.0
13.3
14.4
3.3
2.8
MRF
Buy
38,512
45,575
16,334
20,316
14,488
21.4
21.1
5,488.0
3,798.0
7.0
10.1
2.4
1.9
41.1
21.2
0.8
1.0
Page Industries
Neutral
13,462
-
15,016
1,929
2,450
19.8
20.1
229.9
299.0
58.6
45.0
25.8
18.0
52.1
47.1
7.9
6.2
Relaxo Footwears
Neutral
503
-
6,039
1,767
2,152
12.3
12.5
19.3
25.1
26.2
20.1
6.4
4.9
27.7
27.8
3.6
2.9
Siyaram Silk Mills
Buy
924
1,145
866
1,636
1,815
11.5
11.5
89.9
104.1
10.3
8.9
1.7
1.5
17.9
17.8
0.7
0.6
Styrolution ABS India*
Neutral
717
-
1,261
1,271
1,440
8.6
9.2
32.0
41.1
22.4
17.5
2.3
2.1
10.7
12.4
1.0
0.9
Tree House
Buy
261
347
1,102
259
324
56.8
56.8
17.0
21.7
15.3
12.0
1.5
1.4
10.1
11.5
4.3
3.6
TVS Srichakra
Buy
2,803
3,210
2,146
2,127
2,388
15.2
14.9
237.7
267.5
11.8
10.5
5.0
3.6
51.7
39.8
1.1
0.9
HSIL
Accumulate
279
302
2,013
2,123
2,384
16.1
16.5
15.0
18.9
18.5
14.8
1.4
1.3
8.0
9.4
1.3
1.1
Kirloskar Engines India
Neutral
263
-
3,798
2,634
3,252
10.1
12.0
10.9
17.4
24.1
15.1
2.7
2.4
11.4
16.8
1.1
0.8
Ltd
M M Forgings
Buy
515
670
621
541
634
21.7
21.4
47.8
55.9
10.8
9.2
2.1
1.8
21.8
20.9
1.3
1.1
Banco Products (India)
Neutral
130
-
928
1,208
1,353
11.0
12.3
10.8
14.5
12.0
9.0
1.4
1.2
11.9
14.5
0.7
0.6
Competent Automobiles Neutral
135
-
83
1,007
1,114
3.1
3.1
23.7
28.2
5.7
4.8
0.8
0.7
13.9
14.6
0.1
0.1
Nilkamal
Neutral
997
-
1,487
1,910
2,083
10.5
10.3
63.3
69.2
15.7
14.4
2.6
2.2
17.6
16.5
0.9
0.8
Visaka Industries
Buy
131
166
208
1,158
1,272
8.6
9.5
23.7
32.7
5.5
4.0
0.6
0.5
10.1
12.5
0.3
0.3
Transport Corporation of
Neutral
271
-
2,059
2,830
3,350
8.8
9.0
14.4
18.3
18.8
14.8
2.9
2.5
15.4
17.1
0.9
0.7
India
Elecon Engineering
Accumulate
77
85
839
1,369
1,533
13.7
14.9
3.3
6.1
23.2
12.7
1.5
1.4
6.6
11.4
1.0
0.9
Surya Roshni
Buy
127
183
556
2,992
3,223
8.1
8.4
14.7
18.3
8.6
6.9
0.8
0.7
9.7
11.0
0.5
0.4
MT Educare
Buy
134
169
534
286
366
18.3
17.7
7.7
9.4
17.4
14.3
3.7
3.2
20.2
21.1
1.8
1.4
Stock Watch
November 09, 2015
Company Name
Reco
CMP
Target Mkt Cap
Sales ( Čcr )
OPM(%)
EPS (Č)
PER(x)
P/BV(x)
RoE(%)
EV/Sales(x)
(Č)
Price ( Č)
( Č cr )
FY16E FY17E FY16E FY17E FY16E FY17E FY16E FY17E FY16E FY17E FY16E FY17E FY16E FY17E
zOthers
Radico Khaitan
Accumulate
103
119
1,374
1,565
1,687
11.9
12.4
5.4
6.6
19.1
15.7
1.5
1.4
8.0
9.0
1.4
1.3
Garware Wall Ropes
Buy
347
423
760
875
983
10.4
10.6
23.1
27.8
15.0
12.5
2.1
1.8
14.1
14.8
0.9
0.7
Wonderla Holidays
Neutral
332
-
1,873
206
308
44.0
43.6
9.0
12.9
36.8
25.7
5.0
4.6
13.7
17.8
9.0
6.0
Linc Pen & Plastics
Accumulate
162
185
240
340
371
8.3
8.9
10.8
13.2
15.0
12.3
2.4
2.1
16.0
17.1
0.8
0.7
The Byke Hospitality
Buy
160
181
642
222
287
20.5
20.5
5.6
7.6
28.4
21.2
5.4
4.4
18.9
20.8
2.8
2.2
Source: Company, Angel Research; Note: *December year end; #September year end; &October year end; Price as on November 06, 2015
Market Outlook
November 09, 2015
Research Team Tel: 022 - 39357800
DISCLAIMER
Angel Broking Private Limited (hereinafter referred to as “Angel”) is a registered Member of National Stock Exchange of India Limited,
Bombay Stock Exchange Limited and Metropolitian Stock Exchange of India Limited. It is also registered as a Depository Participant with
CDSL and Portfolio Manager with SEBI. It also has registration with AMFI as a Mutual Fund Distributor. Angel Broking Private Limited is a
registered entity with SEBI for Research Analyst in terms of SEBI (Research Analyst) Regulations, 2014 vide registration number
INH000000164. Angel or its associates has not been debarred/ suspended by SEBI or any other regulatory authority for accessing
/dealing in securities Market. Angel or its associates including its relatives/analyst do not hold any financial interest/beneficial ownership
of more than 1% in the company covered by Analyst. Angel or its associates/analyst has not received any compensation / managed or co
-managed public offering of securities of the company covered by Analyst during the past twelve months. Angel/analyst has not served as
an officer, director or employee of company covered by Analyst and has not been engaged in market making activity of the company
covered by Analyst.
This document is solely for the personal information of the recipient, and must not be singularly used as the basis of any investment
decision. Nothing in this document should be construed as investment or financial advice. Each recipient of this document should make
such investigations as they deem necessary to arrive at an independent evaluation of an investment in the securities of the companies
referred to in this document (including the merits and risks involved), and should consult their own advisors to determine the merits and
risks of such an investment.
Reports based on technical and derivative analysis center on studying charts of a stock's price movement, outstanding positions and
trading volume, as opposed to focusing on a company's fundamentals and, as such, may not match with a report on a company's
fundamentals.
The information in this document has been printed on the basis of publicly available information, internal data and other reliable sources
believed to be true, but we do not represent that it is accurate or complete and it should not be relied on as such, as this document is for
general guidance only. Angel Broking Pvt. Limited or any of its affiliates/ group companies shall not be in any way responsible for any
loss or damage that may arise to any person from any inadvertent error in the information contained in this report. Angel Broking Pvt.
Limited has not independently verified all the information contained within this document. Accordingly, we cannot testify, nor make any
representation or warranty, express or implied, to the accuracy, contents or data contained within this document. While Angel Broking
Pvt. Limited endeavors to update on a reasonable basis the information discussed in this material, there may be regulatory, compliance,
or other reasons that prevent us from doing so.
This document is being supplied to you solely for your information, and its contents, information or data may not be reproduced,
redistributed or passed on, directly or indirectly.
Neither Angel Broking Pvt. Limited, nor its directors, employees or affiliates shall be liable for any loss or damage that may arise from or
in connection with the use of this information.
Note: Please refer to the important ‘Stock Holding Disclosure' report on the Angel website (Research Section). Also, please refer to the
latest update on respective stocks for the disclosure status in respect of those stocks. Angel Broking Pvt. Limited and its affiliates may have
investment positions in the stocks recommended in this report.