Market Outlook
October 09, 2015
Market Cues
Domestic Indices
Chg (%)
(Pts)
(Close)
Indian markets are expected to open in positive tracking the SGX Nifty and the Asian
BSE Sensex
(0.7)
(190)
26,846
cues.
Nifty
(0.6)
(48)
8,129
U.S. stocks open in negative but reacted positively to the minutes of the Fed's
Mid Cap
(1.0)
(111)
10,945
September meeting, which further offset recent uncertainty about the outlook for
Small Cap
(0.1)
(17)
11,327
interest rates. The gains on the day extended a recent upward trend, with the Dow
Bankex
(0.8)
(156)
19,957
and the S&P 500 reaching their best levels in well over a month.
The European markets ended Thursday's session with mixed results. The markets
Global Indices
Chg (%)
(Pts)
(Close)
were under pressure in early trade, following the release of another weaker than
Dow Jones
0.8
138
17,051
expected German economic report. Germany's exports declined the most in over six
years in August, raising concerns over global demand.
Nasdaq
0.4
20
4,811
FTSE
0.6
38
6,375
Indian shares fell notably on weak global cues, a sharp rebound in oil prices
Nikkei
(1.0)
(182)
18,141
overnight, weakness in rupee and the IMF's warning concerning emerging
markets prompted traders to book some profits after six days of continuous gains.
Hang Seng
(0.7)
(161)
22,355
Investors also waited for minutes from the Fed's September meeting and speeches
Shanghai Com
3.0
91
3,143
from several Fed officials scheduled later in the day for further clues on the outlook
for Fed policy.
Advances / Declines
Bse
Nse
News Analysis
Advances
1,256
1,019
Sun Pharma to focus on speciality products in US
Declines
1,502
482
Cipla ties up with Serum Institute to supply vaccines in South Africa
Unchanged
111
68
Crompton Greaves to divest shares in CG-Lucy Switchgear
Detailed analysis on Pg2
Volumes (` Cr)
Investor’s Ready Reckoner
BSE
3,092
Key Domestic & Global Indicators
NSE
15,866
Stock Watch: Latest investment recommendations on 150+ stocks
Refer Pg4 onwards
Net Inflows (` Cr)
Net
Mtd
Ytd
FII
801
897
118,962
Top Picks
MFs
157
634
79,639
CMP
Target
Upside
Company
Sector
Rating
(`)
(`)
(%)
Axis Bank
Financials
Buy
491
701
42.7
Top Gainers
Price (`)
Chg (%)
ICICI Bank
Financials
Buy
278
370
32.9
Renuka
11
8.4
Power Grid
Power
Buy
132
170
28.4
Rtnpower
8
5.0
TCS
IT
Buy
2,635
3,168
20.3
Mcleodruss
172
4.9
Aurobindo Pharma Pharmaceuticals Accumulate
751
872
16.2
More Top Picks on Pg3
Muthootfin
180
3.5
Eidparry
145
3.1
Key Upcoming Events
Previous
Consensus
Date
Region
Event Description
Reading
Expectations
Top Losers
Price (`)
Chg (%)
Oct 12
India
Imports YoY%
(9.95)
--
Infratel
410
(4.7)
India
Exports YoY%
(20.66)
--
Pmcfin
1
(4.1)
India
Industrial Production YoY
4.20
--
Divislab
1089
(4.0)
Oct 13
UK
CPI (YoY)
--
--
Glenmark
993
(3.8)
Oct 14
India
Monthly Wholesale Prices YoY%
(4.95)
--
Ibulhsgfin
755
(3.8)
Oct 15
US
Industrial Production
(0.38)
(0.30)
As on October 08, 2015
Market Outlook
October 09, 2015
Sun Pharma to focus on speciality products in US
Sun Pharma aims to enhance its presence in specialty product segment in the US.
The company derives 50% of its consolidated revenue from US market. Sun
Pharma continues to strengthen and build leadership position in key markets and
business segments. As a part of the focus towards enhancing share of
specialty/branded business and targeting differentiated product offerings, the
ophthalmic and OTC teams in the US have been strengthened. The company also
acquired exclusive rights to Merck's skin ailment drug which is under trial.
Currently we maintain our neutral rating on the stock.
Cipla ties up with Serum Institute to supply vaccines in South
Africa
Cipla has tied up with Serum Institute of India to distribute vaccines in South Africa.
The company operates in South Africa through a subsidiary and the market
contributes to about 14% of its consolidated revenue. The tie up will enable Cipla
Medpro to grow its revenue and facilitate regular supply to the South African
government. This will help company to become a significant player in the market.
With presence in 140 countries and 1.3 billion doses manufactured and sold,
Serum Institute of India is an ideal ally for Cipla Medpro and this partnership will
be instrumental
in
addressing
the
national
vaccine
shortage.
These companies already have a tie up for distribution of paediatric vaccines in
Europe. Currently we maintain our neutral rating on the stock.
Crompton Greaves to divest shares in CG-Lucy Switchgear
Crompton Greaves (CG) announced the divestment of its entire 50% shareholding
in CG Lucy Switchgear Limited to W Lucy & Co Limited, UK. The company will
divest its entire investment of `60 lakh in the share Capital of CG Lucy Switchgear
Limited (CG-Lucy) to W Lucy & Co Limited, UK for a consideration of Euro 5.5
million (approx `40cr) and the execution of consequent definitive agreements. CG
Lucy Switchgear Ltd is a 50-50 joint venture between CG and W Lucy and Co
Limited, UK. This JV has a factory situated in Nasik (Maharashtra) and is a
manufacturer for Ring Main Units (RMUs) for the India market. Post divestment,
CG will continue to have distributorship of RMUs in India and will also continue to
supply vacuum bottles and other products to CG-Lucy. The deal forms part of CG's
strategy to focus on its B2B activity in the Power HV sector. We maintain our buy
rating on the stock.
Economic and Political News
MERC revises eligibility for open access from 1 MW to 500 KW in draft
regulations
Global IT spending to surpass $3.6 tn in 2016: Gartner
Payment of $700 mn to Iran won't impact currency market: RBI
Corporate News
Large companies need to embrace start-ups: Accenture
Platinum 3G to widen Bharti Airtel's biz coverage in MP, Chhattisgarh
Why fresh tests on Maggi, asks Nestle India
Market Outlook
October 09, 2015
Top Picks ★★★★★
Large Cap
Market Cap
CMP
Target
Upside
Company
Rationale
(` Cr)
(`)
(`)
(%)
Robust US sales along with the acquisations, will aid the growth
Aurobindo
43,829
751
872
16.2
and stable margins.
Healthy pace of branch expansion, backed by distribution
Axis Bank
1,16,836
491
701
42.7
network.
Robust franchise and capital adequacy position will help the
ICICI Bank
1,61,715
278
370
32.9
bank to outperform the industry average.
Back on the growth trend; expect a long term growth of 14% to
Infosys
2,60,118
1,132
1,306
15.3
be a US$20bn in FY2020.
Government thrust on Renewable sector and strong order book
Inox Wind
8,079
364
505
38.7
would drive future growth.
LICHF continues to grow its retail loan book at a healthy pace
LIC HFL
23,971
475
570
20.0
with improvement in asset quality.
Direct beneficiary of the huge investments lined up in the power
Power Grid
69,292
132
170
28.4
transmission sector.
Growth to pick up from 2HFY2017, attractive given the risk-
TCS
5,19,159
2,635
3,168
20.3
reward.
Tech Mahindra
54,013
561
646
15.1
Acquisitions, to drive growth, normalised valuations attractive.
An improving liability franchise, capital adequacy well above
Yes Bank
30,512
729
953
30.8
Basel III requirements and lowest NPA ratio in the industry.
Source: Company, Angel Research
Mid Cap
Market Cap
CMP
Target
Upside
Company
Rationale
(` Cr)
(`)
(`)
(%)
Bajaj Electricals
2,466
244
341
39.5
Visible turnaround in E&P business to drive the earnings.
Garware Wall Ropes
759
347
390
12.4
Higher exports & easing material prices to drive profitability.
Comfortable balance sheet to support strong growth; this
MBL Infrastructures
1,012
244
360
47.5
coupled with attractive valuation to lead to rerating.
New product introductions and increased sourcing by clients to
Minda Industries
799
504
652
29.4
enable outpace industry growth.
Strong brand & quality teaching with innovative technologies &
MT Educare
543
136
169
23.9
higher government educational spending to boost growth.
Earnings boost on back of stable material prices and favorable
Radico Khaitan
1,141
86
112
30.5
pricing environment. Valuation discount to peers provides
additional comfort.
Structural shift in the Lighting industry towards LED lighting will
Surya Roshni
572
131
183
40.2
drive growth.
Tree House
1,250
295
449
52.0
Robust expansion plan for pre-schools to drive growth.
Source: Company, Angel Research
Market Outlook
October 09, 2015
Quarterly Bloomberg Brokers Consensus Estimate
IndusInd Bank Ltd - October 09, 2015
Particulars (` cr)
2QFY16E
2QFY15
y-o-y (%)
1QFY16
q-o-q (%)
PAT
558
430
29.7
525
6.3
Infosys Ltd Consol - October 12, 2015
Particulars (` cr)
2QFY16E
2QFY15
y-o-y (%)
1QFY16
q-o-q (%)
Net sales
15,219
13,342
14.1
14,354
6.0
EBITDA
4,165
3,774
10.4
3,760
10.8
EBITDA margin (%)
27.4
28.3
26.2
Net profit
3,280
3,096
5.9
3,030
8.3
Market Outlook
October 09, 2015
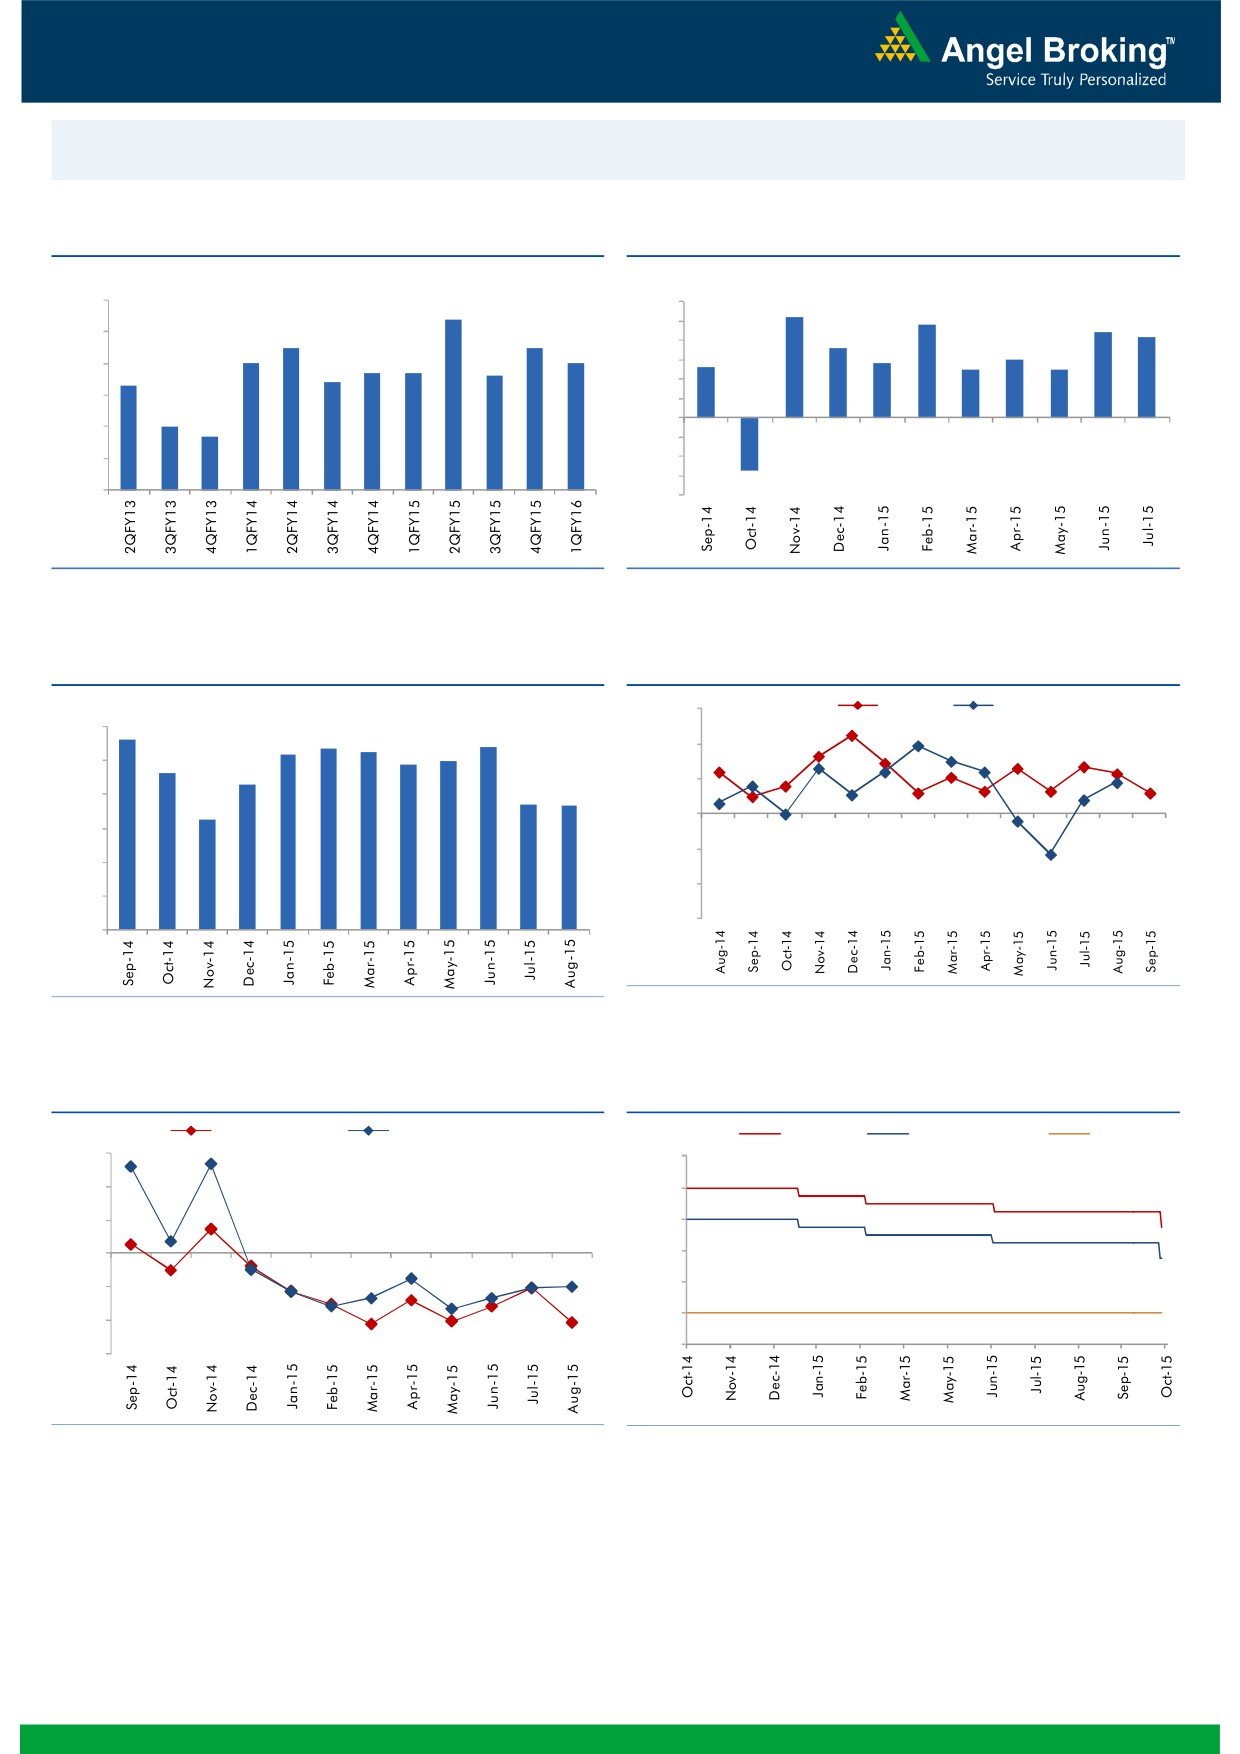
Macro watch
Exhibit 1: Quarterly GDP trends
Exhibit 2: IIP trends
(%)
(%)
9.0
8.4
6.0
5.2
4.8
5.0
4.4
4.2
8.0
7.5
7.5
3.6
4.0
3.0
7.0
7.0
2.6
2.8
6.7
6.7
2.5
2.5
7.0
6.4
6.6
3.0
6.3
2.0
6.0
1.0
5.0
4.7
-
5.0
(1.0)
4.0
(2.0)
(3.0)
3.0
(2.7)
(4.0)
Source: CSO, Angel Research
Source: MOSPI, Angel Research
Exhibit 3: Monthly CPI inflation trends
Exhibit 4: Manufacturing and services PMI
(%)
56.0
Mfg. PMI
Services PMI
6.0
5.6
5.4
5.2
5.4
5.3
4.9
5.0
54.0
5.0
4.6
4.3
52.0
3.7
3.7
4.0
3.3
50.0
3.0
48.0
2.0
46.0
1.0
44.0
-
Source: Market, Angel Research; Note: Level above 50 indicates expansion
Source: MOSPI, Angel Research
Exhibit 5: Exports and imports growth trends
Exhibit 6: Key policy rates
(%)
Exports yoy growth
Imports yoy growth
(%)
Repo rate
Reverse Repo rate
CRR
30.0
9.00
20.0
8.00
10.0
7.00
0.0
6.00
5.00
(10.0)
4.00
(20.0)
3.00
(30.0)
Source: Bloomberg, Angel Research
Source: RBI, Angel Research
Market Outlook
October 09, 2015
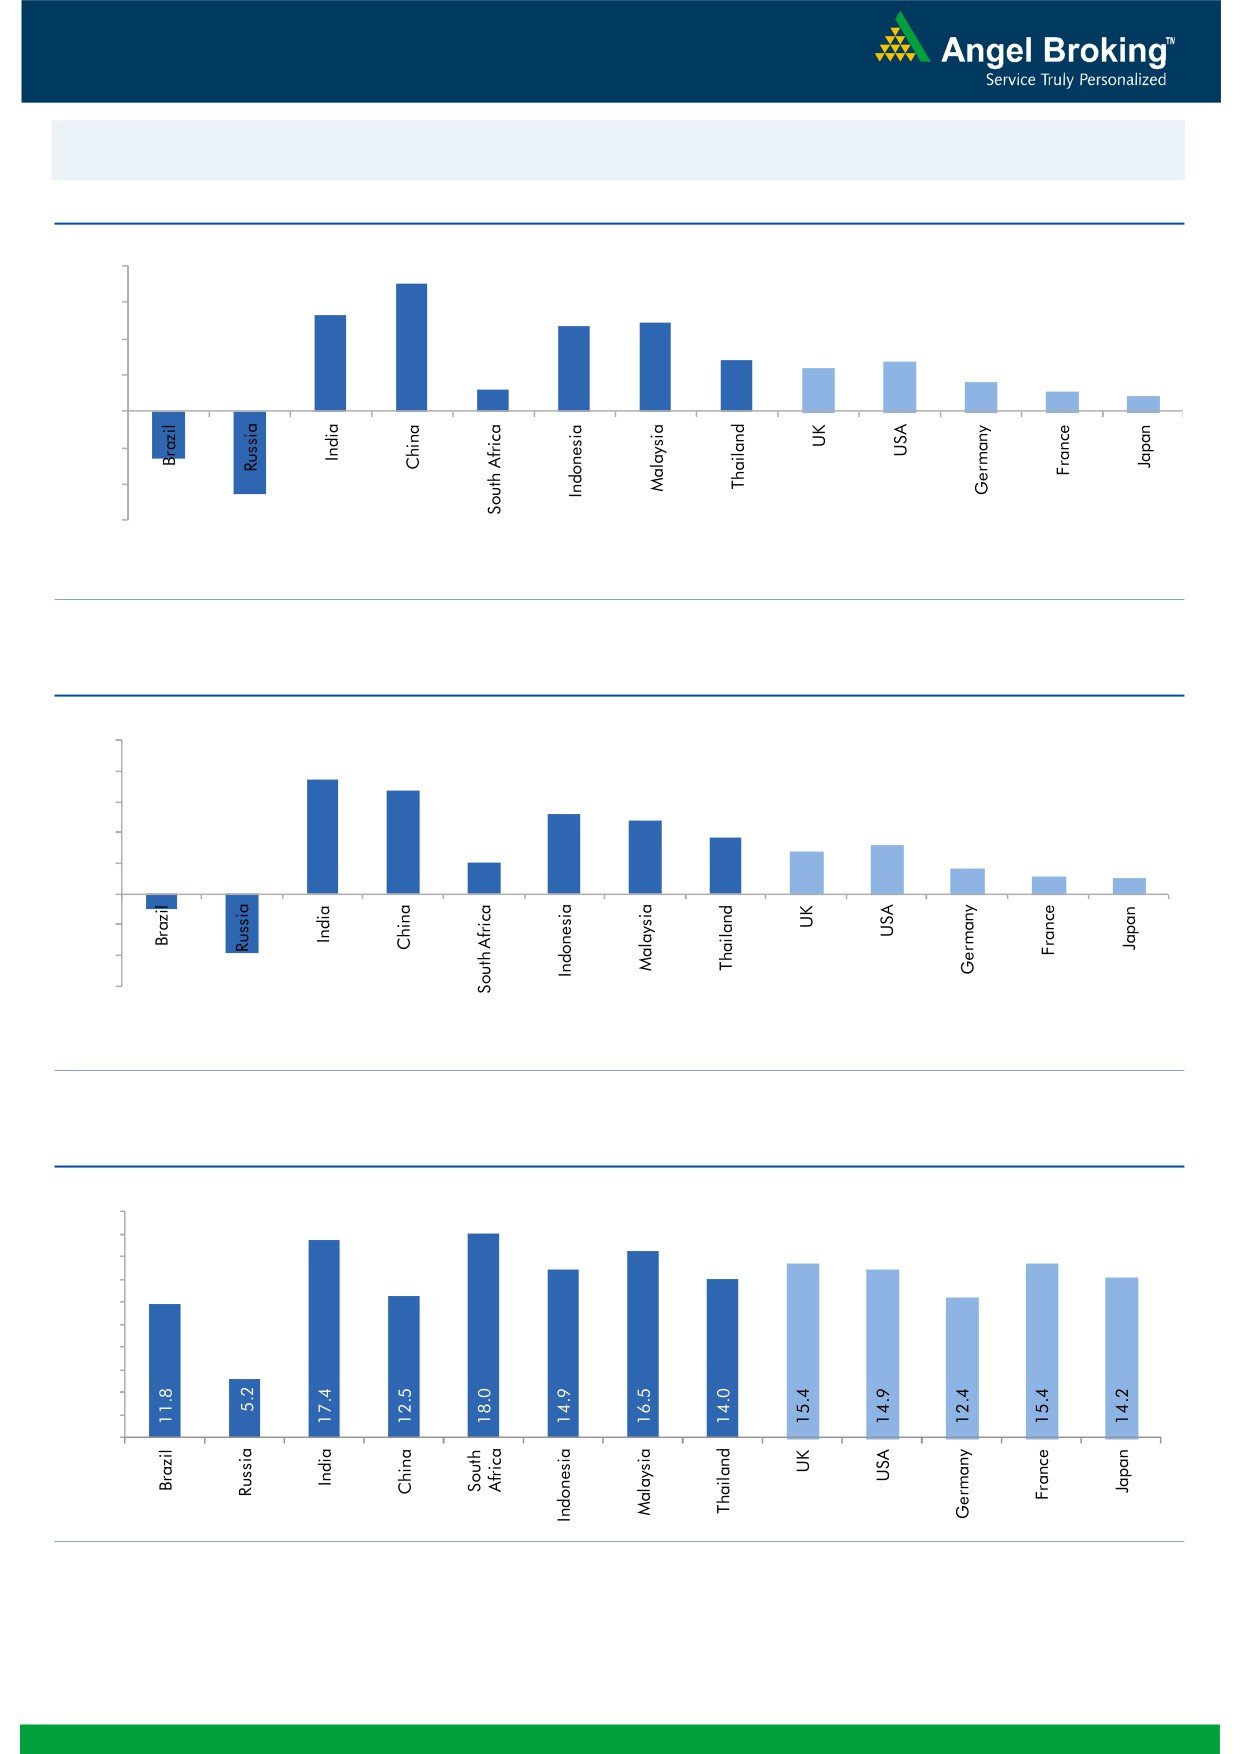
Global watch
Exhibit 1: Latest quarterly GDP Growth (%, yoy) across select developing and developed countries
(%)
8.0
7.0
6.0
5.3
4.9
4.7
4.0
2.8
2.7
2.4
1.6
2.0
1.2
1.1
0.8
-
(2.0)
(2.6)
(4.0)
(4.6)
(6.0)
Source: Bloomberg, Angel Research
Exhibit 2: 2015 GDP Growth projection by IMF (%, yoy) across select developing and developed countries
(%)
10.0
7.5
8.0
6.8
5.2
6.0
4.8
3.7
3.1
4.0
2.7
2.0
1.6
1.2
1.0
2.0
-
(2.0)
(4.0)
(1.0)
(3.8)
(6.0)
Source: IMF, Angel Research
Exhibit 3: One year forward P-E ratio across select developing and developed countries
(x)
20.0
18.0
16.0
14.0
12.0
10.0
8.0
6.0
4.0
2.0
-
Source: IMF, Angel Research
Market Outlook
October 09, 2015
Exhibit 4: Relative performance of indices across globe
Returns (%)
Country
Name of index
Closing price
1M
3M
1YR
Brazil
Bovespa
47,033
(4.4)
(15.1)
(19.5)
Russia
Micex
1,613
(5.2)
0.1
16.7
India
Nifty
7,951
(0.0)
(5.0)
(2.4)
China
Shanghai Composite
3,053
(1.0)
(28.6)
31.1
South Africa
Top 40
45,668
1.1
(2.7)
1.5
Mexico
Mexbol
42,735
(1.5)
(5.1)
(5.2)
Indonesia
LQ45
701
(8.3)
(15.9)
(19.6)
Malaysia
KLCI
1,629
1.0
(4.6)
(11.5)
Thailand
SET 50
868
(4.1)
(12.8)
(17.8)
USA
Dow Jones
16,472
(2.2)
(7.6)
(3.1)
UK
FTSE
6,130
0.8
(6.9)
(6.6)
Japan
Nikkei
17,725
(7.4)
(12.4)
9.4
Germany
DAX
9,553
(5.8)
(13.0)
2.0
France
CAC
4,459
(4.2)
(7.9)
3.9
Source: Bloomberg, Angel Research
Stock Watch
October 09, 2015
Company Name
Reco
CMP
Target
Mkt Cap
Sales ( Čcr )
OPM(%)
EPS (Č)
PER(x)
P/BV(x)
RoE(%)
EV/Sales(x)
(Č)
Price ( Č)
( Č cr )
FY16E FY17E
FY16E
FY17E
FY16E
FY17E
FY16E
FY17E
FY16E
FY17E
FY16E
FY17E
FY16E
FY17E
Agri / Agri Chemical
Rallis
Neutral
215
-
4,183
2,075
2,394
14.4
14.4
9.5
11.0
22.6
19.6
4.5
3.9
21.1
21.3
2.1
1.8
United Phosphorus
Accumulate
445
510
19,066
13,698
15,752
17.6
17.6
32.1
38.5
13.9
11.6
2.7
2.3
21.4
21.3
1.5
1.2
Auto & Auto Ancillary
Ashok Leyland
Accumulate
92
102
26,125
18,763
22,357
11.1
11.2
3.6
4.8
25.5
19.1
4.7
4.3
18.7
22.6
1.3
1.1
Bajaj Auto
Neutral
2,435
-
70,467
23,544
27,245
19.8
19.8
127.0
143.4
19.2
17.0
5.8
5.0
30.3
29.4
2.6
2.2
Eicher Motors
Buy
18,666
22,859
50,665
11,681
15,550
15.3
16.9
358.5
564.3
52.1
33.1
15.7
11.6
29.8
34.9
4.2
3.1
Hero Motocorp
Accumulate
2,540
2,672
50,713
28,500
32,764
14.1
14.3
146.9
167.0
17.3
15.2
6.5
5.6
37.8
36.5
1.6
1.4
L G Balakrishnan & Bros Neutral
438
-
687
1,254
1,394
11.6
11.8
35.9
41.7
12.2
10.5
1.7
1.5
13.5
13.8
0.7
0.6
Mahindra and Mahindra Accumulate
1,271
1,357
78,932
37,986
42,660
12.8
13.2
51.6
61.9
24.6
20.5
3.6
3.2
14.6
15.6
1.7
1.5
Maruti
Accumulate
4,354
4,960
131,530
58,102
68,587
16.7
16.9
182.0
225.5
23.9
19.3
4.8
4.1
19.9
21.0
2.0
1.7
Minda Industries
Buy
504
652
799
2,567
2,965
7.3
8.0
38.8
54.3
13.0
9.3
1.9
1.6
14.4
16.8
0.4
0.3
Rane Brake Lining
Buy
290
366
230
454
511
11.1
11.4
23.8
28.1
12.2
10.3
1.7
1.6
14.2
15.3
0.6
0.6
Setco Automotive
Neutral
230
-
615
594
741
12.7
13.7
8.4
15.8
27.4
14.6
2.8
2.5
10.4
16.9
1.5
1.2
Tata Motors
Accumulate
343
367
98,988
264,038
297,882
13.8
13.9
34.5
38.9
9.9
8.8
1.7
1.4
17.6
16.8
0.5
0.5
TVS Motor
Neutral
241
-
11,431
11,702
13,713
6.8
7.7
10.1
14.5
23.8
16.6
5.8
4.7
24.5
28.3
1.0
0.8
Amara Raja Batteries
Neutral
1,012
-
17,286
5,101
6,224
17.8
17.6
31.1
39.2
32.5
25.8
8.1
6.4
24.8
24.8
3.3
2.7
Exide Industries
Neutral
156
-
13,230
7,363
8,247
13.7
14.5
6.6
7.7
23.6
20.2
3.0
2.7
12.6
13.3
1.5
1.4
Apollo Tyres
Neutral
193
-
9,839
12,576
12,978
16.8
16.1
22.3
19.9
8.7
9.7
1.5
1.3
17.2
13.4
0.9
0.9
Ceat
Neutral
1,265
-
5,118
6,041
6,597
14.3
14.2
101.5
116.6
12.5
10.9
2.5
2.1
20.0
19.1
1.0
0.9
JK Tyres
Neutral
103
-
2,345
7,446
7,669
15.2
14.0
19.6
18.4
5.3
5.6
1.3
1.1
25.2
19.5
0.7
0.6
Swaraj Engines
Neutral
874
-
1,085
593
677
14.5
14.8
51.2
60.8
17.1
14.4
4.0
3.6
23.3
24.8
1.7
1.4
Subros
Neutral
77
-
459
1,268
1,488
11.6
11.9
3.7
6.6
20.7
11.6
1.4
1.3
6.8
11.4
0.7
0.5
Indag Rubber
Neutral
180
-
473
283
329
17.0
17.2
13.0
15.4
13.9
11.7
3.0
2.5
21.8
21.6
1.4
1.1
Capital Goods
ACE
Neutral
41
-
404
660
839
4.7
8.2
1.0
3.9
40.8
10.5
1.3
1.1
3.2
11.3
0.8
0.6
BEML
Neutral
1,257
-
5,236
3,277
4,006
6.0
8.9
29.2
64.3
43.1
19.6
2.4
2.2
5.7
11.7
1.7
1.3
BGR Energy
Neutral
117
-
847
3,615
3,181
9.5
9.4
16.7
12.4
7.0
9.5
0.7
0.7
10.0
7.0
0.6
0.8
BHEL
Neutral
204
-
49,894
33,722
35,272
10.8
11.7
10.5
14.2
19.4
14.4
1.4
1.4
7.0
9.0
1.6
1.5
Blue Star
Accumulate
343
387
3,085
3,649
4,209
5.0
5.9
9.2
14.7
37.5
23.3
6.8
6.4
9.1
17.5
0.9
0.8
Crompton Greaves
Accumulate
179
204
11,234
13,484
14,687
4.9
6.2
4.5
7.1
39.8
25.3
2.8
2.6
7.2
10.8
1.0
0.9
Inox Wind
Buy
364
505
8,079
4,980
5,943
17.0
17.5
26.6
31.6
13.7
11.5
4.1
3.0
35.0
30.0
1.8
1.4
Stock Watch
October 09, 2015
Company Name
Reco
CMP
Target
Mkt Cap
Sales ( Čcr )
OPM(%)
EPS (Č)
PER(x)
P/BV(x)
RoE(%)
EV/Sales(x)
(Č)
Price ( Č)
( Č cr )
FY16E
FY17E
FY16E
FY17E
FY16E
FY17E
FY16E
FY17E
FY16E
FY17E
FY16E
FY17E
FY16E
FY17E
Capital Goods
KEC International
Neutral
144
-
3,694
8,791
9,716
6.1
6.8
5.4
8.2
26.6
17.5
2.7
2.4
10.0
14.0
0.6
0.6
Thermax
Neutral
859
-
10,237
6,413
7,525
7.4
8.5
30.5
39.3
28.2
21.9
4.3
3.8
15.0
17.0
1.6
1.3
Cement
ACC
Accumulate
1,357
1,548
25,471
11,856
14,092
14.5
17.8
47.6
76.1
28.5
17.8
2.9
2.7
10.6
15.7
2.0
1.6
Ambuja Cements
Accumulate
210
233
32,644
10,569
12,022
20.7
22.2
8.7
10.7
24.2
19.7
3.1
2.9
13.0
15.2
2.7
2.4
India Cements
Buy
79
112
2,413
4,716
5,133
15.9
16.9
3.7
7.5
21.2
10.5
0.8
0.7
3.8
7.3
0.8
0.7
JK Cement
Buy
656
767
4,587
4,056
4,748
14.5
17.0
22.6
41.1
29.0
16.0
2.6
2.3
9.3
15.3
1.6
1.3
J K Lakshmi Cement
Accumulate
384
430
4,523
2,947
3,616
16.7
19.9
11.5
27.2
33.4
14.1
3.2
2.7
9.8
20.8
1.9
1.6
Mangalam Cements
Neutral
225
-
600
1,053
1,347
10.5
13.3
8.4
26.0
26.7
8.6
1.1
1.0
4.3
12.5
0.9
0.7
Orient Cement
Accumulate
170
183
3,475
1,854
2,524
21.2
22.2
7.7
11.1
22.0
15.3
3.2
2.7
13.3
15.7
2.6
1.8
Ramco Cements
Neutral
341
-
8,118
4,036
4,545
20.8
21.3
15.1
18.8
22.6
18.1
2.8
2.5
12.9
14.3
2.5
2.2
Shree Cement^
Neutral
12,407
-
43,223
7,150
8,742
26.7
28.6
228.0
345.5
54.4
35.9
8.0
6.7
15.7
20.3
5.8
4.7
UltraTech Cement
Buy
2,818
3,282
77,330
27,562
31,548
20.4
22.3
111.9
143.3
25.2
19.7
3.6
3.1
15.2
16.8
2.9
2.5
Construction
ITNL
Neutral
95
-
3,114
7,360
8,825
34.0
35.9
1.0
5.0
94.7
18.9
0.4
0.4
0.3
1.4
3.9
3.7
KNR Constructions
Neutral
590
-
1,658
915
1,479
14.3
13.9
20.3
37.2
29.0
15.9
2.7
2.3
9.6
15.6
1.9
1.2
Larsen & Toubro
Buy
1,534
2,013
142,726
68,920
82,446
10.9
11.5
57.0
73.0
26.9
21.0
2.5
2.3
13.6
15.5
2.3
1.9
Gujarat Pipavav Port
Neutral
208
-
10,072
721
784
53.1
53.6
8.2
9.1
25.4
22.9
4.1
3.3
20.0
18.3
13.5
12.1
MBL Infrastructures
Buy
244
360
1,012
2,313
2,797
12.2
14.6
19.0
20.0
12.9
12.2
1.3
1.2
11.3
10.6
1.1
1.0
Nagarjuna Const.
Neutral
75
-
4,186
7,892
8,842
8.3
9.1
2.4
5.3
31.4
14.2
1.3
1.2
4.2
8.6
0.8
0.7
PNC Infratech
Neutral
523
-
2,682
1,798
2,132
13.2
13.5
22.0
30.0
23.8
17.4
2.1
1.9
11.5
11.4
1.6
1.3
Simplex Infra
Neutral
327
-
1,618
6,241
7,008
10.4
10.7
20.0
36.0
16.4
9.1
1.3
1.2
6.8
11.1
0.8
0.7
Financials
Allahabad Bank
Neutral
78
-
4,451
8,438
9,521
2.8
2.8
21.9
27.0
3.6
2.9
0.4
0.3
10.2
11.5
-
-
Axis Bank
Buy
491
701
116,836
26,941
32,298
3.5
3.6
37.4
46.4
13.1
10.6
2.7
2.3
18.7
20.0
-
-
Bank of Baroda
Neutral
186
-
42,823
19,027
21,737
1.9
2.0
16.9
24.5
11.0
7.6
1.0
0.9
9.1
12.1
-
-
Bank of India
Neutral
146
-
9,681
16,438
18,706
1.9
2.0
19.2
40.9
7.6
3.6
0.4
0.4
4.5
9.1
-
-
Canara Bank
Neutral
298
-
16,195
15,491
17,269
2.0
2.0
61.6
70.9
4.8
4.2
0.6
0.5
10.5
11.1
-
-
Dena Bank
Neutral
42
-
2,368
3,498
3,977
2.1
2.3
7.8
10.7
5.4
4.0
0.4
0.4
6.5
8.4
-
-
Federal Bank
Neutral
65
-
11,088
3,527
4,135
3.0
3.1
5.2
6.7
12.4
9.6
1.3
1.2
10.8
12.7
-
-
HDFC
Neutral
1,278
-
201,604
10,883
12,799
3.5
3.4
43.0
50.6
29.8
25.3
5.9
5.3
25.9
26.7
-
-
HDFC Bank
Buy
1,084
1,255
272,897
38,059
46,851
4.4
4.5
50.0
62.7
21.7
17.3
3.8
3.2
18.8
20.2
-
-
Stock Watch
October 09, 2015
Company Name
Reco
CMP
Target
Mkt Cap
Sales ( Čcr )
OPM(%)
EPS (Č)
PER(x)
P/BV(x)
RoE(%)
EV/Sales(x)
(Č)
Price ( Č)
( Č cr )
FY16E
FY17E
FY16E
FY17E
FY16E
FY17E
FY16E
FY17E
FY16E
FY17E
FY16E
FY17E
FY16E
FY17E
Financials
ICICI Bank
Buy
278
370
161,715
35,810
41,871
3.4
3.5
22.0
26.2
12.7
10.6
2.2
1.8
15.0
15.6
-
-
IDBI Bank
Neutral
79
-
12,735
9,860
10,978
1.8
1.9
9.3
15.6
8.6
5.1
0.6
0.5
6.4
10.1
-
-
Indian Bank
Neutral
141
-
6,787
6,267
7,171
2.4
2.5
25.4
32.1
5.6
4.4
0.5
0.4
8.0
9.3
-
-
LIC Housing Finance
Buy
475
570
23,971
2,934
3,511
2.3
2.3
30.9
36.8
15.4
12.9
2.5
2.2
16.8
17.5
-
-
Oriental Bank
Neutral
145
-
4,342
7,730
8,595
2.4
2.5
38.8
47.4
3.7
3.1
0.3
0.3
8.6
9.8
-
-
Punjab Natl.Bank
Neutral
139
-
25,797
23,446
26,624
2.8
2.9
17.8
27.5
7.8
5.1
0.8
0.6
8.5
12.1
-
-
South Ind.Bank
Neutral
23
-
3,038
1,930
2,215
2.4
2.4
2.6
3.6
8.7
6.3
0.9
0.8
9.9
12.5
-
-
St Bk of India
Buy
243
307
184,124
83,847
96,307
2.8
2.8
20.1
25.1
12.1
9.7
1.3
1.2
11.5
13.1
-
-
Union Bank
Neutral
185
-
11,778
12,755
14,439
2.3
2.4
31.5
39.9
5.9
4.6
0.6
0.5
9.9
11.6
-
-
Vijaya Bank
Neutral
36
-
3,101
3,594
3,969
1.8
1.9
5.8
7.1
6.2
5.1
0.5
0.5
8.2
9.3
-
-
Yes Bank
Buy
729
953
30,512
7,204
9,078
3.2
3.2
57.8
69.5
12.6
10.5
2.2
1.9
19.6
22.6
-
-
FMCG
Asian Paints
Neutral
875
-
83,935
16,553
19,160
16.0
16.2
17.7
21.5
49.5
40.7
13.1
11.8
29.4
31.2
4.9
4.2
Britannia
Neutral
3,267
-
39,200
8,065
9,395
9.6
10.2
47.2
65.5
69.2
49.9
23.0
21.7
38.3
41.2
4.7
4.0
Colgate
Neutral
929
-
25,262
4,836
5,490
19.5
19.7
48.5
53.2
19.2
17.5
14.0
12.2
99.8
97.5
5.1
4.5
Dabur India
Neutral
278
-
48,813
9,370
10,265
17.1
17.2
7.3
8.1
37.9
34.3
11.4
9.3
33.7
30.6
5.1
4.7
GlaxoSmith Con*
Neutral
6,022
-
25,326
4,919
5,742
17.2
17.4
168.3
191.2
35.8
31.5
10.2
8.6
28.8
28.9
4.7
4.0
Godrej Consumer
Neutral
1,267
-
43,144
10,168
12,886
16.1
16.1
32.1
38.4
39.5
33.0
8.0
7.4
19.7
21.0
4.3
3.4
HUL
Neutral
821
-
177,729
34,940
38,957
17.5
17.7
20.8
24.7
39.5
33.3
43.9
35.1
110.5
114.2
4.9
4.4
ITC
Buy
339
409
272,219
41,068
45,068
37.8
37.4
13.9
15.9
24.4
21.3
8.2
7.2
34.1
33.8
6.3
5.7
Marico
Neutral
402
-
25,942
6,551
7,766
15.7
16.0
10.4
12.5
38.7
32.2
11.3
9.4
33.2
32.4
3.9
3.3
Nestle*
Neutral
6,373
-
61,448
11,291
12,847
22.2
22.3
158.9
184.6
40.1
34.5
21.0
18.9
55.0
57.3
5.3
4.6
Tata Global
Accumulate
133
144
8,409
8,635
9,072
9.8
9.9
6.5
7.6
20.5
17.6
2.0
2.0
6.8
7.4
0.9
0.9
IT
HCL Tech^
Buy
828
1,132
116,448
42,038
47,503
23.5
23.5
56.4
62.9
14.7
13.2
3.4
2.6
23.2
19.8
2.4
1.9
Infosys
Buy
1,132
1,306
260,118
60,250
66,999
28.0
28.0
58.3
63.7
19.4
17.8
4.1
3.5
20.9
19.7
3.6
3.1
TCS
Buy
2,635
3,168
519,159
108,420
123,559
28.8
28.7
127.2
143.9
20.7
18.3
8.3
7.7
39.9
41.8
4.4
3.8
Tech Mahindra
Buy
561
646
54,013
25,566
28,890
16.0
17.0
26.3
31.9
21.4
17.6
3.8
3.3
17.9
18.6
1.9
1.6
Wipro
Buy
590
719
145,687
52,414
58,704
23.7
23.8
38.4
42.3
15.4
13.9
3.0
2.7
19.5
18.0
2.4
1.9
Media
D B Corp
Accumulate
314
356
5,763
2,241
2,495
27.8
27.9
21.8
25.6
14.4
12.3
3.8
3.3
26.7
28.5
2.5
2.2
HT Media
Neutral
80
-
1,867
2,495
2,603
11.2
11.2
7.3
8.6
11.0
9.3
0.9
0.8
7.4
8.1
0.3
0.2
Stock Watch
October 09, 2015
Company Name
Reco
CMP
Target
Mkt Cap
Sales ( Čcr )
OPM(%)
EPS (Č)
PER(x)
P/BV(x)
RoE(%)
EV/Sales(x)
(Č)
Price ( Č)
( Č cr )
FY16E FY17E
FY16E
FY17E
FY16E
FY17E
FY16E
FY17E
FY16E
FY17E
FY16E
FY17E
FY16E
FY17E
Media
Jagran Prakashan
Accumulate
144
156
4,693
1,939
2,122
26.0
26.0
8.3
9.2
17.3
15.6
3.0
2.7
17.5
17.1
2.4
2.2
Sun TV Network
Neutral
357
-
14,059
2,779
3,196
70.2
70.5
22.8
27.3
15.7
13.1
3.9
3.5
26.7
28.3
4.8
4.2
Hindustan Media
Buy
250
292
1,836
920
1,031
20.0
20.0
19.2
20.9
13.0
12.0
2.1
1.8
16.4
15.3
1.5
1.3
Ventures
Metals & Mining
Coal India
Buy
346
400
218,673
72,015
78,415
21.2
21.5
21.7
25.3
15.9
13.7
5.4
5.3
33.1
39.1
2.3
2.1
Hind. Zinc
Neutral
145
-
61,352
15,258
16,495
44.2
45.6
17.6
19.2
8.2
7.6
1.3
1.1
15.9
15.3
1.7
1.2
Hindalco
Neutral
82
-
16,954
104,356
111,186
8.7
9.5
6.7
11.1
12.2
7.4
0.4
0.4
3.5
5.9
0.7
0.6
JSW Steel
Neutral
914
-
22,095
48,125
53,595
18.8
21.0
46.9
97.5
19.5
9.4
0.9
0.9
4.4
9.5
1.3
1.1
NMDC
Neutral
96
-
37,883
8,237
10,893
46.6
44.5
10.0
11.7
9.6
8.2
1.1
0.9
12.5
13.0
4.4
3.3
SAIL
Neutral
55
-
22,612
45,915
53,954
7.2
10.5
1.5
4.4
36.4
12.5
0.5
0.5
2.3
4.1
1.1
1.0
Vedanta
Neutral
93
-
27,542
71,445
81,910
26.2
26.3
12.9
19.2
7.2
4.8
0.5
0.5
7.2
8.9
0.8
0.6
Tata Steel
Neutral
241
-
23,358
136,805
149,228
11.3
11.9
26.4
36.8
9.1
6.5
0.7
0.7
6.0
8.0
0.7
0.6
Oil & Gas
Cairn India
Neutral
169
-
31,666
11,323
12,490
49.4
51.0
20.7
20.7
8.2
8.2
0.5
0.5
6.4
6.1
1.9
1.2
GAIL
Neutral
305
-
38,720
64,856
70,933
9.1
9.6
24.0
28.9
12.7
10.6
1.1
1.0
8.8
9.6
0.8
0.7
ONGC
Neutral
258
-
220,432
154,564
167,321
36.8
37.4
28.6
32.5
9.0
7.9
1.1
1.1
12.7
13.5
1.6
1.5
Petronet LNG
Buy
182
210
13,643
39,007
40,785
3.8
4.2
9.2
11.0
19.9
16.6
2.2
2.0
11.6
12.7
0.4
0.4
Indian Oil Corp
Accumulate
400
455
97,094
359,607
402,760
5.9
6.1
42.5
48.7
9.4
8.2
1.3
1.1
14.1
14.4
0.4
0.3
Reliance Industries
Neutral
889
-
287,945
313,085
362,904
13.1
13.8
78.4
92.9
11.4
9.6
1.2
1.1
10.8
11.6
1.4
1.2
Pharmaceuticals
Alembic Pharma
Neutral
719
-
13,560
2,601
3,115
21.2
20.2
20.8
23.9
34.6
30.1
11.1
8.4
37.2
31.8
5.2
4.3
Aurobindo Pharma
Buy
751
872
43,829
14,923
17,162
23.0
23.0
38.2
43.6
19.7
17.2
6.1
4.6
36.0
30.2
3.3
2.8
Aventis*
Neutral
4,002
-
9,216
2,156
2,455
15.1
16.8
109.7
133.9
36.5
29.9
5.0
4.1
18.4
22.5
4.0
3.3
Cadila Healthcare
Neutral
410
-
41,922
10,224
11,840
20.0
21.0
71.0
85.6
5.8
4.8
1.6
1.2
30.1
28.5
4.2
3.5
Cipla
Neutral
678
-
54,451
14,359
16,884
21.3
19.7
28.4
30.5
23.9
22.2
4.2
3.6
19.3
17.5
3.8
3.1
Dr Reddy's
Neutral
4,216
-
71,897
18,213
21,214
22.6
22.7
163.0
192.5
25.9
21.9
5.3
4.4
22.5
20.0
3.9
3.3
Dishman Pharma
Neutral
354
-
2,853
1,716
1,888
20.2
20.2
16.3
21.6
21.7
16.4
2.0
1.8
9.7
11.7
1.8
1.5
GSK Pharma*
Neutral
3,356
-
28,426
2,870
3,158
20.0
22.1
59.5
68.3
56.4
49.1
16.6
17.1
28.5
34.3
9.4
8.6
Indoco Remedies
Neutral
319
-
2,938
1,088
1,262
18.2
18.2
13.1
15.5
24.3
20.6
4.8
4.0
21.2
21.1
2.8
2.4
Ipca labs
Accumulate
720
800
9,078
3,507
4,078
17.6
18.6
25.8
32.0
27.9
22.5
3.6
3.1
13.8
14.9
2.9
2.4
Lupin
Neutral
2,044
-
92,015
14,864
17,244
26.9
26.9
62.1
71.1
32.9
28.8
8.0
6.3
27.4
24.6
5.9
5.0
Sun Pharma
Neutral
916
-
220,321
28,163
32,610
25.8
30.7
17.4
26.9
52.6
34.0
5.0
4.3
13.0
16.6
7.3
6.1
Stock Watch
October 09, 2015
Company Name
Reco
CMP
Target
Mkt Cap
Sales ( Čcr )
OPM(%)
EPS (Č)
PER(x)
P/BV(x)
RoE(%)
EV/Sales(x)
(Č)
Price ( Č)
( Č cr )
FY16E FY17E
FY16E
FY17E
FY16E
FY17E
FY16E
FY17E
FY16E
FY17E
FY16E
FY17E
FY16E
FY17E
Power
Tata Power
Neutral
70
-
19,000
35,923
37,402
22.6
22.8
4.1
5.2
17.3
13.6
1.3
1.2
7.5
9.3
1.5
1.4
NTPC
Buy
126
157
103,852
87,064
98,846
23.5
23.5
11.7
13.2
10.8
9.5
1.2
1.1
11.4
12.1
2.2
2.0
Power Grid
Buy
132
170
69,292
20,702
23,361
86.7
86.4
12.1
13.2
11.0
10.0
1.6
1.4
15.6
15.1
8.3
7.7
Telecom
Bharti Airtel
Neutral
343
-
137,231
101,748
109,191
32.1
31.7
12.0
12.5
28.6
27.5
2.0
1.8
6.9
6.7
2.0
1.8
Idea Cellular
Neutral
157
-
56,424
34,282
36,941
32.0
31.5
5.9
6.2
26.6
25.3
2.4
2.2
9.9
9.3
2.2
2.1
zOthers
Abbott India
Neutral
5,789
-
12,302
2,715
3,153
14.5
14.1
134.3
152.2
43.1
38.0
10.8
8.9
27.4
25.6
4.2
3.6
Bajaj Electricals
Buy
244
341
2,466
4,719
5,287
5.2
5.8
8.6
12.7
28.6
19.3
3.3
2.9
11.4
14.8
0.5
0.5
Finolex Cables
Neutral
234
-
3,573
2,728
3,036
10.8
11.0
14.4
16.8
16.2
14.0
2.5
2.1
15.2
15.3
1.1
0.9
Goodyear India*
Buy
558
655
1,286
1,953
1,766
12.4
12.0
67.4
59.6
8.3
9.4
2.1
1.8
27.7
20.2
0.4
0.4
Hitachi
Neutral
1,433
-
3,897
1,806
2,112
9.0
9.2
28.6
29.1
50.1
49.3
12.5
10.1
28.1
22.6
2.2
1.9
Jyothy Laboratories
Neutral
315
-
5,696
1,620
1,847
11.5
11.5
7.3
8.5
43.1
37.1
5.6
5.2
13.3
14.4
3.4
2.9
MRF
Neutral
41,872
-
17,758
20,727
14,841
19.3
18.6
4,905.8
3,351.9
8.5
12.5
2.7
2.2
37.6
19.6
0.8
1.1
Page Industries
Neutral
14,232
-
15,874
1,929
2,450
19.8
20.1
229.9
299.0
61.9
47.6
27.3
19.0
52.1
47.1
8.3
6.5
Relaxo Footwears
Neutral
551
-
6,609
1,767
2,152
12.3
12.5
19.3
25.1
28.6
22.0
7.0
5.4
27.7
27.8
3.8
3.1
Siyaram Silk Mills
Buy
1,001
1,221
938
1,653
1,873
11.7
12.2
99.3
122.1
10.1
8.2
1.8
1.5
19.5
20.2
0.7
0.6
Styrolution ABS India*
Neutral
757
-
1,331
1,271
1,440
8.6
9.2
32.0
41.1
23.6
18.4
2.4
2.2
10.7
12.4
1.0
0.9
Tree House
Buy
295
449
1,250
259
324
56.8
56.8
17.0
21.7
17.4
13.6
1.7
1.6
10.1
11.5
4.7
3.9
TVS Srichakra
Buy
2,601
3,210
1,992
2,127
2,388
15.2
14.9
237.7
267.5
10.9
9.7
4.7
3.3
51.7
39.8
1.0
0.8
HSIL
Accumulate
275
302
1,987
2,182
2,404
16.3
16.5
15.8
18.9
17.4
14.6
1.4
1.3
8.4
9.4
1.2
1.1
Kirloskar Engines India
Neutral
290
-
4,190
2,634
3,252
10.1
12.0
10.9
17.4
26.6
16.6
3.0
2.7
11.4
16.8
1.2
0.9
Ltd
M M Forgings
Buy
543
797
655
563
671
22.1
22.9
51.0
66.5
10.6
8.2
2.2
1.8
23.1
24.1
1.3
1.1
Banco Products (India)
Neutral
132
-
940
1,208
1,353
11.0
12.3
10.8
14.5
12.2
9.1
1.4
1.3
11.9
14.5
0.7
0.6
Competent Automobiles Neutral
143
-
88
1,007
1,114
3.1
3.1
23.7
28.2
6.1
5.1
0.8
0.7
13.9
14.6
0.1
0.1
Nilkamal
Neutral
985
-
1,470
1,948
2,147
10.6
10.3
60.0
67.0
16.4
14.7
2.6
2.2
16.8
16.1
0.8
0.7
Visaka Industries
Buy
142
166
225
1,158
1,272
8.6
9.5
23.7
32.7
6.0
4.3
0.6
0.5
10.1
12.5
0.4
0.3
Transport Corporation of
Buy
248
293
1,883
2,830
3,350
8.8
9.0
14.4
18.3
17.2
13.5
2.7
2.3
15.4
17.1
0.8
0.7
India
Elecon Engineering
Accumulate
76
87
830
1,452
1,596
14.0
14.7
4.4
6.2
17.3
12.2
1.4
1.3
8.6
11.2
0.9
0.7
Surya Roshni
Buy
131
183
572
2,992
3,223
8.3
8.5
14.7
18.3
8.9
7.2
0.8
0.8
9.8
11.0
0.5
0.4
MT Educare
Buy
136
169
543
286
366
18.3
17.7
7.7
9.4
17.7
14.6
3.7
3.3
20.2
21.1
1.8
1.4
Stock Watch
October 09, 2015
Company Name
Reco
CMP
Target Mkt Cap
Sales ( Čcr )
OPM(%)
EPS (Č)
PER(x)
P/BV(x)
RoE(%)
EV/Sales(x)
(Č)
Price ( Č)
( Č cr )
FY16E FY17E FY16E FY17E FY16E FY17E FY16E FY17E FY16E FY17E FY16E FY17E FY16E FY17E
zOthers
Radico Khaitan
Buy
86
112
1,141
1,565
1,687
11.9
12.4
5.4
6.6
15.9
13.0
1.3
1.2
8.0
9.0
1.2
1.2
Garware Wall Ropes
Accumulate
347
390
759
875
983
10.4
10.6
23.1
27.8
15.0
12.5
2.1
1.8
14.1
14.8
0.9
0.7
Wonderla Holidays
Accumulate
300
322
1,696
206
308
44.0
43.6
9.0
12.9
33.4
23.3
4.6
4.1
13.7
17.8
8.1
5.4
Linc Pen & Plastics
Buy
157
185
232
340
371
8.3
8.9
10.8
13.2
14.5
11.9
2.3
2.0
16.0
17.1
0.7
0.7
The Byke Hospitality
Accumulate
162
181
649
222
287
20.5
20.5
5.6
7.6
28.7
21.4
5.4
4.5
18.9
20.8
3.0
2.3
Source: Company, Angel Research; Note: *December year end; #September year end; &October year end; Price as on October 08, 2015
Market Outlook
October 09, 2015
Research Team Tel: 022 - 39357800
DISCLAIMER
Angel Broking Private Limited (hereinafter referred to as “Angel”) is a registered Member of National Stock Exchange of India Limited,
Bombay Stock Exchange Limited and Metropolitian Stock Exchange of India Limited. It is also registered as a Depository Participant with
CDSL and Portfolio Manager with SEBI. It also has registration with AMFI as a Mutual Fund Distributor. Angel Broking Private Limited is a
registered entity with SEBI for Research Analyst in terms of SEBI (Research Analyst) Regulations, 2014 vide registration number
INH000000164. Angel or its associates has not been debarred/ suspended by SEBI or any other regulatory authority for accessing
/dealing in securities Market. Angel or its associates including its relatives/analyst do not hold any financial interest/beneficial ownership
of more than 1% in the company covered by Analyst. Angel or its associates/analyst has not received any compensation / managed or co
-managed public offering of securities of the company covered by Analyst during the past twelve months. Angel/analyst has not served as
an officer, director or employee of company covered by Analyst and has not been engaged in market making activity of the company
covered by Analyst.
This document is solely for the personal information of the recipient, and must not be singularly used as the basis of any investment
decision. Nothing in this document should be construed as investment or financial advice. Each recipient of this document should make
such investigations as they deem necessary to arrive at an independent evaluation of an investment in the securities of the companies
referred to in this document (including the merits and risks involved), and should consult their own advisors to determine the merits and
risks of such an investment.
Reports based on technical and derivative analysis center on studying charts of a stock's price movement, outstanding positions and
trading volume, as opposed to focusing on a company's fundamentals and, as such, may not match with a report on a company's
fundamentals.
The information in this document has been printed on the basis of publicly available information, internal data and other reliable sources
believed to be true, but we do not represent that it is accurate or complete and it should not be relied on as such, as this document is for
general guidance only. Angel Broking Pvt. Limited or any of its affiliates/ group companies shall not be in any way responsible for any
loss or damage that may arise to any person from any inadvertent error in the information contained in this report. Angel Broking Pvt.
Limited has not independently verified all the information contained within this document. Accordingly, we cannot testify, nor make any
representation or warranty, express or implied, to the accuracy, contents or data contained within this document. While Angel Broking
Pvt. Limited endeavors to update on a reasonable basis the information discussed in this material, there may be regulatory, compliance,
or other reasons that prevent us from doing so.
This document is being supplied to you solely for your information, and its contents, information or data may not be reproduced,
redistributed or passed on, directly or indirectly.
Neither Angel Broking Pvt. Limited, nor its directors, employees or affiliates shall be liable for any loss or damage that may arise from or
in connection with the use of this information.
Note: Please refer to the important ‘Stock Holding Disclosure' report on the Angel website (Research Section). Also, please refer to the
latest update on respective stocks for the disclosure status in respect of those stocks. Angel Broking Pvt. Limited and its affiliates may have
investment positions in the stocks recommended in this report.