Market Outlook
August 09, 2016
Market Cues
Domestic Indices
Chg (%)
(Pts)
(Close)
Indian markets are likely to open in flat tracking SGX Nifty and Global markets.
BSE Sensex
0.4
104
28,183
After the sharp run up in the last few days, the markets might consolidate ahead of
Nifty
0.3
28
8,711
key monetary policy meet by RBI today.
Mid Cap
1.0
126
12,824
After seeing strong gains on Friday, the US markets remained lackluster on Monday
Small Cap
0.7
87
12,394
and ended the day with a marginal loss.
Bankex
0.1
13
21,657
After consecutive gains in the last few trading sessions the European markets
remained largely flat on Monday. Though initially there here was good momentum
Global Indices
Chg (%)
(Pts)
(Close)
there was lack of depth during the day and the impact of BoE’s rate cut and strong
Dow Jones
(0.1)
(14)
18,529
job data by US seems to have faded away.
Nasdaq
(0.2)
(8)
5213
The Indian markets continued to gain on Monday with selective buying in across
FTSE
0.2
16
6809
sectors. However, banking stocks and in general mood in the markets remained
cautious as, all eyes are on the monetary policy meeting, the last policy meet by Dr
Nikkei
2.4
396
16,651
Raghuram Rajan.
Hang Seng
1.6
349
22,495
Shanghai Com
0.9
28
3,004
News Analysis & Result Review
Results Review: Strong results by HeroMotoCorp.
Advances / Declines
BSE
NSE
Detailed analysis on Pg2
Advances
1,546
908
Investor’s Ready Reckoner
Declines
1,220
711
Key Domestic & Global Indicators
Unchanged
158
76
Stock Watch: Latest investment recommendations on 150+ stocks
Refer Pg6 onwards
Volumes (` Cr)
BSE
3,691
Top Picks
CMP
Target
Upside
NSE
20,676
Company
Sector
Rating
(`)
(`)
(%)
Amara Raja
Auto/Auto Ancillary
Buy
928
1,076
16.0
Net Inflows (` Cr)
Net
Mtd
Ytd
HCL Tech
IT
Buy
819
1,000
22.1
LIC Housing
Financials
Accumulate
526
582
10.7
FII
1156
3992
10,123
Bharat Electronics
Capital Goods
Accumulate
1,242
1,414
13.8
MFs
(876)
(2385)
(6055)
Navkar Corporation Others
Buy
206
265
28.7
More Top Picks on Pg4
Top Gainers
Price (`)
Chg (%)
Muthootfin
399
13.5
Key Upcoming Events
Previous
Consensus
Carerating
1,155
9.6
Date
Region
Event Description
Reading
Expectations
Britannia
3,152
9.4
Aug 9
India
RBI Reverse Repo rate
6.0
6.0
Justdial
501
7.2
Aug 9
India
RBI Repo rate
6.5
6.5
Colpal
1,016
6.2
Aug 9
India
Exports YoY %
1.3
--
Aug 9
China
Consumer Price Index (YoY)
1.9
1.8
Top Losers
Price (`)
Chg (%)
Aug 10
India
RBI Cash Reserve Ratio
4.0
4.0
6.(
More Events on Pg5
Wockpharma
915
(9.9)
Unionbank
128
(6.5)
Ifci
27
(6.0)
Andhrabank
58
(5.0)
Edelweiss
108
(3.7)
As on August 8, 2016
Market Outlook
August 09, 2016
Hero MotoCorp reported strong set of results
Hero Moto Corp Ltd reported a strong set of results for the quarter with PAT
growing by 18.2% to `883cr vs `747cr YoY. While income from operations grew
by 7.7% to `7,901cr, from `7,336cr, higher margins led to the better than
expected bottom-line. For the quarter the EBITDA margins improved to 16.6%
compared to 15.1% for the full year FY16. The company sold 1.74 Mn Units of
two wheelers a growth of 6.1% compared to 1.64 Mn Units in the same period last
year.
While the management remains cautiously optimistic, an above normal monsoon
is likely to result in a strong sales growth in the coming festive season. The
company derives nearly half of its revenues from the rural market and hence good
monsoon leading to better disposable income in the hands of rural consumers is
certainly a positive for the company. Implementation of 7th pay commission is also
likely to add momentum to the company’s performance going ahead. Passage of
GST can be another catalyst for two wheeler manufacturers and HeroMotoCorp
being the largest player in the domestic market could be a key beneficiary.
Economic and Political News
DoT to start spectrum auctions on 29th September
Mercedes Benz asks Supreme court to lift ban of diesel cars
Corporate News
Colgate Palmolive PAT jumps 8% to `126cr
Brittania Industries PAT up 13.2% to `219cr
SBI asks five banks to clean books before merger
Market Outlook
August 09, 2016
Quarterly Bloomberg Brokers Consensus Estimate
Lupin Ltd - Aug 9, 2016
Particulars (` cr)
1QFY17E
1QFY16
y-o-y (%)
4QFY16
q-o-q (%)
Net sales
4,423
3,074
43.9
4,091
8.1
EBITDA
1,372
817
68.0
1,367
0.4
EBITDA margin (%)
31.0
26.6
33.4
Net profit
793
525
51.0
807
(1.8)
Tata Global Beverages Ltd Consol - Aug 9, 2016
Particulars (` cr)
1QFY17E
1QFY16
y-o-y (%)
4QFY16
q-o-q (%)
Net sales
2,118
2,004
5.7
1,928
9.9
EBITDA
198
188
5.0
166
19.1
EBITDA margin (%)
9.3
9.4
8.6
Net profit
99
82
20.4
107
(7.0)
Power Finance Corp Ltd - Aug 9, 2016
Particulars (` cr)
1QFY17E
1QFY16
y-o-y (%)
4QFY16
q-o-q (%)
Net profit
1,405
1,576
(10.8)
1,260
11.6
Adani Ports & Special Economic Zone Ltd - Aug 9, 2016
Particulars (` cr)
1QFY17E
1QFY16
y-o-y (%)
4QFY16
q-o-q (%)
Net sales
1807
1723
(4.9)
1,860
(2.8)
EBITDA
1086
1294
(16.1)
1439
24.5
EBITDA margin (%)
60.1
75.10
77.4
Net profit
641
641
0.0
914
(29.9)
Mahindra & Mahindra Ltd - Aug 10, 2016
Particulars (` cr)
1QFY17E
1QFY16
y-o-y (%)
4QFY16
q-o-q (%)
Net sales
11,195
9,708
15.3
10,666
5.0
EBITDA
1,477
1,252
18.0
1,049
40.8
EBITDA margin (%)
13.2
12.9
9.8
Net profit
898
852
5.3
584
53.8
Motherson Sumi System Ltd - Aug 10, 2016
Particulars (` cr)
1QFY17E
1QFY16
y-o-y (%)
4QFY16
q-o-q (%)
Net sales
10785
9,252
16.6
10,068
7.1
EBITDA
1,070
833
28.5
1,065
0.5
EBITDA margin (%)
9.9
9.0
10.6
Net profit
353
266
32.7
414
(14.7)
Market Outlook
August 09, 2016
Top Picks ★★★★★
Large Cap
Market Cap
CMP
Target
Upside
Company
Rationale
(` Cr)
(`)
(`)
(%)
To outpace battery industry growth due to better technological
Amara Raja Batteries
15,851
928
1,076
16.0
products leading to market share gains in both the automotive
OEM and replacement segments.
Uptick in defense capex by government, coupled with BELs
Bharat Electronics
29,816
1,242
1,414
13.8
strong market positioning, indicate good times ahead for BEL.
HCL Tech
1,15,548
819
1,000
22.1
Stock is trading at attractive valuations & factors all bad news.
Strong visibility for a robust 20% earnings trajectory, coupled
HDFC Bank
3,16,442
1,250
1,350
8.0
with high quality of earnings on account of high quality retail
business and strategic focus on highly rated corporates.
Back on the growth trend, expect a long term growth of 14% to
Infosys
2,47,794
1,079
1,370
27.0
be a US$20bn in FY2020.
Continues to grow its retail loan book at healthy pace with
LIC Housing Fin.
26,543
526
582
10.7
improvement in asset quality. Expect LICHF to post a healthy
loan book which is likely to reflect in a strong earnings growth.
Strong market positioning within the domestic AC markets to
Voltas
11,639
352
407
15.7
continue, EMP business set to revive
Source: Company, Angel Research
Mid Cap
Market Cap
CMP
Target
Upside
Company
Rationale
(` Cr)
(`)
(`)
(%)
Among the top 4 players in the consumer durables segment.
Bajaj Electricals
2,758
273
299
9.6
Improved profitability backed by turn around in E&P segment.
Strong order book lends earnings visibility.
Favourable outlook for the AC industry to augur well for
Cooling products business which is out pacing the market
Blue Star
4,593
482
527
9.4
growth. EMPPAC division's profitability to improve once
operating environment turns around.
With a focus on the low and medium income (LMI) consumer
Dewan Housing
7,216
247
270
9.2
segment, the company has increased its presence in tier-II & III
cities where the growth opportunity is immense.
Strong loan growth backed by diversified loan portfolio and
Equitas Holdings
6,033
180
235
30.6
adequate CAR. ROE & ROA likely to remain decent as risk of
dilution remains low. Attractive valuations considering growth.
Expectations of above average monsoon augurs well for
Goodyear India
1,240
538
631
17.3
Goodyear India as it derives ~50% of its turnover from farm
tyre segment.
Commencement of new projects, downtrend in the interest rate
IL&FS Transport
2,423
74
93
26.3
cycle, to lead to stock re-rating
Economic recovery to have favourable impact on advertising &
Jagran Prakashan
5,969
183
205
12.3
circulation revenue growth. Further, the acquisition of a radio business
(Radio City) would also boost the company`s revenue growth.
Speedier execution and speedier sales, strong revenue visibility
Mahindra Lifespace
1,789
436
554
27.0
in short-to-long run, attractive valuations
Massive capacity expansion along with rail advantage at ICD as
Navkar Corporation
2,936
206
265
28.7
well CFS augurs well for the company
Earnings boost on back of stable material prices and favourable
Radico Khaitan
1,210
91
125
37.4
pricing environment. Valuation discount to peers provides
additional comfort
Strong brands and distribution network would boost growth
Siyaram Silk Mills
980
1,045
1,347
28.9
going ahead. Stock currently trades at an inexpensive valuation.
Market leadership in Hindi news genre and no. 2 viewership
TV Today Network
1,771
297
363
22.2
ranking in English news genre, exit from the radio business, and
anticipated growth in ad spends by corporates to benefit the stock.
Source: Company, Angel Research
Market Outlook
August 09, 2016
Key Upcoming Events
Result Calendar
Date
Company
Tata Global, Apollo Tyres, JK Tyre, Power Fin.Corpn., UCO Bank, United Bank, Jagran Prakashan, Finolex Cables,
Aug 9, 2016
Lupin, Adani Power, Team Lease Serv., S H Kelkar & Co.
Aug 10, 2016
M&M, Motherson Sumi, Thermax, Corporation Bank, ITD Cementation, MT Educare, Manpasand Bever.
J K Lakshmi Cements, Bank of Baroda, Rural Elec.Corp., Page Industries, Styrolution, MRF, Jyothy Laboratories, MM
Aug 11, 2016
Forging, Tide Water Oil India, Ipca labs, PTC India, Coffee Day Enterprises Ltd
Bosch India, Automotive Axle, St Bk of India, Central Bank, Bank of Maharashtra, Hindalco, Bajaj Electrical, Cravatex,
Aug 12, 2016
Sun Pharma, Glenmark Pharma., NHPC, Competent Automobiles
Source: Bloomberg, Angel Research
Global economic events release calendar
Date
Time
Country
Event Description
Unit
Period
Bloomberg Data
Last Reported Estimated
Aug 9, 2016
7:00AM China
Consumer Price Index (YoY)
% Change
Jul
1.90
1.80
11:00AM India
RBI Reverse Repo rate
%
Aug 9
6.00
6.00
2:00PM UK
Industrial Production (YoY)
% Change
Jun
1.40
1.60
11:00AM India
RBI Repo rate
%
Aug 9
6.50
6.50
India
Exports YoY%
% Change
Jul
1.30
--
Aug 10, 2016 11:00AM India
RBI Cash Reserve ratio
%
Aug 9
4.00
4.00
India
Imports YoY%
% Change
Jul
(7.30)
--
Aug 11, 2016 6:00PM US
Initial Jobless claims
Thousands
Aug 6
269.00
265.00
Aug 12, 2016 2:30PM Euro Zone
Euro-Zone GDP s.a. (QoQ)
% Change
2Q P
0.30
0.30
US
Producer Price Index (mom)
% Change
Jul
0.80
--
7:30AM China
Industrial Production (YoY)
% Change
Jul
6.20
6.20
5:30PM India
Industrial Production YoY
% Change
Jun
1.20
1.50
11:30AM Germany
GDP nsa (YoY)
% Change
2Q P
1.30
2.80
Aug 16, 2016 12:00PM India
Monthly Wholesale Prices YoY%
% Change
Jul
1.62
2.75
6:00PM US
Housing Starts
Thousands
Jul
1,189.00
1,180.00
6:00PM US
Building permits
Thousands
Jul
1,153.00
1,160.00
6:00PM US
Consumer price index (mom)
% Change
Jul
0.20
0.10
2:00PM UK
CPI (YoY)
% Change
Jul
0.50
--
6:45PM US
Industrial Production
%
Jul
0.60
0.20
Aug 17, 2016 2:00PM UK
Jobless claims change
% Change
Jul
0.40
--
Aug 18, 2016 2:30PM Euro Zone
Euro-Zone CPI (YoY)
%
Jul F
0.20
--
Aug 23, 2016 7:30PM Euro Zone
Euro-Zone Consumer Confidence
Value
Aug A
(7.90)
--
7:30PM US
New home sales
Thousands
Jul
592.00
--
Aug 24, 2016 1:00PM Germany
PMI Services
Value
Aug P
54.40
--
1:00PM Germany
PMI Manufacturing
Value
Aug P
53.80
--
7:30PM US
Existing home sales
Million
Jul
5.57
--
Source: Bloomberg, Angel Research
Market Outlook
August 9, 2016
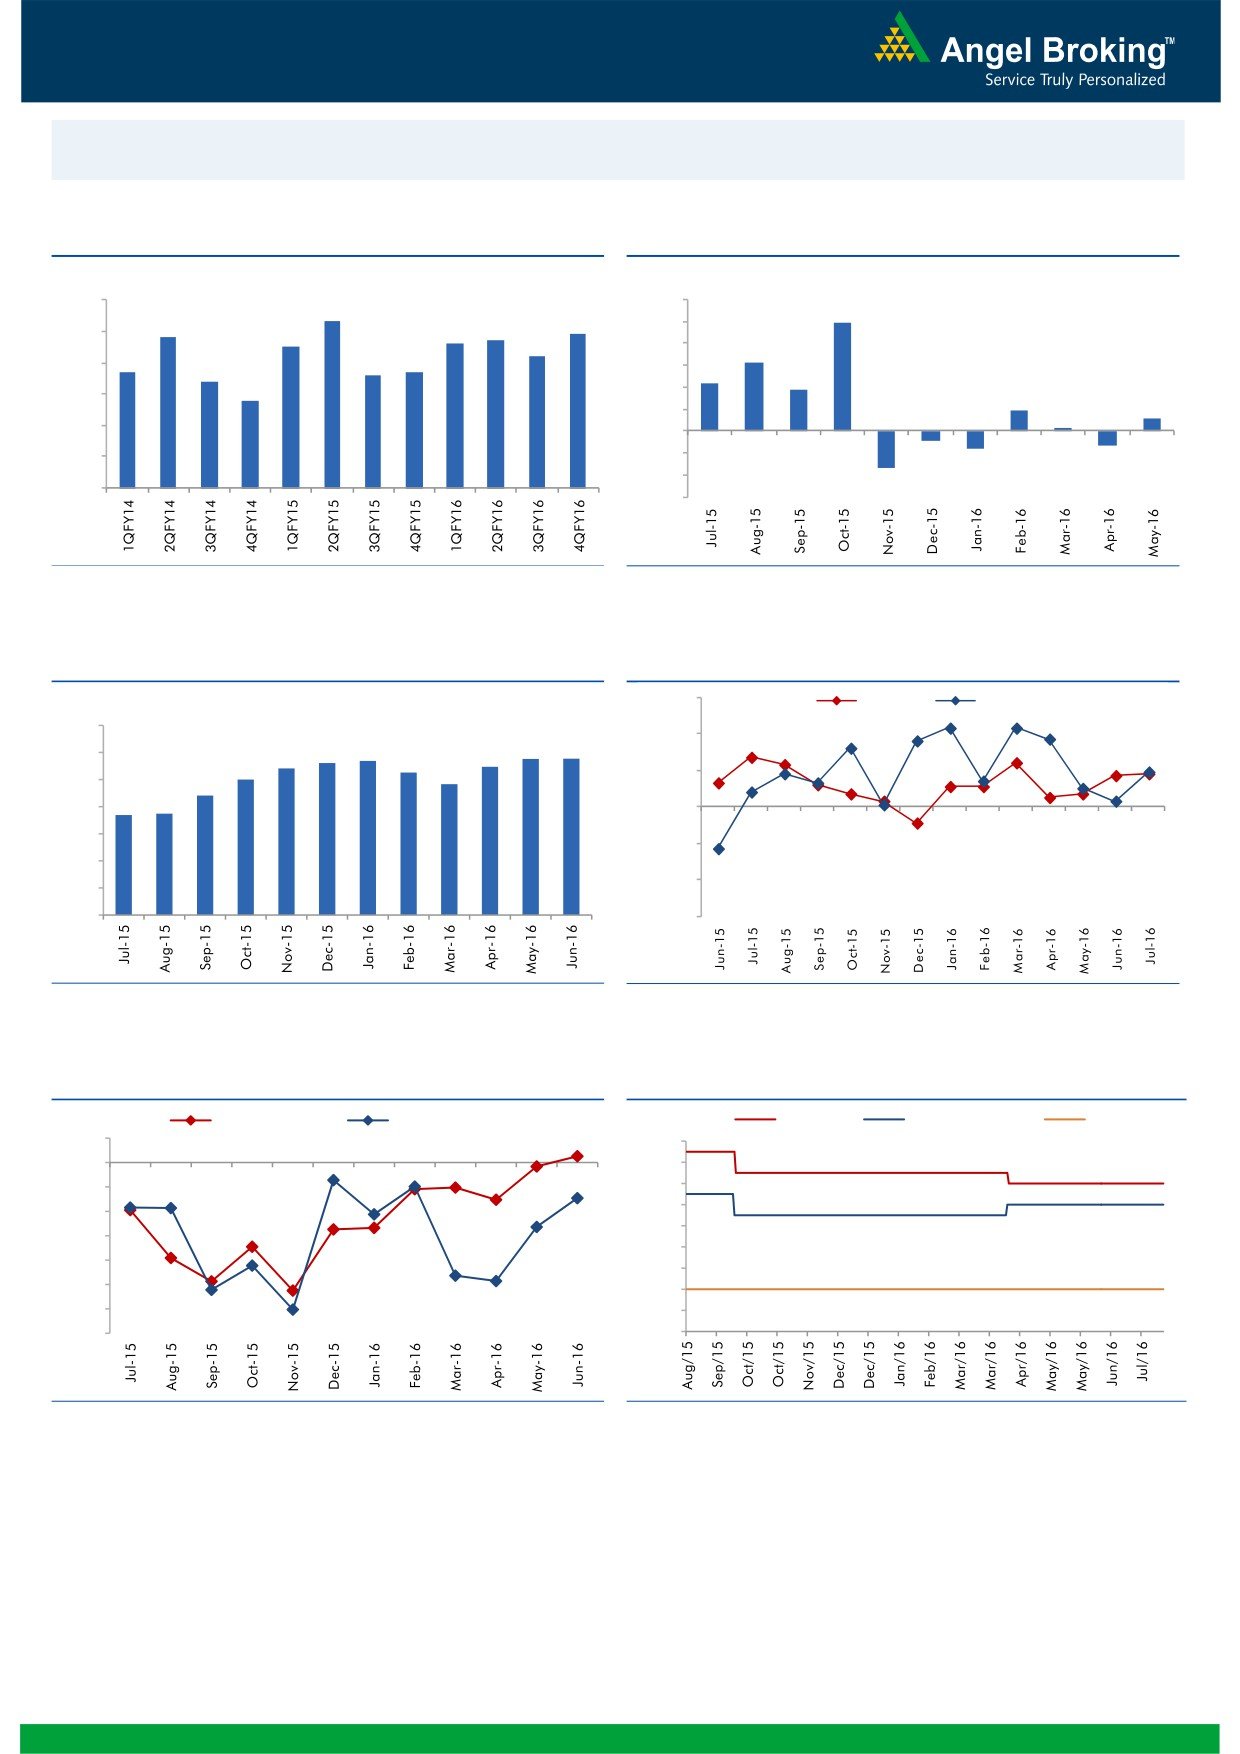
Macro watch
Exhibit 1: Quarterly GDP trends
Exhibit 2: IIP trends
(%)
(%)
9.0
8.3
12.0
9.9
7.8
7.7
7.9
10.0
8.0
7.5
7.6
7.2
8.0
6.3
6.7
6.6
6.7
7.0
6.4
6.0
4.3
3.7
5.8
4.0
6.0
1.9
1.2
2.0
0.3
5.0
-
4.0
(2.0)
(0.9)
(1.3)
(1.6)
(4.0)
3.0
(3.4)
(6.0)
Source: CSO, Angel Research
Source: MOSPI, Angel Research
Exhibit 3: Monthly CPI inflation trends
Exhibit 4: Manufacturing and services PMI
(%)
56.0
Mfg. PMI
Services PMI
7.0
54.0
5.7
5.8
5.8
5.4
5.6
5.5
6.0
5.3
5.0
4.8
52.0
5.0
4.4
3.7
3.7
4.0
50.0
3.0
48.0
2.0
46.0
1.0
-
44.0
Source: MOSPI, Angel Research
Source: Market, Angel Research; Note: Level above 50 indicates expansion
Exhibit 5: Exports and imports growth trends
Exhibit 6: Key policy rates
(%)
Exports yoy growth
Imports yoy growth
(%)
Repo rate
Reverse Repo rate
CRR
5.0
7.50
0.0
7.00
(5.0)
6.50
6.00
(10.0)
5.50
(15.0)
5.00
(20.0)
4.50
(25.0)
4.00
(30.0)
3.50
(35.0)
3.00
Source: Bloomberg, Angel Research
Source: RBI, Angel Research
Stock Watch
August 09, 2016
Company Name
Reco
CMP
Target
Mkt Cap
Sales ( Čcr )
OPM(%)
EPS (Č)
PER(x)
P/BV(x)
RoE(%)
EV/Sales(x)
(Č)
Price ( Č)
( Č cr )
FY17E FY18E
FY17E
FY18E
FY17E
FY18E
FY17E
FY18E
FY17E
FY18E
FY17E
FY18E
FY17E
FY18E
Agri / Agri Chemical
Rallis
Neutral
217
-
4,220
1,937
2,164
13.3
14.3
9.0
11.0
24.1
19.7
4.2
3.7
18.4
19.8
2.2
2.0
United Phosphorus
Accumulate
623
684
26,687
15,176
17,604
18.5
18.5
37.4
44.6
16.7
14.0
3.3
2.7
21.4
21.2
1.8
1.5
Auto & Auto Ancillary
Ashok Leyland
Buy
89
111
25,357
22,407
26,022
10.6
10.6
5.2
6.4
17.1
13.9
3.9
3.3
23.6
24.7
1.2
1.0
Bajaj Auto
Neutral
2,873
-
83,135
25,093
27,891
19.5
19.2
143.9
162.5
20.0
17.7
5.6
4.8
30.3
29.4
3.0
2.6
Bharat Forge
Accumulate
826
875
19,223
7,726
8,713
20.5
21.2
35.3
42.7
23.4
19.3
4.3
3.9
18.9
20.1
2.5
2.2
Eicher Motors
Neutral
22,432
-
60,927
16,583
20,447
17.5
18.0
598.0
745.2
37.5
30.1
12.8
9.8
41.2
38.3
3.5
2.8
Gabriel India
Neutral
108
-
1,557
1,544
1,715
9.0
9.3
5.4
6.3
20.1
17.2
3.8
3.4
18.9
19.5
0.9
0.8
Hero Motocorp
Neutral
3,457
-
69,028
31,253
35,198
15.3
15.0
172.3
192.1
20.1
18.0
7.4
6.3
38.9
37.0
2.1
1.8
Jamna Auto Industries Neutral
199
-
1,588
1,486
1,620
9.8
9.9
15.0
17.2
13.3
11.6
2.9
2.5
21.8
21.3
1.1
1.0
L G Balakrishnan & Bros Neutral
481
-
755
1,302
1,432
11.6
11.9
43.7
53.0
11.0
9.1
1.6
1.4
13.8
14.2
0.7
0.6
Mahindra and Mahindra Neutral
1,497
-
93,002
46,534
53,077
11.6
11.7
67.3
78.1
22.2
19.2
3.6
3.2
15.4
15.8
2.0
1.7
Maruti
Neutral
4,992
-
150,797
69,186
82,217
14.7
14.4
198.5
241.4
25.2
20.7
4.9
4.0
20.2
20.0
1.9
1.5
Minda Industries
Neutral
1,166
-
1,850
2,728
3,042
9.0
9.1
68.2
86.2
17.1
13.5
3.9
3.1
23.8
24.3
0.7
0.6
Motherson Sumi
Neutral
350
-
46,329
45,896
53,687
7.8
8.3
13.0
16.1
26.9
21.8
8.7
6.9
34.7
35.4
1.1
0.9
Rane Brake Lining
Neutral
688
-
545
511
562
11.3
11.5
28.1
30.9
24.5
22.3
3.7
3.4
15.3
15.0
1.1
1.1
Setco Automotive
Neutral
50
-
664
741
837
13.0
13.0
15.2
17.0
3.3
2.9
0.5
0.5
15.8
16.3
1.3
1.2
Tata Motors
Neutral
514
-
148,388
300,209
338,549
8.9
8.4
42.7
54.3
12.1
9.5
1.9
1.6
15.6
17.2
0.6
0.5
TVS Motor
Accumulate
304
330
14,447
13,390
15,948
6.9
7.1
12.8
16.5
23.8
18.4
5.9
4.7
26.3
27.2
1.1
0.9
Amara Raja Batteries
Buy
928
1,076
15,851
5,717
6,733
18.7
18.9
38.4
48.9
24.2
19.0
6.0
4.9
25.3
24.8
2.6
2.1
Exide Industries
Neutral
174
-
14,790
7,439
8,307
15.0
15.0
8.1
9.3
21.5
18.7
3.0
2.7
14.3
16.7
1.6
1.4
Apollo Tyres
Neutral
181
-
9,201
12,877
14,504
14.3
13.9
21.4
23.0
8.4
7.9
1.3
1.1
16.4
15.2
0.9
0.8
Ceat
Buy
913
1,119
3,695
7,524
8,624
13.0
12.7
131.1
144.3
7.0
6.3
1.3
1.1
19.8
18.6
0.6
0.5
JK Tyres
Neutral
106
-
2,395
7,455
8,056
15.0
15.0
21.8
24.5
4.8
4.3
1.0
0.8
22.8
21.3
0.4
0.4
Swaraj Engines
Neutral
1,116
-
1,386
660
810
15.2
16.4
54.5
72.8
20.5
15.3
6.4
5.8
31.5
39.2
1.9
1.5
Subros
Neutral
96
-
574
1,488
1,681
11.7
11.9
6.4
7.2
15.0
13.4
1.6
1.4
10.8
11.4
0.6
0.5
Indag Rubber
Neutral
183
-
480
286
326
19.8
16.8
11.7
13.3
15.6
13.7
2.6
2.5
17.8
17.1
1.3
1.2
Capital Goods
ACE
Neutral
47
-
467
709
814
4.1
4.6
1.4
2.1
33.7
22.5
1.4
1.3
4.4
6.0
0.8
0.7
BEML
Accumulate
1,017
1,157
4,234
3,451
4,055
6.3
9.2
31.4
57.9
32.4
17.6
1.9
1.8
6.3
10.9
1.4
1.2
Bharat Electronics
Accumulate
1,242
1,414
29,816
8,137
9,169
16.8
17.2
58.7
62.5
21.2
19.9
3.3
2.9
44.6
46.3
2.7
2.4
Stock Watch
August 09, 2016
Company Name
Reco
CMP
Target
Mkt Cap
Sales ( Čcr )
OPM(%)
EPS (Č)
PER(x)
P/BV(x)
RoE(%)
EV/Sales(x)
(Č)
Price ( Č)
( Č cr )
FY17E
FY18E
FY17E
FY18E
FY17E
FY18E
FY17E
FY18E
FY17E
FY18E
FY17E
FY18E
FY17E
FY18E
Capital Goods
Voltas
Buy
352
407
11,639
6,511
7,514
7.9
8.7
12.9
16.3
27.3
21.6
4.9
4.3
16.7
18.5
1.5
1.3
BGR Energy
Neutral
121
-
875
16,567
33,848
6.0
5.6
7.8
5.9
15.6
20.6
0.9
0.9
4.7
4.2
0.2
0.1
BHEL
Neutral
140
-
34,291
28,797
34,742
-
2.8
2.3
6.9
60.9
20.3
1.0
1.0
1.3
4.8
0.8
0.6
Blue Star
Accumulate
482
527
4,593
4,351
5,024
6.4
7.1
17.2
20.6
28.1
23.3
18.2
15.2
23.1
24.1
1.1
1.0
Crompton Greaves
Neutral
84
-
5,271
5,777
6,120
5.9
7.0
3.3
4.5
25.5
18.7
1.1
1.1
4.4
5.9
0.8
0.7
Greaves Cotton
Neutral
138
-
3,381
1,755
1,881
16.8
16.9
7.8
8.5
17.8
16.3
3.6
3.3
20.6
20.9
1.6
1.5
Inox Wind
Buy
209
286
4,633
5,605
6,267
15.7
16.4
24.8
30.0
8.4
7.0
2.4
1.7
25.9
24.4
0.9
0.8
KEC International
Neutral
142
-
3,639
9,294
10,186
7.9
8.1
9.9
11.9
14.3
11.9
2.1
1.8
15.6
16.3
0.6
0.6
Thermax
Neutral
909
-
10,826
5,421
5,940
7.3
7.3
25.7
30.2
35.4
30.1
4.3
3.9
12.2
13.1
1.8
1.6
VATech Wabag
Buy
586
681
3,192
3,136
3,845
8.9
9.1
26.0
35.9
22.5
16.3
2.8
2.4
13.4
15.9
0.9
0.7
Cement
ACC
Neutral
1,712
-
32,140
11,225
13,172
13.2
16.9
44.5
75.5
38.5
22.7
3.6
3.4
11.2
14.2
2.9
2.5
Ambuja Cements
Neutral
276
-
42,863
9,350
10,979
18.2
22.5
5.8
9.5
47.6
29.1
4.0
3.6
10.2
12.5
4.6
3.9
India Cements
Neutral
125
-
3,831
4,364
4,997
18.5
19.2
7.9
11.3
15.8
11.0
1.1
1.1
8.0
8.5
1.6
1.4
JK Cement
Neutral
767
-
5,362
4,398
5,173
15.5
17.5
31.2
55.5
24.6
13.8
3.0
2.6
12.0
15.5
1.7
1.4
J K Lakshmi Cement
Neutral
448
-
5,266
2,913
3,412
14.5
19.5
7.5
22.5
59.7
19.9
3.7
3.1
12.5
18.0
2.3
1.9
Orient Cement
Neutral
162
-
3,318
2,114
2,558
18.5
20.5
8.1
11.3
20.0
14.3
2.9
2.5
9.0
14.0
2.2
1.8
UltraTech Cement
Neutral
3,780
-
103,733
25,768
30,385
21.0
23.5
111.0
160.0
34.1
23.6
4.3
3.8
13.5
15.8
4.1
3.5
Construction
ITNL
Buy
74
93
2,423
8,946
10,017
31.0
31.6
8.1
9.1
9.1
8.1
0.3
0.3
4.2
5.0
3.6
3.3
KNR Constructions
Neutral
617
-
1,736
1,210
1,595
15.4
16.0
33.9
52.1
18.2
11.9
2.8
2.4
13.6
18.0
1.4
1.1
Larsen & Toubro
Accumulate
1,507
1,700
140,486
67,665
77,249
10.7
11.5
57.3
71.2
26.3
21.2
2.4
2.3
12.6
14.3
2.3
2.0
Gujarat Pipavav Port
Neutral
171
-
8,250
705
788
52.2
51.7
5.0
5.6
34.1
30.5
3.4
3.0
11.2
11.2
11.4
9.7
MBL Infrastructures
Buy
124
285
514
2,797
3,405
14.7
15.4
21.0
34.8
5.9
3.6
0.6
0.5
11.0
16.2
0.8
0.8
Nagarjuna Const.
Neutral
79
-
4,378
8,842
9,775
9.1
8.8
5.3
6.4
14.9
12.3
1.2
1.1
8.2
9.1
0.7
0.6
PNC Infratech
Accumulate
570
647
2,927
2,350
2,904
13.4
13.7
48.0
42.0
11.9
13.6
2.3
2.1
16.8
13.2
1.3
1.1
Simplex Infra
Neutral
307
-
1,520
6,829
7,954
10.5
10.5
31.4
37.4
9.8
8.2
1.0
0.9
9.9
13.4
0.6
0.5
Power Mech Projects
Neutral
534
-
786
1,801
2,219
12.7
14.6
72.1
113.9
7.4
4.7
1.4
1.2
16.8
11.9
0.4
0.3
Sadbhav Engineering
Neutral
287
-
4,914
3,598
4,140
10.3
10.6
9.0
11.9
31.8
24.1
3.3
2.9
9.9
11.9
1.7
1.4
NBCC
Neutral
243
-
14,577
7,428
9,549
7.9
8.6
8.2
11.0
29.6
22.1
1.5
1.2
28.2
28.7
1.7
1.3
MEP Infra
Neutral
43
-
704
1,877
1,943
30.6
29.8
3.0
4.2
14.4
10.3
7.0
4.7
0.6
0.6
1.8
1.6
Stock Watch
August 09, 2016
Company Name
Reco
CMP
Target
Mkt Cap
Sales ( Čcr )
OPM(%)
EPS (Č)
PER(x)
P/BV(x)
RoE(%)
EV/Sales(x)
(Č)
Price ( Č)
( Č cr )
FY17E
FY18E
FY17E
FY18E
FY17E
FY18E
FY17E
FY18E
FY17E
FY18E
FY17E
FY18E
FY17E
FY18E
Construction
SIPL
Neutral
98
-
3,455
1,036
1,252
65.5
66.2
(8.4)
(5.6)
3.7
4.2
(22.8)
(15.9)
11.6
9.6
Engineers India
Neutral
229
-
7,731
1,725
1,935
16.0
19.1
11.4
13.9
20.1
16.5
2.8
2.7
13.4
15.3
3.2
2.9
Financials
Axis Bank
Neutral
569
-
135,866
58,081
66,459
3.5
3.5
32.4
44.6
17.6
12.8
2.3
2.0
13.6
16.5
-
-
Bank of Baroda
Neutral
157
-
36,210
19,980
23,178
1.8
1.8
11.5
17.3
13.7
9.1
1.6
1.3
8.3
10.1
-
-
Canara Bank
Neutral
258
-
14,009
15,225
16,836
1.8
1.8
14.5
28.0
17.8
9.2
1.2
1.0
5.8
8.5
-
-
Dewan Housing Finance Accumulate
247
270
7,216
2,225
2,688
2.9
2.9
29.7
34.6
8.3
7.2
1.3
1.2
16.1
16.8
-
-
Equitas Holdings
Buy
180
235
6,033
939
1,281
11.7
11.5
5.8
8.2
31.0
21.9
2.7
2.4
10.9
11.5
-
-
Federal Bank
Neutral
64
-
10,928
9,353
10,623
2.9
2.9
4.4
5.8
14.5
11.0
1.4
1.2
9.5
11.0
-
-
HDFC
Neutral
1,367
-
216,189
11,475
13,450
3.4
3.4
45.3
52.5
30.2
26.1
5.8
5.1
20.2
20.5
-
-
HDFC Bank
Accumulate
1,250
1,350
316,442
46,097
55,433
4.5
4.5
58.4
68.0
21.4
18.4
3.8
3.1
18.8
18.6
-
-
ICICI Bank
Neutral
245
-
142,660
39,029
45,903
3.3
3.3
16.7
16.3
14.7
15.1
1.8
1.7
10.1
12.4
-
-
LIC Housing Finance
Accumulate
526
582
26,543
3,712
4,293
2.6
2.5
39.0
46.0
13.5
11.4
2.5
2.2
19.9
20.1
-
-
Punjab Natl.Bank
Neutral
123
-
24,133
23,532
23,595
2.3
2.4
6.8
12.6
18.1
9.8
2.8
2.0
3.3
6.5
-
-
South Ind.Bank
Neutral
22
-
2,917
6,435
7,578
2.5
2.5
2.7
3.1
8.0
7.0
1.0
0.9
10.1
11.2
-
-
St Bk of India
Neutral
233
-
180,912
88,650
98,335
2.6
2.6
13.5
18.8
17.3
12.4
1.6
1.4
7.0
8.5
-
-
Union Bank
Neutral
128
-
8,816
13,450
14,925
2.3
2.3
25.5
34.5
5.0
3.7
0.7
0.6
7.5
10.2
-
-
Yes Bank
Neutral
1,264
-
53,229
8,978
11,281
3.3
3.4
74.0
90.0
17.1
14.1
3.2
2.8
17.0
17.2
-
-
FMCG
Asian Paints
Neutral
1,149
-
110,212
17,128
18,978
16.8
16.4
19.1
20.7
60.2
55.5
20.9
19.7
34.8
35.5
6.3
5.7
Britannia
Neutral
3,152
-
37,817
9,795
10,940
14.1
14.1
80.3
93.0
39.3
33.9
16.1
12.5
41.2
-
3.4
3.0
Colgate
Neutral
1,016
-
27,645
4,605
5,249
22.8
22.8
25.2
28.5
40.3
35.7
27.3
24.3
64.8
66.8
5.6
4.9
Dabur India
Neutral
293
-
51,560
9,405
10,581
18.1
18.3
8.1
9.2
36.2
31.9
10.1
8.4
31.6
31.0
5.2
4.6
GlaxoSmith Con*
Neutral
6,305
-
26,515
4,959
5,623
17.4
18.0
190.5
219.3
33.1
28.8
9.1
7.8
29.6
29.5
4.7
4.1
Godrej Consumer
Neutral
1,571
-
53,488
10,335
11,518
18.4
18.6
41.5
46.0
37.9
34.2
8.5
7.2
24.9
24.8
5.3
4.7
HUL
Neutral
929
-
201,123
35,252
38,495
17.6
17.4
20.4
21.9
45.5
42.4
37.4
32.8
82.2
77.3
5.5
5.0
ITC
Accumulate
250
283
301,770
40,059
44,439
39.0
39.2
9.1
10.1
27.5
24.8
7.5
6.6
27.2
26.5
7.1
6.3
Marico
Neutral
300
-
38,712
6,730
7,649
17.3
17.5
6.4
7.6
46.9
39.5
14.2
11.9
33.2
32.5
5.5
4.8
Nestle*
Neutral
6,852
-
66,063
9,393
10,507
22.2
22.3
106.8
121.8
64.2
56.3
22.5
20.3
34.8
36.7
6.8
6.0
Tata Global
Neutral
143
-
9,019
9,072
9,687
9.4
9.8
7.2
7.8
19.9
18.3
2.2
2.1
7.6
7.9
0.9
0.9
Procter & Gamble
Buy
6,680
7,369
21,682
2,939
3,342
23.2
23.0
146.2
163.7
45.7
40.8
102.3
98.1
25.3
23.5
6.6
5.7
Hygiene
Stock Watch
August 09, 2016
Company Name
Reco
CMP
Target
Mkt Cap
Sales ( Čcr )
OPM(%)
EPS (Č)
PER(x)
P/BV(x)
RoE(%)
EV/Sales(x)
(Č)
Price ( Č)
( Č cr )
FY17E FY18E
FY17E
FY18E
FY17E
FY18E
FY17E
FY18E
FY17E
FY18E
FY17E
FY18E
FY17E
FY18E
IT
HCL Tech^
Buy
819
1,000
115,548
49,242
57,168
20.5
20.5
55.7
64.1
14.7
12.8
3.0
2.3
20.3
17.9
2.2
1.8
Infosys
Buy
1,079
1,370
247,794
69,934
79,025
27.5
27.5
64.8
72.0
16.7
15.0
3.7
3.3
22.0
22.3
3.0
2.6
TCS
Accumulate
2,652
3,004
522,538
121,684
136,286
27.3
27.3
135.0
150.1
19.6
17.7
6.5
6.0
33.2
33.9
4.1
3.6
Tech Mahindra
Buy
503
700
48,836
30,347
33,685
17.0
17.0
37.5
41.3
13.4
12.2
2.9
2.5
21.8
20.7
1.3
1.1
Wipro
Buy
549
680
135,655
51,631
55,822
21.7
17.9
35.9
36.9
15.3
14.9
3.2
3.0
19.0
18.1
2.3
2.1
Media
D B Corp
Neutral
411
-
7,552
2,187
2,329
27.4
28.2
18.9
21.0
21.7
19.6
4.6
4.0
23.7
23.1
3.2
3.0
HT Media
Neutral
78
-
1,820
2,673
2,891
13.2
13.8
7.2
8.5
10.9
9.2
0.8
0.8
7.8
8.3
0.3
0.2
Jagran Prakashan
Accumulate
183
205
5,969
2,355
2,635
28.0
28.0
9.9
10.8
18.4
16.9
3.7
3.2
21.7
21.7
2.5
2.2
Sun TV Network
Neutral
466
-
18,345
2,850
3,265
70.1
71.0
26.2
30.4
17.8
15.3
4.6
4.0
24.3
25.6
6.0
5.1
Hindustan Media
Neutral
274
-
2,007
1,016
1,138
21.5
21.5
23.3
25.8
11.7
10.6
1.9
1.7
16.2
15.8
1.3
1.1
Ventures
TV Today Network
Buy
297
363
1,771
637
743
27.5
27.5
18.4
21.4
16.2
13.9
2.8
2.4
17.4
17.2
2.4
2.0
Metals & Mining
Coal India
Neutral
332
-
209,735
84,638
94,297
21.4
22.3
24.5
27.1
13.6
12.3
5.6
5.4
42.6
46.0
2.0
1.8
Hind. Zinc
Neutral
220
-
93,105
14,252
18,465
55.9
48.3
15.8
21.5
14.0
10.3
2.3
2.0
17.0
20.7
6.5
5.0
Hindalco
Neutral
149
-
30,789
107,899
112,095
7.4
8.2
9.2
13.0
16.2
11.5
0.8
0.7
4.8
6.6
0.8
0.7
JSW Steel
Neutral
1,729
-
41,805
53,201
58,779
16.1
16.2
130.6
153.7
13.2
11.3
1.8
1.6
14.0
14.4
1.6
1.3
NMDC
Neutral
102
-
40,519
6,643
7,284
44.4
47.7
7.1
7.7
14.4
13.3
1.3
1.2
8.8
9.2
3.9
3.5
SAIL
Neutral
48
-
19,804
47,528
53,738
(0.7)
2.1
(1.9)
2.6
18.4
0.5
0.5
(1.6)
3.9
1.3
1.2
Vedanta
Neutral
170
-
50,266
71,744
81,944
19.2
21.7
13.4
20.1
12.7
8.4
1.1
1.0
8.4
11.3
1.1
0.8
Tata Steel
Neutral
380
-
36,862
121,374
121,856
7.2
8.4
18.6
34.3
20.4
11.1
1.3
1.2
6.1
10.1
0.9
0.9
Oil & Gas
Cairn India
Neutral
197
-
36,907
9,127
10,632
4.3
20.6
8.8
11.7
22.4
16.8
0.7
0.7
3.3
4.2
5.5
4.6
GAIL
Neutral
382
-
48,443
56,220
65,198
9.3
10.1
27.1
33.3
14.1
11.5
1.3
1.2
9.3
10.7
1.1
0.9
ONGC
Neutral
226
-
193,354
137,222
152,563
15.0
21.8
19.5
24.1
11.6
9.4
1.0
0.9
8.5
10.1
1.7
1.5
Indian Oil Corp
Neutral
583
-
141,428
373,359
428,656
5.9
5.5
54.0
59.3
10.8
9.8
1.7
1.5
16.0
15.6
0.5
0.5
Reliance Industries
Neutral
1,030
-
333,858
301,963
358,039
12.1
12.6
87.7
101.7
11.7
10.1
1.2
1.1
10.7
11.3
1.6
1.3
Pharmaceuticals
Alembic Pharma
Neutral
633
-
11,939
3,483
4,083
20.2
21.4
24.3
30.4
26.1
20.8
5.9
4.7
25.5
25.3
3.4
2.8
Aurobindo Pharma
Accumulate
772
877
45,160
15,720
18,078
23.7
23.7
41.4
47.3
18.6
16.3
4.8
3.8
29.6
26.1
3.1
2.7
Sanofi India*
Neutral
4,485
-
10,329
2,357
2,692
17.3
17.3
153.5
169.2
29.2
26.5
5.0
4.0
25.8
28.4
4.1
3.3
Cadila Healthcare
Accumulate
374
400
38,262
11,126
13,148
22.0
22.0
17.1
20.0
21.9
18.7
5.6
4.5
28.8
26.6
3.5
2.8
Cipla
Neutral
535
-
42,991
15,378
18,089
17.4
18.4
21.6
27.2
24.8
19.7
3.2
2.8
13.7
15.2
3.0
2.5
Stock Watch
August 09, 2016
Company Name
Reco
CMP
Target
Mkt Cap
Sales ( Čcr )
OPM(%)
EPS (Č)
PER(x)
P/BV(x)
RoE(%)
EV/Sales(x)
(Č)
Price ( Č)
( Č cr )
FY17E FY18E
FY17E
FY18E
FY17E
FY18E
FY17E
FY18E
FY17E
FY18E
FY17E
FY18E
FY17E
FY18E
Pharmaceuticals
Dr Reddy's
Neutral
3,035
-
51,762
16,043
18,119
23.1
24.7
126.0
157.8
24.1
19.2
3.6
3.1
15.7
17.1
3.1
2.8
Dishman Pharma
Neutral
169
-
2,727
1,718
1,890
21.7
21.8
8.7
10.4
19.4
16.3
1.7
1.6
9.3
10.2
2.1
1.8
GSK Pharma*
Neutral
3,115
-
26,385
3,528
3,811
16.6
18.8
51.8
59.4
60.1
52.4
16.1
16.0
26.3
30.6
7.3
6.8
Indoco Remedies
Sell
311
225
2,866
1,112
1,289
18.2
18.2
13.2
15.6
23.6
19.9
4.2
3.6
19.2
19.2
2.7
2.3
Ipca labs
Buy
513
613
6,474
3,303
3,799
15.3
15.3
17.3
19.7
29.7
26.1
2.6
2.4
9.1
9.4
2.1
1.8
Lupin
Accumulate
1,693
1,809
76,316
15,912
18,644
26.4
26.7
58.1
69.3
29.1
24.4
5.7
4.7
21.4
20.9
4.8
4.0
Sun Pharma
Accumulate
833
944
200,454
31,129
35,258
30.0
30.9
28.0
32.8
29.8
25.4
4.6
3.8
18.7
18.9
6.1
5.2
Power
Tata Power
Neutral
73
-
19,676
36,916
39,557
17.4
27.1
5.1
6.3
14.3
11.6
1.3
1.2
9.0
10.3
1.5
1.4
NTPC
Neutral
160
-
131,804
86,605
95,545
17.5
20.8
11.8
13.4
13.6
11.9
1.4
1.3
10.5
11.1
2.9
2.9
Power Grid
Neutral
178
-
93,305
25,763
29,762
74.3
73.1
14.8
17.3
12.1
10.3
1.9
1.7
16.9
17.5
7.9
7.5
Real Estate
MLIFE
Buy
436
554
1,789
925
1,139
18.4
22.3
18.3
33.8
23.8
12.9
1.1
1.1
4.9
8.5
2.7
2.1
Telecom
Bharti Airtel
Neutral
352
-
140,669
105,086
114,808
34.5
34.7
12.2
16.4
28.8
21.5
2.0
1.8
6.8
8.4
2.3
2.0
Idea Cellular
Neutral
103
-
37,124
40,133
43,731
37.2
37.1
6.4
6.5
16.1
15.9
1.3
1.2
8.2
7.6
2.0
1.7
zOthers
Abbott India
Neutral
4,756
-
10,106
3,153
3,583
14.1
14.4
152.2
182.7
31.3
26.0
153.4
131.0
25.6
26.1
2.9
2.5
Bajaj Electricals
Accumulate
273
299
2,758
5,351
6,098
5.7
5.9
12.4
15.7
22.1
17.3
3.2
2.8
14.4
16.1
0.5
0.5
Finolex Cables
Neutral
396
-
6,059
2,883
3,115
12.0
12.1
14.2
18.6
27.9
21.3
14.8
13.0
15.8
14.6
1.8
1.6
Goodyear India*
Buy
538
631
1,240
1,598
1,704
10.4
10.2
49.4
52.6
10.9
10.2
50.3
44.1
18.2
17.0
0.5
61.4
Hitachi
Neutral
1,388
-
3,775
2,081
2,433
8.8
8.9
33.4
39.9
41.6
34.8
33.5
27.9
22.1
21.4
1.8
1.5
Jyothy Laboratories
Neutral
290
-
5,246
1,440
2,052
11.5
13.0
8.5
10.0
34.1
29.0
8.3
7.6
18.6
19.3
3.9
2.7
Page Industries
Neutral
14,172
-
15,807
2,450
3,124
20.1
17.6
299.0
310.0
47.4
45.7
315.6
241.0
47.1
87.5
6.4
5.0
Relaxo Footwears
Neutral
471
-
5,654
2,085
2,469
9.2
8.2
7.6
8.0
62.3
59.3
24.2
20.6
17.9
18.8
2.8
2.4
Siyaram Silk Mills
Buy
1,045
1,347
980
1,799
2,040
11.6
11.7
104.9
122.4
10.0
8.5
1.6
1.4
16.4
16.4
0.8
0.7
Styrolution ABS India*
Neutral
625
-
1,099
1,440
1,537
9.2
9.0
40.6
42.6
15.4
14.7
39.3
35.7
12.3
11.6
0.7
0.6
TVS Srichakra
Buy
2,417
2,932
1,851
2,304
2,614
13.7
13.8
231.1
266.6
10.5
9.1
271.6
213.9
33.9
29.3
0.8
0.7
HSIL
Neutral
339
-
2,450
2,384
2,515
15.8
16.3
15.3
19.4
22.2
17.5
22.0
18.9
7.8
9.3
1.1
1.0
Kirloskar Engines India
Neutral
287
-
4,146
2,554
2,800
9.9
10.0
10.5
12.1
27.3
23.7
11.4
10.8
10.7
11.7
1.3
1.1
Ltd
M M Forgings
Neutral
442
-
534
546
608
20.4
20.7
41.3
48.7
10.7
9.1
60.6
53.6
16.6
17.0
0.8
0.7
Banco Products (India)
Neutral
197
-
1,412
1,353
1,471
12.3
12.4
14.5
16.3
13.6
12.1
18.8
16.9
14.5
14.6
1.0
112.5
Competent Automobiles Neutral
156
-
96
1,137
1,256
3.1
2.7
28.0
23.6
5.6
6.6
30.0
27.1
14.3
11.5
0.1
0.1
Stock Watch
August 09, 2016
Company Name
Reco
CMP
Target
Mkt Cap
Sales ( Čcr )
OPM(%)
EPS (Č)
PER(x)
P/BV(x)
RoE(%)
EV/Sales(x)
(Č)
Price ( Č)
( Č cr )
FY17E
FY18E
FY17E
FY18E
FY17E
FY18E
FY17E
FY18E
FY17E
FY18E
FY17E
FY18E
FY17E
FY18E
zOthers
Nilkamal
Neutral
1,208
-
1,803
1,995
2,165
10.7
10.4
69.8
80.6
17.3
15.0
69.0
60.0
16.6
16.5
0.9
0.8
Visaka Industries
Neutral
157
-
250
1,051
1,138
10.3
10.4
21.0
23.1
7.5
6.8
20.2
18.9
9.0
9.2
0.5
0.5
Transport Corporation of
Neutral
353
-
2,705
2,671
2,911
8.5
8.8
13.9
15.7
25.5
22.6
3.5
3.1
13.7
13.8
1.1
1.0
India
Elecon Engineering
Accumulate
57
63
618
1,482
1,660
13.7
14.5
3.9
5.8
14.6
9.8
3.4
3.1
7.8
10.9
0.7
0.6
Surya Roshni
Buy
169
201
739
3,342
3,625
7.8
7.5
17.3
19.8
9.8
8.5
18.5
14.9
10.5
10.8
0.5
0.4
MT Educare
Neutral
148
-
588
366
417
17.7
18.2
9.4
10.8
15.8
13.7
3.5
3.0
22.2
22.3
1.5
1.3
Radico Khaitan
Buy
91
125
1,210
1,659
1,802
13.0
13.2
6.3
7.4
14.4
12.3
1.2
1.1
8.6
9.3
1.2
1.1
Garware Wall Ropes
Neutral
493
-
1,080
898
997
11.9
11.7
29.0
32.9
17.0
15.0
2.5
2.2
14.9
14.6
1.0
0.9
Wonderla Holidays
Neutral
405
-
2,286
287
355
38.0
40.0
11.3
14.2
35.8
28.5
5.1
4.5
21.4
23.9
7.6
6.1
Linc Pen & Plastics
Neutral
265
-
392
382
416
9.1
9.1
13.1
14.7
20.3
18.0
3.4
2.9
16.7
16.3
1.1
1.0
The Byke Hospitality
Neutral
162
-
651
287
384
20.5
20.5
7.6
10.7
21.4
15.2
4.5
3.6
20.7
23.5
2.3
1.7
Interglobe Aviation
Neutral
828
-
29,820
21,122
26,005
14.5
27.6
110.7
132.1
7.5
6.3
44.7
32.0
168.5
201.1
1.4
1.1
Coffee Day Enterprises
Neutral
244
-
5,019
2,964
3,260
20.5
21.2
4.7
8.0
-
30.5
2.8
2.6
5.5
8.5
2.1
1.8
Ltd
Navneet Education
Neutral
105
-
2,498
1,062
1,147
24.0
24.0
6.1
6.6
17.2
15.8
3.5
3.1
20.6
19.8
2.3
2.2
Navkar Corporation
Buy
206
265
2,936
408
612
42.9
42.3
6.8
11.5
30.4
17.9
2.1
1.9
6.9
10.5
8.1
5.4
UFO Moviez
Neutral
534
-
1,473
619
685
33.2
33.4
30.0
34.9
17.8
15.3
2.5
2.1
13.8
13.9
2.1
1.7
VRL Logistics
Neutral
314
-
2,866
1,902
2,119
16.7
16.6
14.6
16.8
21.6
18.7
4.7
4.2
21.9
22.2
1.6
1.4
Team Lease Serv.
Neutral
1,124
-
1,921
3,229
4,001
1.5
1.8
22.8
32.8
49.4
34.2
5.3
4.6
10.7
13.4
0.5
0.4
S H Kelkar & Co.
Neutral
258
-
3,730
1,036
1,160
15.1
15.0
6.1
7.2
42.2
35.9
4.5
4.1
10.7
11.5
3.5
3.1
Quick Heal
Neutral
252
-
1,763
408
495
27.3
27.0
7.7
8.8
32.5
28.6
3.0
3.0
9.3
10.6
3.8
3.1
Narayana Hrudaya
Neutral
318
-
6,495
1,873
2,166
11.5
11.7
2.6
4.0
120.2
80.2
7.4
6.7
6.1
8.3
3.6
3.1
Manpasand Bever.
Neutral
697
-
3,489
836
1,087
19.6
19.4
16.9
23.8
41.3
29.3
5.0
4.3
12.0
14.8
3.9
2.9
Parag Milk Foods
Neutral
325
-
2,735
1,919
2,231
9.3
9.6
9.5
12.9
34.4
25.1
5.3
4.4
15.5
17.5
1.6
1.4
Source: Company, Angel Research; Note: *December year end; #September year end; &October year end; Price as on August 08, 2016
Market Outlook
August 09, 2016
Research Team Tel: 022 - 39357800
DISCLAIMER
Angel Broking Private Limited (hereinafter referred to as “Angel”) is a registered Member of National Stock Exchange of India
Limited,Bombay Stock Exchange Limited and Metropolitan Stock Exchange Limited. It is also registered as a Depository Participant with
CDSL and Portfolio Manager with SEBI. It also has registration with AMFI as a Mutual Fund Distributor. Angel Broking Private Limited is a
registered entity with SEBI for Research Analyst in terms of SEBI (Research Analyst) Regulations, 2014 vide registration number
INH000000164. Angel or its associates has not been debarred/ suspended by SEBI or any other regulatory authority for accessing
/dealing in securities Market. Angel or its associates/analyst has not received any compensation / managed or
co-managed public offering of securities of the company covered by Analyst during the past twelve months.
This document is solely for the personal information of the recipient, and must not be singularly used as the basis of any investment
decision. Nothing in this document should be construed as investment or financial advice. Each recipient of this document should make
such investigations as they deem necessary to arrive at an independent evaluation of an investment in the securities of the companies
referred to in this document (including the merits and risks involved), and should consult their own advisors to determine the merits and
risks of such an investment.
Reports based on technical and derivative analysis center on studying charts of a stock's price movement, outstanding positions and
trading volume, as opposed to focusing on a company's fundamentals and, as such, may not match with a report on a company's
fundamentals. Investors are advised to refer the Fundamental and Technical Research Reports available on our website to evaluate the
contrary view, if any.
The information in this document has been printed on the basis of publicly available information, internal data and other reliable
sources believed to be true, but we do not represent that it is accurate or complete and it should not be relied on as such, as this
document is for general guidance only. Angel Broking Pvt. Limited or any of its affiliates/ group companies shall not be in any way
responsible for any loss or damage that may arise to any person from any inadvertent error in the information contained in this report.
Angel Broking Pvt. Limited has not independently verified all the information contained within this document. Accordingly, we cannot
testify, nor make any representation or warranty, express or implied, to the accuracy, contents or data contained within this document.
While Angel Broking Pvt. Limited endeavors to update on a reasonable basis the information discussed in this material, there may be
regulatory, compliance, or other reasons that prevent us from doing so.
This document is being supplied to you solely for your information, and its contents, information or data may not be reproduced,
redistributed or passed on, directly or indirectly.
Neither Angel Broking Pvt. Limited, nor its directors, employees or affiliates shall be liable for any loss or damage that may arise from
or in connection with the use of this information.