Market Outlook
March 9, 2016
Market Cues
Domestic Indices
Chg (%)
(Pts)
(Close)
Indian markets are expected to open in the red tracking the SGX Nifty and weak
BSE Sensex
0.1
13
24,659
Asian cues.
Nifty
(0.0)
(0)
7,485
Mid Cap
(0.2)
(25)
10,199
US markets closed lower after five consecutive sessions of gains, after NYMEX crude
Small Cap
0.2
24
10,310
oil prices dropped ~4%. Weak Chinese trade data also dampened sentiment as
fears of an economic slowdown heightened. Chinese exports tumbled 25.4% yoy in
Bankex
(1.3)
(225)
17,261
February, the biggest fall since May 2009, as against economist forecasts of a drop
of 15% and an 11.2% decline in January.
Global Indices
Chg (%)
(Pts)
(Close)
European markets started on a weak note, on the back of weak Asian cues. They
Dow Jones
(0.6)
(110)
16,964
recovered back briefly to trade in the green ahead of the opening of the US markets,
Nasdaq
(1.3)
(59)
4,649
but quickly slipped back into the red as the US markets pulled back. Investors are
FTSE
(0.9)
(57)
6,125
also cautious ahead of the European Central Bank meeting on Thursday.
Nikkei
(0.8)
(128)
16,783
Indian Markets ended absolutely flat after choppy trading on the back of weak Asian
Hang Seng
(0.7)
(148)
20,012
and European cues. Upstream energy companies such as Cairn and Aban Offshore
Shanghai Com
0.1
4
2,901
witnessed some buying led by the spike in crude prices. Reliance Industries rose
1.7% ahead of a board meeting on March 10 to consider dividend.
Advances / Declines
BSE
NSE
News & Result Analysis
Advances
1,297
776
Maruti Suzuki to launches SUV Breeza, starting at `6.99 lakh.
Declines
1,363
797
Detailed analysis on Pg2
Unchanged
146
70
Investor’s Ready Reckoner
Volumes (` Cr)
Key Domestic & Global Indicators
BSE
4,898
Stock Watch: Latest investment recommendations on 150+ stocks
NSE
17,879
Refer Pg4 onwards
Top Picks
Net Inflows (` Cr)
Net
Mtd
Ytd
CMP
Target
Upside
Company
Sector
Rating
(`)
(`)
(%)
FII
882
6,717
(27,433)
Amara Raja Batteries Auto & Auto Ancillary
Buy
891
1,040
16.7
MFs
(479)
(1,148)
81,598
HCL Tech
IT
Buy
818
1,038
26.8
LIC Housing Finance Financials
Buy
449
592
31.8
Top Gainers
Price (`)
Chg (%)
Bharat Electronics
Capital Goods
Buy
1,086
1,414
30.2
Unitech
5
13.3
Navkar Corporation Others
Buy
165
265
60.8
Pipavavdoc
72
11.5
More Top Picks on Pg3
Sail
43
8.1
Key Upcoming Events
Balramchin
99
7.2
Previous
Consensus
Date
Region
Event Description
Hathway
39
7.0
Reading
Expectations
Mar 9 UK
Industrial Production (YoY)
(0.40)
--
Mar 10 China
Consumer Price Index (YoY)
1.80
--
Top Losers
Price (`)
Chg (%)
India
Imports YoY%
(11.00)
--
Justdial
657
(13.5)
India
Exports YoY%
(13.60)
--
M&Mfin
230
(4.7)
Bankbaroda
142
(4.6)
Trent
1,451
(3.8)
Suzlon
14
(3.5)
As on March 8, 2016
Market Outlook
March 9, 2016
Maruti Suzuki Launches SUV Breeza prices start at `6.99 lakh:
India’s largest car maker Maruti Suzuki today has announced their much awaited
entry into the compact sports utility vehicle by launching Vitara Breeza at an
introductory price of `7.35 lakh (ex-showroom, Mumbai) and `6.99 lakh (ex-
showroom Delhi).
The product has been designed by Indian engineers and is expected to compete
with rival’s products like Mahindra’s new product TUV300 and Ford’s one of the
best selling model Eco Sports. However, looking at the aggressive pricing the
product is likely to compete with the likes of Renault Duster and Hyundai Creta.
With mid range pricing the Maruti Suzuki expects gain a decent market share in
the SUV space. The model has been launched only in petrol variant for the time
being with an option to launch petrol variants later on.
Brezza has been launched with the same 1.3 litre engine which is being used for
Swift and Dezire and is expected to offer a mileage of 24.3 kmpl. Brezza will be
sold through the traditional Maruti Suzuki outlets and not Nexa said the company.
It is expected that after seeing some sluggishness in the sales numbers the
company might find itself in a much better position in the quarters to come post
the launch of this product. Maruti Suzuki’s sales number had seen a marginal
decline of 0.9% yoy for the month of February 2016. However, on a month on
month it was up by 3.4% to 1, 17,451 units. The decline was partly due to
production loss of ~10,000 units due to the agitations by Jats in Haryana.
At the CMP of `3,457 the stock is trading at 15.4x its FY2017E EPS of Rs 225.5
and 3.3x its FY2017E Book value. Post 3QFY16 results which were below
expectations due to higher than expected discount offered on its products the stock
has been under pressure. Further with the new 1% cess announced in the budget
on petrol & 2.5% on diesel variant companies will see increasing competition.
However on a positive side, with the launch of the new product the sales numbers
as well as average realisations of the company might see some improvement.
Looking at the current competitive scenario we have a NEUTRAL rating on the
stock.
Economic and Political News
FDI proposals of `48,902cr cleared till Jan in FY16
Steel imports have come down by 1/4th against FY15
Volkswagen faces more bad news from emission scandals.
Corporate News
22 Coal India mining projects receive green nod in FY16
Indian Bank gets board approval to raise `1,100cr
Nalco share buyback delayed to 2016-17
Elecon Engineering bags `225cr order from Garden Reach Shipbuilders and
Engineers
Market Outlook
March 9, 2016
Top Picks
Large Cap
Market Cap
CMP
Target
Upside
Company
Rationale
(` Cr)
(`)
(`)
(%)
To outpace battery industry growth due to better technological
Amara Raja Batteries
15,226
891
1,040
16.7
products leading to market share gains in both the automotive
OEM and replacement segments.
Earnings to grow strongly given the MHCV cyclical upturn.
Ashok Leyland
26,168
92
111
20.7
Focus on exports and LCV's provides additional growth
avenue.
Uptick in defense capex by government when coupled with
Bharat Electronics
26,066
1,086
1,414
30.2
BELs strong market positioning, indicate that good times are
ahead for BEL.
The stock is trading at attractive valuations and is factoring all
HCL Tech
1,15,384
818
1,038
26.8
the bad news.
Strong visibility for a robust 20% earnings trajectory, coupled
HDFC Bank
2,56,613
1,016
1,262
24.2
with high quality of earnings on account of high quality retail
business and strategic focus on highly rated corporates.
Back on the growth trend, expect a long term growth of 14%
Infosys
2,67,261
1,164
1,347
15.8
to be a US$20bn in FY2020.
LICHF continues to grow its retail loan book at a healthy pace
with improvement in asset quality. We expect the company to
LIC Housing Finance
22,654
449
592
31.8
post a healthy loan book which is likely to reflect in a strong
earnings growth.
Huge bid pipeline of re-development works at Delhi and other
NBCC
10,971
914
1,089
19.1
State Governments and opportunity from Smart City, positions
NBCC to report strong growth, going forward.
New launches to enable outpace industry growth; margins
TVS Motors
13,438
283
330
16.7
expansion to boost earnings.
Source: Company, Angel Research
Mid Cap
Market Cap
CMP
Target
Upside
Company
Rationale
(` Cr)
(`)
(`)
(%)
Favourable outlook for the AC industry to augur well for
Cooling products business which is out pacing the market
Blue Star
3,007
334
439
31.3
growth. EMPPAC division's profitability to improve once
operating environment turns around.
Economic recovery to have favourable impact on advertising &
circulation revenue growth. Further, the acquisition of a radio
Jagran Prakashan
5,070
155
189
21.9
business (Radio City) would also boost the company's revenue
growth.
Massive capacity expansion along with rail advantage at ICD
Navkar Corporation
2,349
165
265
60.8
as well CFS augurs well for the company
Earnings boost on back of stable material prices and
Radico Khaitan
1,339
101
156
55.0
favourable pricing environment. Valuation discount to peers
provides additional comfort
Strong brands and distribution network would boost growth
Siyaram Silk Mills
920
982
1,354
38.0
going ahead. Stock currently trades at an inexpensive
valuation.
Source: Company, Angel Research
Market Outlook
March 9, 2016
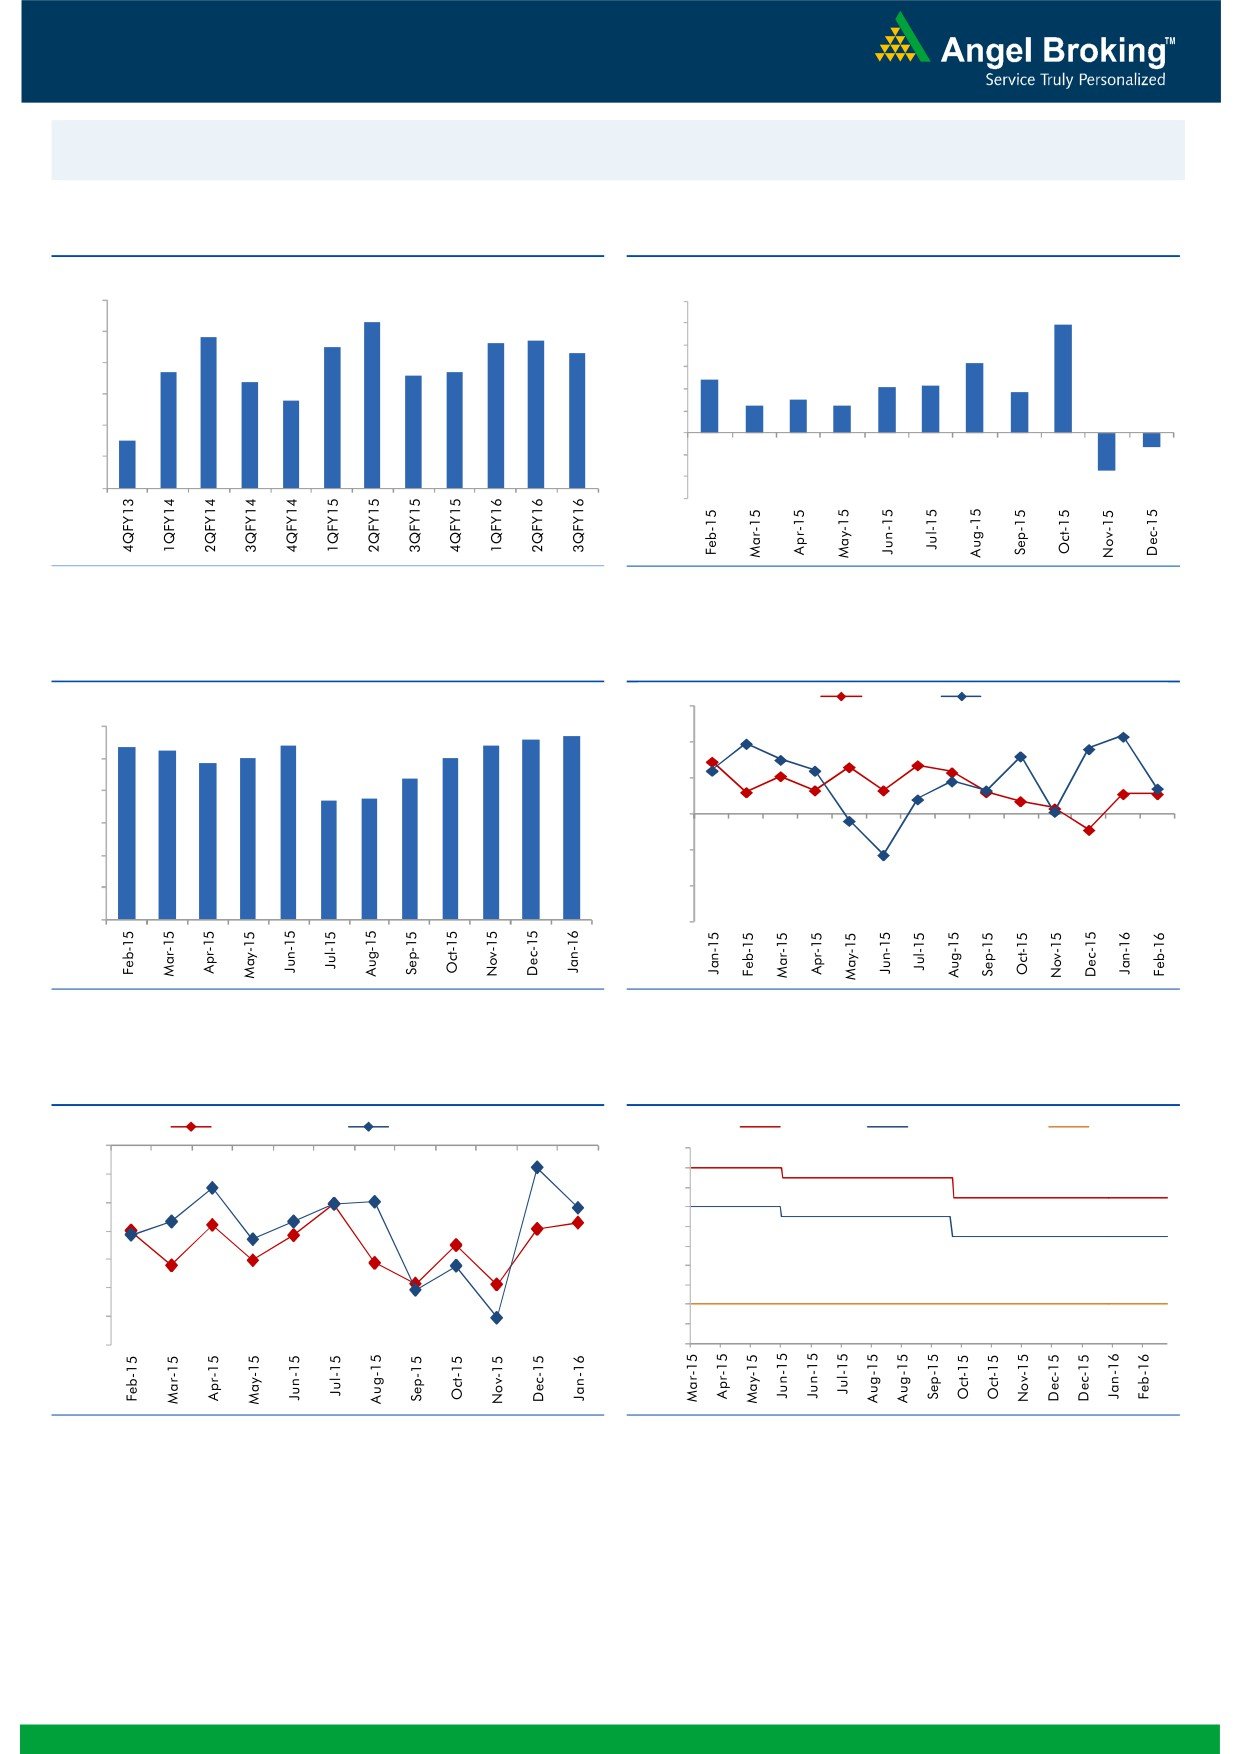
Macro watch
Exhibit 1: Quarterly GDP trends
Exhibit 2: IIP trends
(%)
(%)
9.0
12.0
8.3
9.9
7.8
7.7
10.0
8.0
7.5
7.6
7.3
8.0
6.3
6.7
6.6
6.7
7.0
6.4
4.8
6.0
4.2
4.3
3.7
5.8
4.0
2.5
3.0
2.5
6.0
2.0
5.0
4.5
-
4.0
(2.0)
(1.3)
(4.0)
3.0
(3.4)
(6.0)
Source: CSO, Angel Research
Source: MOSPI, Angel Research
Exhibit 3: Monthly CPI inflation trends
Exhibit 4: Manufacturing and services PMI
Mfg. PMI
Services PMI
(%)
56.0
5.6
5.7
6.0
5.4
5.4
5.4
5.3
4.9
5.0
5.0
54.0
5.0
4.4
52.0
3.7
3.7
4.0
50.0
3.0
48.0
2.0
1.0
46.0
-
44.0
Source: MOSPI, Angel Research
Source: Market, Angel Research; Note: Level above 50 indicates expansion
Exhibit 5: Exports and imports growth trends
Exhibit 6: Key policy rates
(%)
Exports yoy growth
Imports yoy growth
(%)
Repo rate
Reverse Repo rate
CRR
0.0
8.00
7.50
(5.0)
7.00
(10.0)
6.50
(15.0)
6.00
5.50
(20.0)
5.00
(25.0)
4.50
4.00
(30.0)
3.50
(35.0)
3.00
Source: Bloomberg, Angel Research
Source: RBI, Angel Research
Market Outlook
March 9, 2016
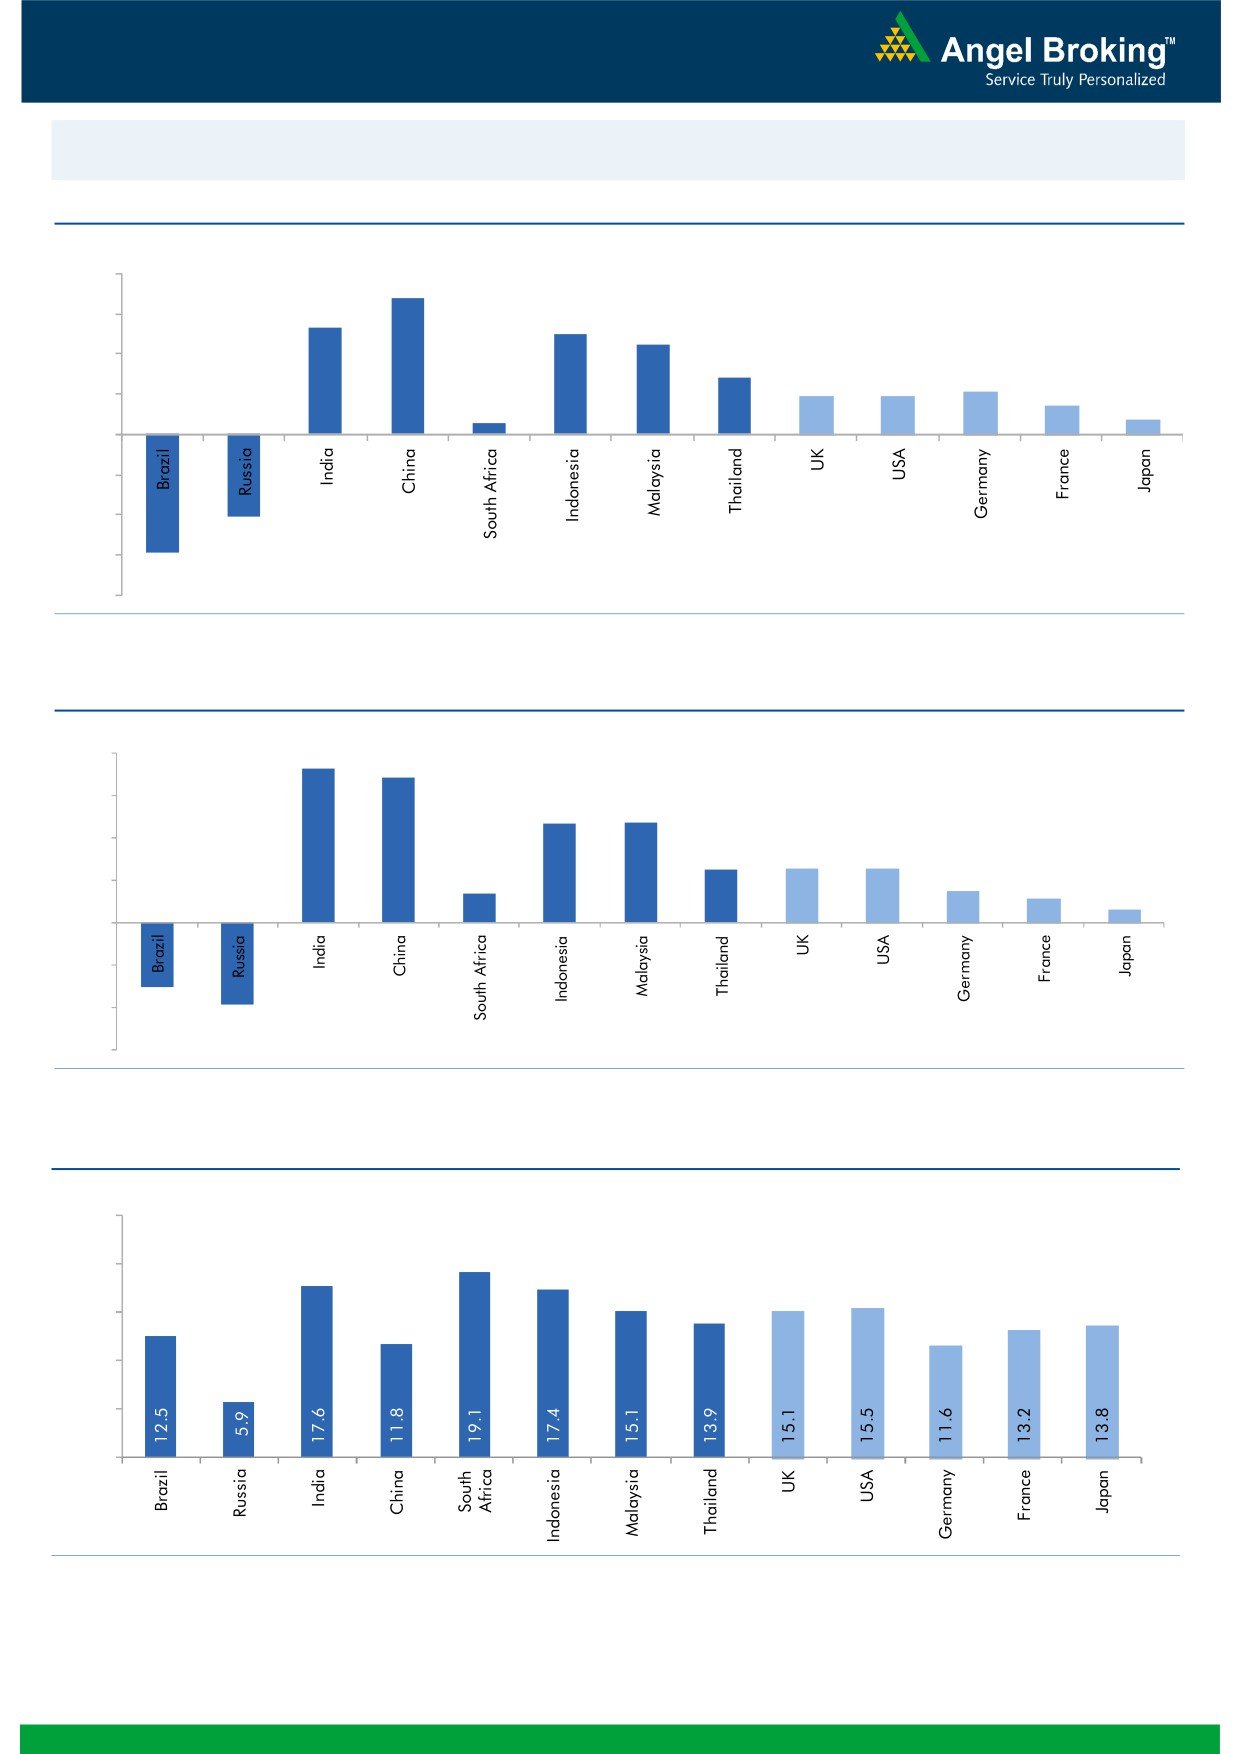
Global watch
Exhibit 1: Latest quarterly GDP Growth (%, yoy) across select developing and developed countries
(%)
8.0
6.8
6.0
5.3
5.0
4.5
4.0
2.8
1.9
1.9
2.1
1.4
2.0
0.6
0.7
-
(2.0)
(4.0)
(4.1)
(6.0)
(5.9)
(8.0)
Source: Bloomberg, Angel Research
Exhibit 2: 2015 GDP Growth projection by IMF (%, yoy) across select developing and developed countries
(%)
8.0
7.3
6.8
6.0
4.7
4.7
4.0
2.5
2.5
2.6
1.4
1.5
2.0
1.2
0.6
-
(2.0)
(3.0)
(4.0)
(3.8)
(6.0)
Source: IMF, Angel Research
Exhibit 3: One year forward P-E ratio across select developing and developed countries
(x)
25.0
20.0
15.0
10.0
5.0
-
Source: IMF, Angel Research
Market Outlook
March 9, 2016
Exhibit 4: Relative performance of indices across globe
Returns (%)
Country
Name of index
Closing price
1M
3M
1YR
Brazil
Bovespa
49,102
24.0
8.8
(4.8)
Russia
Micex
1,910
9.3
7.7
8.5
India
Nifty
7,485
1.1
(3.8)
(16.8)
China
Shanghai Composite
2,901
5.6
(19.7)
(14.9)
South Africa
Top 40
46,229
4.0
4.2
(0.9)
Mexico
Mexbol
44,504
2.9
3.5
2.9
Indonesia
LQ45
839
3.0
6.7
(11.8)
Malaysia
KLCI
1,688
3.3
0.9
(7.1)
Thailand
SET 50
888
8.1
3.6
(15.1)
USA
Dow Jones
16,964
3.3
(2.9)
(4.0)
UK
FTSE
6,125
4.7
(1.8)
(8.9)
Japan
Nikkei
16,783
(1.5)
(15.8)
(10.7)
Germany
DAX
9,693
4.4
(10.2)
(17.9)
France
CAC
4,404
4.8
(7.4)
(13.0)
Source: Bloomberg, Angel Research
Stock Watch
March 09, 2016
Company Name
Reco
CMP
Target
Mkt Cap
Sales ( Čcr )
OPM(%)
EPS (Č)
PER(x)
P/BV(x)
RoE(%)
EV/Sales(x)
(Č)
Price ( Č)
( Č cr )
FY16E FY17E
FY16E
FY17E
FY16E
FY17E
FY16E
FY17E
FY16E
FY17E
FY16E
FY17E
FY16E
FY17E
Agri / Agri Chemical
Rallis
Neutral
153
-
2,981
2,097
2,415
14.4
14.4
9.5
11.0
16.1
13.9
3.2
2.8
21.1
21.3
1.5
1.3
United Phosphorus
Accumulate
435
480
18,664
12,500
14,375
18.3
18.3
29.8
35.9
14.6
12.1
2.7
2.3
20.0
20.3
1.6
1.3
Auto & Auto Ancillary
Ashok Leyland
Buy
92
111
26,168
17,995
21,544
11.4
11.6
3.4
4.7
27.0
19.6
4.7
4.4
17.7
22.2
1.4
1.2
Bajaj Auto
Accumulate
2,317
2,585
67,042
22,709
25,860
20.9
20.1
129.0
143.6
18.0
16.1
5.5
4.7
30.7
29.4
2.5
2.2
Bharat Forge
Accumulate
805
875
18,743
7,351
8,318
19.9
19.7
31.2
36.5
25.8
22.1
4.6
3.9
19.3
19.2
2.7
2.3
Eicher Motors
Neutral
19,802
-
53,785
15,556
16,747
15.5
17.3
464.8
597.5
42.6
33.1
15.6
11.4
36.2
34.3
3.4
3.1
Gabriel India
Buy
85
101
1,222
1,415
1,544
8.7
9.0
4.6
5.4
18.5
15.8
3.4
3.0
18.1
18.9
0.8
0.7
Hero Motocorp
Neutral
2,810
-
56,110
28,244
30,532
15.5
15.9
156.7
168.5
17.9
16.7
7.2
6.1
39.9
36.4
1.8
1.7
Jamna Auto Industries Buy
134
160
1,068
1,281
1,473
11.2
11.5
7.6
9.2
17.6
14.5
4.4
3.6
25.4
25.2
0.9
0.8
L G Balakrishnan & Bros Neutral
433
-
679
1,254
1,394
11.6
11.8
35.9
41.7
12.1
10.4
1.6
1.4
13.5
13.8
0.6
0.6
Mahindra and Mahindra Accumulate
1,217
1,364
75,578
38,416
42,904
13.7
13.9
54.8
63.4
22.2
19.2
3.4
3.0
15.4
15.8
1.6
1.4
Maruti
Neutral
3,462
-
104,567
57,865
68,104
16.4
16.7
176.3
225.5
19.6
15.4
3.8
3.3
19.4
21.2
1.6
1.3
Minda Industries
Accumulate
950
1,047
1,507
2,523
2,890
8.7
9.0
55.0
65.4
17.3
14.5
3.3
2.7
19.3
18.7
0.7
0.6
Motherson Sumi
Buy
245
313
32,460
39,343
45,100
8.8
9.1
10.1
12.5
24.3
19.6
7.7
6.0
35.3
34.4
0.9
0.8
Rane Brake Lining
Buy
364
465
288
454
511
11.5
12.0
25.2
31.0
14.5
11.8
2.2
2.0
14.9
16.6
0.8
0.7
Setco Automotive
Neutral
32
-
421
594
741
12.7
13.7
1.7
3.2
18.5
9.8
1.9
1.7
10.4
16.9
1.2
1.0
Tata Motors
Accumulate
346
371
99,811
259,686
273,957
13.0
13.4
25.9
29.5
13.4
11.7
1.8
1.5
8.0
9.0
0.6
0.6
TVS Motor
Buy
283
330
13,438
11,263
13,122
6.9
8.5
9.2
15.0
30.7
18.9
7.0
5.6
22.7
29.6
1.2
1.0
Amara Raja Batteries
Buy
891
1,040
15,226
4,892
5,871
17.4
17.6
28.8
37.1
31.0
24.0
7.2
5.8
23.4
24.1
3.1
2.5
Exide Industries
Buy
131
162
11,097
6,950
7,784
14.4
14.8
6.6
7.3
19.8
17.9
2.5
2.3
12.6
12.8
1.3
1.2
Apollo Tyres
Accumulate
172
183
8,740
12,056
12,714
17.2
16.4
23.0
20.3
7.5
8.5
1.3
1.2
17.7
13.6
0.8
0.8
Ceat
Neutral
1,098
-
4,443
6,041
6,597
14.1
13.7
99.5
111.9
11.0
9.8
2.2
1.8
19.6
18.5
0.9
0.8
JK Tyres
Neutral
81
-
1,828
7,446
7,669
15.2
14.0
19.6
18.4
4.1
4.4
1.0
0.9
25.2
19.5
0.6
0.5
Swaraj Engines
Accumulate
861
919
1,069
552
630
14.2
14.7
44.6
54.1
19.3
15.9
4.5
4.1
23.2
25.6
1.8
1.5
Subros
Neutral
91
-
543
1,293
1,527
11.8
11.9
4.2
6.7
21.6
13.5
1.6
1.5
7.7
11.5
0.7
0.6
Indag Rubber
Neutral
164
-
431
283
329
17.0
17.2
13.0
15.4
12.7
10.6
2.8
2.3
21.8
21.6
1.2
1.0
Capital Goods
ACE
Neutral
38
-
377
660
839
4.7
8.2
1.0
3.9
38.2
9.8
1.2
1.1
3.2
11.3
0.7
0.6
BEML
Accumulate
1,058
1,157
4,407
3,277
4,006
6.0
8.9
36.2
64.3
29.2
16.5
2.0
1.8
5.7
11.7
1.4
1.1
Bharat Electronics
Buy
1,086
1,414
26,066
7,737
8,634
16.8
17.2
54.0
61.5
20.1
17.7
2.9
2.6
39.3
45.6
2.5
2.1
Stock Watch
March 09, 2016
Company Name
Reco
CMP
Target
Mkt Cap
Sales ( Čcr )
OPM(%)
EPS (Č)
PER(x)
P/BV(x)
RoE(%)
EV/Sales(x)
(Č)
Price ( Č)
( Č cr )
FY16E
FY17E
FY16E
FY17E
FY16E
FY17E
FY16E
FY17E
FY16E
FY17E
FY16E
FY17E
FY16E
FY17E
Capital Goods
Voltas
Buy
242
353
8,002
5,363
5,963
8.0
9.1
11.0
13.8
22.0
17.5
3.4
3.0
16.2
17.9
1.4
1.3
BGR Energy
Neutral
101
-
731
3,615
3,181
9.5
9.4
16.7
12.4
6.1
8.2
0.6
0.6
10.0
7.0
0.6
0.8
BHEL
Neutral
106
-
25,969
33,722
35,272
10.8
11.7
10.5
14.2
10.1
7.5
0.8
0.7
7.0
9.0
0.8
0.8
Blue Star
Buy
334
439
3,007
3,548
3,977
6.3
6.9
13.7
17.2
24.4
19.5
6.1
4.0
26.1
25.4
0.9
0.8
Crompton Greaves
Neutral
140
-
8,746
13,484
14,687
4.9
6.2
4.5
7.1
31.0
19.7
2.2
2.1
7.2
10.8
0.8
0.7
Greaves Cotton
Neutral
126
-
3,075
1,655
1,755
16.6
16.8
7.4
7.8
17.0
16.1
3.4
3.2
21.1
20.6
1.8
1.7
Inox Wind
Buy
289
458
6,403
4,980
5,943
17.0
17.5
26.6
31.6
10.9
9.1
3.2
2.4
35.0
30.0
1.4
1.2
KEC International
Neutral
114
-
2,919
8,791
9,716
6.1
6.8
5.4
8.2
21.0
13.9
2.1
1.9
10.0
14.0
0.6
0.5
Thermax
Neutral
758
-
9,029
6,413
7,525
7.4
8.5
30.5
39.3
24.8
19.3
3.8
3.3
15.0
17.0
1.4
1.1
Cement
ACC
Neutral
1,241
-
23,307
13,151
14,757
16.4
18.3
63.9
83.4
19.4
14.9
2.5
2.3
13.3
16.1
1.6
1.4
Ambuja Cements
Neutral
201
-
31,216
11,564
12,556
19.4
20.7
8.9
10.1
22.6
19.9
2.8
2.7
12.8
13.8
2.3
2.1
HeidelbergCement
Neutral
69
-
1,574
1,772
1,926
13.3
15.4
1.0
3.0
69.5
23.2
1.8
1.6
2.6
7.9
1.5
1.3
India Cements
Neutral
76
-
2,331
4,216
4,840
18.0
19.5
4.0
9.9
19.0
7.7
0.8
0.7
4.0
9.5
0.9
0.7
JK Cement
Accumulate
549
605
3,835
3,661
4,742
10.1
15.8
7.5
28.5
73.1
19.3
2.2
2.0
7.5
22.9
1.5
1.1
J K Lakshmi Cement
Neutral
295
-
3,477
2,947
3,616
16.7
19.9
11.5
27.2
25.7
10.9
2.4
2.1
9.8
20.8
1.6
1.3
Mangalam Cements
Neutral
182
-
485
1,053
1,347
10.5
13.3
8.4
26.0
21.6
7.0
0.9
0.8
4.3
12.5
0.8
0.6
Orient Cement
Neutral
138
-
2,817
1,854
2,524
21.2
22.2
7.7
11.1
17.9
12.4
2.6
2.2
13.3
15.7
2.3
1.6
Ramco Cements
Neutral
366
-
8,721
4,036
4,545
20.8
21.3
15.1
18.8
24.3
19.5
3.0
2.6
12.9
14.3
2.7
2.3
Shree Cement^
Neutral
11,351
-
39,543
7,150
8,742
26.7
28.6
228.0
345.5
49.8
32.9
7.3
6.2
15.7
20.3
5.3
4.2
UltraTech Cement
Accumulate
2,954
3,107
81,062
24,669
29,265
18.2
20.6
82.0
120.0
36.0
24.6
3.9
3.4
11.3
14.7
3.3
2.8
Construction
ITNL
Neutral
74
-
2,441
7,360
8,825
34.0
35.9
7.0
9.0
10.6
8.2
0.4
0.3
3.2
3.7
3.7
3.6
KNR Constructions
Buy
520
603
1,463
937
1,470
14.3
14.0
44.2
38.6
11.8
13.5
2.4
2.0
15.4
15.4
1.6
1.1
Larsen & Toubro
Accumulate
1,187
1,310
110,594
58,870
65,708
8.3
10.3
42.0
53.0
28.3
22.4
2.0
1.8
8.8
11.2
2.1
1.9
Gujarat Pipavav Port
Neutral
154
-
7,452
629
684
51.0
52.2
6.4
5.9
24.1
26.1
3.2
2.9
15.9
12.7
11.5
10.4
MBL Infrastructures
Buy
137
285
566
2,313
2,797
12.2
14.6
19.0
20.0
7.2
6.8
0.8
0.7
11.3
10.6
1.0
0.9
Nagarjuna Const.
Neutral
69
-
3,839
7,892
8,842
8.8
9.1
3.0
5.3
23.0
13.0
1.2
1.1
5.0
8.5
0.7
0.6
PNC Infratech
Accumulate
491
558
2,517
1,873
2,288
13.2
13.5
24.0
32.0
20.4
15.3
2.0
1.8
12.1
12.3
1.5
1.2
Simplex Infra
Neutral
216
-
1,067
5,955
6,829
10.3
10.5
16.0
31.0
13.5
7.0
0.7
0.7
5.3
9.9
0.7
0.6
Power Mech Projects
Neutral
567
-
833
1,539
1,801
12.8
12.7
59.0
72.1
9.6
7.9
1.4
1.2
18.6
16.8
0.5
0.5
Stock Watch
March 09, 2016
Company Name
Reco
CMP
Target
Mkt Cap
Sales ( Čcr )
OPM(%)
EPS (Č)
PER(x)
P/BV(x)
RoE(%)
EV/Sales(x)
(Č)
Price ( Č)
( Č cr )
FY16E
FY17E
FY16E
FY17E
FY16E
FY17E
FY16E
FY17E
FY16E
FY17E
FY16E
FY17E
FY16E
FY17E
Construction
Sadbhav Engineering
Buy
247
289
4,233
3,481
4,219
10.7
10.8
8.2
11.7
30.1
21.1
2.9
2.5
10.3
13.5
1.5
1.2
NBCC
Buy
914
1,089
10,971
5,816
7,382
6.9
7.7
29.6
39.8
30.9
23.0
5.5
4.4
24.1
26.7
1.6
1.2
MEP Infra
Neutral
40
-
654
1,956
1,876
28.1
30.5
1.3
3.0
30.9
13.4
6.5
4.4
21.2
32.8
1.8
1.7
SIPL
Neutral
90
-
3,174
675
1,042
62.4
64.7
-
-
3.4
3.9
-
-
16.4
11.0
Financials
Allahabad Bank
Neutral
51
-
3,051
8,569
9,392
2.8
2.9
16.3
27.5
3.1
1.9
0.3
0.2
7.6
11.9
-
-
Axis Bank
Buy
412
494
98,006
26,473
31,527
3.5
3.6
35.7
43.5
11.5
9.5
1.9
1.7
17.9
18.9
-
-
Bank of Baroda
Neutral
142
-
32,696
18,485
21,025
1.9
2.0
13.5
21.1
10.6
6.7
0.8
0.7
7.3
10.6
-
-
Bank of India
Neutral
92
-
7,502
15,972
17,271
1.9
2.0
15.3
33.4
6.0
2.8
0.3
0.2
3.6
7.6
-
-
Canara Bank
Neutral
180
-
9,766
15,441
16,945
2.0
2.1
46.6
70.4
3.9
2.6
0.3
0.3
8.0
11.2
-
-
Dena Bank
Neutral
28
-
1,816
3,440
3,840
2.1
2.3
7.3
10.0
3.9
2.8
0.3
0.2
6.1
7.9
-
-
Federal Bank
Neutral
50
-
8,529
3,477
3,999
3.0
3.0
5.0
6.2
9.9
8.0
1.0
0.9
10.6
11.9
-
-
HDFC
Neutral
1,146
-
180,999
10,358
11,852
3.3
3.3
41.1
47.0
27.9
24.4
5.3
4.8
24.7
24.9
-
-
HDFC Bank
Buy
1,016
1,262
256,613
38,309
47,302
4.3
4.3
49.3
61.1
20.6
16.6
3.6
3.1
18.5
19.7
-
-
ICICI Bank
Buy
217
254
126,057
34,279
39,262
3.3
3.3
21.0
24.4
10.3
8.9
1.7
1.5
14.4
14.7
-
-
IDBI Bank
Neutral
69
-
13,082
9,625
10,455
1.8
1.8
8.5
14.2
8.1
4.8
0.5
0.5
5.9
9.3
-
-
Indian Bank
Neutral
100
-
4,808
6,160
6,858
2.5
2.5
24.5
29.8
4.1
3.4
0.3
0.3
7.7
8.6
-
-
LIC Housing Finance
Buy
449
592
22,654
3,101
3,745
2.5
2.5
33.0
40.2
13.6
11.2
2.5
2.2
19.7
20.5
-
-
Oriental Bank
Neutral
90
-
2,706
7,643
8,373
2.4
2.4
37.2
45.4
2.4
2.0
0.2
0.2
8.2
9.4
-
-
Punjab Natl.Bank
Neutral
82
-
16,013
23,638
26,557
2.8
2.8
17.9
27.2
4.6
3.0
0.5
0.4
8.5
12.0
-
-
South Ind.Bank
Neutral
18
-
2,390
1,965
2,185
2.5
2.5
2.5
3.3
7.1
5.4
0.7
0.6
9.5
11.7
-
-
St Bk of India
Neutral
184
-
142,563
79,958
86,061
2.6
2.6
13.4
20.7
13.7
8.9
1.1
1.0
11.5
12.8
-
-
Union Bank
Neutral
126
-
8,651
12,646
14,129
2.3
2.4
31.0
39.1
4.1
3.2
0.4
0.4
9.8
11.4
-
-
Vijaya Bank
Neutral
32
-
2,771
3,536
3,827
1.9
1.9
5.5
6.7
5.8
4.9
0.5
0.4
7.8
8.8
-
-
Yes Bank
Neutral
760
-
31,955
7,190
9,011
3.2
3.3
58.2
69.7
13.1
10.9
2.3
2.0
19.2
19.6
-
-
FMCG
Asian Paints
Neutral
873
-
83,728
16,553
19,160
16.0
16.2
17.7
21.5
49.4
40.6
13.1
11.8
29.4
31.2
4.9
4.2
Britannia
Neutral
2,820
-
33,835
8,481
9,795
14.0
14.1
65.5
78.3
43.1
36.0
20.4
16.7
38.3
41.2
3.9
3.3
Colgate
Neutral
826
-
22,474
4,836
5,490
19.5
19.7
48.5
53.2
17.0
15.5
12.5
10.9
99.8
97.5
4.5
4.0
Dabur India
Accumulate
248
267
43,574
9,370
10,265
17.1
17.2
7.3
8.1
33.8
30.6
10.2
8.3
33.7
30.6
4.6
4.2
GlaxoSmith Con*
Accumulate
5,654
6,118
23,777
4,919
5,742
17.2
17.4
168.3
191.2
33.6
29.6
9.5
8.1
28.8
28.9
4.4
3.7
Stock Watch
March 09, 2016
Company Name
Reco
CMP
Target
Mkt Cap
Sales ( Čcr )
OPM(%)
EPS (Č)
PER(x)
P/BV(x)
RoE(%)
EV/Sales(x)
(Č)
Price ( Č)
( Č cr )
FY16E FY17E
FY16E
FY17E
FY16E
FY17E
FY16E
FY17E
FY16E
FY17E
FY16E
FY17E
FY16E
FY17E
FMCG
Godrej Consumer
Neutral
1,253
-
42,664
10,168
12,886
16.1
16.1
32.1
38.4
39.0
32.6
7.9
7.3
19.7
21.0
4.3
3.4
HUL
Neutral
828
-
179,071
34,940
38,957
17.5
17.7
20.8
24.7
39.8
33.5
44.3
35.4
110.5
114.2
4.9
4.4
ITC
Accumulate
321
359
258,229
36,804
38,776
37.9
37.9
12.2
12.9
26.3
24.9
7.3
6.4
27.7
25.8
6.6
6.3
Marico
Neutral
238
-
30,738
6,551
7,766
15.7
16.0
10.4
12.5
23.0
19.1
6.7
5.5
33.2
32.4
4.6
3.9
Nestle*
Buy
5,304
6,646
51,143
11,291
12,847
22.2
22.3
158.9
184.6
33.4
28.7
17.5
15.7
55.0
57.3
4.4
3.8
Tata Global
Buy
116
144
7,299
8,635
9,072
9.8
9.9
6.5
7.6
17.8
15.2
1.8
1.7
6.8
7.4
0.8
0.7
IT
HCL Tech^
Buy
818
1,038
115,384
42,038
47,503
21.2
21.5
51.5
57.7
15.9
14.2
3.4
2.7
21.5
18.8
2.4
1.9
Infosys
Buy
1,164
1,347
267,261
61,850
69,981
27.5
27.5
59.4
65.7
19.6
17.7
4.2
3.6
21.2
20.1
3.6
3.0
TCS
Buy
2,354
2,854
463,918
108,487
122,590
28.3
28.5
122.8
138.4
19.2
17.0
7.3
6.6
38.0
38.9
3.9
3.4
Tech Mahindra
Buy
449
530
43,441
26,524
29,177
16.2
17.0
28.8
33.6
15.6
13.4
3.0
2.6
19.3
19.1
1.4
1.2
Wipro
Buy
541
680
133,721
50,808
56,189
23.7
23.8
37.3
40.7
14.5
13.3
2.8
2.5
19.2
17.7
2.1
1.7
Media
D B Corp
Accumulate
322
356
5,916
2,241
2,495
27.8
27.9
21.8
25.6
14.8
12.6
3.9
3.4
26.7
28.5
2.6
2.3
HT Media
Neutral
80
-
1,872
2,495
2,603
11.2
11.2
7.3
8.6
11.0
9.4
0.9
0.8
7.4
8.1
0.3
0.2
Jagran Prakashan
Buy
155
189
5,070
2,170
2,355
27.2
26.2
8.9
9.9
17.4
15.7
3.7
3.2
20.9
20.5
2.2
2.1
Sun TV Network
Neutral
340
-
13,407
2,779
3,196
70.2
70.5
22.8
27.3
14.9
12.5
3.7
3.3
26.7
28.3
4.6
4.0
Hindustan Media
Neutral
267
-
1,956
920
1,031
20.0
20.0
19.2
20.9
13.9
12.8
2.3
2.0
16.4
15.3
1.7
1.5
Ventures
Metals & Mining
Coal India
Buy
325
380
204,998
76,167
84,130
19.9
22.3
22.4
25.8
14.5
12.6
5.2
5.1
35.5
41.0
2.0
1.8
Hind. Zinc
Neutral
175
-
73,753
14,641
14,026
50.4
50.4
17.7
16.0
9.9
10.9
1.5
1.4
16.2
13.2
2.7
2.5
Hindalco
Neutral
83
-
17,160
104,356
111,186
8.7
9.5
6.7
11.1
12.4
7.5
0.4
0.4
3.5
5.9
0.7
0.6
JSW Steel
Neutral
1,186
-
28,662
42,308
45,147
16.4
20.7
(10.3)
49.5
24.0
1.3
1.3
(1.0)
5.6
1.7
1.6
NMDC
Neutral
95
-
37,467
8,237
10,893
46.6
44.5
10.0
11.7
9.5
8.1
1.1
0.9
12.5
13.0
4.3
3.3
SAIL
Neutral
43
-
17,883
45,915
53,954
7.2
10.5
1.5
4.4
28.8
9.9
0.4
0.4
2.3
4.1
1.0
0.9
Vedanta
Neutral
90
-
26,786
71,445
81,910
26.2
26.3
12.9
19.2
7.0
4.7
0.5
0.4
7.2
8.9
0.8
0.6
Tata Steel
Neutral
292
-
28,345
126,760
137,307
8.9
11.3
6.4
23.1
45.9
12.7
0.9
0.9
2.0
7.1
0.8
0.8
Oil & Gas
Cairn India
Neutral
137
-
25,648
11,323
12,490
49.4
51.0
20.7
20.7
6.6
6.6
0.4
0.4
6.4
6.1
1.3
0.7
GAIL
Neutral
348
-
44,200
64,856
70,933
9.1
9.6
24.0
28.9
14.5
12.1
1.2
1.2
8.8
9.6
0.9
0.8
ONGC
Neutral
202
-
172,735
154,564
167,321
36.8
37.4
28.6
32.5
7.1
6.2
0.9
0.8
12.7
13.5
1.3
1.2
Petronet LNG
Neutral
246
-
18,461
29,691
31,188
5.8
6.2
12.8
13.4
19.3
18.3
2.9
2.6
15.8
14.8
0.7
0.7
Indian Oil Corp
Accumulate
398
455
96,657
359,607
402,760
5.9
6.1
42.5
48.7
9.4
8.2
1.3
1.1
14.1
14.4
0.4
0.3
Stock Watch
March 09, 2016
Company Name
Reco
CMP
Target
Mkt Cap
Sales ( Čcr )
OPM(%)
EPS (Č)
PER(x)
P/BV(x)
RoE(%)
EV/Sales(x)
(Č)
Price ( Č)
( Č cr )
FY16E FY17E
FY16E
FY17E
FY16E
FY17E
FY16E
FY17E
FY16E
FY17E
FY16E
FY17E
FY16E
FY17E
Oil & Gas
Reliance Industries
Accumulate
1,027
1,150
332,735
304,775
344,392
12.6
13.4
91.3
102.6
11.3
10.0
1.3
1.1
11.8
12.0
1.0
0.9
Pharmaceuticals
Alembic Pharma
Neutral
632
-
11,917
3,274
3,802
26.9
19.4
35.0
28.7
18.1
22.0
8.0
6.0
55.6
31.2
3.6
3.0
Aurobindo Pharma
Buy
705
856
41,244
14,923
17,162
22.0
23.0
35.7
42.8
19.8
16.5
5.8
4.4
34.0
30.2
3.1
2.7
Aventis*
Neutral
4,385
-
10,098
2,082
2,371
17.4
20.8
118.2
151.5
37.1
28.9
5.4
4.4
19.9
25.5
4.5
3.8
Cadila Healthcare
Neutral
336
-
34,347
10,224
11,840
21.0
22.0
14.6
17.6
23.0
19.1
6.3
4.9
30.8
29.0
3.4
2.9
Cipla
Accumulate
532
605
42,699
13,979
16,447
20.2
18.6
25.7
27.5
20.7
19.3
3.4
2.9
17.6
16.1
3.0
2.5
Dr Reddy's
Buy
3,218
3,933
54,871
16,838
19,575
25.0
23.1
167.5
178.8
19.2
18.0
4.0
3.4
23.1
20.4
3.2
2.7
Dishman Pharma
Neutral
368
-
2,967
1,733
1,906
21.5
21.5
17.0
19.9
21.6
18.5
2.2
2.0
10.5
11.2
2.2
1.9
GSK Pharma*
Neutral
3,200
-
27,101
2,870
3,158
20.0
22.1
59.5
68.3
53.8
46.9
15.9
16.3
28.5
34.3
8.9
8.2
Indoco Remedies
Neutral
281
-
2,590
1,033
1,199
15.9
18.2
9.4
13.6
29.9
20.7
4.4
3.8
15.7
19.7
2.6
2.2
Ipca labs
Buy
562
900
7,090
3,363
3,909
12.9
18.6
13.4
28.0
41.9
20.1
3.0
2.6
7.4
14.0
2.4
2.1
Lupin
Neutral
1,817
-
81,853
13,092
16,561
25.0
27.0
50.4
68.3
36.1
26.6
7.4
5.9
22.8
24.7
6.0
4.6
Sun Pharma
Accumulate
858
950
206,516
28,163
32,610
25.8
30.7
17.4
26.9
49.3
31.9
4.7
4.1
13.0
16.6
6.8
5.7
Power
Tata Power
Neutral
59
-
15,890
35,923
37,402
22.6
22.8
4.1
5.2
14.5
11.4
1.1
1.0
7.5
9.3
1.4
1.3
NTPC
Accumulate
127
146
104,841
87,271
99,297
23.5
23.5
11.8
13.3
10.8
9.6
1.2
1.1
11.5
12.2
2.2
2.0
Power Grid
Buy
137
170
71,882
20,702
23,361
86.7
86.4
12.1
13.2
11.4
10.4
1.7
1.5
15.6
15.1
8.4
7.8
Telecom
Bharti Airtel
Neutral
332
-
132,634
101,748
109,191
32.1
31.7
12.0
12.5
27.7
26.5
1.9
1.8
6.9
6.7
1.9
1.8
Idea Cellular
Neutral
106
-
38,003
34,282
36,941
32.0
31.5
5.9
6.2
17.9
17.0
1.6
1.5
9.9
9.3
1.7
1.6
zOthers
Abbott India
Neutral
5,001
-
10,626
2,715
3,153
14.5
14.1
134.3
152.2
37.2
32.9
9.3
7.7
27.4
25.6
3.6
3.1
Bajaj Electricals
Buy
176
237
1,781
4,719
5,287
5.2
5.8
8.6
12.7
20.6
13.9
2.4
2.1
11.4
14.8
0.4
0.3
Finolex Cables
Neutral
229
-
3,497
2,520
2,883
12.2
12.0
12.7
14.2
18.0
16.1
2.5
2.2
13.6
13.5
1.1
1.0
Goodyear India*
Buy
482
582
1,112
1,800
1,600
11.7
11.5
58.7
52.9
8.2
9.1
1.8
1.6
24.6
18.7
0.4
0.4
Hitachi
Neutral
1,143
-
3,108
1,779
2,081
7.8
8.8
21.8
33.4
52.4
34.2
8.5
6.9
17.4
22.1
1.8
1.5
Jyothy Laboratories
Neutral
274
-
4,961
1,620
1,847
11.5
11.5
7.3
8.5
37.6
32.3
4.9
4.5
13.3
14.4
2.9
2.5
MRF
Buy
34,402
45,575
14,591
20,316
14,488
21.4
21.1
5,488.0
3,798.0
6.3
9.1
2.1
1.7
41.1
21.2
0.7
0.9
Page Industries
Neutral
10,647
-
11,875
1,929
2,450
19.8
20.1
229.9
299.0
46.3
35.6
20.4
14.2
52.1
47.1
6.2
4.8
Relaxo Footwears
Neutral
415
-
4,981
1,767
2,152
12.3
12.5
19.3
25.1
21.6
16.6
5.3
4.1
27.7
27.8
2.9
2.3
Siyaram Silk Mills
Buy
982
1,354
920
1,636
1,815
11.5
11.5
89.9
104.1
10.9
9.4
1.8
1.6
17.9
17.8
0.7
0.6
Styrolution ABS India*
Neutral
577
-
1,014
1,271
1,440
8.6
9.2
32.0
41.1
18.0
14.1
1.8
1.7
10.7
12.4
0.8
0.7
Stock Watch
March 09, 2016
Company Name
Reco
CMP
Target
Mkt Cap
Sales ( Čcr )
OPM(%)
EPS (Č)
PER(x)
P/BV(x)
RoE(%)
EV/Sales(x)
(Č)
Price ( Č)
( Č cr )
FY16E
FY17E
FY16E
FY17E
FY16E
FY17E
FY16E
FY17E
FY16E
FY17E
FY16E
FY17E
FY16E
FY17E
zOthers
TVS Srichakra
Buy
2,249
3,217
1,722
2,035
2,252
15.9
15.3
248.6
268.1
9.0
8.4
4.0
2.8
43.6
33.9
0.9
0.7
HSIL
Accumulate
276
302
1,996
2,123
2,384
16.1
16.5
15.0
18.9
18.4
14.6
1.4
1.3
8.0
9.4
1.3
1.1
Kirloskar Engines India
Neutral
215
-
3,109
2,403
2,554
8.6
9.9
9.2
10.5
23.4
20.5
2.2
2.1
9.7
10.7
0.9
0.9
Ltd
M M Forgings
Buy
432
614
522
511
615
21.7
21.6
43.1
55.8
10.0
7.7
1.8
1.5
19.9
21.2
1.2
0.9
Banco Products (India) Neutral
100
-
715
1,208
1,353
11.0
12.3
10.8
14.5
9.3
6.9
1.1
1.0
11.9
14.5
0.6
0.5
Competent Automobiles Neutral
130
-
80
1,040
1,137
3.2
3.1
25.7
28.0
5.1
4.6
0.8
0.7
15.0
14.3
0.1
0.1
Nilkamal
Neutral
1,075
-
1,604
1,871
2,031
10.7
10.5
63.2
69.8
17.0
15.4
2.8
2.4
17.6
16.6
0.9
0.8
Visaka Industries
Buy
109
144
173
1,086
1,197
9.9
10.3
21.5
28.8
5.1
3.8
0.5
0.4
9.6
11.6
0.4
0.3
Transport Corporation of
Neutral
278
-
2,113
2,830
3,350
8.8
9.0
14.4
18.3
19.3
15.2
3.0
2.6
15.4
17.1
0.9
0.8
India
Elecon Engineering
Neutral
57
-
619
1,359
1,482
10.3
13.7
0.8
3.9
70.7
14.6
1.2
1.1
1.6
7.8
0.8
0.7
Surya Roshni
Buy
139
201
611
2,992
3,223
8.1
8.4
14.7
18.3
9.5
7.6
0.9
0.8
9.7
11.0
0.5
0.4
MT Educare
Neutral
153
-
611
286
366
18.3
17.7
7.7
9.4
19.9
16.4
4.2
3.7
20.2
21.1
2.0
1.5
Radico Khaitan
Buy
101
156
1,339
1,517
1,635
12.7
13.4
5.8
7.1
17.3
14.2
1.5
1.4
8.6
9.6
1.4
1.3
Garware Wall Ropes
Buy
294
473
642
862
974
11.2
11.2
24.9
29.6
11.8
9.9
1.8
1.5
15.1
15.4
0.7
0.6
Wonderla Holidays
Neutral
372
-
2,101
206
308
44.0
43.6
9.0
12.9
41.3
28.8
5.6
5.1
13.7
17.8
10.1
6.7
Linc Pen & Plastics
Neutral
183
-
271
340
371
8.3
8.9
10.8
13.2
16.9
13.9
2.7
2.4
16.0
17.1
0.8
0.8
The Byke Hospitality
Neutral
156
-
624
222
287
20.5
20.5
5.6
7.6
27.6
20.6
5.2
4.3
18.9
20.8
2.8
2.2
Interglobe Aviation
Neutral
860
-
30,973
17,022
21,122
20.7
14.5
63.9
53.7
13.5
16.0
20.2
16.5
149.9
103.2
1.9
1.5
Coffee Day Enterprises
Neutral
234
-
4,826
2,692
2,964
17.0
18.6
-
4.7
-
49.4
2.9
2.7
0.2
5.5
2.2
2.0
Ltd
Navneet Education
Neutral
83
-
1,969
998
1,062
24.1
24.0
5.8
6.1
14.4
13.6
3.2
2.8
22.0
20.6
2.1
1.9
Navkar Corporation
Buy
165
265
2,349
365
436
38.3
37.5
5.6
5.9
29.2
28.0
1.8
1.7
6.3
6.1
7.3
6.2
Source: Company, Angel Research; Note: *December year end; #September year end; &October year end; Price as on March 08, 2016
Market Outlook
March 09, 2016
Research Team Tel: 022 - 39357800
DISCLAIMER
Angel Broking Private Limited (hereinafter referred to as “Angel”) is a registered Member of National Stock Exchange of India Limited,
Bombay Stock Exchange Limited and Metropolitian Stock Exchange of India Limited. It is also registered as a Depository Participant with
CDSL and Portfolio Manager with SEBI. It also has registration with AMFI as a Mutual Fund Distributor. Angel Broking Private Limited is a
registered entity with SEBI for Research Analyst in terms of SEBI (Research Analyst) Regulations, 2014 vide registration number
INH000000164. Angel or its associates has not been debarred/ suspended by SEBI or any other regulatory authority for accessing
/dealing in securities Market. Angel or its associates including its relatives/analyst do not hold any financial interest/beneficial ownership
of more than 1% in the company covered by Analyst. Angel or its associates/analyst has not received any compensation / managed or co
-managed public offering of securities of the company covered by Analyst during the past twelve months. Angel/analyst has not served as
an officer, director or employee of company covered by Analyst and has not been engaged in market making activity of the company
covered by Analyst.
This document is solely for the personal information of the recipient, and must not be singularly used as the basis of any investment
decision. Nothing in this document should be construed as investment or financial advice. Each recipient of this document should make
such investigations as they deem necessary to arrive at an independent evaluation of an investment in the securities of the companies
referred to in this document (including the merits and risks involved), and should consult their own advisors to determine the merits and
risks of such an investment.
Reports based on technical and derivative analysis center on studying charts of a stock's price movement, outstanding positions and
trading volume, as opposed to focusing on a company's fundamentals and, as such, may not match with a report on a company's
fundamentals.
The information in this document has been printed on the basis of publicly available information, internal data and other reliable sources
believed to be true, but we do not represent that it is accurate or complete and it should not be relied on as such, as this document is for
general guidance only. Angel Broking Pvt. Limited or any of its affiliates/ group companies shall not be in any way responsible for any
loss or damage that may arise to any person from any inadvertent error in the information contained in this report. Angel Broking Pvt.
Limited has not independently verified all the information contained within this document. Accordingly, we cannot testify, nor make any
representation or warranty, express or implied, to the accuracy, contents or data contained within this document. While Angel Broking
Pvt. Limited endeavors to update on a reasonable basis the information discussed in this material, there may be regulatory, compliance,
or other reasons that prevent us from doing so.
This document is being supplied to you solely for your information, and its contents, information or data may not be reproduced,
redistributed or passed on, directly or indirectly.
Neither Angel Broking Pvt. Limited, nor its directors, employees or affiliates shall be liable for any loss or damage that may arise from or
in connection with the use of this information.
Note: Please refer to the important ‘Stock Holding Disclosure' report on the Angel website (Research Section). Also, please refer to the
latest update on respective stocks for the disclosure status in respect of those stocks. Angel Broking Pvt. Limited and its affiliates may have
investment positions in the stocks recommended in this report.