Market Outlook
December 8, 2015
Market Cues
Domestic Indices
Chg (%)
(Pts)
(Close)
Indian markets are expected to open on a Negative note tracking the SGX Nifty and
BSE Sensex
(0.4)
(108)
25,530
most Global markets.
Nifty
(0.2)
(17)
7,765
US markets closed in the negative zone after showing falling in the yesterday’s early
Mid Cap
(0.1)
(11)
10,924
trading session. Weakness was on the back of resource and energy stocks coming
Small Cap
0.2
18
11,576
under pressure amid notable decline in commodities and oil prices. Selling pressure
Bankex
0.3
58
19,383
was also generated by concerns about the outlook for monetary policy ahead of next
week's Federal Reserve meeting.
Global Indices
Chg (%)
(Pts)
(Close)
Sparked by European Central Bank President Mario Draghi’s dovish comments on
Friday, European markets rallied in early trade yesterday. However, the markets
Dow Jones
(0.7)
(117)
17,731
pulled back on account of decline in oil prices and weaker opening in the US
Nasdaq
(0.8)
(40)
5,102
markets.
FTSE
(0.2)
(15)
6,224
Indian market continued to slide for the fourth day as foreign fund selling amid
Nikkei
1.0
194
19,698
growing fears over the interest rate hike in the U.S. this month kept investors
Hang Seng
(0.1)
(33)
22,203
nervous.
Shanghai Com
0.3
12
3,537
News & Result Analysis
Jaypee Group to sell cement arm by March for `19,500cr
Advances / Declines
BSE
NSE
GMR Group plans to raise $1bn as it eyes turnaround
Advances
1,443
745
Detailed analysis on Pg2
Declines
1,331
798
Investor’s Ready Reckoner
Unchanged
164
72
Key Domestic & Global Indicators
Volumes (` Cr)
Stock Watch: Latest investment recommendations on 150+ stocks
Refer P4 onwards
BSE
2,663
NSE
13,900
Top Picks
CMP
Target
Upside
Company
Sector
Rating
(`)
(`)
(%)
Net Inflows (` Cr)
Net
Mtd
Ytd
Axis Bank
Financials
Buy
462
630
36.3
FII
(1,804)
(2,249)
(24,698)
HCL Tech
IT
Buy
841
1,132
34.7
MFs
741
1,123
58,018
ICICI Bank
Financials
Buy
263
354
34.5
Ashok Leyland
Automobiles
Buy
90
111
23.2
Top Gainers
Price (`)
Chg (%)
Larsen & Toubro
Construction
Buy
1,341
1,646
22.8
Rtnpower
12
8.5
More Top Picks on Pg3
Gitanjali
44
7.0
Key Upcoming Events
Sobha
320
6.4
Previous
Consensus
Date
Region
Event Description
Reading
Expectations
Fortis
177
6.4
Dec 8
UK
Industrial Production (YoY) (Oct)
1.1
1.2
Gmrinfra
16
4.9
China
Exports YoY% (Nov)
(6.9)
(5.0)
Eurozone
Euro-Zone GDP s.a. (QoQ)
.30
.30
Top Losers
Price (`)
Chg (%)
Dec 9
China
Consumer Price Index (YoY) (Nov)
1.3
1.4
Pmcfin
1
(6.6)
Itc
314
(6.6)
Bhusanstl
45
(4.6)
Sadbhav
338
(4.2)
Bajajfinsv
1,927
(4.1)
As on December 07, 2015
Market Outlook
December 8, 2015
Jaypee Group to sell cement arm by March for `19,500cr
As per media reports, Jaypee Group is looking to sell its cement business at an
enterprise valuation of close to `19,500cr and the sale is expected to be
completed by next march. The proceeds will be used by Jaiprakash Associates to
retire a part of its `61,285cr debt as on FY2015. Jaiprakash Associates is India's
third largest cement maker, with annual capacity of 31.65mn tonnes. Jaiprakash
Associates had earlier sold two cement units in Gujarat and Madhya Pradesh to
UltraTech for `3,800 crore and `5,400cr, respectively. The company also sold its
stake in the Bokaro cement unit to Dalmia Cement for `667cr and the Panipat-
based grinding unit to Shree Cement for `360cr. Besides, the group sold its hydro-
power projects to JSW Energy for `9,700cr.
GMR Group plans to raise $1bn as it eyes turnaround
GMR Group has plans to raise $1bn over the next two years to cut its debt and
repay investors in its airports business. GMR, which has a net debt of ~`41,000cr,
has held preliminary talks with investors about selling stakes in its airports and its
energy businesses. The company may look at listing its energy and airport
businesses for sources of funding. However, the company has not set any timelines
and has mentioned that it will let the process play out.
Government examining anti-dumping, anti-subsidy probe on
imports of Chinese radial tyres
As per Commerce and Industry Minister Nirmala Sitharaman, the Director
General of Anti-Dumping and Allied Duties (DGAD) is looking at anti-dumping
and anti-subsidy duty investigations on imports of bus and truck radial tyres from
China to protect domestic manufacturers. The domestic tyre companies have been
severely impacted, mainly in the Truck and Bus radial segment as the Import of
Chinese tyres has increased significantly in the recent times. The Chinese imports,
are mostly priced at a
25% discount to Indian tyres thus making them
uncompetitive. Imposing of Anti-dumping duty has been long requested by the
ATMA which will be a welcome sign for the tyre makers.
Govt awards NH projects worth over `1 lakh cr
Iran in talks for $4.5 billion undersea gas pipeline to Gujarat: NIGEC
Corporate News
GMR Group plans to raise $1 billion as it eyes turnaround
Cigarette cos hit hard on GST panel suggestion
Jaypee Group to sell cement arm by March for `19,500 cr
Government examining anti-dumping, anti-subsidy probe on imports of
Chinese radial tyres
Market Outlook
December 8, 2015
Top Picks ★★★★★
Large Cap
Market Cap
CMP
Target
Upside
Company
Rationale
(` Cr)
(`)
(`)
(%)
To outpace battery industry growth due to better technological
Amara Raja Batteries
14,447
846
1,040
23.0
products leading to market share gains in both the automotive
OEM and replacement segments.
Earnings to grow strongly given the MHCV cyclical upturn.
Ashok Leyland
25,641
90
111
23.2
Focus on exports and LCV's provides additional growth
avenue.
Healthy pace of branch expansion, backed by distribution
Axis Bank
1,09,845
462
630
36.3
network, will be the driving force for the bank’s retail business
and overall earnings.
The stock is trading at attractive valuations and is factoring all
HCL Tech
1,18,437
841
1,132
34.7
the bad news.
Strong visibility for a robust 20% earnings trajectory, coupled
HDFC Bank
2,68,055
1,062
1,262
18.8
with high quality of earnings on account of high quality retail
business and strategic focus on highly rated corporates.
Due to its robust franchise and capital adequacy position, the
bank is well positioned to grow by at least a few percentage
ICICI Bank
1,52,967
263
354
34.5
points higher than the average industry growth rate from a
structural point of view.
Back on the growth trend, expect a long term growth of 14%
Infosys
2,40,226
1,046
1,306
24.9
to be a US$20bn in FY2020.
Well positioned to benefit from such expected gradual
recovery in the overall domestic capex cycle, given its presence
Larsen & Toubro
1,24,862
1,341
1,646
22.8
across various infrastructure segments, its execution
capabilities, and its strong balance sheet.
LICHF continues to grow its retail loan book at a healthy pace
with improvement in asset quality. We expect the company to
LIC Housing Finance
23,333
462
571
23.5
post a healthy loan book which is likely to reflect in a strong
earnings growth.
Source: Company, Angel Research
Mid Cap
Market Cap
CMP
Target
Upside
Company
Rationale
(` Cr)
(`)
(`)
(%)
Favourable outlook for the AC industry to augur well for
Cooling products business which is out pacing the market
Blue Star
3,208
357
429
20.3
growth. EMPPAC division's profitability to improve once
operating environment turns around.
Change in business focus towards high-margin chronic &
Ipca labs
9,554
757
900
18.9
lifestyle segments and increasing penetration in Europe and
US
Economic recovery to have favourable impact on advertising &
circulation revenue growth. Further, the acquisition of a radio
Jagran Prakashan
4,781
146
169
15.6
business (Radio City) would also boost the company's revenue
growth.
Strong brand & quality teaching with innovative technologies &
MT Educare
560
141
169
20.2
higher government educational spending to boost growth
Earnings boost on back of stable material prices and
Radico Khaitan
1,445
109
156
43.6
favourable pricing environment. Valuation discount to peers
provides additional comfort
Strong brands and distribution network would boost growth
Siyaram Silk Mills
1,092
1,165
1,354
16.3
going ahead. Stock currently trades at an inexpensive
valuation.
Structural shift in the Lighting industry towards LED lighting will
Surya Roshni
590
135
183
36.0
drive growth.
Source: Company, Angel Research
Market Outlook
December 08, 2015
Key Upcoming Events
Global economic events release calendar
Date
Time
Country
Event Description
Unit
Period
Bloomberg Data
Last Reported Estimated
Dec 8, 2015
3:00PM
UK
Industrial Production (YoY)
% Change
Oct
1.10
1.20
China
Exports YoY%
% Change
Nov
(6.90)
(5.00)
3:30PM
Euro Zone
Euro-Zone GDP s.a. (QoQ)
% Change
3Q P
0.30
0.30
Dec 9, 2015
7:00AM
China
Consumer Price Index (YoY)
% Change
Nov
1.30
1.40
Dec 10, 2015
7:00PM
US
Initial Jobless claims
Thousands
Dec 5
269.00
268.00
5:30PM
UK
BOE Announces rates
% Ratio
Dec 10
0.50
0.50
India
Imports YoY%
% Change
Nov
(21.15)
--
India
Exports YoY%
% Change
Nov
(17.53)
--
Dec 11, 2015
5:30PM
India
Industrial Production YoY
% Change
Oct
3.60
--
Dec 12, 2015
11:00AM
China
Industrial Production (YoY)
% Change
Nov
5.60
5.70
Dec 14, 2015
12:00PM
India
Monthly Wholesale Prices YoY%
% Change
Nov
(3.81)
--
Dec 15, 2015
7:00PM
US
Consumer price index (mom)
% Change
Nov
0.20
--
3:00PM
UK
CPI (YoY)
% Change
Nov
(0.10)
--
Dec 16, 2015
7:00PM
US
Housing Starts
Thousands
Nov
1,060.00
1,125.00
7:00PM
US
Building permits
Thousands
Nov
1,161.00
1,143.00
2:00PM
Germany
PMI Services
Value
Dec P
55.60
--
2:00PM
Germany
PMI Manufacturing
Value
Dec P
52.90
--
3:00PM
UK
Jobless claims change
% Change
Nov
3.30
--
3:30PM
Euro Zone
Euro-Zone CPI (YoY)
%
Nov F
0.10
--
7:45PM
US
Industrial Production
%
Nov
(0.15)
--
Source: Bloomberg, Angel Research
Market Outlook
December 8, 2015
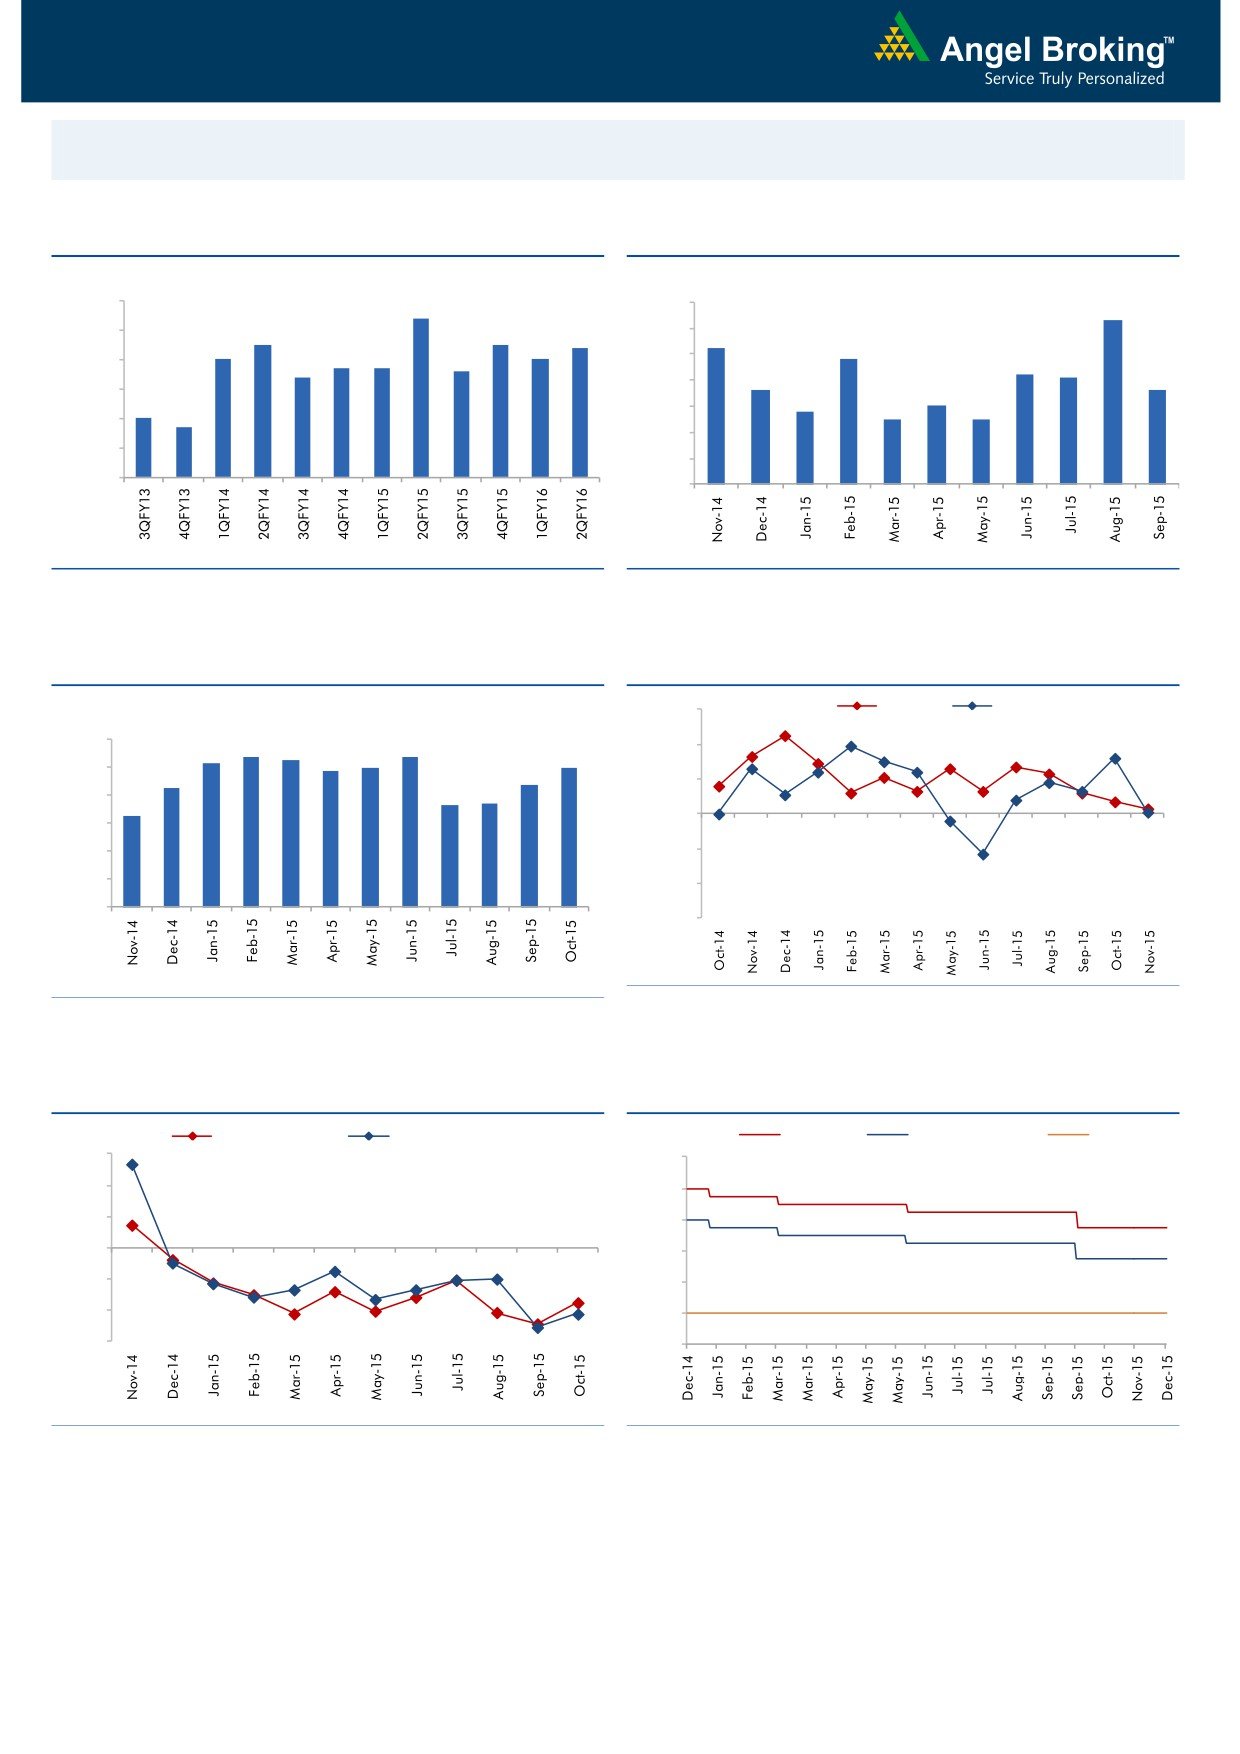
Macro watch
Exhibit 1: Quarterly GDP trends
Exhibit 2: IIP trends
(%)
(%)
9.0
8.4
7.0
6.3
8.0
7.5
7.5
7.4
6.0
5.2
7.0
7.0
4.8
6.7
6.7
6.6
5.0
7.0
6.4
4.2
4.1
3.6
3.6
4.0
6.0
2.8
3.0
5.0
3.0
2.5
2.5
4.7
5.0
2.0
4.0
1.0
3.0
-
Source: CSO, Angel Research
Source: MOSPI, Angel Research
Exhibit 3: Monthly CPI inflation trends
Exhibit 4: Manufacturing and services PMI
(%)
56.0
Mfg. PMI
Services PMI
6.0
5.4
5.3
5.4
54.0
5.2
5.0
5.0
4.9
5.0
4.3
4.4
52.0
3.7
3.7
4.0
3.3
50.0
3.0
2.0
48.0
1.0
46.0
-
44.0
Source: Market, Angel Research; Note: Level above 50 indicates expansion
Source: MOSPI, Angel Research
Exhibit 5: Exports and imports growth trends
Exhibit 6: Key policy rates
(%)
Exports yoy growth
Imports yoy growth
(%)
Repo rate
Reverse Repo rate
CRR
30.0
9.00
20.0
8.00
10.0
7.00
0.0
6.00
(10.0)
5.00
(20.0)
4.00
(30.0)
3.00
Source: Bloomberg, Angel Research
Source: RBI, Angel Research
Market Outlook
December 8, 2015
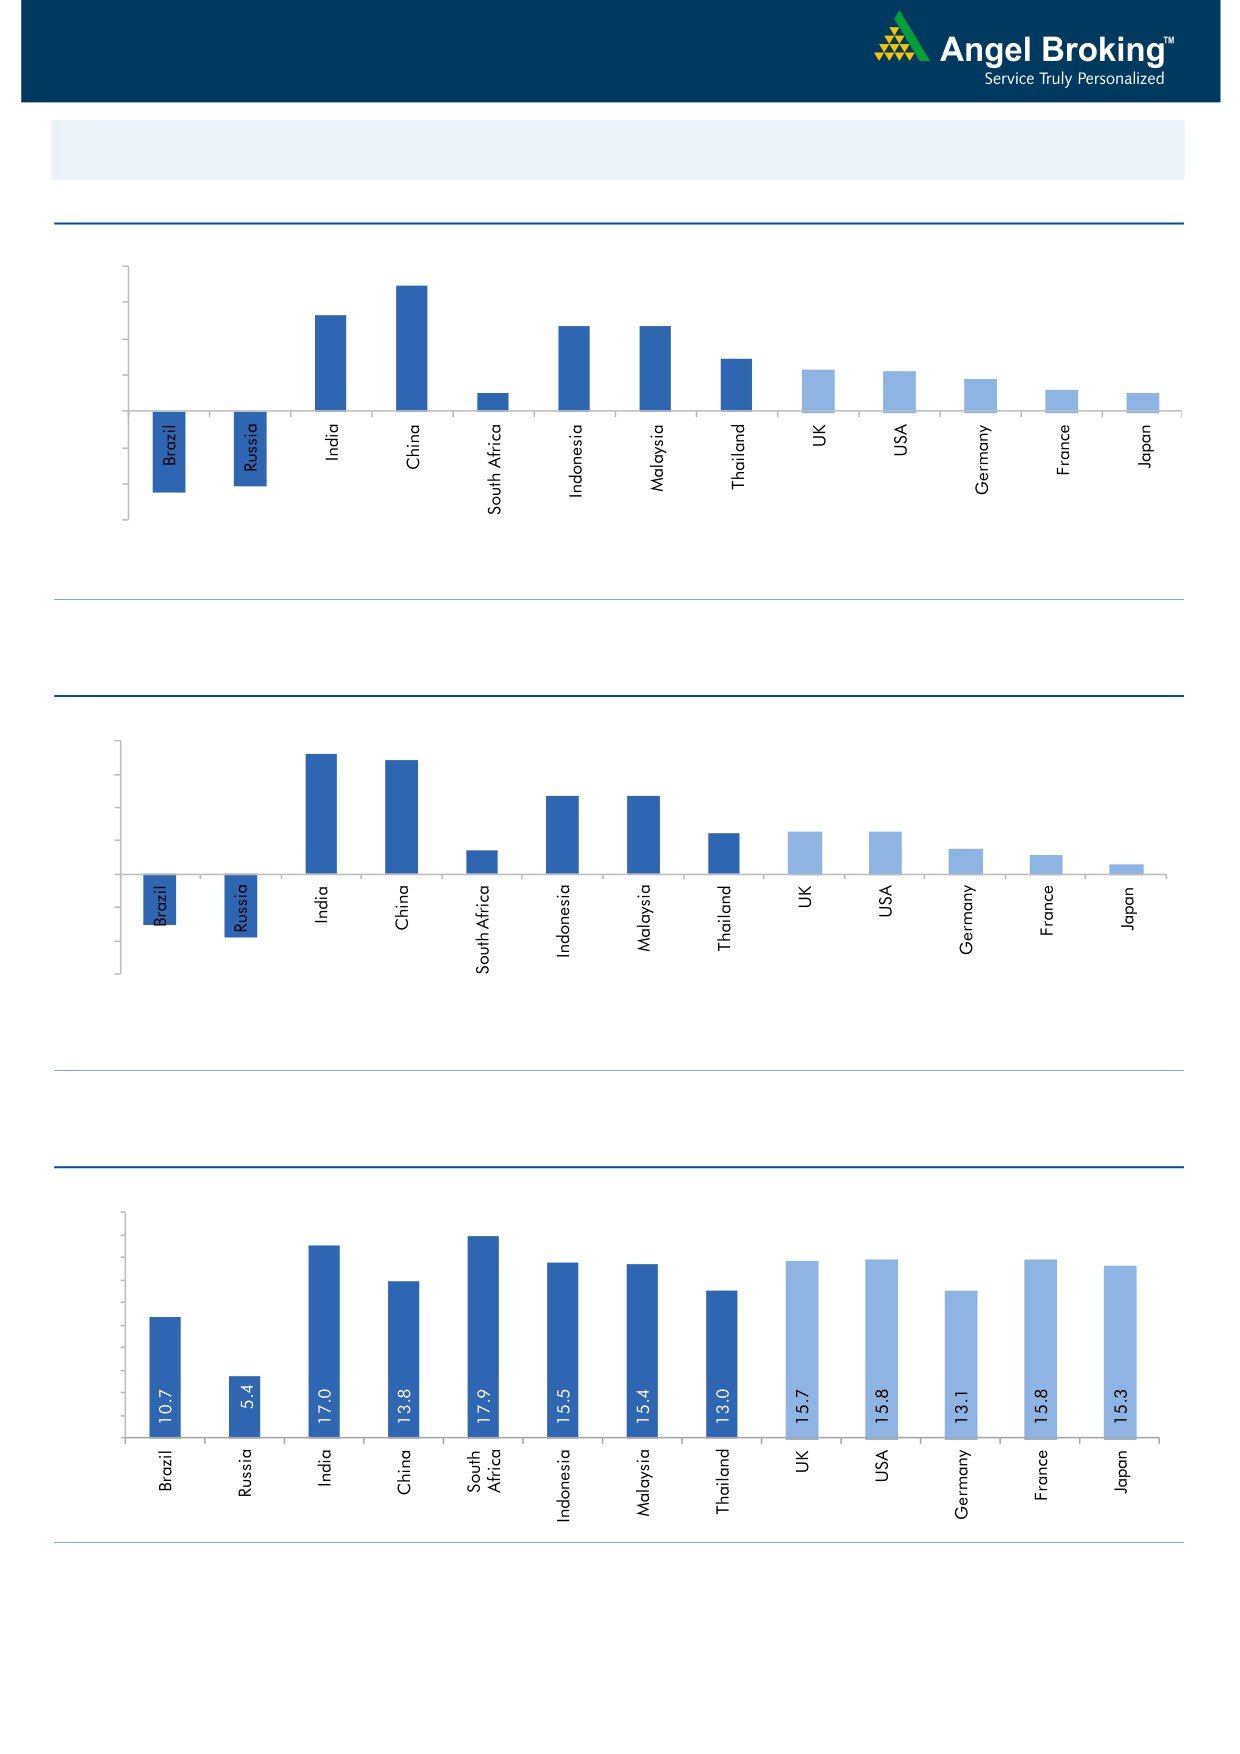
Global watch
Exhibit 1: Latest quarterly GDP Growth (%, yoy) across select developing and developed countries
(%)
8.0
6.9
5.3
6.0
4.7
4.7
4.0
2.9
2.3
2.2
1.8
2.0
1.0
1.2
1.0
-
(2.0)
(4.0)
(4.1)
(4.5)
(6.0)
Source: Bloomberg, Angel Research
Exhibit 2: 2015 GDP Growth projection by IMF (%, yoy) across select developing and developed countries
(%)
7.3
8.0
6.8
6.0
4.7
4.7
4.0
2.5
2.5
2.6
1.4
1.5
2.0
1.2
0.6
-
(2.0)
(4.0)
(3.0)
(3.8)
(6.0)
Source: IMF, Angel Research
Exhibit 3: One year forward P-E ratio across select developing and developed countries
(x)
20.0
18.0
16.0
14.0
12.0
10.0
8.0
6.0
4.0
2.0
-
Source: IMF, Angel Research
Market Outlook
December 8, 2015
Exhibit 4: Relative performance of indices across globe
Returns (%)
Country
Name of index
Closing price
1M
3M
1YR
Brazil
Bovespa
45,223
(5.6)
(0.3)
(17.1)
Russia
Micex
1,741
(1.2)
2.6
10.3
India
Nifty
7,765
(3.7)
(2.6)
(8.9)
China
Shanghai Composite
3,537
0.4
9.4
35.8
South Africa
Top 40
44,899
(7.1)
3.9
3.0
Mexico
Mexbol
42,655
(5.2)
0.1
(0.3)
Indonesia
LQ45
781
(0.7)
4.2
(11.9)
Malaysia
KLCI
1,672
(0.8)
5.1
(6.0)
Thailand
SET 50
856
(7.1)
(4.1)
(19.5)
USA
Dow Jones
17,731
(0.4)
9.0
(0.6)
UK
FTSE
6,224
(2.2)
1.3
(4.7)
Japan
Nikkei
19,698
4.1
4.3
13.3
Germany
DAX
10,886
0.8
6.8
9.6
France
CAC
4,756
(3.6)
4.4
13.6
Source: Bloomberg, Angel Research
Stock Watch
December 08, 2015
Company Name
Reco
CMP
Target
Mkt Cap
Sales ( Čcr )
OPM(%)
EPS (Č)
PER(x)
P/BV(x)
RoE(%)
EV/Sales(x)
(Č)
Price ( Č)
( Č cr )
FY16E FY17E
FY16E
FY17E
FY16E
FY17E
FY16E
FY17E
FY16E
FY17E
FY16E
FY17E
FY16E
FY17E
Agri / Agri Chemical
Rallis
Neutral
180
-
3,497
2,075
2,394
14.4
14.4
9.5
11.0
18.9
16.4
3.8
3.3
21.1
21.3
1.7
1.5
United Phosphorus
Buy
415
510
17,779
13,698
15,752
17.6
17.6
32.1
38.5
12.9
10.8
2.5
2.1
21.4
21.3
1.4
1.1
Auto & Auto Ancillary
Ashok Leyland
Buy
90
111
25,641
17,995
21,544
11.4
11.6
3.4
4.7
26.5
19.2
4.6
4.3
17.7
22.2
1.4
1.1
Bajaj Auto
Accumulate
2,449
2,728
70,866
23,695
27,298
21.3
20.4
134.6
151.5
18.2
16.2
5.8
5.0
31.8
30.6
2.5
2.2
Bharat Forge
Buy
834
1,016
19,405
8,013
9,250
20.0
20.3
35.2
43.1
23.7
19.3
4.7
3.8
21.6
21.8
2.5
2.2
Eicher Motors
Buy
16,231
19,036
44,073
15,379
16,498
15.6
16.6
473.2
574.8
34.3
28.2
12.7
9.4
36.7
33.2
2.8
2.6
Hero Motocorp
Accumulate
2,621
2,774
52,345
28,561
31,559
14.7
14.7
151.1
163.2
17.4
16.1
6.7
5.7
38.7
35.6
1.7
1.5
Jamna Auto Industries Neutral
124
-
990
1,292
1,486
9.3
9.8
6.0
7.5
20.7
16.5
4.3
3.6
20.7
21.8
0.8
0.7
L G Balakrishnan & Bros Neutral
506
-
794
1,254
1,394
11.6
11.8
35.9
41.7
14.1
12.1
1.9
1.7
13.5
13.8
0.7
0.7
Mahindra and Mahindra Accumulate
1,325
1,449
82,285
39,031
44,440
13.8
13.9
57.9
67.6
22.9
19.6
3.7
3.3
16.1
16.6
1.8
1.5
Maruti
Neutral
4,564
-
137,880
57,865
68,104
16.4
16.7
176.3
225.5
25.9
20.2
5.0
4.3
19.4
21.2
2.2
1.8
Minda Industries
Neutral
868
-
1,376
2,567
2,965
8.0
8.3
46.1
57.8
18.8
15.0
3.1
2.6
16.7
17.3
0.6
0.5
Motherson Sumi
Accumulate
280
313
37,043
39,343
45,100
8.8
9.1
10.1
12.5
27.7
22.4
8.8
6.9
35.3
34.4
1.0
0.9
Rane Brake Lining
Accumulate
340
366
269
454
511
11.1
11.4
23.8
28.1
14.3
12.1
2.0
1.8
14.2
15.3
0.7
0.7
Setco Automotive
Neutral
223
-
595
594
741
12.7
13.7
8.4
15.8
26.5
14.1
2.8
2.4
10.4
16.9
1.4
1.2
Tata Motors
Neutral
399
-
115,185
255,254
301,772
12.9
13.4
23.7
37.3
16.8
10.7
2.0
1.7
7.4
12.1
0.6
0.6
TVS Motor
Buy
282
338
13,388
11,569
13,648
7.3
8.7
10.3
16.1
27.4
17.5
6.8
5.3
24.8
30.5
1.1
0.9
Amara Raja Batteries
Buy
846
1,040
14,447
4,892
5,871
17.4
17.6
28.8
37.1
29.4
22.8
6.9
5.5
23.4
24.1
2.9
2.4
Exide Industries
Accumulate
141
162
11,989
6,950
7,784
14.4
14.8
6.6
7.3
21.4
19.3
2.7
2.5
12.6
12.8
1.4
1.3
Apollo Tyres
Accumulate
157
171
7,992
12,146
12,689
16.8
16.0
21.2
19.0
7.4
8.3
1.2
1.1
16.5
13.0
0.7
0.8
Ceat
Accumulate
1,038
1,119
4,200
6,041
6,597
14.1
13.7
99.5
111.9
10.4
9.3
2.1
1.7
19.6
18.5
0.8
0.7
JK Tyres
Neutral
107
-
2,419
7,446
7,669
15.2
14.0
19.6
18.4
5.4
5.8
1.4
1.1
25.2
19.5
0.7
0.6
Swaraj Engines
Neutral
910
-
1,130
552
630
14.2
14.7
44.6
54.1
20.4
16.8
4.7
4.3
23.2
25.6
1.9
1.6
Subros
Neutral
99
-
592
1,268
1,488
11.6
11.9
3.7
6.6
26.7
15.0
1.8
1.6
6.8
11.4
0.8
0.6
Indag Rubber
Neutral
226
-
593
283
329
17.0
17.2
13.0
15.4
17.5
14.7
3.8
3.2
21.8
21.6
1.8
1.5
Capital Goods
ACE
Neutral
43
-
424
660
839
4.7
8.2
1.0
3.9
42.9
11.0
1.3
1.2
3.2
11.3
0.8
0.6
BEML
Neutral
1,100
-
4,581
3,277
4,006
6.0
8.9
29.2
64.3
37.7
17.1
2.1
1.9
5.7
11.7
1.5
1.2
BGR Energy
Neutral
120
-
865
3,615
3,181
9.5
9.4
16.7
12.4
7.2
9.7
0.7
0.7
10.0
7.0
0.7
0.8
BHEL
Neutral
169
-
41,389
33,722
35,272
10.8
11.7
10.5
14.2
16.1
11.9
1.2
1.1
7.0
9.0
1.3
1.2
Stock Watch
December 08, 2015
Company Name
Reco
CMP
Target
Mkt Cap
Sales ( Čcr )
OPM(%)
EPS (Č)
PER(x)
P/BV(x)
RoE(%)
EV/Sales(x)
(Č)
Price ( Č)
( Č cr )
FY16E
FY17E
FY16E
FY17E
FY16E
FY17E
FY16E
FY17E
FY16E
FY17E
FY16E
FY17E
FY16E
FY17E
Capital Goods
Blue Star
Buy
357
429
3,208
3,548
3,977
6.3
6.9
13.7
17.2
26.0
20.8
6.6
4.3
26.1
25.4
1.0
0.8
Crompton Greaves
Accumulate
192
204
12,062
13,484
14,687
4.9
6.2
4.5
7.1
42.8
27.1
3.0
2.8
7.2
10.8
1.0
0.9
Inox Wind
Buy
357
505
7,920
4,980
5,943
17.0
17.5
26.6
31.6
13.4
11.3
4.0
3.0
35.0
30.0
1.7
1.4
KEC International
Neutral
154
-
3,951
8,791
9,716
6.1
6.8
5.4
8.2
28.5
18.7
2.9
2.6
10.0
14.0
0.7
0.6
Thermax
Neutral
895
-
10,669
6,413
7,525
7.4
8.5
30.5
39.3
29.4
22.8
4.5
3.9
15.0
17.0
1.6
1.3
Cement
ACC
Buy
1,350
1,630
25,350
13,151
14,757
16.4
18.3
63.9
83.4
21.1
16.2
2.7
2.5
13.3
16.1
1.8
1.5
Ambuja Cements
Buy
196
233
30,402
11,564
12,556
19.4
20.7
8.9
10.1
22.0
19.4
2.8
2.6
12.8
13.8
2.3
2.1
HeidelbergCement
Neutral
75
-
1,697
1,772
1,926
13.3
15.4
1.0
3.0
74.9
25.0
1.9
1.8
2.6
7.9
1.5
1.3
India Cements
Buy
86
112
2,633
4,216
4,840
18.0
19.5
4.0
9.9
21.4
8.7
0.9
0.8
4.0
9.5
1.0
0.8
JK Cement
Accumulate
654
744
4,573
3,661
4,742
10.1
15.8
18.0
61.0
36.3
10.7
2.6
2.3
7.5
22.9
1.7
1.3
J K Lakshmi Cement
Buy
331
430
3,900
2,947
3,616
16.7
19.9
11.5
27.2
28.8
12.2
2.7
2.4
9.8
20.8
1.7
1.4
Mangalam Cements
Neutral
211
-
562
1,053
1,347
10.5
13.3
8.4
26.0
25.1
8.1
1.1
1.0
4.3
12.5
0.9
0.7
Orient Cement
Accumulate
163
183
3,335
1,854
2,524
21.2
22.2
7.7
11.1
21.1
14.7
3.0
2.6
13.3
15.7
2.5
1.8
Ramco Cements
Neutral
372
-
8,848
4,036
4,545
20.8
21.3
15.1
18.8
24.6
19.8
3.0
2.7
12.9
14.3
2.7
2.3
Shree Cement^
Neutral
11,193
-
38,993
7,150
8,742
26.7
28.6
228.0
345.5
49.1
32.4
7.2
6.1
15.7
20.3
5.2
4.2
UltraTech Cement
Accumulate
2,864
3,282
78,582
25,021
30,023
19.1
21.6
89.0
132.0
32.2
21.7
3.7
3.2
12.2
15.9
3.2
2.7
Construction
ITNL
Neutral
84
-
2,758
7,360
8,825
34.0
35.9
7.0
9.0
12.0
9.3
0.4
0.4
3.2
3.7
3.7
3.6
KNR Constructions
Accumulate
614
673
1,727
937
1,470
14.3
14.0
33.5
38.6
18.3
15.9
2.8
2.4
15.4
15.4
1.9
1.2
Larsen & Toubro
Buy
1,341
1,646
124,862
65,065
77,009
11.5
11.7
61.5
65.6
21.8
20.4
2.2
2.0
13.4
14.0
2.1
1.8
Gujarat Pipavav Port
Neutral
158
-
7,619
629
684
51.0
52.2
6.4
5.9
24.6
26.7
3.2
3.0
15.9
12.7
11.8
10.6
MBL Infrastructures
Buy
216
285
893
2,313
2,797
12.2
14.6
19.0
20.0
11.3
10.8
1.2
1.1
11.3
10.6
1.1
1.0
Nagarjuna Const.
Neutral
78
-
4,342
7,892
8,842
8.8
9.1
3.0
5.3
26.0
14.7
1.3
1.2
5.0
8.5
0.8
0.7
PNC Infratech
Neutral
533
-
2,732
1,873
2,288
13.2
13.5
24.0
32.0
22.2
16.6
2.2
1.9
12.1
12.3
1.6
1.3
Simplex Infra
Neutral
327
-
1,615
5,955
6,829
10.3
10.5
16.0
31.0
20.4
10.5
1.1
1.0
5.3
9.9
0.8
0.7
Power Mech Projects
Neutral
610
-
897
1,539
1,801
12.8
12.7
59.0
72.1
10.3
8.5
1.6
1.3
18.6
16.8
0.6
0.5
Sadbhav Engineering
Neutral
337
-
5,784
3,481
4,219
10.7
10.8
8.0
12.0
42.2
28.1
3.9
3.4
10.3
13.5
1.9
1.6
NBCC
Accumulate
973
1,089
11,680
7,382
9,506
7.7
8.6
39.8
54.4
24.5
17.9
5.9
4.7
26.7
29.1
1.3
1.0
SIPL
Neutral
100
-
3,531
675
1,042
62.4
64.7
-
-
3.8
4.3
-
-
16.9
11.4
Financials
Allahabad Bank
Neutral
73
-
4,375
8,569
9,392
2.8
2.9
16.3
27.5
4.5
2.7
0.4
0.3
7.6
11.9
-
-
Stock Watch
December 08, 2015
Company Name
Reco
CMP
Target
Mkt Cap
Sales ( Čcr )
OPM(%)
EPS (Č)
PER(x)
P/BV(x)
RoE(%)
EV/Sales(x)
(Č)
Price ( Č)
( Č cr )
FY16E
FY17E
FY16E
FY17E
FY16E
FY17E
FY16E
FY17E
FY16E
FY17E
FY16E
FY17E
FY16E
FY17E
Financials
Axis Bank
Buy
462
630
109,845
26,473
31,527
3.5
3.6
35.7
43.5
12.9
10.6
2.5
2.2
17.9
18.9
-
-
Bank of Baroda
Neutral
166
-
38,214
18,485
21,025
1.9
2.0
13.5
21.1
12.3
7.9
1.0
0.9
7.3
10.6
-
-
Bank of India
Neutral
122
-
9,657
15,972
17,271
1.9
2.0
15.3
33.4
8.0
3.7
0.4
0.3
3.6
7.6
-
-
Canara Bank
Neutral
253
-
13,732
15,441
16,945
2.0
2.1
46.6
70.4
5.4
3.6
0.5
0.4
8.0
11.2
-
-
Dena Bank
Neutral
43
-
2,781
3,440
3,840
2.1
2.3
7.3
10.0
6.0
4.3
0.5
0.4
6.1
7.9
-
-
Federal Bank
Neutral
58
-
9,883
3,477
3,999
3.0
3.0
5.0
6.2
11.5
9.2
1.2
1.1
10.6
11.9
-
-
HDFC
Neutral
1,186
-
187,166
10,358
11,852
3.3
3.3
41.1
47.0
28.9
25.2
5.5
5.0
24.7
24.9
-
-
HDFC Bank
Buy
1,062
1,262
268,055
38,309
47,302
4.3
4.3
49.3
61.1
21.5
17.4
3.7
3.2
18.5
19.7
-
-
ICICI Bank
Buy
263
354
152,967
34,279
39,262
3.3
3.3
21.0
24.4
12.5
10.8
2.1
1.8
14.4
14.7
-
-
IDBI Bank
Neutral
92
-
14,732
9,625
10,455
1.8
1.8
8.5
14.2
10.8
6.5
0.7
0.6
5.9
9.3
-
-
Indian Bank
Neutral
127
-
6,080
6,160
6,858
2.5
2.5
24.5
29.8
5.2
4.2
0.4
0.4
7.7
8.6
-
-
LIC Housing Finance
Buy
462
571
23,333
3,101
3,745
2.5
2.5
33.0
40.2
14.0
11.5
2.6
2.2
19.7
20.5
-
-
Oriental Bank
Neutral
143
-
4,301
7,643
8,373
2.4
2.4
37.2
45.4
3.9
3.2
0.3
0.3
8.2
9.4
-
-
Punjab Natl.Bank
Neutral
134
-
26,312
23,638
26,557
2.8
2.8
17.9
27.2
7.5
4.9
0.8
0.6
8.5
12.0
-
-
South Ind.Bank
Neutral
20
-
2,734
1,965
2,185
2.5
2.5
2.5
3.3
8.1
6.1
0.8
0.7
9.5
11.7
-
-
St Bk of India
Buy
239
283
185,647
82,520
93,299
2.7
2.8
20.0
24.5
11.9
9.8
1.3
1.2
11.5
12.8
-
-
Union Bank
Neutral
166
-
11,377
12,646
14,129
2.3
2.4
31.0
39.1
5.3
4.2
0.6
0.5
9.8
11.4
-
-
Vijaya Bank
Neutral
34
-
2,947
3,536
3,827
1.9
1.9
5.5
6.7
6.2
5.2
0.5
0.5
7.8
8.8
-
-
Yes Bank
Buy
735
921
30,815
7,190
9,011
3.2
3.3
58.2
69.7
12.6
10.6
2.3
1.9
19.2
19.6
-
-
FMCG
Asian Paints
Neutral
871
-
83,537
16,553
19,160
16.0
16.2
17.7
21.5
49.3
40.5
13.1
11.8
29.4
31.2
4.9
4.2
Britannia
Neutral
2,880
-
34,554
8,065
9,395
9.6
10.2
47.2
65.5
61.0
44.0
20.3
19.2
38.3
41.2
4.1
3.5
Colgate
Neutral
992
-
26,988
4,836
5,490
19.5
19.7
48.5
53.2
20.5
18.7
15.0
13.1
99.8
97.5
5.5
4.8
Dabur India
Neutral
276
-
48,614
9,370
10,265
17.1
17.2
7.3
8.1
37.7
34.1
11.4
9.2
33.7
30.6
5.1
4.6
GlaxoSmith Con*
Neutral
6,044
-
25,416
4,919
5,742
17.2
17.4
168.3
191.2
35.9
31.6
10.2
8.7
28.8
28.9
4.7
4.0
Godrej Consumer
Neutral
1,228
-
41,804
10,168
12,886
16.1
16.1
32.1
38.4
38.3
32.0
7.8
7.2
19.7
21.0
4.2
3.3
HUL
Neutral
832
-
179,980
34,940
38,957
17.5
17.7
20.8
24.7
40.0
33.7
44.5
35.5
110.5
114.2
5.0
4.4
ITC
Buy
314
382
251,857
41,068
45,068
37.8
37.4
13.9
15.9
22.5
19.7
7.6
6.6
34.1
33.8
5.8
5.2
Marico
Neutral
426
-
27,503
6,551
7,766
15.7
16.0
10.4
12.5
41.1
34.1
11.9
9.9
33.2
32.4
4.1
3.5
Nestle*
Accumulate
5,898
6,646
56,869
11,291
12,847
22.2
22.3
158.9
184.6
37.1
32.0
19.4
17.5
55.0
57.3
4.9
4.3
Stock Watch
December 08, 2015
Company Name
Reco
CMP
Target
Mkt Cap
Sales ( Čcr )
OPM(%)
EPS (Č)
PER(x)
P/BV(x)
RoE(%)
EV/Sales(x)
(Č)
Price ( Č)
( Č cr )
FY16E FY17E
FY16E
FY17E
FY16E
FY17E
FY16E
FY17E
FY16E
FY17E
FY16E
FY17E
FY16E
FY17E
FMCG
Tata Global
Accumulate
135
144
8,542
8,635
9,072
9.8
9.9
6.5
7.6
20.8
17.8
2.1
2.0
6.8
7.4
0.9
0.9
IT
HCL Tech^
Buy
841
1,132
118,438
42,038
47,503
23.2
23.5
55.8
62.9
15.1
13.4
3.5
2.6
23.0
19.8
2.4
1.9
Infosys
Buy
1,046
1,306
240,226
60,250
66,999
28.0
28.0
58.3
63.7
17.9
16.4
3.8
3.2
20.9
19.7
3.3
2.8
TCS
Buy
2,324
3,165
457,947
111,274
126,852
28.4
28.7
125.4
143.9
18.5
16.2
7.3
6.8
39.9
42.2
3.7
3.2
Tech Mahindra
Buy
544
646
52,569
25,566
28,890
16.0
17.0
26.3
31.9
20.7
17.1
3.7
3.2
17.9
18.6
1.8
1.6
Wipro
Buy
575
719
142,048
52,414
58,704
23.7
23.8
38.4
42.3
15.0
13.6
2.9
2.6
19.5
18.0
2.3
1.9
Media
D B Corp
Accumulate
338
356
6,207
2,241
2,495
27.8
27.9
21.8
25.6
15.5
13.2
4.1
3.6
26.7
28.5
2.7
2.4
HT Media
Neutral
79
-
1,845
2,495
2,603
11.2
11.2
7.3
8.6
10.9
9.2
0.9
0.8
7.4
8.1
0.2
0.2
Jagran Prakashan
Buy
146
169
4,781
2,170
2,355
27.2
26.2
8.9
9.9
16.4
14.8
3.5
3.0
20.9
20.5
2.1
1.9
Sun TV Network
Neutral
378
-
14,900
2,779
3,196
70.2
70.5
22.8
27.3
16.6
13.9
4.1
3.7
26.7
28.3
5.1
4.4
Hindustan Media
Neutral
276
-
2,024
920
1,031
20.0
20.0
19.2
20.9
14.4
13.2
2.4
2.0
16.4
15.3
1.7
1.5
Ventures
Metals & Mining
Coal India
Buy
328
380
206,893
76,167
84,130
19.9
22.3
22.4
25.8
14.6
12.7
5.3
5.1
35.5
41.0
2.0
1.8
Hind. Zinc
Buy
147
175
62,007
14,641
14,026
50.4
50.4
17.7
16.0
8.3
9.2
1.3
1.2
16.2
13.2
1.9
1.7
Hindalco
Neutral
79
-
16,386
104,356
111,186
8.7
9.5
6.7
11.1
11.8
7.2
0.4
0.4
3.5
5.9
0.7
0.6
JSW Steel
Neutral
975
-
23,557
42,308
45,147
16.4
20.7
(10.3)
49.5
19.7
1.1
1.1
(1.0)
5.6
1.6
1.5
NMDC
Neutral
91
-
35,881
8,237
10,893
46.6
44.5
10.0
11.7
9.1
7.8
1.0
0.9
12.5
13.0
4.1
3.2
SAIL
Neutral
47
-
19,226
45,915
53,954
7.2
10.5
1.5
4.4
30.9
10.6
0.5
0.4
2.3
4.1
1.1
0.9
Vedanta
Neutral
91
-
27,053
71,445
81,910
26.2
26.3
12.9
19.2
7.1
4.8
0.5
0.4
7.2
8.9
0.8
0.6
Tata Steel
Neutral
244
-
23,654
126,760
137,307
8.9
11.3
6.4
23.1
38.3
10.6
0.8
0.7
2.0
7.1
0.8
0.7
Oil & Gas
Cairn India
Neutral
136
-
25,433
11,323
12,490
49.4
51.0
20.7
20.7
6.6
6.6
0.4
0.4
6.4
6.1
1.3
0.7
GAIL
Neutral
358
-
45,354
64,856
70,933
9.1
9.6
24.0
28.9
14.9
12.4
1.3
1.2
8.8
9.6
0.9
0.8
ONGC
Neutral
224
-
191,729
154,564
167,321
36.8
37.4
28.6
32.5
7.8
6.9
1.0
0.9
12.7
13.5
1.4
1.4
Petronet LNG
Neutral
244
-
18,289
29,691
31,188
5.8
6.2
12.8
13.4
19.1
18.2
2.9
2.5
15.8
14.8
0.7
0.7
Indian Oil Corp
Accumulate
429
455
104,086
359,607
402,760
5.9
6.1
42.5
48.7
10.1
8.8
1.4
1.2
14.1
14.4
0.4
0.3
Reliance Industries
Accumulate
954
1,050
308,909
304,775
344,392
12.6
13.4
91.3
102.6
10.5
9.3
1.2
1.1
11.8
12.0
0.9
0.8
Pharmaceuticals
Alembic Pharma
Neutral
688
-
12,973
2,658
3,112
24.1
20.2
24.6
23.9
28.0
28.8
10.0
7.7
42.5
30.2
4.9
4.1
Aurobindo Pharma
Accumulate
803
872
46,866
14,923
17,162
23.0
23.0
38.2
43.6
21.0
18.4
6.5
4.9
36.0
30.2
3.5
3.0
Aventis*
Neutral
4,297
-
9,895
2,082
2,371
17.4
20.8
118.2
151.5
36.4
28.4
5.3
4.3
19.9
25.5
4.4
3.7
Cadila Healthcare
Neutral
393
-
40,274
10,224
11,840
21.0
22.0
14.6
17.6
27.0
22.4
7.4
5.8
30.8
29.0
4.0
3.4
Stock Watch
December 08, 2015
Company Name
Reco
CMP
Target
Mkt Cap
Sales ( Čcr )
OPM(%)
EPS (Č)
PER(x)
P/BV(x)
RoE(%)
EV/Sales(x)
(Č)
Price ( Č)
( Č cr )
FY16E FY17E
FY16E
FY17E
FY16E
FY17E
FY16E
FY17E
FY16E
FY17E
FY16E
FY17E
FY16E
FY17E
Pharmaceuticals
Cipla
Neutral
645
-
51,800
14,211
16,611
20.6
19.0
27.0
28.9
23.9
22.3
4.1
3.5
18.4
16.8
3.6
3.0
Dr Reddy's
Buy
3,180
3,933
54,231
16,838
19,575
25.0
23.1
167.5
178.8
19.0
17.8
4.0
3.3
23.1
20.4
3.1
2.7
Dishman Pharma
Neutral
335
-
2,701
1,733
1,906
21.5
21.5
17.0
19.9
19.7
16.8
2.0
1.8
10.5
11.2
2.1
1.8
GSK Pharma*
Neutral
3,266
-
27,667
2,870
3,158
20.0
22.1
59.5
68.3
54.9
47.8
16.2
16.6
28.5
34.3
9.1
8.4
Indoco Remedies
Neutral
314
-
2,893
1,033
1,199
15.9
18.2
9.4
13.6
33.4
23.1
5.0
4.2
15.7
19.7
2.9
2.5
Ipca labs
Buy
757
900
9,554
3,363
3,909
12.9
18.6
13.4
28.0
56.5
27.0
4.1
3.5
7.4
14.0
3.1
2.7
Lupin
Neutral
1,831
-
82,483
13,092
16,561
25.0
27.0
50.4
68.3
36.3
26.8
7.5
5.9
22.8
24.7
6.0
4.6
Sun Pharma
Buy
777
950
187,067
28,163
32,610
25.8
30.7
17.4
26.9
44.7
28.9
4.2
3.7
13.0
16.6
6.1
5.1
Power
Tata Power
Neutral
64
-
17,350
35,923
37,402
22.6
22.8
4.1
5.2
15.8
12.5
1.2
1.1
7.5
9.3
1.4
1.3
NTPC
Buy
130
157
107,438
87,064
98,846
23.5
23.5
11.7
13.2
11.1
9.9
1.2
1.2
11.4
12.1
2.3
2.0
Power Grid
Buy
131
170
68,534
20,702
23,361
86.7
86.4
12.1
13.2
10.8
9.9
1.6
1.4
15.6
15.1
8.2
7.7
Telecom
Bharti Airtel
Neutral
321
-
128,117
101,748
109,191
32.1
31.7
12.0
12.5
26.7
25.6
1.8
1.7
6.9
6.7
1.9
1.7
Idea Cellular
Neutral
137
-
49,392
34,282
36,941
32.0
31.5
5.9
6.2
23.3
22.1
2.1
1.9
9.9
9.3
2.0
1.9
zOthers
Abbott India
Neutral
5,302
-
11,266
2,715
3,153
14.5
14.1
134.3
152.2
39.5
34.8
9.9
8.1
27.4
25.6
3.9
3.3
Bajaj Electricals
Buy
214
341
2,161
4,719
5,287
5.2
5.8
8.6
12.7
25.0
16.9
2.9
2.5
11.4
14.8
0.5
0.4
Finolex Cables
Neutral
244
-
3,726
2,520
2,883
12.2
12.0
12.7
14.2
19.2
17.2
2.6
2.3
13.6
13.5
1.2
1.0
Goodyear India*
Accumulate
565
622
1,303
1,888
1,680
12.1
11.9
62.2
56.6
9.1
10.0
2.1
1.8
25.9
19.7
0.5
0.5
Hitachi
Neutral
1,312
-
3,567
1,779
2,081
7.8
8.8
21.8
33.4
60.2
39.2
9.7
7.9
17.4
22.1
2.1
1.8
Jyothy Laboratories
Neutral
307
-
5,567
1,620
1,847
11.5
11.5
7.3
8.5
42.2
36.3
5.5
5.1
13.3
14.4
3.3
2.8
MRF
Buy
39,167
45,575
16,611
20,316
14,488
21.4
21.1
5,488.0
3,798.0
7.1
10.3
2.4
2.0
41.1
21.2
0.8
1.0
Page Industries
Neutral
12,839
-
14,321
1,929
2,450
19.8
20.1
229.9
299.0
55.9
43.0
24.6
17.1
52.1
47.1
7.5
5.8
Relaxo Footwears
Neutral
491
-
5,889
1,767
2,152
12.3
12.5
19.3
25.1
25.5
19.6
6.3
4.8
27.7
27.8
3.4
2.8
Siyaram Silk Mills
Buy
1,165
1,354
1,092
1,636
1,815
11.5
11.5
89.9
104.1
13.0
11.2
2.2
1.9
17.9
17.8
0.8
0.7
Styrolution ABS India*
Neutral
719
-
1,264
1,271
1,440
8.6
9.2
32.0
41.1
22.4
17.5
2.3
2.1
10.7
12.4
1.0
0.8
TVS Srichakra
Accumulate
2,851
3,240
2,183
2,101
2,338
15.7
15.0
248.6
270.0
11.5
10.6
5.0
3.6
43.6
34.0
1.1
0.9
HSIL
Neutral
308
-
2,230
2,123
2,384
16.1
16.5
15.0
18.9
20.5
16.3
1.6
1.5
8.0
9.4
1.4
1.2
Kirloskar Engines India
Neutral
263
-
3,806
2,471
2,826
8.8
10.4
9.1
13.3
28.8
19.7
2.8
2.6
9.7
13.4
1.2
1.0
Ltd
M M Forgings
Buy
533
614
643
511
615
21.7
21.6
43.1
55.8
12.4
9.6
2.3
1.8
19.9
21.2
1.5
1.1
Banco Products (India)
Neutral
134
-
957
1,208
1,353
11.0
12.3
10.8
14.5
12.4
9.2
1.4
1.3
11.9
14.5
0.8
0.7
Stock Watch
December 08, 2015
Company Name
Reco
CMP
Target Mkt Cap
Sales ( Čcr )
OPM(%)
EPS (Č)
PER(x)
P/BV(x)
RoE(%)
EV/Sales(x)
(Č)
Price ( Č)
( Č cr )
FY16E FY17E FY16E FY17E FY16E FY17E FY16E FY17E FY16E FY17E FY16E FY17E FY16E FY17E
zOthers
Competent Automobiles Neutral
151
-
93
1,040
1,137
3.2
3.1
25.7
28.0
5.9
5.4
0.9
0.8
15.0
14.3
0.1
0.1
Nilkamal
Neutral
1,043
-
1,556
1,910
2,083
10.5
10.3
63.3
69.2
16.5
15.1
2.7
2.3
17.6
16.5
0.9
0.8
Visaka Industries
Accumulate
129
144
205
1,086
1,197
9.9
10.3
21.5
28.8
6.0
4.5
0.6
0.5
9.6
11.6
0.4
0.3
Transport Corporation of
Neutral
337
-
2,564
2,830
3,350
8.8
9.0
14.4
18.3
23.5
18.4
3.6
3.1
15.4
17.1
1.0
0.9
India
Elecon Engineering
Neutral
87
-
945
1,369
1,533
13.7
14.9
3.3
6.1
26.1
14.3
1.7
1.6
6.6
11.4
1.0
0.9
Surya Roshni
Buy
135
183
590
2,992
3,223
8.1
8.4
14.7
18.3
9.2
7.3
0.9
0.8
9.7
11.0
0.5
0.4
MT Educare
Buy
141
169
560
286
366
18.3
17.7
7.7
9.4
18.2
15.0
3.8
3.4
20.2
21.1
1.9
1.4
Radico Khaitan
Buy
109
156
1,445
1,565
1,687
12.2
13.0
5.7
7.1
19.1
15.3
1.6
1.5
8.3
9.6
1.4
1.3
Garware Wall Ropes
Accumulate
379
423
830
861
967
10.9
10.9
24.0
28.2
15.8
13.5
2.3
2.0
14.6
14.9
1.0
0.8
Wonderla Holidays
Neutral
390
-
2,205
206
308
44.0
43.6
9.0
12.9
43.4
30.3
5.9
5.4
13.7
17.8
10.6
7.1
Linc Pen & Plastics
Neutral
176
-
261
340
371
8.3
8.9
10.8
13.2
16.3
13.4
2.6
2.3
16.0
17.1
0.8
0.7
The Byke Hospitality
Accumulate
165
181
661
222
287
20.5
20.5
5.6
7.6
29.2
21.8
5.5
4.5
18.9
20.8
3.0
2.3
Interglobe Aviation
Neutral
1,045
-
37,641
17,022
21,122
20.7
14.5
63.9
53.7
16.3
19.5
24.5
20.1
149.9
103.2
2.2
1.8
Coffee Day Enterprises
Neutral
253
-
5,217
2,692
2,964
17.0
18.6
-
4.7
-
53.4
3.1
2.9
0.2
5.5
2.3
2.2
Ltd
Navneet Education
Accumulate
86
97
2,050
998
1,062
24.1
24.0
5.8
6.1
15.0
14.1
3.3
2.9
22.0
20.6
2.1
2.0
Source: Company, Angel Research; Note: *December year end; #September year end; &October year end; Price as on December 07, 2015
Market Outlook
December 08, 2015
Research Team Tel: 022 - 39357800
DISCLAIMER
Angel Broking Private Limited (hereinafter referred to as “Angel”) is a registered Member of National Stock Exchange of India Limited,
Bombay Stock Exchange Limited and Metropolitian Stock Exchange of India Limited. It is also registered as a Depository Participant with
CDSL and Portfolio Manager with SEBI. It also has registration with AMFI as a Mutual Fund Distributor. Angel Broking Private Limited is a
registered entity with SEBI for Research Analyst in terms of SEBI (Research Analyst) Regulations, 2014 vide registration number
INH000000164. Angel or its associates has not been debarred/ suspended by SEBI or any other regulatory authority for accessing
/dealing in securities Market. Angel or its associates including its relatives/analyst do not hold any financial interest/beneficial ownership
of more than 1% in the company covered by Analyst. Angel or its associates/analyst has not received any compensation / managed or co
-managed public offering of securities of the company covered by Analyst during the past twelve months. Angel/analyst has not served as
an officer, director or employee of company covered by Analyst and has not been engaged in market making activity of the company
covered by Analyst.
This document is solely for the personal information of the recipient, and must not be singularly used as the basis of any investment
decision. Nothing in this document should be construed as investment or financial advice. Each recipient of this document should make
such investigations as they deem necessary to arrive at an independent evaluation of an investment in the securities of the companies
referred to in this document (including the merits and risks involved), and should consult their own advisors to determine the merits and
risks of such an investment.
Reports based on technical and derivative analysis center on studying charts of a stock's price movement, outstanding positions and
trading volume, as opposed to focusing on a company's fundamentals and, as such, may not match with a report on a company's
fundamentals.
The information in this document has been printed on the basis of publicly available information, internal data and other reliable sources
believed to be true, but we do not represent that it is accurate or complete and it should not be relied on as such, as this document is for
general guidance only. Angel Broking Pvt. Limited or any of its affiliates/ group companies shall not be in any way responsible for any
loss or damage that may arise to any person from any inadvertent error in the information contained in this report. Angel Broking Pvt.
Limited has not independently verified all the information contained within this document. Accordingly, we cannot testify, nor make any
representation or warranty, express or implied, to the accuracy, contents or data contained within this document. While Angel Broking
Pvt. Limited endeavors to update on a reasonable basis the information discussed in this material, there may be regulatory, compliance,
or other reasons that prevent us from doing so.
This document is being supplied to you solely for your information, and its contents, information or data may not be reproduced,
redistributed or passed on, directly or indirectly.
Neither Angel Broking Pvt. Limited, nor its directors, employees or affiliates shall be liable for any loss or damage that may arise from or
in connection with the use of this information.
Note: Please refer to the important ‘Stock Holding Disclosure' report on the Angel website (Research Section). Also, please refer to the
latest update on respective stocks for the disclosure status in respect of those stocks. Angel Broking Pvt. Limited and its affiliates may have
investment positions in the stocks recommended in this report.