Market Outlook
October 08, 2015
Market Cues
Domestic Indices
Chg (%)
(Pts)
(Close)
Indian markets are expected to open in negative tracking the SGX Nifty and the
BSE Sensex
0.4
103
27,036
Asian cues.
Nifty
0.3
25
8,177
U.S. stocks fluctuated over the course of the trading session on Wednesday but
Mid Cap
0.1
10
11,056
largely managed to maintain a positive bias on the day. Market were positive on
Small Cap
0.4
45
11,344
Wall Street was partly in reaction to strength in the overseas markets, as stocks in
Bankex
0.0
3
20,113
Asia and Europe moved mostly higher. Trading activity was somewhat subdued,
however, as traders seemed somewhat reluctant to make any significant moves
Global Indices
Chg (%)
(Pts)
(Close)
amid a lack of major U.S. economic data.
Dow Jones
0.7
122
16,912
The European markets pared their gains in late trade Wednesday, but extended their
Nasdaq
0.9
43
4,791
recent winning streak to a fourth session. The recent gains continued to be fueled by
FTSE
0.2
10
6,336
strength in energy and mining stocks. Commodity prices have been rising since the
Nikkei
0.8
137
18,323
start of the trading week.
Hang Seng
3.1
684
22,516
The Indian markets posted modest gains on Wednesday as positive cues from Asia
Shanghai Com
0.5
15
3,053
and Europe coupled with hopes that the government would roll out a new goods
and services tax (GST) in 2016 helped investors signal off the IMF's revised
Advances / Declines
Bse
Nse
downward forecast for global economic growth.
Advances
1,678
1,019
News Analysis
Declines
1,072
482
IL&FS Transportation Networks Ltd - Rights Issue at `90/share
Unchanged
121
68
Sobha's Q2 sales bookings down 11% at `495cr
Detailed analysis on Pg2
Volumes (` Cr)
Investor’s Ready Reckoner
BSE
3,250
Key Domestic & Global Indicators
NSE
17,392
Stock Watch: Latest investment recommendations on 150+ stocks
Refer Pg4 onwards
Net Inflows (` Cr)
Net
Mtd
Ytd
FII
801
897
118,962
Top Picks
CMP
Target
Upside
MFs
157
634
79,639
Company
Sector
Rating
(`)
(`)
(%)
Axis Bank
Financials
Buy
497
701
41.1
Top Gainers
Price (`)
Chg (%)
ICICI Bank
Financials
Buy
283
370
30.8
Renuka
10
18.1
Power Grid
Power
Buy
132
170
28.4
Cipla
7
15.8
TCS
IT
Buy
2,655
3,168
19.3
Gati
158
12.2
Aurobindo Pharma Pharmaceuticals Accumulate
564
646
14.5
More Top Picks on Pg3
Rtnpower
7
10.9
Hindalco
82
9.6
Key Upcoming Events
Previous
Consensus
Date
Region
Event Description
Reading
Expectations
Top Losers
Price (`)
Chg (%)
Oct 08
UK
BOE Announces rates
0.50
0.50
Indiacem
80
(5.7)
Oct 09
India
Imports YoY%
(9.95)
--
Jindalstel
70
(5.1)
India
Exports YoY%
(20.66)
--
Jublfood
1,585
(4.9)
Oct 12
India
Industrial Production YoY
4.20
--
Hcltech
817
(4.2)
Oct 13
UK
CPI (YoY)
--
--
Recltd
272
(3.2)
Oct 14
India
Monthly Wholesale Prices YoY%
(4.95)
--
As on October 07, 2015
Market Outlook
October 08, 2015
IL&FS Transportation Networks Ltd - Rights Issue at `90/share
IL&FS Transportation Networks Ltd. (ITNL) has announced that it would be
pursuing a Rights issue of shares, to be priced at `90/share. The record date for
the issue is Oct 15, 2015. As per the issue, the existing shareholders in the
company will be entitled to subscribe to 1 additional share, for every 3 shares held
in the company. The issue will result in dilution of equity by 25% and raise `740cr
for the company.
Considering (1) rising debt to equity levels (4.21x as of 1QFY2016-end), (2) huge
order book of `157,908cr (as of 1QFY2016-end) to be executed over the next 24
months, and
(3) equity funding requirements of
~`557cr (excludes equity
requirement of recently won BOT projects), ITNL was left with few options, but to
purse this `740cr Rights Issue.
On successful completion of the issue, the consol. D/E ratio would decline to 3.7x.
We believe the issue will address only the near-term fund requirements of the
company while the company would still have to contemplate upon meeting its
longer term fund requirements. We wait to get more insights on Management’s
long-term strategy to grow its business. Till then, we continue to maintain our
NEUTRAL rating on the stock.
Sobha's Q2 sales bookings down 11% at `495cr
Sobha Ltd has reported over 11% decline in sales bookings at `495 cr during the
september quarter versus `559 cr in the year-ago period mainly due to lower
realisation. In terms of volume, sales bookings rose to 8,50,329 sq ft versus
8,33,991 sq ft during same quarer last year. However realisation price fell to
`5,822 per sq ft from `6,703 per sq ft in the year-ago period. Factors such as
falling interest rates, a growing economy, increased absorption in the commercial
real estate space and the approaching festive season are expected to be decisive
factors for an uptick in the real estate demand. The company is cautiously hopeful
of meeting its FY2016 guidance on expectation of revival in investor sentiments.
Economic and Political News
Govt should allow FDI in multi-brand through PPP: Assocham
Singareni coal production rises 27% in 6-month period
Govt to engage private cos for `1,438cr mechanisation at Paradip port
Corporate News
Punj Lloyd enters transmission, distribution segment
Redington to acquire Turkey based Linkplus
Snapdeal announces investment of $20 million in logistics start-up Gojavas
Market Outlook
October 08, 2015
Top Picks ★★★★★
Large Cap
Market Cap
CMP
Target
Upside
Company
Rationale
(` Cr)
(`)
(`)
(%)
Robust US sales along with the acquisations, will aid the growth
Aurobindo
43,476
745
872
17.1
and stable margins.
Healthy pace of branch expansion, backed by distribution
Axis Bank
1,18,156
497
701
41.1
network.
Robust franchise and capital adequacy position will help the
ICICI Bank
1,64,299
283
370
30.8
bank to outperform the industry average.
Back on the growth trend; expect a long term growth of 14% to
Infosys
2,60,278
1,133
1,306
15.3
be a US$20bn in FY2020.
Government thrust on Renewable sector and strong order book
Inox Wind
8,108
365
505
38.2
would drive future growth.
LICHF continues to grow its retail loan book at a healthy pace
LIC HFL
24,408
484
570
17.9
with improvement in asset quality.
Direct beneficiary of the huge investments lined up in the power
Power Grid
69,240
132
170
28.4
transmission sector.
Growth to pick up from 2HFY2017, attractive given the risk-
TCS
5,23,168
2,655
3,168
19.3
reward.
Tech Mahindra
54,259
564
646
14.5
Acquisitions, to drive growth, normalised valuations attractive.
An improving liability franchise, capital adequacy well above
Yes Bank
30,863
737
953
29.3
Basel III requirements and lowest NPA ratio in the industry.
Source: Company, Angel Research
Mid Cap
Market Cap
CMP
Target
Upside
Company
Rationale
(` Cr)
(`)
(`)
(%)
Bajaj Electricals
2,487
247
341
38.3
Visible turnaround in E&P business to drive the earnings.
Garware Wall Ropes
778
356
390
9.6
Higher exports & easing material prices to drive profitability.
Comfortable balance sheet to support strong growth; this
MBL Infrastructures
1,024
247
360
45.8
coupled with attractive valuation to lead to rerating.
New product introductions and increased sourcing by clients to
Minda Industries
802
506
652
28.9
enable outpace industry growth.
Strong brand & quality teaching with innovative technologies &
MT Educare
531
133
169
26.8
higher government educational spending to boost growth.
Earnings boost on back of stable material prices and favorable
Radico Khaitan
1,150
86
112
29.6
pricing environment. Valuation discount to peers provides
additional comfort.
Structural shift in the Lighting industry towards LED lighting will
Surya Roshni
576
131
183
39.3
drive growth.
Tree House
1,253
296
449
51.6
Robust expansion plan for pre-schools to drive growth.
Source: Company, Angel Research
Market Outlook
October 08, 2015
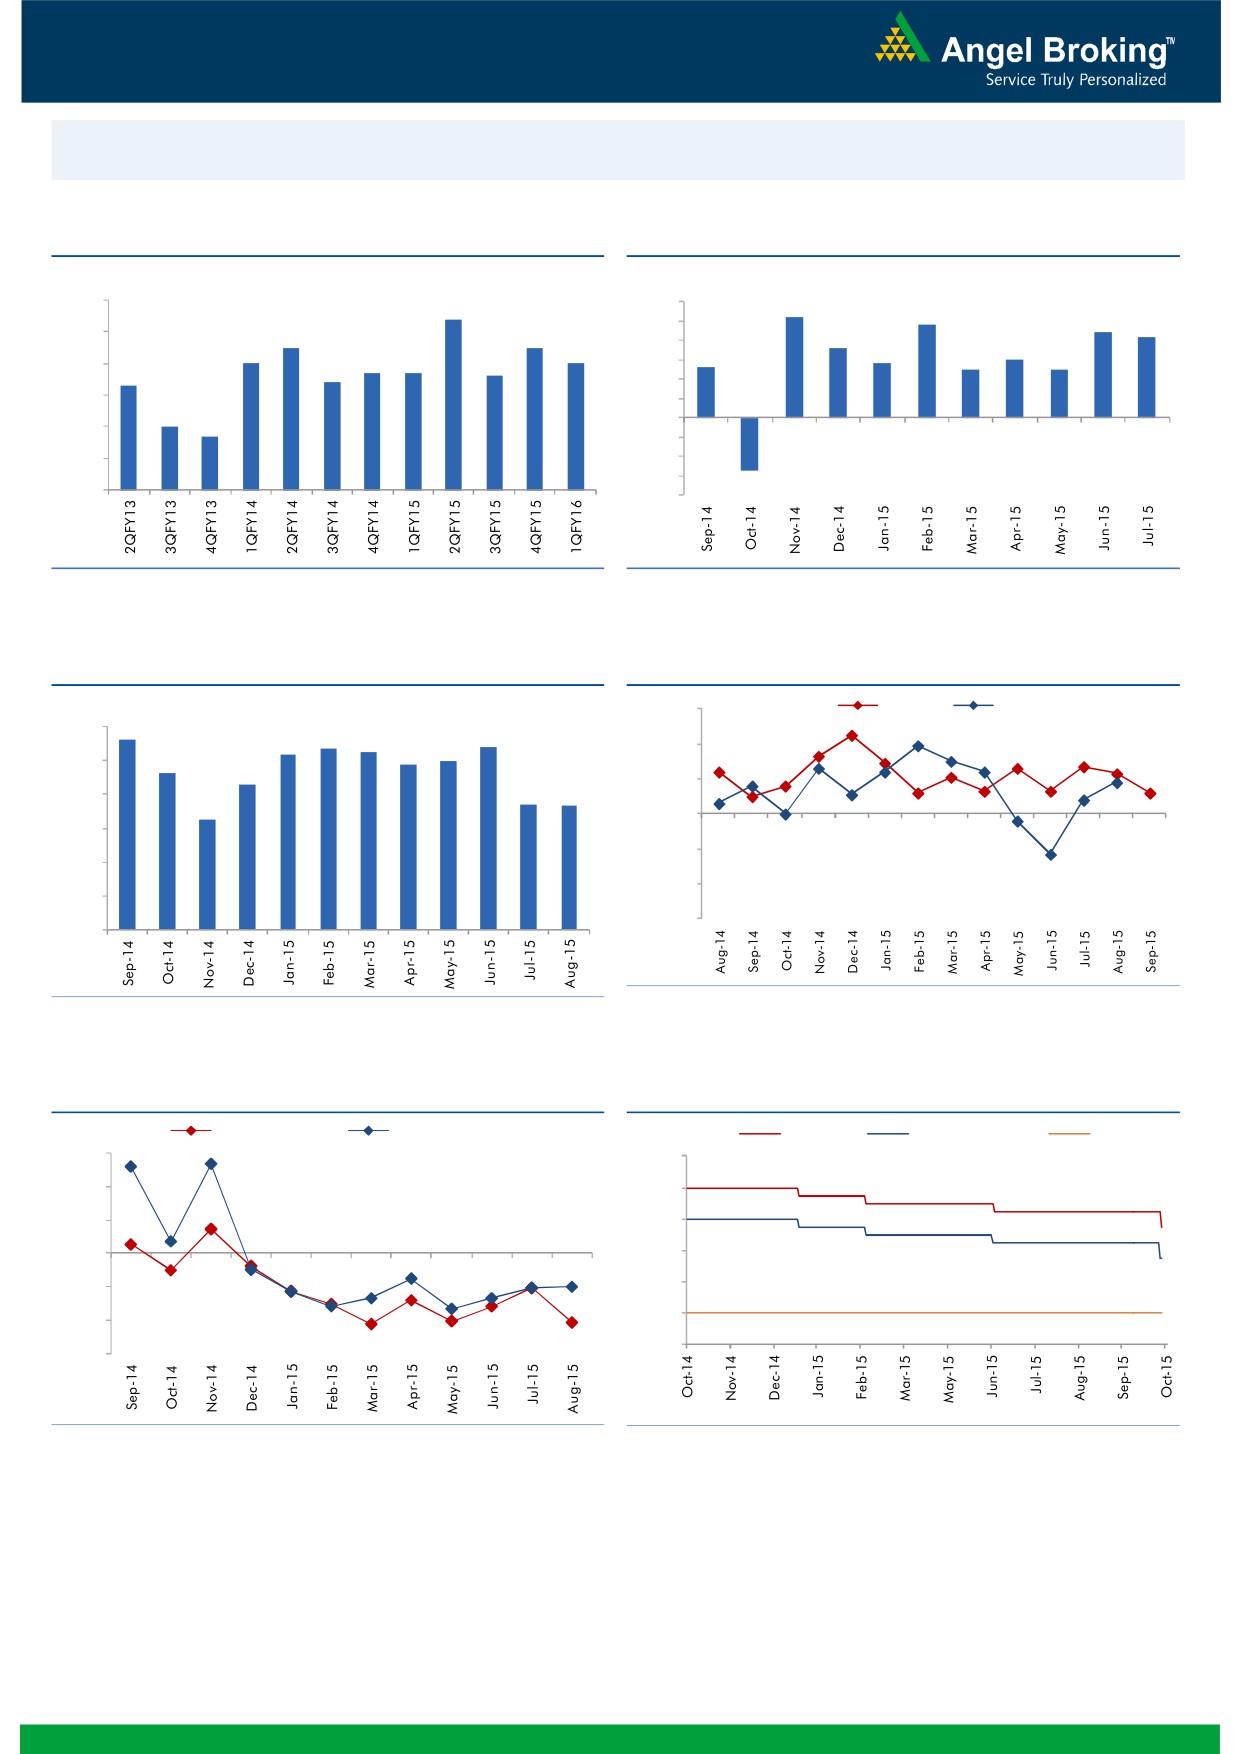
Macro watch
Exhibit 1: Quarterly GDP trends
Exhibit 2: IIP trends
(%)
(%)
9.0
8.4
6.0
5.2
4.8
5.0
4.4
4.2
8.0
7.5
7.5
3.6
4.0
3.0
7.0
7.0
2.6
2.8
6.7
6.7
2.5
2.5
7.0
6.4
6.6
3.0
6.3
2.0
6.0
1.0
5.0
4.7
-
5.0
(1.0)
4.0
(2.0)
(3.0)
3.0
(2.7)
(4.0)
Source: CSO, Angel Research
Source: MOSPI, Angel Research
Exhibit 3: Monthly CPI inflation trends
Exhibit 4: Manufacturing and services PMI
(%)
56.0
Mfg. PMI
Services PMI
6.0
5.6
5.4
5.2
5.4
5.3
4.9
5.0
54.0
5.0
4.6
4.3
52.0
3.7
3.7
4.0
3.3
50.0
3.0
48.0
2.0
46.0
1.0
44.0
-
Source: Market, Angel Research; Note: Level above 50 indicates expansion
Source: MOSPI, Angel Research
Exhibit 5: Exports and imports growth trends
Exhibit 6: Key policy rates
(%)
Exports yoy growth
Imports yoy growth
(%)
Repo rate
Reverse Repo rate
CRR
30.0
9.00
20.0
8.00
10.0
7.00
0.0
6.00
5.00
(10.0)
4.00
(20.0)
3.00
(30.0)
Source: Bloomberg, Angel Research
Source: RBI, Angel Research
Market Outlook
October 08, 2015
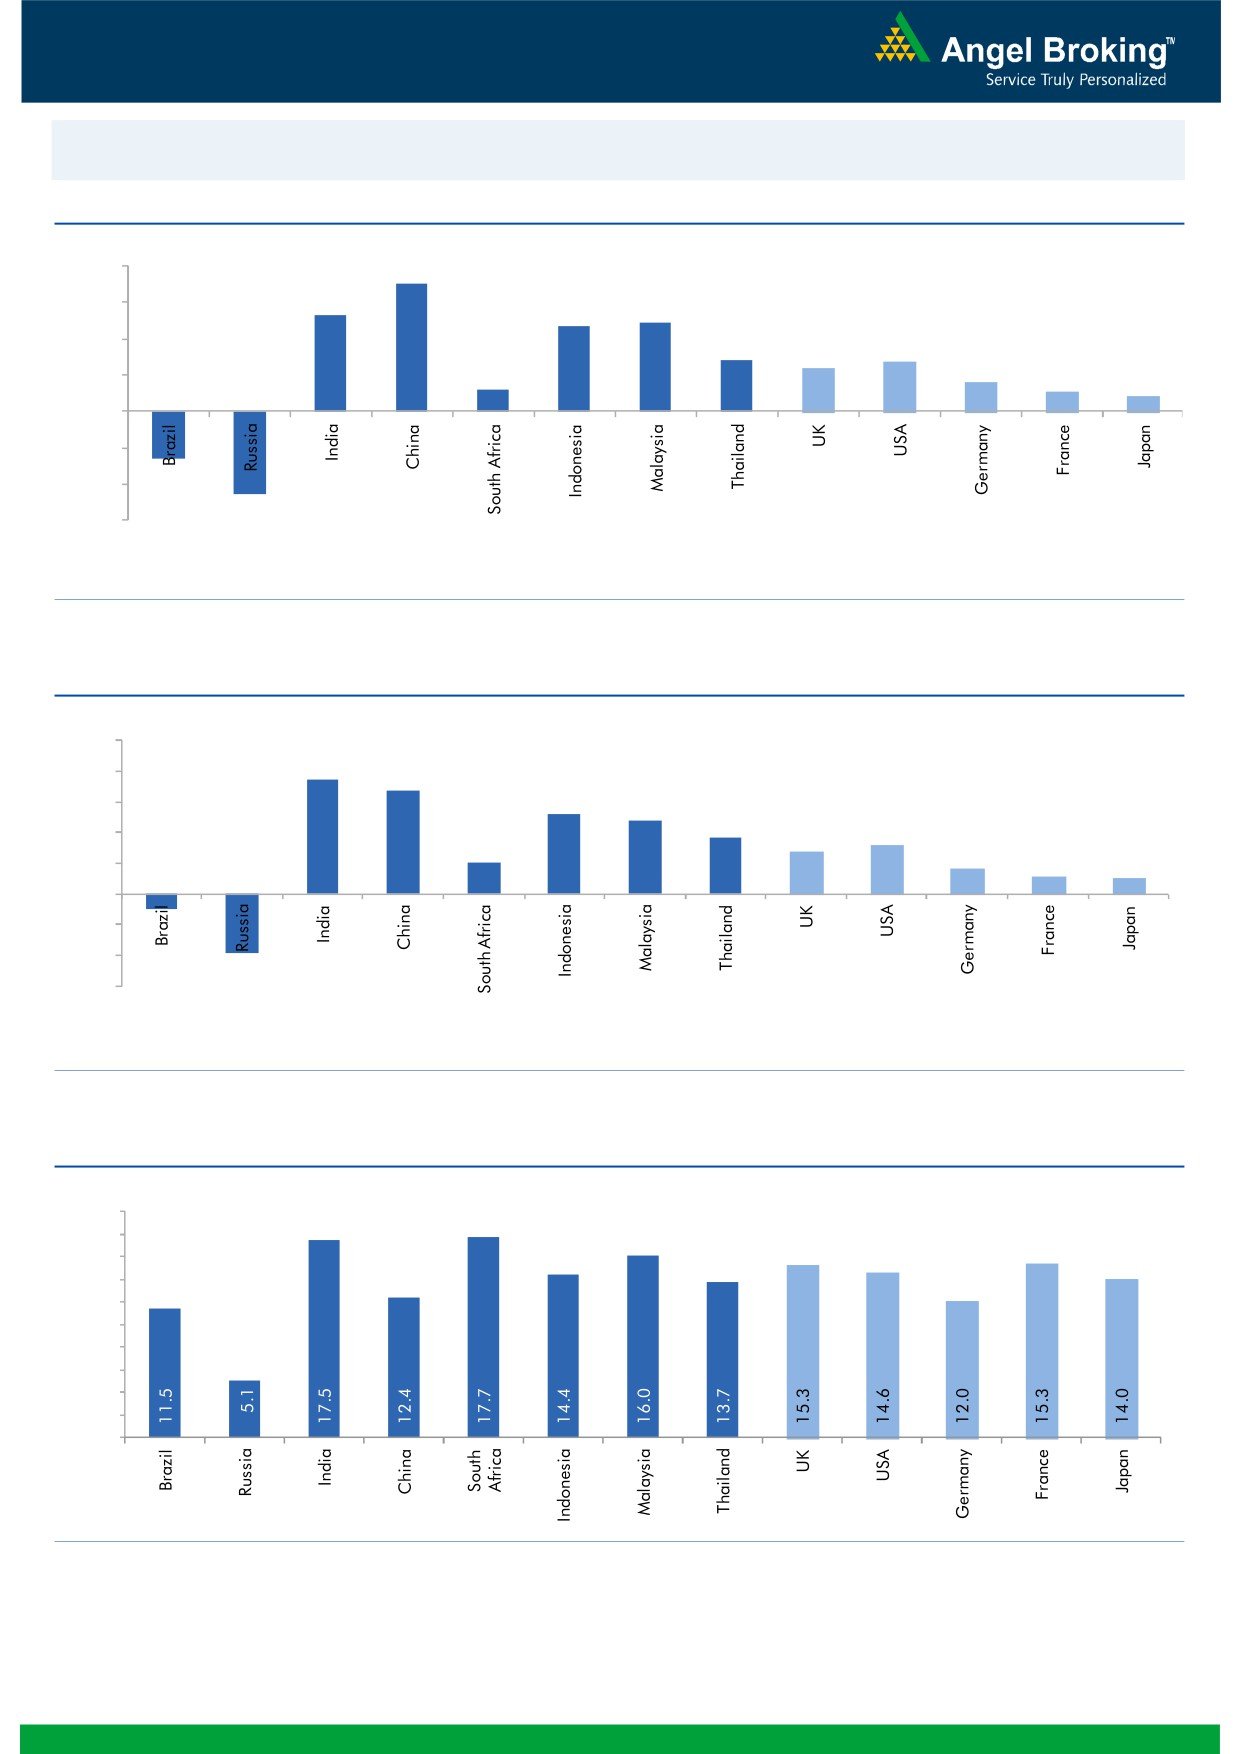
Global watch
Exhibit 1: Latest quarterly GDP Growth (%, yoy) across select developing and developed countries
(%)
8.0
7.0
6.0
5.3
4.9
4.7
4.0
2.8
2.7
2.4
1.6
2.0
1.2
1.1
0.8
-
(2.0)
(2.6)
(4.0)
(4.6)
(6.0)
Source: Bloomberg, Angel Research
Exhibit 2: 2015 GDP Growth projection by IMF (%, yoy) across select developing and developed countries
(%)
10.0
7.5
8.0
6.8
5.2
6.0
4.8
3.7
3.1
4.0
2.7
2.0
1.6
1.2
1.0
2.0
-
(2.0)
(4.0)
(1.0)
(3.8)
(6.0)
Source: IMF, Angel Research
Exhibit 3: One year forward P-E ratio across select developing and developed countries
(x)
20.0
18.0
16.0
14.0
12.0
10.0
8.0
6.0
4.0
2.0
-
Source: IMF, Angel Research
Market Outlook
October 08, 2015
Exhibit 4: Relative performance of indices across globe
Returns (%)
Country
Name of index
Closing price
1M
3M
1YR
Brazil
Bovespa
47,033
(4.4)
(15.1)
(19.5)
Russia
Micex
1,613
(5.2)
0.1
16.7
India
Nifty
7,951
(0.0)
(5.0)
(2.4)
China
Shanghai Composite
3,053
(1.0)
(28.6)
31.1
South Africa
Top 40
45,668
1.1
(2.7)
1.5
Mexico
Mexbol
42,735
(1.5)
(5.1)
(5.2)
Indonesia
LQ45
701
(8.3)
(15.9)
(19.6)
Malaysia
KLCI
1,629
1.0
(4.6)
(11.5)
Thailand
SET 50
868
(4.1)
(12.8)
(17.8)
USA
Dow Jones
16,472
(2.2)
(7.6)
(3.1)
UK
FTSE
6,130
0.8
(6.9)
(6.6)
Japan
Nikkei
17,725
(7.4)
(12.4)
9.4
Germany
DAX
9,553
(5.8)
(13.0)
2.0
France
CAC
4,459
(4.2)
(7.9)
3.9
Source: Bloomberg, Angel Research
Stock Watch
October 08, 2015
Company Name
Reco
CMP
Target
Mkt Cap
Sales ( Čcr )
OPM(%)
EPS (Č)
PER(x)
P/BV(x)
RoE(%)
EV/Sales(x)
(Č)
Price ( Č)
( Č cr )
FY16E FY17E
FY16E
FY17E
FY16E
FY17E
FY16E
FY17E
FY16E
FY17E
FY16E
FY17E
FY16E
FY17E
Agri / Agri Chemical
Rallis
Neutral
217
-
4,212
2,075
2,394
14.4
14.4
9.5
11.0
22.8
19.7
4.5
3.9
21.1
21.3
2.1
1.8
United Phosphorus
Accumulate
450
510
19,300
13,698
15,752
17.6
17.6
32.1
38.5
14.0
11.7
2.8
2.3
21.4
21.3
1.5
1.2
Auto & Auto Ancillary
Ashok Leyland
Accumulate
93
102
26,481
18,763
22,357
11.1
11.2
3.6
4.8
25.9
19.4
4.8
4.4
18.7
22.6
1.4
1.1
Bajaj Auto
Neutral
2,452
-
70,961
23,544
27,245
19.8
19.8
127.0
143.4
19.3
17.1
5.8
5.0
30.3
29.4
2.6
2.2
Eicher Motors
Buy
18,905
22,859
51,313
11,681
15,550
15.3
16.9
358.5
564.3
52.7
33.5
15.9
11.8
29.8
34.9
4.3
3.2
Hero Motocorp
Accumulate
2,539
2,672
50,705
28,500
32,764
14.1
14.3
146.9
167.0
17.3
15.2
6.5
5.6
37.8
36.5
1.6
1.4
L G Balakrishnan & Bros Neutral
439
-
689
1,254
1,394
11.6
11.8
35.9
41.7
12.2
10.5
1.7
1.5
13.5
13.8
0.7
0.6
Mahindra and Mahindra Accumulate
1,285
1,357
79,832
37,986
42,660
12.8
13.2
51.6
61.9
24.9
20.8
3.7
3.3
14.6
15.6
1.8
1.5
Maruti
Accumulate
4,371
4,960
132,053
58,102
68,587
16.7
16.9
182.0
225.5
24.0
19.4
4.8
4.1
19.9
21.0
2.0
1.7
Minda Industries
Buy
506
652
802
2,567
2,965
7.3
8.0
38.8
54.3
13.0
9.3
1.9
1.6
14.4
16.8
0.4
0.3
Rane Brake Lining
Buy
293
366
232
454
511
11.1
11.4
23.8
28.1
12.3
10.4
1.8
1.6
14.2
15.3
0.6
0.6
Setco Automotive
Neutral
231
-
616
594
741
12.7
13.7
8.4
15.8
27.4
14.6
2.9
2.5
10.4
16.9
1.5
1.2
Tata Motors
Accumulate
341
367
98,511
264,038
297,882
13.8
13.9
34.5
38.9
9.9
8.8
1.7
1.4
17.6
16.8
0.5
0.5
TVS Motor
Neutral
241
-
11,464
11,702
13,713
6.8
7.7
10.1
14.5
23.9
16.6
5.8
4.7
24.5
28.3
1.0
0.8
Amara Raja Batteries
Neutral
1,030
-
17,588
5,101
6,224
17.8
17.6
31.1
39.2
33.1
26.3
8.2
6.5
24.8
24.8
3.4
2.7
Exide Industries
Neutral
159
-
13,515
7,363
8,247
13.7
14.5
6.6
7.7
24.1
20.7
3.0
2.8
12.6
13.3
1.6
1.4
Apollo Tyres
Neutral
195
-
9,908
12,576
12,978
16.8
16.1
22.3
19.9
8.7
9.8
1.5
1.3
17.2
13.4
0.9
0.9
Ceat
Neutral
1,289
-
5,215
6,041
6,597
14.3
14.2
101.5
116.6
12.7
11.1
2.5
2.1
20.0
19.1
1.0
0.9
JK Tyres
Neutral
105
-
2,377
7,446
7,669
15.2
14.0
19.6
18.4
5.4
5.7
1.4
1.1
25.2
19.5
0.7
0.6
Swaraj Engines
Neutral
877
-
1,089
593
677
14.5
14.8
51.2
60.8
17.1
14.4
4.0
3.6
23.3
24.8
1.7
1.4
Subros
Neutral
78
-
466
1,268
1,488
11.6
11.9
3.7
6.6
21.0
11.8
1.4
1.3
6.8
11.4
0.7
0.6
Indag Rubber
Neutral
181
-
476
283
329
17.0
17.2
13.0
15.4
14.0
11.8
3.1
2.5
21.8
21.6
1.4
1.2
Capital Goods
ACE
Neutral
42
-
413
660
839
4.7
8.2
1.0
3.9
41.7
10.7
1.3
1.2
3.2
11.3
0.8
0.6
BEML
Neutral
1,268
-
5,281
3,277
4,006
6.0
8.9
29.2
64.3
43.4
19.7
2.4
2.2
5.7
11.7
1.7
1.3
BGR Energy
Neutral
115
-
828
3,615
3,181
9.5
9.4
16.7
12.4
6.9
9.3
0.6
0.6
10.0
7.0
0.6
0.8
BHEL
Neutral
203
-
49,613
33,722
35,272
10.8
11.7
10.5
14.2
19.3
14.3
1.4
1.3
7.0
9.0
1.6
1.5
Blue Star
Accumulate
342
387
3,080
3,649
4,209
5.0
5.9
9.2
14.7
37.4
23.3
6.8
6.4
9.1
17.5
0.9
0.8
Crompton Greaves
Accumulate
178
204
11,178
13,484
14,687
4.9
6.2
4.5
7.1
39.6
25.1
2.8
2.6
7.2
10.8
1.0
0.9
Inox Wind
Buy
365
505
8,108
4,980
5,943
17.0
17.5
26.6
31.6
13.7
11.6
4.1
3.0
35.0
30.0
1.8
1.4
Stock Watch
October 08, 2015
Company Name
Reco
CMP
Target
Mkt Cap
Sales ( Čcr )
OPM(%)
EPS (Č)
PER(x)
P/BV(x)
RoE(%)
EV/Sales(x)
(Č)
Price ( Č)
( Č cr )
FY16E
FY17E
FY16E
FY17E
FY16E
FY17E
FY16E
FY17E
FY16E
FY17E
FY16E
FY17E
FY16E
FY17E
Capital Goods
KEC International
Neutral
145
-
3,730
8,791
9,716
6.1
6.8
5.4
8.2
26.9
17.7
2.7
2.5
10.0
14.0
0.6
0.6
Thermax
Neutral
869
-
10,349
6,413
7,525
7.4
8.5
30.5
39.3
28.5
22.1
4.4
3.8
15.0
17.0
1.6
1.3
Cement
ACC
Accumulate
1,354
1,548
25,425
11,856
14,092
14.5
17.8
47.6
76.1
28.5
17.8
2.9
2.7
10.6
15.7
2.0
1.6
Ambuja Cements
Accumulate
209
233
32,442
10,569
12,022
20.7
22.2
8.7
10.7
24.0
19.5
3.1
2.9
13.0
15.2
2.7
2.3
India Cements
Buy
80
112
2,462
4,716
5,133
15.9
16.9
3.7
7.5
21.7
10.7
0.8
0.8
3.8
7.3
0.8
0.7
JK Cement
Buy
667
767
4,662
4,056
4,748
14.5
17.0
22.6
41.1
29.5
16.2
2.6
2.4
9.3
15.3
1.6
1.3
J K Lakshmi Cement
Accumulate
382
430
4,500
2,947
3,616
16.7
19.9
11.5
27.2
33.3
14.1
3.2
2.7
9.8
20.8
1.9
1.5
Mangalam Cements
Neutral
228
-
608
1,053
1,347
10.5
13.3
8.4
26.0
27.1
8.8
1.1
1.1
4.3
12.5
1.0
0.7
Orient Cement
Accumulate
169
183
3,462
1,854
2,524
21.2
22.2
7.7
11.1
22.0
15.2
3.2
2.7
13.3
15.7
2.6
1.8
Ramco Cements
Neutral
343
-
8,172
4,036
4,545
20.8
21.3
15.1
18.8
22.7
18.3
2.8
2.5
12.9
14.3
2.5
2.2
Shree Cement^
Neutral
12,505
-
43,566
7,150
8,742
26.7
28.6
228.0
345.5
54.8
36.2
8.1
6.8
15.7
20.3
5.8
4.7
UltraTech Cement
Buy
2,760
3,282
75,732
27,562
31,548
20.4
22.3
111.9
143.3
24.7
19.3
3.5
3.0
15.2
16.8
2.8
2.4
Construction
ITNL
Neutral
97
-
3,174
7,360
8,825
34.0
35.9
1.0
5.0
96.5
19.3
0.4
0.4
0.3
1.4
3.9
3.7
KNR Constructions
Neutral
604
-
1,699
915
1,479
14.3
13.9
20.3
37.2
29.8
16.2
2.7
2.4
9.6
15.6
2.0
1.3
Larsen & Toubro
Buy
1,544
2,013
143,727
68,920
82,446
10.9
11.5
57.0
73.0
27.1
21.2
2.5
2.3
13.6
15.5
2.3
1.9
Gujarat Pipavav Port
Neutral
205
-
9,898
721
784
53.1
53.6
8.2
9.1
24.9
22.5
4.0
3.3
20.0
18.3
13.3
11.8
MBL Infrastructures
Buy
247
360
1,024
2,313
2,797
12.2
14.6
19.0
20.0
13.0
12.4
1.4
1.3
11.3
10.6
1.2
1.0
Nagarjuna Const.
Neutral
75
-
4,189
7,892
8,842
8.3
9.1
2.4
5.3
31.4
14.2
1.3
1.2
4.2
8.6
0.8
0.7
PNC Infratech
Neutral
526
-
2,700
1,798
2,132
13.2
13.5
22.0
30.0
23.9
17.5
2.2
1.9
11.5
11.4
1.6
1.4
Simplex Infra
Neutral
320
-
1,585
6,241
7,008
10.4
10.7
20.0
36.0
16.0
8.9
1.3
1.2
6.8
11.1
0.8
0.6
Financials
Allahabad Bank
Neutral
78
-
4,454
8,438
9,521
2.8
2.8
21.9
27.0
3.6
2.9
0.4
0.3
10.2
11.5
-
-
Axis Bank
Buy
497
701
118,156
26,941
32,298
3.5
3.6
37.4
46.4
13.3
10.7
2.7
2.3
18.7
20.0
-
-
Bank of Baroda
Neutral
186
-
42,857
19,027
21,737
1.9
2.0
16.9
24.5
11.0
7.6
1.0
0.9
9.1
12.1
-
-
Bank of India
Neutral
146
-
9,688
16,438
18,706
1.9
2.0
19.2
40.9
7.6
3.6
0.4
0.4
4.5
9.1
-
-
Canara Bank
Neutral
300
-
16,276
15,491
17,269
2.0
2.0
61.6
70.9
4.9
4.2
0.6
0.5
10.5
11.1
-
-
Dena Bank
Neutral
41
-
2,306
3,498
3,977
2.1
2.3
7.8
10.7
5.3
3.9
0.4
0.4
6.5
8.4
-
-
Federal Bank
Neutral
65
-
11,191
3,527
4,135
3.0
3.1
5.2
6.7
12.5
9.7
1.3
1.2
10.8
12.7
-
-
HDFC
Neutral
1,276
-
201,367
10,883
12,799
3.5
3.4
43.0
50.6
29.7
25.2
5.9
5.3
25.9
26.7
-
-
HDFC Bank
Buy
1,088
1,255
274,005
38,059
46,851
4.4
4.5
50.0
62.7
21.8
17.4
3.8
3.3
18.8
20.2
-
-
Stock Watch
October 08, 2015
Company Name
Reco
CMP
Target
Mkt Cap
Sales ( Čcr )
OPM(%)
EPS (Č)
PER(x)
P/BV(x)
RoE(%)
EV/Sales(x)
(Č)
Price ( Č)
( Č cr )
FY16E
FY17E
FY16E
FY17E
FY16E
FY17E
FY16E
FY17E
FY16E
FY17E
FY16E
FY17E
FY16E
FY17E
Financials
ICICI Bank
Buy
283
370
164,299
35,810
41,871
3.4
3.5
22.0
26.2
12.9
10.8
2.3
1.9
15.0
15.6
-
-
IDBI Bank
Neutral
80
-
12,840
9,860
10,978
1.8
1.9
9.3
15.6
8.6
5.2
0.6
0.5
6.4
10.1
-
-
Indian Bank
Neutral
140
-
6,702
6,267
7,171
2.4
2.5
25.4
32.1
5.5
4.4
0.5
0.4
8.0
9.3
-
-
LIC Housing Finance
Buy
484
570
24,408
2,934
3,511
2.3
2.3
30.9
36.8
15.7
13.1
2.5
2.2
16.8
17.5
-
-
Oriental Bank
Neutral
145
-
4,336
7,730
8,595
2.4
2.5
38.8
47.4
3.7
3.1
0.3
0.3
8.6
9.8
-
-
Punjab Natl.Bank
Neutral
139
-
25,778
23,446
26,624
2.8
2.9
17.8
27.5
7.8
5.1
0.8
0.6
8.5
12.1
-
-
South Ind.Bank
Neutral
23
-
3,058
1,930
2,215
2.4
2.4
2.6
3.6
8.7
6.3
0.9
0.8
9.9
12.5
-
-
St Bk of India
Buy
243
307
184,124
83,847
96,307
2.8
2.8
20.1
25.1
12.1
9.7
1.3
1.2
11.5
13.1
-
-
Union Bank
Neutral
185
-
11,762
12,755
14,439
2.3
2.4
31.5
39.9
5.9
4.6
0.6
0.5
9.9
11.6
-
-
Vijaya Bank
Neutral
35
-
3,046
3,594
3,969
1.8
1.9
5.8
7.1
6.1
5.0
0.5
0.5
8.2
9.3
-
-
Yes Bank
Buy
737
953
30,863
7,204
9,078
3.2
3.2
57.8
69.5
12.8
10.6
2.3
1.9
19.6
22.6
-
-
FMCG
Asian Paints
Neutral
866
-
83,038
16,553
19,160
16.0
16.2
17.7
21.5
49.0
40.3
13.0
11.7
29.4
31.2
4.9
4.2
Britannia
Neutral
3,239
-
38,864
8,065
9,395
9.6
10.2
47.2
65.5
68.6
49.5
22.8
21.6
38.3
41.2
4.7
4.0
Colgate
Neutral
944
-
25,673
4,836
5,490
19.5
19.7
48.5
53.2
19.5
17.7
14.3
12.4
99.8
97.5
5.2
4.6
Dabur India
Neutral
280
-
49,129
9,370
10,265
17.1
17.2
7.3
8.1
38.1
34.5
11.5
9.4
33.7
30.6
5.2
4.7
GlaxoSmith Con*
Neutral
6,042
-
25,409
4,919
5,742
17.2
17.4
168.3
191.2
35.9
31.6
10.2
8.7
28.8
28.9
4.7
4.0
Godrej Consumer
Neutral
1,287
-
43,830
10,168
12,886
16.1
16.1
32.1
38.4
40.1
33.5
8.2
7.5
19.7
21.0
4.4
3.5
HUL
Neutral
824
-
178,249
34,940
38,957
17.5
17.7
20.8
24.7
39.6
33.4
44.1
35.2
110.5
114.2
4.9
4.4
ITC
Buy
346
409
277,958
41,068
45,068
37.8
37.4
13.9
15.9
24.9
21.8
8.3
7.3
34.1
33.8
6.4
5.8
Marico
Neutral
404
-
26,032
6,551
7,766
15.7
16.0
10.4
12.5
38.9
32.3
11.3
9.4
33.2
32.4
3.9
3.3
Nestle*
Neutral
6,349
-
61,211
11,291
12,847
22.2
22.3
158.9
184.6
40.0
34.4
20.9
18.8
55.0
57.3
5.3
4.6
Tata Global
Accumulate
133
144
8,390
8,635
9,072
9.8
9.9
6.5
7.6
20.5
17.5
2.0
2.0
6.8
7.4
0.9
0.9
IT
HCL Tech^
Buy
817
1,132
114,880
42,038
47,503
23.5
23.5
56.4
62.9
14.5
13.0
3.4
2.6
23.2
19.8
2.3
1.9
Infosys
Buy
1,133
1,306
260,278
60,250
66,999
28.0
28.0
58.3
63.7
19.4
17.8
4.1
3.5
20.9
19.7
3.6
3.1
TCS
Buy
2,655
3,168
523,168
108,420
123,559
28.8
28.7
127.2
143.9
20.9
18.5
8.3
7.7
39.9
41.8
4.4
3.8
Tech Mahindra
Accumulate
564
646
54,259
25,566
28,890
16.0
17.0
26.3
31.9
21.4
17.7
3.9
3.3
17.9
18.6
1.9
1.6
Wipro
Buy
589
719
145,501
52,414
58,704
23.7
23.8
38.4
42.3
15.3
13.9
3.0
2.7
19.5
18.0
2.4
1.9
Media
D B Corp
Accumulate
315
356
5,780
2,241
2,495
27.8
27.9
21.8
25.6
14.5
12.3
3.8
3.3
26.7
28.5
2.5
2.3
HT Media
Neutral
80
-
1,863
2,495
2,603
11.2
11.2
7.3
8.6
11.0
9.3
0.9
0.8
7.4
8.1
0.3
0.2
Stock Watch
October 08, 2015
Company Name
Reco
CMP
Target
Mkt Cap
Sales ( Čcr )
OPM(%)
EPS (Č)
PER(x)
P/BV(x)
RoE(%)
EV/Sales(x)
(Č)
Price ( Č)
( Č cr )
FY16E FY17E
FY16E
FY17E
FY16E
FY17E
FY16E
FY17E
FY16E
FY17E
FY16E
FY17E
FY16E
FY17E
Media
Jagran Prakashan
Accumulate
145
156
4,732
1,939
2,122
26.0
26.0
8.3
9.2
17.4
15.7
3.0
2.7
17.5
17.1
2.4
2.2
Sun TV Network
Neutral
353
-
13,907
2,779
3,196
70.2
70.5
22.8
27.3
15.5
12.9
3.8
3.5
26.7
28.3
4.8
4.1
Hindustan Media
Buy
241
292
1,766
920
1,031
20.0
20.0
19.2
20.9
12.5
11.5
2.1
1.8
16.4
15.3
1.5
1.3
Ventures
Metals & Mining
Coal India
Buy
346
400
218,799
72,015
78,415
21.2
21.5
21.7
25.3
16.0
13.7
5.4
5.3
33.1
39.1
2.3
2.1
Hind. Zinc
Neutral
148
-
62,408
15,258
16,495
44.2
45.6
17.6
19.2
8.4
7.7
1.3
1.2
15.9
15.3
1.8
1.3
Hindalco
Neutral
82
-
16,912
104,356
111,186
8.7
9.5
6.7
11.1
12.2
7.4
0.4
0.4
3.5
5.9
0.7
0.6
JSW Steel
Neutral
915
-
22,120
48,125
53,595
18.8
21.0
46.9
97.5
19.5
9.4
1.0
0.9
4.4
9.5
1.3
1.1
NMDC
Neutral
96
-
38,002
8,237
10,893
46.6
44.5
10.0
11.7
9.6
8.2
1.1
0.9
12.5
13.0
4.4
3.4
SAIL
Neutral
55
-
22,736
45,915
53,954
7.2
10.5
1.5
4.4
36.6
12.6
0.5
0.5
2.3
4.1
1.1
1.0
Vedanta
Neutral
91
-
26,905
71,445
81,910
26.2
26.3
12.9
19.2
7.1
4.7
0.5
0.4
7.2
8.9
0.8
0.6
Tata Steel
Neutral
237
-
22,998
136,805
149,228
11.3
11.9
26.4
36.8
9.0
6.4
0.7
0.7
6.0
8.0
0.7
0.6
Oil & Gas
Cairn India
Neutral
167
-
31,357
11,323
12,490
49.4
51.0
20.7
20.7
8.1
8.1
0.5
0.5
6.4
6.1
1.8
1.2
GAIL
Neutral
313
-
39,722
64,856
70,933
9.1
9.6
24.0
28.9
13.1
10.9
1.1
1.0
8.8
9.6
0.8
0.7
ONGC
Neutral
257
-
219,791
154,564
167,321
36.8
37.4
28.6
32.5
9.0
7.9
1.1
1.1
12.7
13.5
1.6
1.5
Petronet LNG
Accumulate
185
210
13,856
39,007
40,785
3.8
4.2
9.2
11.0
20.2
16.9
2.3
2.1
11.6
12.7
0.4
0.4
Indian Oil Corp
Accumulate
398
455
96,608
359,607
402,760
5.9
6.1
42.5
48.7
9.4
8.2
1.3
1.1
14.1
14.4
0.4
0.3
Reliance Industries
Neutral
914
-
295,944
313,085
362,904
13.1
13.8
78.4
92.9
11.7
9.8
1.2
1.1
10.8
11.6
1.4
1.2
Pharmaceuticals
Alembic Pharma
Neutral
729
-
13,740
2,601
3,115
21.2
20.2
20.8
23.9
35.0
30.5
11.3
8.5
37.2
31.8
5.3
4.4
Aurobindo Pharma
Buy
745
872
43,476
14,923
17,162
23.0
23.0
38.2
43.6
19.5
17.1
6.0
4.5
36.0
30.2
3.3
2.8
Aventis*
Neutral
4,035
-
9,293
2,156
2,455
15.1
16.8
109.7
133.9
36.8
30.1
5.0
4.1
18.4
22.5
4.0
3.3
Cadila Healthcare
Neutral
424
-
43,361
10,224
11,840
20.0
21.0
71.0
85.6
6.0
5.0
1.6
1.3
30.1
28.5
4.3
3.6
Cipla
Neutral
680
-
54,623
14,359
16,884
21.3
19.7
28.4
30.5
24.0
22.3
4.2
3.6
19.3
17.5
3.8
3.2
Dr Reddy's
Neutral
4,196
-
71,552
18,213
21,214
22.6
22.7
163.0
192.5
25.7
21.8
5.3
4.4
22.5
20.0
3.9
3.3
Dishman Pharma
Neutral
371
-
2,995
1,716
1,888
20.2
20.2
16.3
21.6
22.8
17.2
2.1
1.9
9.7
11.7
1.9
1.6
GSK Pharma*
Neutral
3,379
-
28,623
2,870
3,158
20.0
22.1
59.5
68.3
56.8
49.5
16.8
17.2
28.5
34.3
9.5
8.7
Indoco Remedies
Neutral
312
-
2,874
1,088
1,262
18.2
18.2
13.1
15.5
23.8
20.1
4.7
3.9
21.2
21.1
2.7
2.3
Ipca labs
Accumulate
714
800
9,007
3,507
4,078
17.6
18.6
25.8
32.0
27.7
22.3
3.6
3.1
13.8
14.9
2.8
2.4
Lupin
Neutral
2,067
-
93,018
14,864
17,244
26.9
26.9
62.1
71.1
33.3
29.1
8.1
6.4
27.4
24.6
6.0
5.0
Sun Pharma
Neutral
926
-
222,860
28,163
32,610
25.8
30.7
17.4
26.9
53.2
34.4
5.1
4.4
13.0
16.6
7.4
6.2
Stock Watch
October 08, 2015
Company Name
Reco
CMP
Target
Mkt Cap
Sales ( Čcr )
OPM(%)
EPS (Č)
PER(x)
P/BV(x)
RoE(%)
EV/Sales(x)
(Č)
Price ( Č)
( Č cr )
FY16E FY17E
FY16E
FY17E
FY16E
FY17E
FY16E
FY17E
FY16E
FY17E
FY16E
FY17E
FY16E
FY17E
Power
Tata Power
Neutral
70
-
19,027
35,923
37,402
22.6
22.8
4.1
5.2
17.4
13.7
1.3
1.2
7.5
9.3
1.5
1.4
NTPC
Buy
128
157
105,336
87,064
98,846
23.5
23.5
11.7
13.2
10.9
9.7
1.2
1.1
11.4
12.1
2.2
2.0
Power Grid
Buy
132
170
69,240
20,702
23,361
86.7
86.4
12.1
13.2
11.0
10.0
1.6
1.4
15.6
15.1
8.3
7.7
Telecom
Bharti Airtel
Neutral
343
-
137,231
101,748
109,191
32.1
31.7
12.0
12.5
28.6
27.5
2.0
1.8
6.9
6.7
2.0
1.8
Idea Cellular
Neutral
159
-
57,216
34,282
36,941
32.0
31.5
5.9
6.2
26.9
25.6
2.5
2.2
9.9
9.3
2.2
2.1
zOthers
Abbott India
Neutral
5,800
-
12,324
2,715
3,153
14.5
14.1
134.3
152.2
43.2
38.1
10.8
8.9
27.4
25.6
4.3
3.6
Bajaj Electricals
Buy
247
341
2,487
4,719
5,287
5.2
5.8
8.6
12.7
28.8
19.5
3.3
2.9
11.4
14.8
0.5
0.5
Finolex Cables
Neutral
235
-
3,600
2,728
3,036
10.8
11.0
14.4
16.8
16.3
14.1
2.5
2.2
15.2
15.3
1.1
0.9
Goodyear India*
Buy
568
655
1,309
1,953
1,766
12.4
12.0
67.4
59.6
8.4
9.5
2.1
1.8
27.7
20.2
0.5
0.4
Hitachi
Neutral
1,469
-
3,994
1,806
2,112
9.0
9.2
28.6
29.1
51.4
50.5
12.8
10.3
28.1
22.6
2.3
1.9
Jyothy Laboratories
Neutral
318
-
5,758
1,620
1,847
11.5
11.5
7.3
8.5
43.6
37.5
5.6
5.2
13.3
14.4
3.4
2.9
MRF
Neutral
42,515
-
18,031
20,727
14,841
19.3
18.6
4,905.8
3,351.9
8.7
12.7
2.8
2.3
37.6
19.6
0.8
1.1
Page Industries
Neutral
14,156
-
15,789
1,929
2,450
19.8
20.1
229.9
299.0
61.6
47.4
27.2
18.9
52.1
47.1
8.2
6.4
Relaxo Footwears
Neutral
548
-
6,574
1,767
2,152
12.3
12.5
19.3
25.1
28.5
21.9
7.0
5.4
27.7
27.8
3.8
3.1
Siyaram Silk Mills
Buy
1,002
1,221
939
1,653
1,873
11.7
12.2
99.3
122.1
10.1
8.2
1.8
1.5
19.5
20.2
0.7
0.6
Styrolution ABS India*
Neutral
755
-
1,328
1,271
1,440
8.6
9.2
32.0
41.1
23.6
18.4
2.4
2.2
10.7
12.4
1.0
0.9
Tree House
Buy
296
449
1,253
259
324
56.8
56.8
17.0
21.7
17.4
13.7
1.8
1.6
10.1
11.5
4.8
4.0
TVS Srichakra
Buy
2,644
3,210
2,024
2,127
2,388
15.2
14.9
237.7
267.5
11.1
9.9
4.7
3.4
51.7
39.8
1.0
0.9
HSIL
Accumulate
277
302
2,004
2,182
2,404
16.3
16.5
15.8
18.9
17.6
14.7
1.4
1.3
8.4
9.4
1.3
1.1
Kirloskar Engines India
Neutral
291
-
4,215
2,634
3,252
10.1
12.0
10.9
17.4
26.7
16.7
3.0
2.7
11.4
16.8
1.2
0.9
Ltd
M M Forgings
Buy
539
797
650
563
671
22.1
22.9
51.0
66.5
10.6
8.1
2.2
1.8
23.1
24.1
1.3
1.1
Banco Products (India)
Neutral
126
-
899
1,208
1,353
11.0
12.3
10.8
14.5
11.7
8.7
1.3
1.2
11.9
14.5
0.7
0.6
Competent Automobiles Neutral
145
-
89
1,007
1,114
3.1
3.1
23.7
28.2
6.1
5.1
0.9
0.8
13.9
14.6
0.1
0.1
Nilkamal
Neutral
966
-
1,442
1,948
2,147
10.6
10.3
60.0
67.0
16.1
14.4
2.5
2.2
16.8
16.1
0.8
0.7
Visaka Industries
Buy
143
166
228
1,158
1,272
8.6
9.5
23.7
32.7
6.1
4.4
0.6
0.6
10.1
12.5
0.4
0.3
Transport Corporation of
Buy
250
293
1,902
2,830
3,350
8.8
9.0
14.4
18.3
17.4
13.7
2.7
2.3
15.4
17.1
0.8
0.7
India
Elecon Engineering
Accumulate
77
87
844
1,452
1,596
14.0
14.7
4.4
6.2
17.5
12.4
1.5
1.3
8.6
11.2
0.9
0.7
Surya Roshni
Buy
131
183
576
2,992
3,223
8.3
8.5
14.7
18.3
8.9
7.2
0.8
0.8
9.8
11.0
0.5
0.4
MT Educare
Buy
133
169
531
286
366
18.3
17.7
7.7
9.4
17.3
14.2
3.6
3.2
20.2
21.1
1.8
1.3
Stock Watch
October 08, 2015
Company Name
Reco
CMP
Target Mkt Cap
Sales ( Čcr )
OPM(%)
EPS (Č)
PER(x)
P/BV(x)
RoE(%)
EV/Sales(x)
(Č)
Price ( Č)
( Č cr )
FY16E FY17E FY16E FY17E FY16E FY17E FY16E FY17E FY16E FY17E FY16E FY17E FY16E FY17E
zOthers
Radico Khaitan
Buy
86
112
1,150
1,565
1,687
11.9
12.4
5.4
6.6
16.0
13.1
1.3
1.2
8.0
9.0
1.2
1.2
Garware Wall Ropes
Accumulate
356
390
778
875
983
10.4
10.6
23.1
27.8
15.4
12.8
2.2
1.9
14.1
14.8
0.9
0.8
Wonderla Holidays
Accumulate
298
322
1,685
206
308
44.0
43.6
9.0
12.9
33.1
23.1
4.5
4.1
13.7
17.8
8.1
5.4
Linc Pen & Plastics
Buy
157
185
232
340
371
8.3
8.9
10.8
13.2
14.5
11.9
2.3
2.0
16.0
17.1
0.7
0.7
The Byke Hospitality
Accumulate
163
181
653
222
287
20.5
20.5
5.6
7.6
28.9
21.6
5.4
4.5
18.9
20.8
3.0
2.3
Source: Company, Angel Research; Note: *December year end; #September year end; &October year end; Price as on October 07, 2015
Market Outlook
October 08, 2015
Research Team Tel: 022 - 39357800
DISCLAIMER
Angel Broking Private Limited (hereinafter referred to as “Angel”) is a registered Member of National Stock Exchange of India Limited,
Bombay Stock Exchange Limited and Metropolitian Stock Exchange of India Limited. It is also registered as a Depository Participant with
CDSL and Portfolio Manager with SEBI. It also has registration with AMFI as a Mutual Fund Distributor. Angel Broking Private Limited is a
registered entity with SEBI for Research Analyst in terms of SEBI (Research Analyst) Regulations, 2014 vide registration number
INH000000164. Angel or its associates has not been debarred/ suspended by SEBI or any other regulatory authority for accessing
/dealing in securities Market. Angel or its associates including its relatives/analyst do not hold any financial interest/beneficial ownership
of more than 1% in the company covered by Analyst. Angel or its associates/analyst has not received any compensation / managed or co
-managed public offering of securities of the company covered by Analyst during the past twelve months. Angel/analyst has not served as
an officer, director or employee of company covered by Analyst and has not been engaged in market making activity of the company
covered by Analyst.
This document is solely for the personal information of the recipient, and must not be singularly used as the basis of any investment
decision. Nothing in this document should be construed as investment or financial advice. Each recipient of this document should make
such investigations as they deem necessary to arrive at an independent evaluation of an investment in the securities of the companies
referred to in this document (including the merits and risks involved), and should consult their own advisors to determine the merits and
risks of such an investment.
Reports based on technical and derivative analysis center on studying charts of a stock's price movement, outstanding positions and
trading volume, as opposed to focusing on a company's fundamentals and, as such, may not match with a report on a company's
fundamentals.
The information in this document has been printed on the basis of publicly available information, internal data and other reliable sources
believed to be true, but we do not represent that it is accurate or complete and it should not be relied on as such, as this document is for
general guidance only. Angel Broking Pvt. Limited or any of its affiliates/ group companies shall not be in any way responsible for any
loss or damage that may arise to any person from any inadvertent error in the information contained in this report. Angel Broking Pvt.
Limited has not independently verified all the information contained within this document. Accordingly, we cannot testify, nor make any
representation or warranty, express or implied, to the accuracy, contents or data contained within this document. While Angel Broking
Pvt. Limited endeavors to update on a reasonable basis the information discussed in this material, there may be regulatory, compliance,
or other reasons that prevent us from doing so.
This document is being supplied to you solely for your information, and its contents, information or data may not be reproduced,
redistributed or passed on, directly or indirectly.
Neither Angel Broking Pvt. Limited, nor its directors, employees or affiliates shall be liable for any loss or damage that may arise from or
in connection with the use of this information.
Note: Please refer to the important ‘Stock Holding Disclosure' report on the Angel website (Research Section). Also, please refer to the
latest update on respective stocks for the disclosure status in respect of those stocks. Angel Broking Pvt. Limited and its affiliates may have
investment positions in the stocks recommended in this report.