Market Outlook
December 7, 2015
Market Cues
Domestic Indices
Chg (%)
(Pts)
(Close)
Indian markets are expected to open on a Positive note tracking the SGX Nifty and
BSE Sensex
(1.0)
(249)
25,638
most Asian markets.
Nifty
(1.0)
(82)
7,782
US markets moved upwards during Friday’s session after the sell-off that was seen in
Mid Cap
(1.0)
(116)
10,935
prior session. The rally was partly due to bargain hunting and also due to stronger
Small Cap
(0.6)
(75)
11,558
non-farm payroll employment numbers reported by the Labor Department which
Bankex
(1.1)
(213)
19,325
increased by 211,000 jobs in November against estimates of 190,000.
The European markets ended Friday’s session on a mixed note as the markets
Global Indices
Chg (%)
(Pts)
(Close)
continued to struggle after the European Central Bank's (ECB) failed to announce
aggressive stimulus measures that left investors disappointed.
Dow Jones
2.1
370
17,848
Nasdaq
2.1
105
5,142
Tracing the overall weakness in global markets post ECB policy and impending rate
hike in the US, the Indian market closed on a negative note on Friday.
FTSE
(0.6)
(37)
6,238
Nikkei
(2.2)
(435)
19,504
News & Result Analysis
Hang Seng
(0.8)
(181)
22,236
In a bid to gain domestic passenger vehicle market share, Tata Motors aims to
Shanghai Com
(1.7)
(60)
3,525
triple sales network, fill product gaps
NMDC slashes iron ore price by `300 to `1,800 per tonne
Detailed analysis on Pg2
Advances / Declines
BSE
NSE
Advances
1,148
532
Investor’s Ready Reckoner
Declines
1,610
996
Key Domestic & Global Indicators
Unchanged
166
63
Stock Watch: Latest investment recommendations on 150+ stocks
Refer P4 onwards
Volumes (` Cr)
Top Picks
BSE
2,990
CMP
Target
Upside
Company
Sector
Rating
NSE
16,883
(`)
(`)
(%)
Axis Bank
Financials
Buy
460
630
36.8
HCL Tech
IT
Buy
836
1,132
35.4
Net Inflows (` Cr)
Net
Mtd
Ytd
ICICI Bank
Financials
Buy
261
357
36.4
FII
235
90
(22,359)
Ashok Leyland
Automobiles
Buy
90
111
22.9
MFs
302
382
57,277
Larsen & Toubro
Construction
Buy
1,341
1,646
22.7
More Top Picks on Pg3
Top Gainers
Price (`)
Chg (%)
Key Upcoming Events
Bayercrop
3,600
5.1
Previous
Consensus
Date
Region
Event Description
Star
365
4.9
Reading
Expectations
Thermax
886
4.1
Dec 8
UK
Industrial Production (YoY) (Oct)
1.1
1.2
China
Exports YoY% (Nov)
(6.9)
(5.0)
Sunpharma
756
4.0
Eurozone
Euro-Zone GDP s.a. (QoQ)
.30
.30
Nationalum
41
3.8
Dec 9
China
Consumer Price Index (YoY) (Nov)
1.3
1.4
Top Losers
Price (`)
Chg (%)
Gmrinfra
15
(14.6)
Jklakshmi
327
(5.8)
Fsl
41
(4.9)
Justdial
827
(4.8)
Iifl
195
(3.9)
As on December 04, 2015
Market Outlook
December 7, 2015
In a bid to gain domestic passenger vehicle market share, Tata
Motors aims to triple sales network, fill product gaps
Tata Motors has lined up a slew of initiatives, including tripling of sales network,
filling the gaps in its product portfolio, improving manufacturing processes and
brand image, as part of its strategy to be one of the leading players in the Indian
passenger vehicle segment. The company is also introducing measures to cut costs
at all levels is also working on improving manufacturing quality as well as
workforce efficiency at multiple levels.
As part of its strategy to be present in every nook and corner of the country, the
company plans to triple its sales network in the next four years. Tata Motors, which
plans to launch two new products each year till 2020, is also looking to bolster its
product portfolio by filling in gaps by introducing various models.
The Firm is also looking to enhance its brand appeal by bringing in the "cool"
quotient to connect with youngsters and the signing of soccer superstar Lionel
Messi as the company's brand ambassador is "a step in that direction". Tata Motors
sales grew 14.8% in 1HFY2016 outpacing the industry growth of around 6.5%.
With new car launches, it aims to gain market share further. We currently have
Neutral rating on the stock.
NMDC slashes iron ore price by `300 to `1,800 per tonne
NMDC has slashed prices of iron ore by `300 to `1,800 per tonne for iron ore
lumps. At the same time, the prices of iron ore fines have been maintained at
`1,560 per tonne. The management has cited subdued market condition for the
reduction in iron ore lump prices. NMDC’s sales for FY2016 YTD stood at
17.7million tones. NMDC has reduced prices by ~58% since January 2015 and
this is largely owing to declining sales and overall weakness seen in the global iron
ore prices. Lower prices of imports along with easing of domestic supply
constraints from gradual re-opening of mines in Karnataka have put pressure on
prices. This environment is likely to persist in the near term. We maintain our
Neutral view on the stock.
Economic and Political News
Hike aluminium import duty to 7.5%: Mines Ministry
Agriculture Ministry proposes further 5% hike in import duty of edible oil
Govt to unveil a National Chemical Policy soon
Cera plans enhanced presence in central India
Tata Sons to acquire additional 0.22% stake in Titan
Essar oil fixes floor for delisting at `146.05
Market Outlook
December 7, 2015
Top Picks ★★★★★
Large Cap
Market Cap
CMP
Target
Upside
Company
Rationale
(` Cr)
(`)
(`)
(%)
To outpace battery industry growth due to better technological
Amara Raja Batteries
14,411
844
1,040
23.3
products leading to market share gains in both the automotive
OEM and replacement segments.
Earnings to grow strongly given the MHCV cyclical upturn.
Ashok Leyland
25,712
90
111
22.9
Focus on exports and LCV's provides additional growth
avenue.
Healthy pace of branch expansion, backed by distribution
Axis Bank
1,09,498
460
630
36.8
network, will be the driving force for the bank’s retail business
and overall earnings.
The stock is trading at attractive valuations and is factoring all
HCL Tech
1,17,811
836
1,132
35.4
the bad news.
Strong visibility for a robust 20% earnings trajectory, coupled
HDFC Bank
2,67,488
1,060
1,262
19.1
with high quality of earnings on account of high quality retail
business and strategic focus on highly rated corporates.
Due to its robust franchise and capital adequacy position, the
bank is well positioned to grow by at least a few percentage
ICICI Bank
1,51,950
261
357
36.4
points higher than the average industry growth rate from a
structural point of view.
Back on the growth trend, expect a long term growth of 14%
Infosys
2,40,674
1,048
1,306
24.6
to be a US$20bn in FY2020.
Well positioned to benefit from such expected gradual
recovery in the overall domestic capex cycle, given its presence
Larsen & Toubro
1,24,871
1,341
1,646
22.7
across various infrastructure segments, its execution
capabilities, and its strong balance sheet.
LICHF continues to grow its retail loan book at a healthy pace
with improvement in asset quality. We expect the company to
LIC Housing Finance
23,106
458
571
24.7
post a healthy loan book which is likely to reflect in a strong
earnings growth.
Source: Company, Angel Research
Mid Cap
Market Cap
CMP
Target
Upside
Company
Rationale
(` Cr)
(`)
(`)
(%)
Favourable outlook for the AC industry to augur well for
Cooling products business which is out pacing the market
Blue Star
3,191
355
429
20.9
growth. EMPPAC division's profitability to improve once
operating environment turns around.
Change in business focus towards high-margin chronic &
Ipca labs
9,729
771
900
16.7
lifestyle segments and increasing penetration in Europe and
US
Economic recovery to have favourable impact on advertising &
circulation revenue growth. Further, the acquisition of a radio
Jagran Prakashan
4,850
148
169
13.9
business (Radio City) would also boost the company's revenue
growth.
Strong brand & quality teaching with innovative technologies &
MT Educare
563
141
169
19.5
higher government educational spending to boost growth
Earnings boost on back of stable material prices and
Radico Khaitan
1,434
108
156
44.7
favourable pricing environment. Valuation discount to peers
provides additional comfort
Strong brands and distribution network would boost growth
Siyaram Silk Mills
1,005
1,072
1,145
6.8
going ahead. Stock currently trades at an inexpensive
valuation.
Structural shift in the Lighting industry towards LED lighting will
Surya Roshni
595
136
183
34.7
drive growth.
Source: Company, Angel Research
Market Outlook
December 07, 2015
Key Upcoming Events
Global economic events release calendar
Date
Time
Country
Event Description
Unit
Period
Bloomberg Data
Last Reported Estimated
Dec 8, 2015
3:00PM
UK
Industrial Production (YoY)
% Change
Oct
1.10
1.20
China
Exports YoY%
% Change
Nov
(6.90)
(5.00)
3:30PM
Euro Zone
Euro-Zone GDP s.a. (QoQ)
% Change
3Q P
0.30
0.30
Dec 9, 2015
7:00AM
China
Consumer Price Index (YoY)
% Change
Nov
1.30
1.40
Dec 10, 2015
7:00PM
US
Initial Jobless claims
Thousands
Dec 5
269.00
268.00
5:30PM
UK
BOE Announces rates
% Ratio
Dec 10
0.50
0.50
India
Imports YoY%
% Change
Nov
(21.15)
--
India
Exports YoY%
% Change
Nov
(17.53)
--
Dec 11, 2015
5:30PM
India
Industrial Production YoY
% Change
Oct
3.60
--
Dec 12, 2015
11:00AM
China
Industrial Production (YoY)
% Change
Nov
5.60
5.70
Dec 14, 2015
12:00PM
India
Monthly Wholesale Prices YoY%
% Change
Nov
(3.81)
--
Dec 15, 2015
7:00PM
US
Consumer price index (mom)
% Change
Nov
0.20
--
3:00PM
UK
CPI (YoY)
% Change
Nov
(0.10)
--
Dec 16, 2015
7:00PM
US
Housing Starts
Thousands
Nov
1,060.00
1,125.00
7:00PM
US
Building permits
Thousands
Nov
1,161.00
1,143.00
2:00PM
Germany
PMI Services
Value
Dec P
55.60
--
2:00PM
Germany
PMI Manufacturing
Value
Dec P
52.90
--
3:00PM
UK
Jobless claims change
% Change
Nov
3.30
--
3:30PM
Euro Zone
Euro-Zone CPI (YoY)
%
Nov F
0.10
--
7:45PM
US
Industrial Production
%
Nov
(0.15)
--
Source: Bloomberg, Angel Research
Market Outlook
December 7, 2015
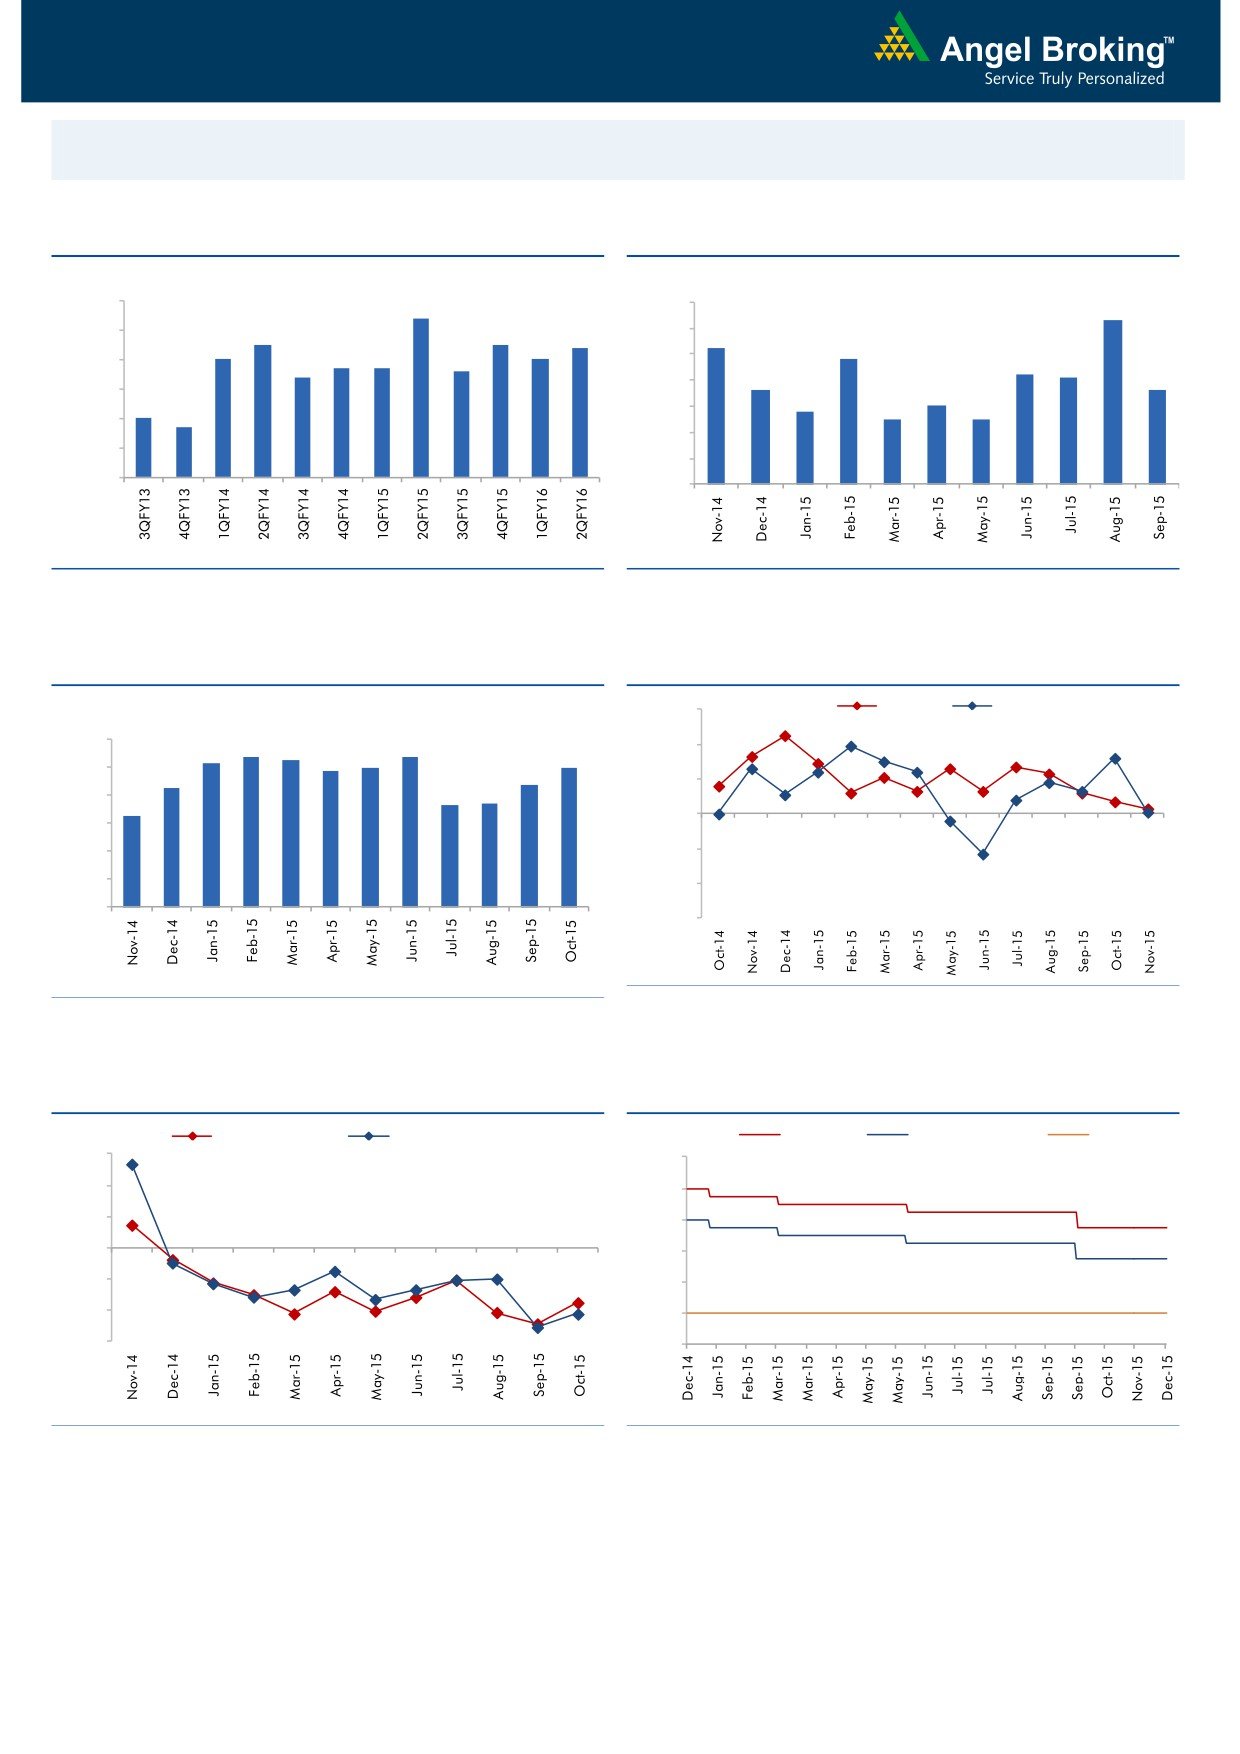
Macro watch
Exhibit 1: Quarterly GDP trends
Exhibit 2: IIP trends
(%)
(%)
9.0
8.4
7.0
6.3
8.0
7.5
7.5
7.4
6.0
5.2
7.0
7.0
4.8
6.7
6.7
6.6
5.0
7.0
6.4
4.2
4.1
3.6
3.6
4.0
6.0
2.8
3.0
5.0
3.0
2.5
2.5
4.7
5.0
2.0
4.0
1.0
3.0
-
Source: CSO, Angel Research
Source: MOSPI, Angel Research
Exhibit 3: Monthly CPI inflation trends
Exhibit 4: Manufacturing and services PMI
(%)
56.0
Mfg. PMI
Services PMI
6.0
5.4
5.3
5.4
54.0
5.2
5.0
5.0
4.9
5.0
4.3
4.4
52.0
3.7
3.7
4.0
3.3
50.0
3.0
2.0
48.0
1.0
46.0
-
44.0
Source: Market, Angel Research; Note: Level above 50 indicates expansion
Source: MOSPI, Angel Research
Exhibit 5: Exports and imports growth trends
Exhibit 6: Key policy rates
(%)
Exports yoy growth
Imports yoy growth
(%)
Repo rate
Reverse Repo rate
CRR
30.0
9.00
20.0
8.00
10.0
7.00
0.0
6.00
(10.0)
5.00
(20.0)
4.00
(30.0)
3.00
Source: Bloomberg, Angel Research
Source: RBI, Angel Research
Market Outlook
December 7, 2015
Global watch
Exhibit 1: Latest quarterly GDP Growth (%, yoy) across select developing and developed countries
(%)
8.0
6.9
5.3
6.0
4.7
4.7
4.0
2.9
2.3
2.2
1.8
2.0
1.0
1.2
1.0
-
(2.0)
(4.0)
(4.1)
(4.5)
(6.0)
Source: Bloomberg, Angel Research
Exhibit 2: 2015 GDP Growth projection by IMF (%, yoy) across select developing and developed countries
(%)
7.3
8.0
6.8
6.0
4.7
4.7
4.0
2.5
2.5
2.6
1.4
1.5
2.0
1.2
0.6
-
(2.0)
(4.0)
(3.0)
(3.8)
(6.0)
Source: IMF, Angel Research
Exhibit 3: One year forward P-E ratio across select developing and developed countries
(x)
20.0
18.0
16.0
14.0
12.0
10.0
8.0
6.0
4.0
2.0
-
Source: IMF, Angel Research
Market Outlook
December 7, 2015
Exhibit 4: Relative performance of indices across globe
Returns (%)
Country
Name of index
Closing price
1M
3M
1YR
Brazil
Bovespa
45,361
(5.6)
(0.3)
(17.1)
Russia
Micex
1,755
(0.5)
3.4
9.2
India
Nifty
7,782
(3.3)
(2.7)
(9.0)
China
Shanghai Composite
3,525
1.9
14.3
37.3
South Africa
Top 40
44,347
(9.6)
1.8
0.3
Mexico
Mexbol
42,994
(5.2)
0.1
(0.3)
Indonesia
LQ45
777
(2.2)
3.2
(12.1)
Malaysia
KLCI
1,668
(0.6)
3.6
(8.4)
Thailand
SET 50
856
(7.1)
(4.1)
(19.5)
USA
Dow Jones
17,848
(0.4)
9.0
(0.6)
UK
FTSE
6,238
(2.7)
2.7
(6.5)
Japan
Nikkei
19,504
4.4
1.9
12.0
Germany
DAX
10,752
(0.9)
6.4
6.6
France
CAC
4,715
(4.7)
3.6
11.5
Source: Bloomberg, Angel Research
Stock Watch
December 07, 2015
Company Name
Reco
CMP
Target
Mkt Cap
Sales ( Čcr )
OPM(%)
EPS (Č)
PER(x)
P/BV(x)
RoE(%)
EV/Sales(x)
(Č)
Price ( Č)
( Č cr )
FY16E FY17E
FY16E
FY17E
FY16E
FY17E
FY16E
FY17E
FY16E
FY17E
FY16E
FY17E
FY16E
FY17E
Agri / Agri Chemical
Rallis
Neutral
181
-
3,521
2,075
2,394
14.4
14.4
9.5
11.0
19.1
16.5
3.8
3.3
21.1
21.3
1.7
1.5
United Phosphorus
Buy
418
510
17,926
13,698
15,752
17.6
17.6
32.1
38.5
13.0
10.9
2.6
2.1
21.4
21.3
1.4
1.2
Auto & Auto Ancillary
Ashok Leyland
Buy
90
111
25,713
17,995
21,544
11.4
11.6
3.4
4.7
26.6
19.2
4.7
4.3
17.7
22.2
1.4
1.1
Bajaj Auto
Accumulate
2,469
2,728
71,449
23,695
27,298
21.3
20.4
134.6
151.5
18.3
16.3
5.8
5.0
31.8
30.6
2.6
2.2
Bharat Forge
Buy
838
1,016
19,514
8,013
9,250
20.0
20.3
35.2
43.1
23.8
19.5
4.7
3.9
21.6
21.8
2.6
2.2
Eicher Motors
Buy
16,429
19,036
44,611
15,379
16,498
15.6
16.6
473.2
574.8
34.7
28.6
12.8
9.6
36.7
33.2
2.8
2.6
Hero Motocorp
Accumulate
2,617
2,774
52,261
28,561
31,559
14.7
14.7
151.1
163.2
17.3
16.0
6.7
5.7
38.7
35.6
1.7
1.5
Jamna Auto Industries Neutral
126
-
1,004
1,292
1,486
9.3
9.8
6.0
7.5
20.9
16.8
4.4
3.7
20.7
21.8
0.8
0.7
L G Balakrishnan & Bros Neutral
494
-
775
1,254
1,394
11.6
11.8
35.9
41.7
13.8
11.9
1.9
1.6
13.5
13.8
0.7
0.6
Mahindra and Mahindra Accumulate
1,316
1,449
81,736
39,031
44,440
13.8
13.9
57.9
67.6
22.7
19.5
3.7
3.2
16.1
16.6
1.7
1.5
Maruti
Neutral
4,606
-
139,144
57,865
68,104
16.4
16.7
176.3
225.5
26.1
20.4
5.1
4.3
19.4
21.2
2.2
1.8
Minda Industries
Neutral
865
-
1,372
2,567
2,965
8.0
8.3
46.1
57.8
18.8
15.0
3.1
2.6
16.7
17.3
0.6
0.5
Motherson Sumi
Accumulate
280
313
37,069
39,343
45,100
8.8
9.1
10.1
12.5
27.8
22.4
8.8
6.9
35.3
34.4
1.0
0.9
Rane Brake Lining
Accumulate
334
366
264
454
511
11.1
11.4
23.8
28.1
14.0
11.9
2.0
1.8
14.2
15.3
0.7
0.7
Setco Automotive
Neutral
218
-
583
594
741
12.7
13.7
8.4
15.8
26.0
13.8
2.7
2.3
10.4
16.9
1.4
1.2
Tata Motors
Neutral
400
-
115,459
255,254
301,772
12.9
13.4
23.7
37.3
16.9
10.7
2.1
1.7
7.4
12.1
0.6
0.6
TVS Motor
Buy
284
338
13,481
11,569
13,648
7.3
8.7
10.3
16.1
27.6
17.6
6.9
5.4
24.8
30.5
1.1
1.0
Amara Raja Batteries
Buy
844
1,040
14,411
4,892
5,871
17.4
17.6
28.8
37.1
29.3
22.7
6.8
5.5
23.4
24.1
2.9
2.4
Exide Industries
Accumulate
141
162
12,006
6,950
7,784
14.4
14.8
6.6
7.3
21.4
19.4
2.7
2.5
12.6
12.8
1.4
1.3
Apollo Tyres
Accumulate
156
171
7,915
12,146
12,689
16.8
16.0
21.2
19.0
7.3
8.2
1.2
1.1
16.5
13.0
0.7
0.8
Ceat
Accumulate
1,020
1,119
4,127
6,041
6,597
14.1
13.7
99.5
111.9
10.3
9.1
2.0
1.7
19.6
18.5
0.8
0.7
JK Tyres
Neutral
105
-
2,374
7,446
7,669
15.2
14.0
19.6
18.4
5.3
5.7
1.3
1.1
25.2
19.5
0.7
0.6
Swaraj Engines
Neutral
915
-
1,136
552
630
14.2
14.7
44.6
54.1
20.5
16.9
4.8
4.3
23.2
25.6
1.9
1.6
Subros
Neutral
98
-
585
1,268
1,488
11.6
11.9
3.7
6.6
26.4
14.8
1.8
1.6
6.8
11.4
0.8
0.6
Indag Rubber
Neutral
228
-
598
283
329
17.0
17.2
13.0
15.4
17.6
14.8
3.8
3.2
21.8
21.6
1.8
1.5
Capital Goods
ACE
Neutral
44
-
433
660
839
4.7
8.2
1.0
3.9
43.8
11.2
1.4
1.2
3.2
11.3
0.8
0.6
BEML
Neutral
1,108
-
4,615
3,277
4,006
6.0
8.9
29.2
64.3
38.0
17.2
2.1
1.9
5.7
11.7
1.5
1.2
BGR Energy
Neutral
118
-
854
3,615
3,181
9.5
9.4
16.7
12.4
7.1
9.6
0.7
0.7
10.0
7.0
0.6
0.8
BHEL
Neutral
169
-
41,279
33,722
35,272
10.8
11.7
10.5
14.2
16.1
11.9
1.2
1.1
7.0
9.0
1.3
1.2
Stock Watch
December 07, 2015
Company Name
Reco
CMP
Target
Mkt Cap
Sales ( Čcr )
OPM(%)
EPS (Č)
PER(x)
P/BV(x)
RoE(%)
EV/Sales(x)
(Č)
Price ( Č)
( Č cr )
FY16E
FY17E
FY16E
FY17E
FY16E
FY17E
FY16E
FY17E
FY16E
FY17E
FY16E
FY17E
FY16E
FY17E
Capital Goods
Blue Star
Buy
355
429
3,191
3,548
3,977
6.3
6.9
13.7
17.2
25.9
20.7
6.5
4.2
26.1
25.4
1.0
0.8
Crompton Greaves
Accumulate
193
204
12,102
13,484
14,687
4.9
6.2
4.5
7.1
42.9
27.2
3.0
2.8
7.2
10.8
1.0
0.9
Inox Wind
Buy
358
505
7,940
4,980
5,943
17.0
17.5
26.6
31.6
13.5
11.3
4.0
3.0
35.0
30.0
1.7
1.4
KEC International
Neutral
152
-
3,918
8,791
9,716
6.1
6.8
5.4
8.2
28.2
18.6
2.8
2.6
10.0
14.0
0.7
0.6
Thermax
Neutral
886
-
10,554
6,413
7,525
7.4
8.5
30.5
39.3
29.0
22.5
4.5
3.9
15.0
17.0
1.6
1.3
Cement
ACC
Buy
1,335
1,630
25,072
13,151
14,757
16.4
18.3
63.9
83.4
20.9
16.0
2.7
2.5
13.3
16.1
1.7
1.5
Ambuja Cements
Buy
195
233
30,270
11,564
12,556
19.4
20.7
8.9
10.1
21.9
19.3
2.7
2.6
12.8
13.8
2.3
2.0
HeidelbergCement
Neutral
74
-
1,683
1,772
1,926
13.3
15.4
1.0
3.0
74.3
24.8
1.9
1.7
2.6
7.9
1.5
1.3
India Cements
Buy
86
112
2,634
4,216
4,840
18.0
19.5
4.0
9.9
21.4
8.7
0.9
0.8
4.0
9.5
1.0
0.8
JK Cement
Accumulate
655
744
4,577
3,661
4,742
10.1
15.8
18.0
61.0
36.4
10.7
2.6
2.3
7.5
22.9
1.7
1.3
J K Lakshmi Cement
Buy
327
430
3,844
2,947
3,616
16.7
19.9
11.5
27.2
28.4
12.0
2.7
2.3
9.8
20.8
1.7
1.4
Mangalam Cements
Neutral
209
-
558
1,053
1,347
10.5
13.3
8.4
26.0
24.9
8.0
1.1
1.0
4.3
12.5
0.9
0.7
Orient Cement
Accumulate
167
183
3,422
1,854
2,524
21.2
22.2
7.7
11.1
21.7
15.1
3.1
2.7
13.3
15.7
2.6
1.8
Ramco Cements
Neutral
376
-
8,951
4,036
4,545
20.8
21.3
15.1
18.8
24.9
20.0
3.0
2.7
12.9
14.3
2.7
2.4
Shree Cement^
Neutral
11,081
-
38,602
7,150
8,742
26.7
28.6
228.0
345.5
48.6
32.1
7.2
6.0
15.7
20.3
5.2
4.1
UltraTech Cement
Accumulate
2,862
3,282
78,549
25,021
30,023
19.1
21.6
89.0
132.0
32.2
21.7
3.7
3.2
12.2
15.9
3.2
2.7
Construction
ITNL
Neutral
86
-
2,836
7,360
8,825
34.0
35.9
7.0
9.0
12.3
9.6
0.4
0.4
3.2
3.7
3.7
3.6
KNR Constructions
Accumulate
613
673
1,725
937
1,470
14.3
14.0
33.5
38.6
18.3
15.9
2.8
2.4
15.4
15.4
1.9
1.2
Larsen & Toubro
Buy
1,341
1,646
124,871
65,065
77,009
11.5
11.7
61.5
65.6
21.8
20.4
2.2
2.0
13.4
14.0
2.1
1.8
Gujarat Pipavav Port
Neutral
159
-
7,706
629
684
51.0
52.2
6.4
5.9
24.9
27.0
3.3
3.0
15.9
12.7
11.9
10.7
MBL Infrastructures
Buy
216
285
895
2,313
2,797
12.2
14.6
19.0
20.0
11.4
10.8
1.2
1.1
11.3
10.6
1.1
1.0
Nagarjuna Const.
Neutral
77
-
4,306
7,892
8,842
8.8
9.1
3.0
5.3
25.8
14.6
1.3
1.2
5.0
8.5
0.8
0.7
PNC Infratech
Neutral
535
-
2,746
1,873
2,288
13.2
13.5
24.0
32.0
22.3
16.7
2.2
1.9
12.1
12.3
1.6
1.3
Simplex Infra
Neutral
320
-
1,583
5,955
6,829
10.3
10.5
16.0
31.0
20.0
10.3
1.1
1.0
5.3
9.9
0.8
0.7
Power Mech Projects
Neutral
600
-
883
1,539
1,801
12.8
12.7
59.0
72.1
10.2
8.3
1.5
1.3
18.6
16.8
0.6
0.5
Sadbhav Engineering
Neutral
353
-
6,048
3,481
4,219
10.7
10.8
8.0
12.0
44.1
29.4
4.1
3.6
10.3
13.5
2.0
1.7
NBCC
Accumulate
968
1,089
11,618
7,382
9,506
7.7
8.6
39.8
54.4
24.3
17.8
5.9
4.6
26.7
29.1
1.3
1.0
SIPL
Neutral
102
-
3,582
675
1,042
62.4
64.7
-
-
3.8
4.4
-
-
17.0
11.4
Financials
Allahabad Bank
Neutral
73
-
4,402
8,332
9,259
2.8
2.8
21.0
25.6
3.5
2.9
0.4
0.3
9.8
10.9
-
-
Stock Watch
December 07, 2015
Company Name
Reco
CMP
Target
Mkt Cap
Sales ( Čcr )
OPM(%)
EPS (Č)
PER(x)
P/BV(x)
RoE(%)
EV/Sales(x)
(Č)
Price ( Č)
( Č cr )
FY16E
FY17E
FY16E
FY17E
FY16E
FY17E
FY16E
FY17E
FY16E
FY17E
FY16E
FY17E
FY16E
FY17E
Financials
Axis Bank
Buy
460
630
109,499
26,473
31,527
3.5
3.6
35.7
43.5
12.9
10.6
2.5
2.2
17.9
18.9
-
-
Bank of Baroda
Neutral
167
-
38,583
19,105
21,474
2.0
2.0
19.1
24.8
8.8
6.8
0.9
0.8
10.2
12.1
-
-
Bank of India
Neutral
123
-
9,776
15,972
17,271
1.9
2.0
15.3
33.4
8.1
3.7
0.4
0.3
3.6
7.6
-
-
Canara Bank
Neutral
253
-
13,738
15,251
16,725
2.0
2.0
59.3
68.6
4.3
3.7
0.5
0.4
10.1
10.7
-
-
Dena Bank
Neutral
44
-
2,852
3,440
3,840
2.1
2.3
7.3
10.0
6.1
4.4
0.5
0.4
6.1
7.9
-
-
Federal Bank
Neutral
57
-
9,754
3,477
3,999
3.0
3.0
5.0
6.2
11.3
9.1
1.1
1.0
10.6
11.9
-
-
HDFC
Neutral
1,172
-
184,948
10,358
11,852
3.3
3.3
41.1
47.0
28.5
24.9
5.4
4.9
24.7
24.9
-
-
HDFC Bank
Buy
1,060
1,262
267,488
38,309
47,302
4.3
4.3
49.3
61.1
21.5
17.4
3.7
3.2
18.5
19.7
-
-
ICICI Bank
Buy
261
357
151,950
35,168
40,517
3.4
3.4
21.4
25.2
12.2
10.4
2.1
1.8
14.7
15.2
-
-
IDBI Bank
Neutral
91
-
14,652
9,625
10,455
1.8
1.8
8.5
14.2
10.7
6.4
0.7
0.6
5.9
9.3
-
-
Indian Bank
Neutral
127
-
6,090
6,160
6,858
2.5
2.5
24.5
29.8
5.2
4.3
0.4
0.4
7.7
8.6
-
-
LIC Housing Finance
Buy
458
571
23,106
3,101
3,745
2.5
2.5
33.0
40.2
13.9
11.4
2.6
2.2
19.7
20.5
-
-
Oriental Bank
Neutral
146
-
4,375
7,643
8,373
2.4
2.4
37.2
45.4
3.9
3.2
0.4
0.3
8.2
9.4
-
-
Punjab Natl.Bank
Neutral
135
-
26,420
23,638
26,557
2.8
2.8
17.9
27.2
7.5
4.9
0.8
0.6
8.5
12.0
-
-
South Ind.Bank
Neutral
20
-
2,734
1,965
2,185
2.5
2.5
2.5
3.3
8.1
6.1
0.8
0.7
9.5
11.7
-
-
St Bk of India
Buy
241
283
187,044
82,520
93,299
2.7
2.8
20.0
24.5
12.0
9.9
1.3
1.2
11.5
12.8
-
-
Union Bank
Neutral
166
-
11,381
12,646
14,129
2.3
2.4
31.0
39.1
5.3
4.2
0.6
0.5
9.8
11.4
-
-
Vijaya Bank
Neutral
34
-
2,938
3,536
3,827
1.9
1.9
5.5
6.7
6.2
5.1
0.5
0.5
7.8
8.8
-
-
Yes Bank
Buy
739
914
30,993
7,228
9,043
3.2
3.3
57.7
69.4
12.8
10.7
2.3
1.9
19.1
19.6
-
-
FMCG
Asian Paints
Neutral
836
-
80,199
16,553
19,160
16.0
16.2
17.7
21.5
47.3
38.9
12.6
11.3
29.4
31.2
4.7
4.0
Britannia
Neutral
2,936
-
35,220
8,065
9,395
9.6
10.2
47.2
65.5
62.2
44.8
20.7
19.5
38.3
41.2
4.2
3.6
Colgate
Neutral
974
-
26,497
4,836
5,490
19.5
19.7
48.5
53.2
20.1
18.3
14.7
12.8
99.8
97.5
5.4
4.7
Dabur India
Neutral
272
-
47,893
9,370
10,265
17.1
17.2
7.3
8.1
37.1
33.6
11.2
9.1
33.7
30.6
5.0
4.6
GlaxoSmith Con*
Neutral
5,861
-
24,650
4,919
5,742
17.2
17.4
168.3
191.2
34.8
30.7
9.9
8.4
28.8
28.9
4.6
3.9
Godrej Consumer
Neutral
1,206
-
41,070
10,168
12,886
16.1
16.1
32.1
38.4
37.6
31.4
7.6
7.1
19.7
21.0
4.1
3.3
HUL
Neutral
815
-
176,431
34,940
38,957
17.5
17.7
20.8
24.7
39.2
33.0
43.6
34.8
110.5
114.2
4.9
4.3
ITC
Accumulate
336
382
269,569
41,068
45,068
37.8
37.4
13.9
15.9
24.1
21.1
8.1
7.1
34.1
33.8
6.2
5.6
Marico
Neutral
425
-
27,403
6,551
7,766
15.7
16.0
10.4
12.5
40.9
34.0
11.9
9.9
33.2
32.4
4.1
3.5
Nestle*
Accumulate
5,856
6,646
56,463
11,291
12,847
22.2
22.3
158.9
184.6
36.9
31.7
19.3
17.3
55.0
57.3
4.8
4.2
Stock Watch
December 07, 2015
Company Name
Reco
CMP
Target
Mkt Cap
Sales ( Čcr )
OPM(%)
EPS (Č)
PER(x)
P/BV(x)
RoE(%)
EV/Sales(x)
(Č)
Price ( Č)
( Č cr )
FY16E FY17E
FY16E
FY17E
FY16E
FY17E
FY16E
FY17E
FY16E
FY17E
FY16E
FY17E
FY16E
FY17E
FMCG
Tata Global
Accumulate
134
144
8,435
8,635
9,072
9.8
9.9
6.5
7.6
20.6
17.6
2.1
2.0
6.8
7.4
0.9
0.9
IT
HCL Tech^
Buy
836
1,132
117,811
42,038
47,503
23.2
23.5
55.8
62.9
15.0
13.3
3.4
2.6
23.0
19.8
2.4
1.9
Infosys
Buy
1,048
1,306
240,674
60,250
66,999
28.0
28.0
58.3
63.7
18.0
16.5
3.8
3.2
20.9
19.7
3.3
2.8
TCS
Buy
2,330
3,165
459,139
111,274
126,852
28.4
28.7
125.4
143.9
18.6
16.2
7.4
6.8
39.9
42.2
3.7
3.2
Tech Mahindra
Buy
536
646
51,795
25,566
28,890
16.0
17.0
26.3
31.9
20.4
16.8
3.7
3.1
17.9
18.6
1.8
1.5
Wipro
Buy
570
719
140,751
52,414
58,704
23.7
23.8
38.4
42.3
14.8
13.5
2.9
2.6
19.5
18.0
2.3
1.9
Media
D B Corp
Accumulate
334
356
6,140
2,241
2,495
27.8
27.9
21.8
25.6
15.4
13.1
4.0
3.5
26.7
28.5
2.7
2.4
HT Media
Neutral
79
-
1,846
2,495
2,603
11.2
11.2
7.3
8.6
10.9
9.2
0.9
0.8
7.4
8.1
0.2
0.2
Jagran Prakashan
Accumulate
148
169
4,850
2,170
2,355
27.0
27.6
12.8
10.3
11.6
14.4
3.2
3.0
21.8
19.4
2.0
1.7
Sun TV Network
Neutral
392
-
15,444
2,779
3,196
70.2
70.5
22.8
27.3
17.2
14.4
4.2
3.8
26.7
28.3
5.3
4.6
Hindustan Media
Neutral
281
-
2,066
920
1,031
20.0
20.0
19.2
20.9
14.7
13.5
2.4
2.1
16.4
15.3
1.8
1.6
Ventures
Metals & Mining
Coal India
Accumulate
335
380
211,630
76,167
84,130
19.9
22.3
22.4
25.8
14.9
13.0
5.4
5.3
35.5
41.0
2.1
1.9
Hind. Zinc
Buy
147
175
62,049
14,641
14,026
50.4
50.4
17.7
16.0
8.3
9.2
1.3
1.2
16.2
13.2
1.9
1.7
Hindalco
Neutral
79
-
16,334
104,356
111,186
8.7
9.5
6.7
11.1
11.8
7.2
0.4
0.4
3.5
5.9
0.7
0.6
JSW Steel
Neutral
972
-
23,497
42,308
45,147
16.4
20.7
(10.3)
49.5
19.6
1.1
1.0
(1.0)
5.6
1.6
1.5
NMDC
Neutral
92
-
36,376
8,237
10,893
46.6
44.5
10.0
11.7
9.2
7.9
1.0
0.9
12.5
13.0
4.2
3.2
SAIL
Neutral
47
-
19,288
45,915
53,954
7.2
10.5
1.5
4.4
31.0
10.7
0.5
0.4
2.3
4.1
1.1
0.9
Vedanta
Neutral
92
-
27,127
71,445
81,910
26.2
26.3
12.9
19.2
7.1
4.8
0.5
0.4
7.2
8.9
0.8
0.6
Tata Steel
Neutral
240
-
23,329
126,760
137,307
8.9
11.3
6.4
23.1
37.8
10.4
0.8
0.7
2.0
7.1
0.8
0.7
Oil & Gas
Cairn India
Neutral
139
-
26,117
11,323
12,490
49.4
51.0
20.7
20.7
6.7
6.8
0.4
0.4
6.4
6.1
1.4
0.7
GAIL
Neutral
356
-
45,164
64,856
70,933
9.1
9.6
24.0
28.9
14.9
12.3
1.3
1.2
8.8
9.6
0.9
0.8
ONGC
Neutral
228
-
194,723
154,564
167,321
36.8
37.4
28.6
32.5
8.0
7.0
1.0
0.9
12.7
13.5
1.5
1.4
Petronet LNG
Neutral
244
-
18,304
29,691
31,188
5.8
6.2
12.8
13.4
19.1
18.2
2.9
2.5
15.8
14.8
0.7
0.7
Indian Oil Corp
Accumulate
428
455
103,989
359,607
402,760
5.9
6.1
42.5
48.7
10.1
8.8
1.4
1.2
14.1
14.4
0.4
0.3
Reliance Industries
Accumulate
966
1,050
312,812
304,775
344,392
12.6
13.4
91.3
102.6
10.6
9.4
1.2
1.1
11.8
12.0
1.0
0.8
Pharmaceuticals
Alembic Pharma
Neutral
680
-
12,820
2,658
3,112
24.1
20.2
24.6
23.9
27.6
28.5
9.9
7.6
42.5
30.2
4.8
4.1
Aurobindo Pharma
Accumulate
809
872
47,249
14,923
17,162
23.0
23.0
38.2
43.6
21.2
18.6
6.5
4.9
36.0
30.2
3.5
3.0
Aventis*
Neutral
4,322
-
9,952
2,082
2,371
17.4
20.8
118.2
151.5
36.6
28.5
5.4
4.3
19.9
25.5
4.5
3.7
Cadila Healthcare
Neutral
394
-
40,356
10,224
11,840
21.0
22.0
14.6
17.6
27.0
22.4
7.4
5.8
30.8
29.0
4.0
3.4
Stock Watch
December 07, 2015
Company Name
Reco
CMP
Target
Mkt Cap
Sales ( Čcr )
OPM(%)
EPS (Č)
PER(x)
P/BV(x)
RoE(%)
EV/Sales(x)
(Č)
Price ( Č)
( Č cr )
FY16E FY17E
FY16E
FY17E
FY16E
FY17E
FY16E
FY17E
FY16E
FY17E
FY16E
FY17E
FY16E
FY17E
Pharmaceuticals
Cipla
Neutral
646
-
51,852
14,211
16,611
20.6
19.0
27.0
28.9
23.9
22.3
4.1
3.5
18.4
16.8
3.6
3.0
Dr Reddy's
Buy
3,195
3,933
54,480
16,838
19,575
25.0
23.1
167.5
178.8
19.1
17.9
4.0
3.4
23.1
20.4
3.2
2.7
Dishman Pharma
Neutral
319
-
2,573
1,733
1,906
21.5
21.5
17.0
19.9
18.8
16.0
1.9
1.7
10.5
11.2
2.0
1.7
GSK Pharma*
Neutral
3,272
-
27,715
2,870
3,158
20.0
22.1
59.5
68.3
55.0
47.9
16.2
16.7
28.5
34.3
9.2
8.4
Indoco Remedies
Neutral
312
-
2,873
1,033
1,199
15.9
18.2
9.4
13.6
33.2
22.9
4.9
4.2
15.7
19.7
2.9
2.5
Ipca labs
Buy
771
900
9,729
3,363
3,909
12.9
18.6
13.4
28.0
57.5
27.5
7.5
6.0
7.4
14.0
3.2
2.7
Lupin
Neutral
1,806
-
81,333
13,092
16,561
25.0
27.0
50.4
68.3
35.8
26.4
7.4
5.9
22.8
24.7
5.9
4.6
Sun Pharma
Buy
756
950
181,954
28,163
32,610
25.8
30.7
17.4
26.9
43.5
28.1
4.1
3.6
13.0
16.6
5.9
4.9
Power
Tata Power
Neutral
64
-
17,364
35,923
37,402
22.6
22.8
4.1
5.2
15.8
12.5
1.2
1.1
7.5
9.3
1.4
1.3
NTPC
Buy
131
157
107,851
87,064
98,846
23.5
23.5
11.7
13.2
11.2
9.9
1.2
1.2
11.4
12.1
2.3
2.0
Power Grid
Buy
131
170
68,508
20,702
23,361
86.7
86.4
12.1
13.2
10.8
9.9
1.6
1.4
15.6
15.1
8.2
7.7
Telecom
Bharti Airtel
Neutral
321
-
128,416
101,748
109,191
32.1
31.7
12.0
12.5
26.8
25.7
1.8
1.7
6.9
6.7
1.9
1.7
Idea Cellular
Neutral
139
-
49,968
34,282
36,941
32.0
31.5
5.9
6.2
23.5
22.4
2.2
2.0
9.9
9.3
2.0
1.9
zOthers
Abbott India
Neutral
5,184
-
11,016
2,715
3,153
14.5
14.1
134.3
152.2
38.6
34.1
9.6
7.9
27.4
25.6
3.8
3.2
Bajaj Electricals
Buy
214
341
2,165
4,719
5,287
5.2
5.8
8.6
12.7
25.1
16.9
2.9
2.5
11.4
14.8
0.5
0.4
Finolex Cables
Neutral
246
-
3,755
2,520
2,883
12.2
12.0
12.7
14.2
19.4
17.3
2.6
2.3
13.6
13.5
1.2
1.0
Goodyear India*
Accumulate
564
622
1,301
1,888
1,680
12.1
11.9
62.2
56.6
9.1
10.0
2.1
1.8
25.9
19.7
0.5
0.5
Hitachi
Neutral
1,333
-
3,623
1,779
2,081
7.8
8.8
21.8
33.4
61.1
39.9
9.9
8.0
17.4
22.1
2.1
1.8
Jyothy Laboratories
Neutral
313
-
5,667
1,620
1,847
11.5
11.5
7.3
8.5
42.9
36.9
5.6
5.1
13.3
14.4
3.4
2.9
MRF
Buy
39,533
45,575
16,766
20,316
14,488
21.4
21.1
5,488.0
3,798.0
7.2
10.4
2.5
2.0
41.1
21.2
0.8
1.0
Page Industries
Neutral
12,967
-
14,463
1,929
2,450
19.8
20.1
229.9
299.0
56.4
43.4
24.9
17.3
52.1
47.1
7.5
5.9
Relaxo Footwears
Neutral
490
-
5,881
1,767
2,152
12.3
12.5
19.3
25.1
25.5
19.6
6.2
4.8
27.7
27.8
3.4
2.8
Siyaram Silk Mills
Accumulate
1,072
1,145
1,005
1,636
1,815
11.5
11.5
89.9
104.1
11.9
10.3
2.0
1.7
17.9
17.8
0.8
0.7
Styrolution ABS India*
Neutral
719
-
1,264
1,271
1,440
8.6
9.2
32.0
41.1
22.4
17.5
2.3
2.1
10.7
12.4
1.0
0.8
TVS Srichakra
Accumulate
2,825
3,240
2,163
2,101
2,338
15.7
15.0
248.6
270.0
11.4
10.5
5.0
3.6
43.6
34.0
1.1
0.9
HSIL
Neutral
307
-
2,218
2,123
2,384
16.1
16.5
15.0
18.9
20.4
16.3
1.6
1.5
8.0
9.4
1.4
1.2
Kirloskar Engines India
Neutral
264
-
3,815
2,471
2,826
8.8
10.4
9.1
13.3
28.9
19.8
2.8
2.6
9.7
13.4
1.2
1.0
Ltd
M M Forgings
Buy
527
614
636
511
615
21.7
21.6
43.1
55.8
12.2
9.5
2.2
1.8
19.9
21.2
1.5
1.1
Banco Products (India)
Neutral
135
-
967
1,208
1,353
11.0
12.3
10.8
14.5
12.5
9.3
1.4
1.3
11.9
14.5
0.8
0.7
Stock Watch
December 07, 2015
Company Name
Reco
CMP
Target Mkt Cap
Sales ( Čcr )
OPM(%)
EPS (Č)
PER(x)
P/BV(x)
RoE(%)
EV/Sales(x)
(Č)
Price ( Č)
( Č cr )
FY16E FY17E FY16E FY17E FY16E FY17E FY16E FY17E FY16E FY17E FY16E FY17E FY16E FY17E
zOthers
Competent Automobiles Neutral
153
-
94
1,040
1,137
3.2
3.1
25.7
28.0
5.9
5.5
0.9
0.8
15.0
14.3
0.1
0.1
Nilkamal
Neutral
1,038
-
1,549
1,910
2,083
10.5
10.3
63.3
69.2
16.4
15.0
2.7
2.3
17.6
16.5
0.9
0.8
Visaka Industries
Accumulate
125
144
199
1,086
1,197
9.9
10.3
21.5
28.8
5.8
4.4
0.6
0.5
9.6
11.6
0.4
0.3
Transport Corporation of
Neutral
329
-
2,501
2,830
3,350
8.8
9.0
14.4
18.3
22.9
18.0
3.5
3.1
15.4
17.1
1.0
0.9
India
Elecon Engineering
Neutral
86
-
936
1,369
1,533
13.7
14.9
3.3
6.1
25.9
14.2
1.7
1.6
6.6
11.4
1.0
0.9
Surya Roshni
Buy
136
183
595
2,992
3,223
8.1
8.4
14.7
18.3
9.3
7.4
0.9
0.8
9.7
11.0
0.5
0.4
MT Educare
Buy
141
169
563
286
366
18.3
17.7
7.7
9.4
18.3
15.1
3.9
3.4
20.2
21.1
1.9
1.4
Radico Khaitan
Buy
108
156
1,434
1,565
1,687
12.2
13.0
5.7
7.1
18.9
15.2
1.6
1.5
8.3
9.6
1.4
1.3
Garware Wall Ropes
Accumulate
390
423
853
861
967
10.9
10.9
24.0
28.2
16.2
13.8
2.4
2.1
14.6
14.9
1.0
0.9
Wonderla Holidays
Neutral
388
-
2,191
206
308
44.0
43.6
9.0
12.9
43.1
30.1
5.9
5.3
13.7
17.8
10.5
7.0
Linc Pen & Plastics
Neutral
178
-
264
340
371
8.3
8.9
10.8
13.2
16.5
13.5
2.6
2.3
16.0
17.1
0.8
0.7
The Byke Hospitality
Accumulate
167
181
670
222
287
20.5
20.5
5.6
7.6
29.6
22.1
5.6
4.6
18.9
20.8
3.1
2.4
Interglobe Aviation
Neutral
1,080
-
38,908
17,022
21,122
20.7
14.5
63.9
53.7
16.9
20.1
25.3
20.8
149.9
103.2
2.3
1.9
Coffee Day Enterprises
Neutral
255
-
5,249
2,692
2,964
17.0
18.6
-
4.7
-
53.8
3.1
2.9
0.2
5.5
2.3
2.2
Ltd
Navneet Education
Accumulate
86
97
2,051
998
1,062
24.1
24.0
5.8
6.1
15.0
14.1
3.3
2.9
22.0
20.6
2.1
2.0
Source: Company, Angel Research; Note: *December year end; #September year end; &October year end; Price as on December 04, 2015
Market Outlook
December 07, 2015
Research Team Tel: 022 - 39357800
DISCLAIMER
Angel Broking Private Limited (hereinafter referred to as “Angel”) is a registered Member of National Stock Exchange of India Limited,
Bombay Stock Exchange Limited and Metropolitian Stock Exchange of India Limited. It is also registered as a Depository Participant with
CDSL and Portfolio Manager with SEBI. It also has registration with AMFI as a Mutual Fund Distributor. Angel Broking Private Limited is a
registered entity with SEBI for Research Analyst in terms of SEBI (Research Analyst) Regulations, 2014 vide registration number
INH000000164. Angel or its associates has not been debarred/ suspended by SEBI or any other regulatory authority for accessing
/dealing in securities Market. Angel or its associates including its relatives/analyst do not hold any financial interest/beneficial ownership
of more than 1% in the company covered by Analyst. Angel or its associates/analyst has not received any compensation / managed or co
-managed public offering of securities of the company covered by Analyst during the past twelve months. Angel/analyst has not served as
an officer, director or employee of company covered by Analyst and has not been engaged in market making activity of the company
covered by Analyst.
This document is solely for the personal information of the recipient, and must not be singularly used as the basis of any investment
decision. Nothing in this document should be construed as investment or financial advice. Each recipient of this document should make
such investigations as they deem necessary to arrive at an independent evaluation of an investment in the securities of the companies
referred to in this document (including the merits and risks involved), and should consult their own advisors to determine the merits and
risks of such an investment.
Reports based on technical and derivative analysis center on studying charts of a stock's price movement, outstanding positions and
trading volume, as opposed to focusing on a company's fundamentals and, as such, may not match with a report on a company's
fundamentals.
The information in this document has been printed on the basis of publicly available information, internal data and other reliable sources
believed to be true, but we do not represent that it is accurate or complete and it should not be relied on as such, as this document is for
general guidance only. Angel Broking Pvt. Limited or any of its affiliates/ group companies shall not be in any way responsible for any
loss or damage that may arise to any person from any inadvertent error in the information contained in this report. Angel Broking Pvt.
Limited has not independently verified all the information contained within this document. Accordingly, we cannot testify, nor make any
representation or warranty, express or implied, to the accuracy, contents or data contained within this document. While Angel Broking
Pvt. Limited endeavors to update on a reasonable basis the information discussed in this material, there may be regulatory, compliance,
or other reasons that prevent us from doing so.
This document is being supplied to you solely for your information, and its contents, information or data may not be reproduced,
redistributed or passed on, directly or indirectly.
Neither Angel Broking Pvt. Limited, nor its directors, employees or affiliates shall be liable for any loss or damage that may arise from or
in connection with the use of this information.
Note: Please refer to the important ‘Stock Holding Disclosure' report on the Angel website (Research Section). Also, please refer to the
latest update on respective stocks for the disclosure status in respect of those stocks. Angel Broking Pvt. Limited and its affiliates may have
investment positions in the stocks recommended in this report.