Market Outlook
September 7, 2015
Dealer’s Diary
Domestic Indices
Chg (%)
(Pts)
(Close)
BSE Sensex
(2.2)
(563)
25,202
Indian markets are expected to open on negative tracking the SGX Nifty and global
cues.
Nifty
(2.1)
(168)
7,655
MID CAP
(1.9)
(200)
10,360
US markets moved lower during trading on Friday following the release of the
SMALL CAP
(2.5)
(268)
10,605
closely watched monthly employment report. The Dow dropped 272.38 points or
BSE HC
(2.4)
(425)
17,136
1.7 percent to 16,102.38, the Nasdaq slid 49.58 points or 1.1 percent to 4,683.92
BSE PSU
(1.9)
(125)
6,522
and the S&P 500 fell 29.91 points or 1.5 percent to 1,921.22.
BANKEX
(2.7)
(503)
18,438
The European markets ended Friday's session solidly to the downside. The highly
AUTO
(2.3)
(400)
16,983
anticipated U.S. employment report showed disappointing job growth, which
METAL
(2.3)
(165)
7,117
triggered uncertainty among investors.
OIL & GAS
(1.4)
(122)
8,540
Indian markets tumbled on Friday, mirroring weak cues from Wall Street, Asia and
BSE IT
(2.3)
(263)
10,970
Europe as anxiety ahead of U.S. jobs data due out tonight overshadowed optimism
Global Indices
Chg (%)
(Pts)
(Close)
over the prospects of further ECB stimulus.
Dow Jones
(1.7)
(272)
16,102
NASDAQ
(1.0)
(50)
4,684
News & Result Analysis
FTSE
(2.4)
(151)
6,043
India's mega power projects grind to a slow halt
Refer detailed news analysis on the following page
Nikkei
(2.1)
(390)
17,792
Hang Sang
(0.5)
(94)
20,841
Markets Today
Straits Times
(1.5)
(43)
2,864
The trend deciding level for the day is 25,365 / 7,696 levels. If NIFTY trades above
Shanghai Com
(0.2)
(6)
3,160
this level during the first half-an-hour of trade then we may witness a further rally up
to 25,612 - 26,022 / 7,764 - 7,874 levels. However, if NIFTY trades below
Indian ADR
Chg (%)
(Pts)
(Close)
25,365 / 7,696 levels for the first half-an-hour of trade then it may correct towards
24,956 - 24,709 / 7,586 - 7,518 levels.
INFY
(3.6)
(0.6)
$16.9
WIT
(3.9)
(0.5)
$11.5
Indices
S2
S1
PIVOT
R1
R2
IBN
(2.9)
(0.2)
$8.3
SENSEX
24,709
24,956
25,365
25,612
26,022
HDB
(1.9)
(1.1)
$56.3
NIFTY
7,518
7,586
7,696
7,764
7,874
Advances / Declines
BSE
NSE
Net Inflows (September 03, 2015)
Advances
548
1,099
` cr
Purch
Sales
Net
MTD
YTD
Declines
2,161
406
FII
3,337
3,672
(336)
(2,541)
121,219
Unchanged
77
66
MFs
1,279
980
299
299
70,947
Volumes (` cr)
FII Derivatives (September 04, 2015)
` cr
Purch
Sales
Net
Open Interest
BSE
2,690
Index Futures
2564
2920
(356)
20629
NSE
16,813
Stock Futures
2627
2137
490
43716
Gainers / Losers
Gainer
Loser
Company
Price (`)
chg (%)
Company
Price (`)
chg (%)
PMCFIN
2
4.5
NCC
58
(12.2)
PGHH
387
4.0
WELCORP
101
(8.8)
AMTEKAUTO
33
3.8
HDIL
57
(7.8)
SHRIRAMCIT
1,671
2.2
PFC
206
(6.4)
TITAN
333
2.0
FRL
109
(6.3)
Market Outlook
September 7, 2015
India's mega power projects grind to a slow halt
At `1.19 a unit, power generated from the Sasan ultra mega power project
(UMPP) in Madhya Pradesh is perhaps one of the cheapest in the country. Yet,
Reliance Power wants state-owned Power Finance Corporation to buy it for "breach
of representation" - the de-allocation of the Chhatrasal coal block, which was
linked to the project. The company has already given up the Tilaiya UMPP because
of the slow pace of land acquisition by the Jharkhand government and has not
made progress on the Krishnapatnam UMPP in Tamil Nadu. Tata Power's UMPP at
Mundra in Gujarat, based on imported coal is in financial trouble for selling power
at Rs 2.26 a unit. That's not all. The Union government had to cancel the two-year
long bidding process for two UMPPs in Tamil Nadu and Odisha after all private
companies pulled out and government-controlled NTPC and NHPC emerged as
the winning bidders. For the Tamil Nadu UMPP, Adani Power, CLP India, Jindal
Steel & Power, JSW Energy, Sterlite Energy and Tata Power were in the fray, but
only four of them bought the 'request for proposal' document and none decided to
proceed further. NTPC submitted its bid, which wasn't opened since it was felt that
at least three quotes should be available for choosing the final winner.
Similarly, the Odisha UMPP saw nine interested bidders but finally only NTPC and
NHPC were left as the rest pulled out, which led to the cancellation of the auction.
Despite Mundra and Sasan producing 8,000 Mw of power, the inescapable
inference is that the UMPP experiment, launched with much fanfare during the first
tenure of the Manmohan Singh-led United Progressive Alliance government, has
failed.
Economic and Political News
Govt saves $1.8 billion on fertiliser subsidies, but no reform planned
India's Iran oil imports fall to 5-month low in August
IMF says room for RBI to cut rates, but warns of risks to inflation
Corporate News
Aurobindo gets USFDA nod for generic hypertension tablets
Suzlon seeks shareholders nod to raise `5,000 cr
Cipla to acquire two US-based pharma cos for $550 million
Reduction in iron ore freight rates won't help us: Vedanta
Market Outlook
September 7, 2015
Top Picks
Large Cap
Market Cap
CMP
Target
Upside
Company
Sector
Rating
(` Cr)
(`)
(`)
(%)
Axis Bank
Financials
1,11,434
Buy
469
704
50.2
ICICI Bank
Financials
1,49,698
Buy
258
373
44.7
Infosys
IT
2,46,646
Buy
1,074
1,306
21.6
Inox Wind
Capital Goods
8,369
Buy
377
505
33.9
LIC HFL
Financials
20,865
Buy
413
570
37.9
Power Grid
Power
64,558
Buy
123
170
37.8
TCS
IT
4,99,368
Buy
2,549
3,168
24.3
Tech Mahindra IT
50,788
Buy
528
646
22.3
Yes Bank
Financials
27,046
Buy
646
951
47.1
Source: Angel Research, Bloomberg
Mid Cap
Market Cap
CMP
Target
Upside
Company
Sector
Rating
(` Cr)
(`)
(`)
(%)
Bajaj Electricals
Others
2,385
Buy
236
341
44.2
Garware Wall RopesOthers
644
Buy
294
390
32.6
HMVL
Media
1,593
Buy
217
292
34.5
JK Tyre
Auto Ancillary
2,303
Buy
102
129
27.0
MBL Infra
Construction
958
Buy
231
360
55.7
Minda Industries
Auto Ancillary
796
Buy
502
652
29.9
MT Educare
Others
501
Buy
126
169
34.4
Radico Khaitan
Others
1,129
Buy
85
112
32.0
Surya Roshni
Others
509
Buy
116
183
57.7
Source: Angel Research, Bloomberg
Market Outlook
September 07, 2015
Global economic events release calendar
Date
Time
Country Event Description
Unit
Period
Bloomberg Data
Last Reported Estimated
September 8, 2015
2:30PM
Euro Zone Euro-Zone GDP s.a. (QoQ)
% Change
2Q P
0.30
0.30
China
Exports YoY%
% Change
Aug
(8.30)
(6.70)
September 9, 2015
2:00PM
UK
Industrial Production (YoY)
% Change
Jul
1.50
1.50
September 10, 2015
6:00PM
US
Initial Jobless claims
Thousands
Sep 5
282.00
275.00
India
Imports YoY%
% Change
Aug
(10.28)
--
India
Exports YoY%
% Change
Aug
(10.30)
--
7:00AM
China
Consumer Price Index (YoY)
% Change
Aug
1.60
1.90
4:30PM
UK
BOE Announces rates
% Ratio
Sep 10
0.50
0.50
September 11, 2015
5:30PM
India
Industrial Production YoY
% Change
Jul
3.80
--
September 13, 2015
11:00AM
China
Industrial Production (YoY)
% Change
Aug
6.00
6.30
September 14, 2015
12:00PM
India
Monthly Wholesale Prices YoY%
% Change
Aug
(4.05)
--
September 15, 2015
6:45PM
US
Industrial Production
%
Aug
0.56
--
2:00PM
UK
CPI (YoY)
% Change
Aug
0.10
--
September 16, 2015
2:00PM
UK
Jobless claims change
% Change
Aug
(4.90)
--
2:30PM
Euro Zone Euro-Zone CPI (YoY)
%
Aug F
0.20
--
6:00PM
US
Consumer price index (mom)
% Change
Aug
0.10
--
September 17, 2015
6:00PM
US
Building permits
Thousands
Aug
1,130.00
--
6:00PM
US
Housing Starts
Thousands
Aug
1,206.00
--
11:30PM
US
FOMC rate decision
%
Sep 17
0.25
0.50
September 21, 2015
7:30PM
US
Existing home sales
Million
Aug
5.59
--
September 22, 2015
7:30PM
Euro Zone Euro-Zone Consumer Confidence
Value
Sep A
(6.90)
--
September 23, 2015
1:00PM
Germany PMI Services
Value
Sep P
54.90
--
1:00PM
Germany PMI Manufacturing
Value
Sep P
53.30
--
September 24, 2015
7:30PM
US
New home sales
Thousands
Aug
507.00
--
September 25, 2015
6:00PM
US
GDP Qoq (Annualised)
% Change
2Q T
3.70
--
September 29, 2015
7:30PM
US
Consumer Confidence
S.A./ 1985=100
Sep
101.54
--
11:00AM
India
RBI Reverse Repo rate
%
Sep 29
6.25
--
11:00AM
India
RBI Repo rate
%
Sep 29
7.25
--
11:00AM
India
RBI Cash Reserve ratio
%
Sep 29
4.00
--
September 30, 2015
1:25PM
Germany Unemployment change (000's)
Thousands
Sep
(7.00)
--
2:00PM
UK
GDP (YoY)
% Change
2Q F
2.60
--
October 1, 2015
6:30AM
China
PMI Manufacturing
Value
Sep
49.70
--
2:00PM
UK
PMI Manufacturing
Value
Sep
51.50
--
Source: Bloomberg, Angel Research
Market Outlook
September 7, 2015
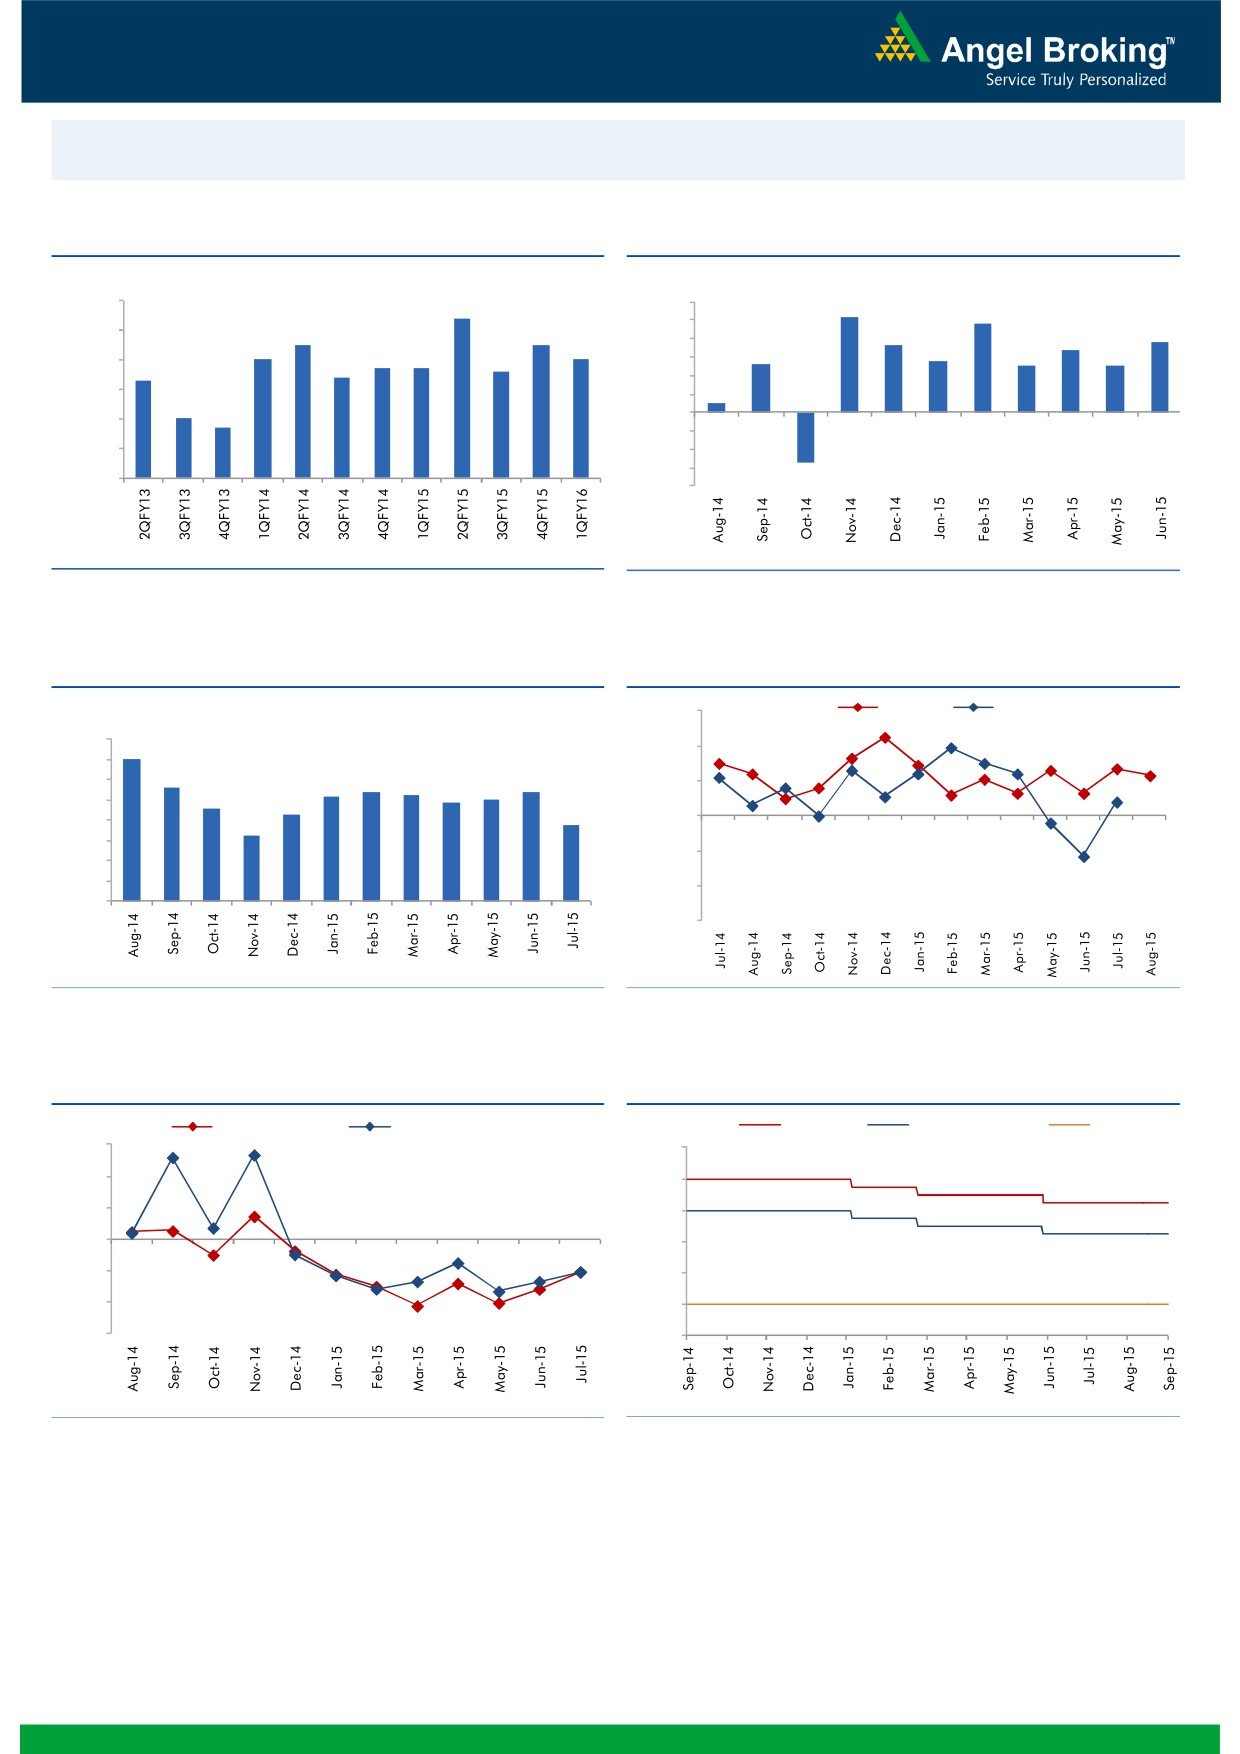
Macro watch
Exhibit 1: Quarterly GDP trends
Exhibit 2: IIP trends
(%)
(%)
9.0
8.4
6.0
5.2
4.8
7.5
7.5
5.0
3.8
8.0
3.6
3.4
7.0
7.0
4.0
2.8
6.7
6.7
2.6
2.5
2.5
7.0
6.3
6.4
6.6
3.0
2.0
6.0
0.5
1.0
5.0
4.7
-
5.0
(1.0)
4.0
(2.0)
(3.0)
3.0
(2.7)
(4.0)
Source: CSO, Angel Research
Source: MOSPI, Angel Research
Exhibit 3: Monthly CPI inflation trends
Exhibit 4: Manufacturing and services PMI
(%)
56.0
Mfg. PMI
Services PMI
8.0
7.0
54.0
7.0
5.6
5.4
6.0
5.2
5.4
5.3
5.0
52.0
4.6
4.9
5.0
4.3
3.8
4.0
3.3
50.0
3.0
48.0
2.0
1.0
46.0
-
44.0
Source: MOSPI, Angel Research
Source: Market, Angel Research; Note: Level above 50 indicates expansion
Exhibit 5: Exports and imports growth trends
Exhibit 6: Key policy rates
(%)
Exports yoy growth
Imports yoy growth
(%)
Repo rate
Reverse Repo rate
CRR
30.0
9.00
20.0
8.00
10.0
7.00
0.0
6.00
(10.0)
5.00
(20.0)
4.00
(30.0)
3.00
Source: Bloomberg, Angel Research
Source: RBI, Angel Research
Market Outlook
September 7, 2015
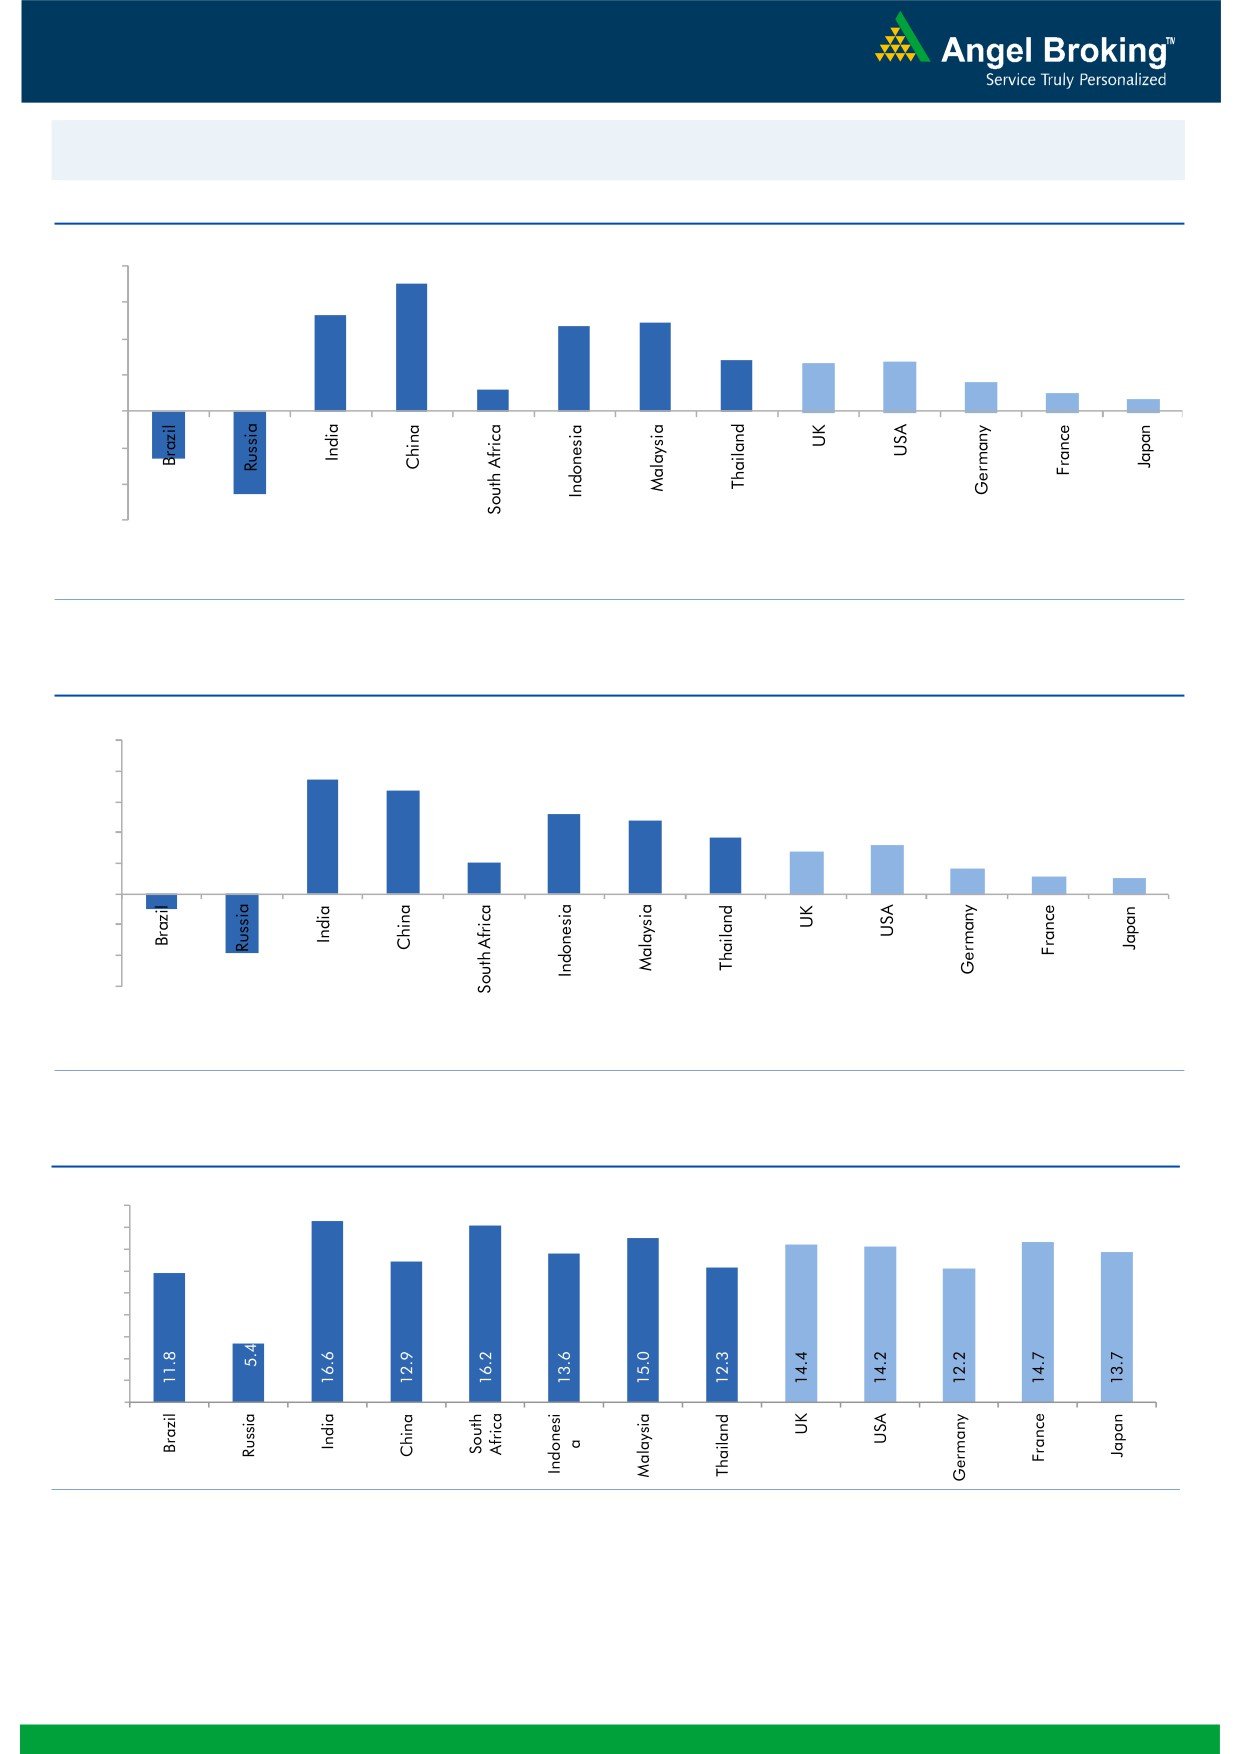
Global watch
Exhibit 1: Latest quarterly GDP Growth (%, yoy) across select developing and developed countries
(%)
8.0
7.0
6.0
5.3
4.9
4.7
4.0
2.8
2.6
2.7
1.6
2.0
1.2
1.0
0.7
(2.6)
(4.6)
-
(2.0)
(4.0)
(6.0)
Source: Bloomberg, Angel Research
Exhibit 2: 2015 GDP Growth projection by IMF (%, yoy) across select developing and developed countries
(%)
10.0
7.5
8.0
6.8
5.2
6.0
4.8
3.7
3.1
4.0
2.7
2.0
1.6
1.2
1.0
2.0
(3.8)
(1.0)
-
(2.0)
(4.0)
(6.0)
Source: IMF, Angel Research
Exhibit 3: One year forward P-E ratio across select developing and developed countries
(x)
18.0
16.0
14.0
12.0
10.0
8.0
6.0
4.0
2.0
-
Source: Bloomberg, Angel Research
Market Outlook
September 7, 2015
Exhibit 4: Relative performance of indices across globe
Returns (%)
Country
Name of index
Closing price
1M
3M
1YR
Brazil
Bovespa
46,498
(7.5)
(12.2)
(24.9)
Russia
Micex
1,698
0.3
2.8
17.2
India
Nifty
7,655
(10.7)
(4.8)
(3.8)
China
Shanghai Composite
3,160
(15.1)
(35.5)
44.5
South Africa
Top 40
43,547
(7.2)
(4.5)
(6.1)
Mexico
Mexbol
42,743
(4.9)
(4.0)
(7.7)
Indonesia
LQ45
750
(10.7)
(18.3)
(16.0)
Malaysia
KLCI
1,589
(7.8)
(8.7)
(14.8)
Thailand
SET 50
892
(5.2)
(8.6)
(14.9)
USA
Dow Jones
16,102
(8.2)
(9.8)
(5.9)
UK
FTSE
6,043
(9.6)
(11.2)
(11.6)
Japan
Nikkei
17,792
(13.7)
(13.0)
14.5
Germany
DAX
10,038
(13.7)
(9.3)
3.2
France
CAC
4,523
(13.0)
(6.9)
1.6
Source: Bloomberg, Angel Research
Market Outlook
September 07, 2015
Stock Watch
Company Name
Reco
CMP
Target
Mkt Cap
Sales ( Čcr )
OPM(%)
EPS (Č)
PER(x)
P/BV(x)
RoE(%)
EV/Sales(x)
(Č)
Price ( Č)
( Č cr )
FY16E FY17E
FY16E
FY17E
FY16E
FY17E
FY16E
FY17E
FY16E
FY17E
FY16E
FY17E
FY16E
FY17E
Agri / Agri Chemical
Rallis
Neutral
210
-
4,084
2,075
2,394
14.4
14.4
9.5
11.0
22.1
19.1
4.4
3.8
21.1
21.3
2.0
1.7
United Phosphorus
Neutral
530
-
22,703
13,698
15,752
17.6
17.6
32.1
38.5
16.5
13.8
3.2
2.7
21.4
21.3
1.8
1.5
Auto & Auto Ancillary
Ashok Leyland
Accumulate
85
97
24,204
18,186
21,529
10.8
11.2
3.3
4.5
25.8
18.9
4.4
4.1
17.3
21.6
1.3
1.1
Bajaj Auto
Accumulate
2,208
2,438
63,888
23,544
27,245
19.8
19.8
127.0
143.4
17.4
15.4
5.3
4.5
30.3
29.4
2.3
1.9
Eicher Motors
Buy
18,178
22,859
49,339
11,681
15,550
15.3
16.9
358.5
564.3
50.7
32.2
15.2
11.3
29.8
34.9
4.2
3.1
Hero Motocorp
Accumulate
2,293
2,672
45,779
28,500
32,764
14.1
14.3
146.9
167.0
15.6
13.7
5.9
5.0
37.8
36.5
1.5
1.3
L G Balakrishnan & Bros Neutral
469
-
736
1,254
1,394
11.6
11.8
35.9
41.7
13.1
11.3
1.8
1.6
13.5
13.8
0.7
0.6
Mahindra and Mahindra Buy
1,112
1,383
69,078
38,337
43,069
13.0
13.4
52.9
63.5
21.0
17.5
3.2
2.8
15.0
15.9
1.5
1.3
Maruti
Buy
4,069
4,735
122,922
58,102
68,587
16.7
16.9
182.0
225.5
22.4
18.1
4.4
3.8
19.9
21.0
1.9
1.5
Minda Industries
Buy
502
652
796
2,567
2,965
7.3
8.0
38.8
54.3
12.9
9.2
1.9
1.6
14.4
16.8
0.4
0.3
Rane Brake Lining
Buy
279
366
221
454
511
11.1
11.4
23.8
28.1
11.7
9.9
1.7
1.5
14.2
15.3
0.6
0.6
Setco Automotive
Neutral
220
-
588
594
741
12.7
13.7
8.4
15.8
26.2
13.9
2.7
2.4
10.4
16.9
1.4
1.2
Tata Motors
Buy
323
391
93,213
264,038
297,882
13.8
13.9
34.5
38.9
9.4
8.3
1.6
1.3
17.6
16.8
0.5
0.5
TVS Motor
Neutral
223
-
10,594
11,702
13,713
6.8
7.7
10.1
14.5
22.1
15.4
5.4
4.4
24.5
28.3
0.9
0.7
Amara Raja Batteries
Neutral
946
-
16,161
5,101
6,224
17.8
17.6
31.1
39.2
30.4
24.1
7.6
6.0
24.8
24.8
3.2
2.6
Exide Industries
Accumulate
148
159
12,567
7,363
8,247
13.7
14.5
6.6
7.7
22.4
19.2
2.8
2.6
12.6
13.3
1.5
1.3
Apollo Tyres
Neutral
170
-
8,636
12,576
12,978
16.8
16.1
22.3
19.9
7.6
8.5
1.3
1.1
17.2
13.4
0.8
0.8
Ceat
Neutral
1,092
-
4,416
6,041
6,597
14.3
14.2
101.5
116.6
10.8
9.4
2.2
1.8
20.0
19.1
0.9
0.8
JK Tyres
Buy
102
129
2,303
7,446
7,669
15.2
14.0
19.6
18.4
5.2
5.5
1.3
1.1
25.2
19.5
0.7
0.6
Swaraj Engines
Neutral
858
-
1,066
593
677
14.5
14.8
51.2
60.8
16.8
14.1
3.9
3.5
23.3
24.8
1.7
1.4
Subros
Neutral
80
-
478
1,268
1,488
11.6
11.9
3.7
6.6
21.6
12.1
1.4
1.3
6.8
11.4
0.7
0.6
Indag Rubber
Neutral
175
-
459
283
329
17.0
17.2
13.0
15.4
13.5
11.4
2.9
2.5
21.8
21.6
1.4
1.1
Capital Goods
ACE
Neutral
38
-
374
660
839
4.7
8.2
1.0
3.9
37.9
9.7
1.2
1.1
3.2
11.3
0.7
0.6
BEML
Neutral
1,214
-
5,057
3,277
4,006
6.0
8.9
29.2
64.3
41.6
18.9
2.3
2.1
5.7
11.7
1.6
1.3
BGR Energy
Neutral
103
-
743
3,615
3,181
9.5
9.4
16.7
12.4
6.2
8.3
0.6
0.6
10.0
7.0
0.6
0.8
BHEL
Neutral
207
-
50,580
33,722
35,272
10.8
11.7
10.5
14.2
19.7
14.6
1.5
1.4
7.0
9.0
1.6
1.5
Blue Star
Accumulate
344
387
3,094
3,649
4,209
5.0
5.9
9.2
14.7
37.6
23.4
6.8
6.4
9.1
17.5
0.9
0.8
Crompton Greaves
Buy
162
204
10,166
13,484
14,687
4.9
6.2
4.5
7.1
36.0
22.9
2.6
2.4
7.2
10.8
0.9
0.8
Inox Wind
Buy
377
505
8,369
4,980
5,943
17.0
17.5
26.6
31.6
14.2
11.9
4.2
3.1
35.0
30.0
1.8
1.5
Market Outlook
September 07, 2015
Stock Watch
Company Name
Reco
CMP
Target
Mkt Cap
Sales ( Čcr )
OPM(%)
EPS (Č)
PER(x)
P/BV(x)
RoE(%)
EV/Sales(x)
(Č)
Price ( Č)
( Č cr )
FY16E
FY17E
FY16E
FY17E
FY16E
FY17E
FY16E
FY17E
FY16E
FY17E
FY16E
FY17E
FY16E
FY17E
Capital Goods
KEC International
Neutral
129
-
3,313
8,791
9,716
6.1
6.8
5.4
8.2
23.9
15.7
2.4
2.2
10.0
14.0
0.6
0.6
Thermax
Neutral
939
-
11,190
6,413
7,525
7.4
8.5
30.5
39.3
30.8
23.9
4.7
4.1
15.0
17.0
1.8
1.5
Cement
ACC
Accumulate
1,351
1,548
25,362
11,856
14,092
14.5
17.8
47.6
76.1
28.4
17.8
2.9
2.7
10.6
15.7
2.0
1.6
Ambuja Cements
Accumulate
212
233
32,885
10,569
12,022
20.7
22.2
8.7
10.7
24.4
19.8
3.1
2.9
13.0
15.2
2.7
2.4
India Cements
Buy
70
112
2,144
4,716
5,133
15.9
16.9
3.7
7.5
18.9
9.3
0.7
0.7
3.8
7.3
0.8
0.6
JK Cement
Buy
610
767
4,265
4,056
4,748
14.5
17.0
22.6
41.1
27.0
14.8
2.4
2.2
9.3
15.3
1.5
1.2
J K Lakshmi Cement
Buy
355
430
4,180
2,947
3,616
16.7
19.9
11.5
27.2
30.9
13.1
2.9
2.5
9.8
20.8
1.8
1.4
Mangalam Cements
Neutral
209
-
557
1,053
1,347
10.5
13.3
8.4
26.0
24.8
8.0
1.1
1.0
4.3
12.5
0.9
0.7
Orient Cement
Accumulate
165
183
3,380
1,854
2,524
21.2
22.2
7.7
11.1
21.4
14.9
3.1
2.7
13.3
15.7
2.6
1.8
Ramco Cements
Accumulate
318
350
7,578
4,036
4,545
20.8
21.3
15.1
18.8
21.1
16.9
2.6
2.3
12.9
14.3
2.4
2.0
Shree Cement^
Neutral
10,825
-
37,713
7,150
8,742
26.7
28.6
228.0
345.5
47.5
31.3
7.0
5.9
15.7
20.3
5.1
4.1
UltraTech Cement
Accumulate
2,917
3,282
80,042
27,562
31,548
20.4
22.3
111.9
143.3
26.1
20.4
3.7
3.2
15.2
16.8
2.9
2.5
Construction
ITNL
Neutral
88
-
2,170
7,360
8,825
34.0
35.9
1.0
5.0
88.0
17.6
0.4
0.4
0.3
1.4
3.7
3.6
KNR Constructions
Neutral
545
-
1,531
915
1,479
14.3
13.9
20.3
37.2
26.8
14.6
2.5
2.1
9.6
15.6
1.8
1.2
Larsen & Toubro
Buy
1,534
2,013
142,750
68,920
82,446
10.9
11.5
57.0
73.0
26.9
21.0
2.5
2.3
13.6
15.5
2.3
1.9
Gujarat Pipavav Port
Neutral
180
-
8,683
721
784
53.1
53.6
8.2
9.1
21.9
19.7
3.5
2.9
20.0
18.3
11.4
10.1
MBL Infrastructures
Buy
231
360
958
2,313
2,797
12.2
14.6
19.0
20.0
12.2
11.6
1.3
1.2
11.3
10.6
1.1
1.0
Nagarjuna Const.
Neutral
58
-
3,233
7,892
8,842
8.3
9.1
2.4
5.3
24.2
11.0
1.0
0.9
4.2
8.6
0.7
0.6
PNC Infratech
Neutral
478
-
2,455
1,798
2,132
13.2
13.5
22.0
30.0
21.8
16.0
2.0
1.8
11.5
11.4
1.5
1.2
Simplex Infra
Neutral
279
-
1,382
6,241
7,008
10.4
10.7
20.0
36.0
14.0
7.8
1.1
1.0
6.8
11.1
0.7
0.6
Financials
Allahabad Bank
Neutral
77
-
4,377
8,859
9,817
3.0
3.0
23.7
30.1
3.2
2.5
0.4
0.3
10.6
12.3
-
-
Axis Bank
Buy
469
704
111,434
26,522
31,625
3.6
3.6
36.2
45.4
13.0
10.3
2.5
2.2
18.2
19.6
-
-
Bank of Baroda
Neutral
174
-
38,524
18,934
21,374
2.0
2.0
13.2
15.1
13.2
11.5
1.0
0.9
7.1
7.7
-
-
Bank of India
Neutral
129
-
8,564
17,402
20,003
2.0
2.1
40.3
50.7
3.2
2.5
0.3
0.3
9.0
10.4
-
-
Canara Bank
Neutral
257
-
13,215
15,805
17,745
2.0
2.2
64.3
73.5
4.0
3.5
0.5
0.4
10.8
11.3
-
-
Dena Bank
Neutral
39
-
2,208
3,580
4,040
2.1
2.2
8.4
10.9
4.7
3.6
0.4
0.3
6.8
8.4
-
-
Federal Bank
Neutral
58
-
9,889
3,522
4,045
3.2
3.2
12.2
14.1
4.7
4.1
0.6
0.5
12.9
13.4
-
-
HDFC
Neutral
1,142
-
180,038
11,198
13,321
3.5
3.5
45.1
53.7
25.3
21.3
5.2
4.7
27.2
28.2
-
-
HDFC Bank
Buy
996
1,255
250,306
38,629
47,500
4.5
4.7
52.6
66.4
18.9
15.0
3.5
2.9
19.6
21.2
-
-
Market Outlook
September 07, 2015
Stock Watch
Company Name
Reco
CMP
Target
Mkt Cap
Sales ( Čcr )
OPM(%)
EPS (Č)
PER(x)
P/BV(x)
RoE(%)
EV/Sales(x)
(Č)
Price ( Č)
( Č cr )
FY16E FY17E
FY16E
FY17E
FY16E
FY17E
FY16E
FY17E
FY16E
FY17E
FY16E
FY17E
FY16E
FY17E
Financials
ICICI Bank
Buy
258
373
149,698
36,037
41,647
3.5
3.6
22.9
26.7
11.2
9.7
1.9
1.6
15.7
15.9
-
-
IDBI Bank
Neutral
56
-
8,910
9,806
11,371
1.7
1.9
10.0
16.3
5.6
3.4
0.4
0.4
6.8
10.4
-
-
Indian Bank
Neutral
126
-
6,064
6,454
7,321
2.5
2.6
26.4
33.3
4.8
3.8
0.4
0.4
8.1
9.6
-
-
LIC Housing Finance
Buy
413
570
20,865
2,934
3,511
2.3
2.3
30.9
36.8
13.4
11.2
2.2
1.9
16.8
17.5
-
-
Oriental Bank
Neutral
125
-
3,733
7,930
8,852
2.5
2.5
51.8
57.1
2.4
2.2
0.3
0.2
9.3
9.5
-
-
Punjab Natl.Bank
Neutral
130
-
24,183
24,160
27,777
2.9
3.0
18.5
24.6
7.1
5.3
0.7
0.6
8.8
10.8
-
-
South Ind.Bank
Neutral
20
-
2,673
1,999
2,249
2.4
2.4
3.5
4.0
5.7
4.9
0.7
0.6
12.6
13.1
-
-
St Bk of India
Buy
225
309
170,278
86,900
100,550
3.1
3.1
22.1
27.7
10.2
8.1
1.3
1.1
12.7
14.3
-
-
Union Bank
Neutral
157
-
9,966
12,995
14,782
2.4
2.4
32.3
40.9
4.9
3.8
0.6
0.5
10.7
12.3
-
-
Vijaya Bank
Neutral
35
-
3,020
3,474
3,932
1.8
1.9
5.9
7.2
6.0
4.9
0.5
0.5
8.1
9.3
-
-
Yes Bank
Buy
646
951
27,046
7,006
8,825
3.1
3.3
61.4
77.1
10.5
8.4
2.0
1.6
20.1
21.3
-
-
FMCG
Asian Paints
Neutral
813
-
77,935
16,553
19,160
16.0
16.2
17.7
21.5
46.0
37.8
12.2
11.0
29.4
31.2
4.5
3.9
Britannia
Neutral
2,985
-
35,818
8,065
9,395
9.6
10.2
47.2
65.5
63.2
45.6
21.0
19.9
38.3
41.2
4.3
3.7
Colgate
Neutral
1,887
-
25,660
4,836
5,490
19.5
19.7
48.5
53.2
38.9
35.5
28.5
24.8
99.8
97.5
5.3
4.7
Dabur India
Neutral
285
-
50,096
9,370
10,265
17.1
17.2
7.3
8.1
38.9
35.2
11.7
9.5
33.7
30.6
5.1
4.7
GlaxoSmith Con*
Neutral
6,036
-
25,383
4,919
5,742
17.2
17.4
168.3
191.2
35.9
31.6
10.2
8.7
28.8
28.9
4.8
4.1
Godrej Consumer
Neutral
1,233
-
41,993
10,168
12,886
16.1
16.1
32.1
38.4
38.4
32.1
7.8
7.2
19.7
21.0
4.5
3.6
HUL
Neutral
830
-
179,676
34,940
38,957
17.5
17.7
20.8
24.7
39.9
33.6
44.4
35.5
110.5
114.2
5.0
4.4
ITC
Buy
316
409
253,901
41,068
45,068
37.8
37.4
13.9
15.9
22.7
19.9
7.6
6.7
34.1
33.8
5.9
5.3
Marico
Neutral
404
-
26,039
6,551
7,766
15.7
16.0
10.4
12.5
38.9
32.3
11.3
9.4
33.2
32.4
3.9
3.3
Nestle*
Accumulate
5,995
6,646
57,796
11,291
12,847
22.2
22.3
158.9
184.6
37.7
32.5
19.7
17.7
55.0
57.3
4.9
4.3
Tata Global
Buy
120
152
7,580
8,635
9,072
9.8
9.9
6.5
7.6
18.5
15.8
1.8
1.8
6.8
7.4
0.8
0.8
IT
HCL Tech^
Buy
941
1,132
132,364
42,038
47,503
23.5
23.5
56.4
62.9
16.7
15.0
3.9
3.0
23.2
19.8
2.8
2.2
Infosys
Buy
1,074
1,306
246,646
60,250
66,999
28.0
28.0
58.3
63.7
18.4
16.9
3.9
3.3
20.9
19.7
3.5
3.0
TCS
Buy
2,549
3,168
499,368
108,420
123,559
28.8
28.7
127.2
143.9
20.0
17.7
8.0
7.4
39.9
41.8
4.3
3.7
Tech Mahindra
Buy
528
646
50,788
25,566
28,890
16.0
17.0
26.3
31.9
20.1
16.6
3.6
3.1
17.9
18.6
1.8
1.5
Wipro
Buy
554
719
136,744
52,414
58,704
23.7
23.8
38.4
42.3
14.4
13.1
2.8
2.5
19.5
18.0
2.2
1.8
Media
D B Corp
Buy
309
356
5,680
2,241
2,495
27.8
27.9
21.8
25.6
14.2
12.1
3.7
3.3
26.7
28.5
2.5
2.2
HT Media
Neutral
77
-
1,790
2,495
2,603
11.2
11.2
7.3
8.6
10.5
8.9
0.8
0.8
7.4
8.1
0.2
0.2
Market Outlook
September 07, 2015
Stock Watch
Company Name
Reco
CMP
Target
Mkt Cap
Sales ( Čcr )
OPM(%)
EPS (Č)
PER(x)
P/BV(x)
RoE(%)
EV/Sales(x)
(Č)
Price ( Č)
( Č cr )
FY16E FY17E
FY16E
FY17E
FY16E
FY17E
FY16E
FY17E
FY16E
FY17E
FY16E
FY17E
FY16E
FY17E
Media
Jagran Prakashan
Buy
136
156
4,441
1,939
2,122
26.0
26.0
8.3
9.2
16.4
14.8
2.8
2.5
17.5
17.1
2.2
2.0
Sun TV Network
Neutral
387
-
15,263
2,779
3,196
70.2
70.5
22.8
27.3
17.0
14.2
4.2
3.8
26.7
28.3
5.0
4.4
Hindustan Media
Buy
217
292
1,593
920
1,031
20.0
20.0
19.2
20.9
11.3
10.4
1.9
1.6
16.4
15.3
1.3
1.1
Ventures
Metals & Mining
Coal India
Buy
347
400
219,020
72,015
78,415
21.2
21.5
21.7
25.3
16.0
13.7
5.4
5.3
33.1
39.1
2.3
2.1
Hind. Zinc
Neutral
132
-
55,795
15,546
16,821
47.5
49.0
19.7
20.3
6.7
6.5
1.1
1.0
17.2
16.6
1.2
0.8
Hindalco
Neutral
74
-
15,250
112,328
119,817
7.7
7.9
16.3
20.1
4.5
3.7
0.3
0.3
8.0
8.5
0.6
0.5
JSW Steel
Neutral
903
-
21,817
48,125
53,595
18.8
21.0
46.9
97.5
19.2
9.3
0.9
0.9
4.4
9.5
1.3
1.1
NMDC
Neutral
98
-
39,033
12,544
13,330
59.5
59.7
16.3
16.5
6.0
6.0
1.1
1.0
5.1
9.9
1.9
1.9
SAIL
Neutral
47
-
19,515
56,365
63,383
6.9
8.0
7.1
8.2
6.6
5.8
0.4
0.4
7.0
7.1
0.9
0.8
Vedanta
Neutral
93
-
27,646
81,842
88,430
30.6
32.8
20.2
25.7
4.6
3.6
0.3
0.3
7.5
8.5
0.7
0.5
Tata Steel
Neutral
219
-
21,265
136,805
149,228
11.3
11.9
26.4
36.8
8.3
6.0
0.7
0.6
6.0
8.0
0.7
0.6
Oil & Gas
Cairn India
Neutral
147
-
27,495
12,617
14,513
33.7
40.0
25.5
27.7
5.8
5.3
0.4
0.4
7.4
7.7
0.8
0.6
GAIL
Neutral
281
-
35,632
75,595
85,554
8.6
8.0
31.8
36.1
8.8
7.8
1.0
0.9
10.7
11.4
0.6
0.5
ONGC
Neutral
226
-
193,012
174,773
192,517
22.7
24.8
34.6
38.2
6.5
5.9
0.9
0.9
14.2
14.9
1.2
1.1
Petronet LNG
Buy
176
210
13,181
39,007
40,785
3.8
4.2
9.2
11.0
19.2
16.0
2.1
2.0
11.6
12.7
0.4
0.4
Indian Oil Corp
Buy
409
455
99,267
359,607
402,760
5.9
6.1
42.5
48.7
9.6
8.4
1.3
1.1
14.1
14.4
0.4
0.3
Reliance Industries
Accumulate
836
930
270,580
339,083
384,014
7.8
9.5
75.7
94.5
11.1
8.8
1.1
1.1
10.7
12.2
1.1
1.0
Pharmaceuticals
Alembic Pharma
Neutral
679
-
12,797
2,601
3,115
21.2
20.2
20.8
23.9
32.6
28.4
10.5
7.9
37.2
31.8
5.2
4.2
Aurobindo Pharma
Buy
723
872
42,209
14,923
17,162
23.0
23.0
38.2
43.6
18.9
16.6
5.8
4.4
36.0
30.2
3.2
2.7
Aventis*
Neutral
3,906
-
8,996
2,156
2,455
15.1
16.8
109.7
133.9
35.6
29.2
4.9
4.0
18.4
22.5
3.8
3.2
Cadila Healthcare
Neutral
1,817
-
37,204
10,224
11,840
20.0
21.0
71.0
85.6
25.6
21.2
6.9
5.4
30.1
28.5
3.8
3.2
Cipla
Neutral
649
-
52,154
14,051
16,515
20.4
18.7
26.6
28.4
24.4
22.9
4.1
3.5
18.2
16.5
3.7
3.1
Dr Reddy's
Neutral
4,056
-
69,152
17,903
20,842
22.7
22.8
160.5
189.5
25.3
21.4
5.1
4.2
22.2
21.7
4.0
3.3
Dishman Pharma
Accumulate
254
290
2,049
1,716
1,888
20.2
20.2
16.3
21.6
15.6
11.8
1.5
1.3
9.7
11.7
1.4
1.1
GSK Pharma*
Neutral
3,364
-
28,495
2,870
3,158
20.0
22.1
59.5
68.3
56.5
49.3
16.7
17.1
28.5
34.3
9.4
8.6
Indoco Remedies
Neutral
337
-
3,102
1,088
1,262
18.2
18.2
13.1
15.5
25.7
21.7
5.0
4.2
21.2
21.1
2.9
2.5
Ipca labs
Neutral
761
-
9,605
3,507
4,078
17.6
18.6
25.8
32.0
29.5
23.8
3.8
3.3
13.8
14.9
3.1
2.7
Lupin
Neutral
1,859
-
83,682
14,864
17,244
26.9
26.9
62.1
71.1
29.9
26.2
7.3
5.8
27.4
24.6
5.4
4.5
Sun Pharma
Accumulate
859
950
206,605
28,163
32,610
25.8
30.7
17.4
26.9
49.3
31.9
4.7
4.1
13.0
16.6
7.1
5.9
Market Outlook
September 07, 2015
Stock Watch
Company Name
Reco
CMP
Target
Mkt Cap
Sales ( Čcr )
OPM(%)
EPS (Č)
PER(x)
P/BV(x)
RoE(%)
EV/Sales(x)
(Č)
Price ( Č)
( Č cr )
FY16E FY17E
FY16E
FY17E
FY16E
FY17E
FY16E
FY17E
FY16E
FY17E
FY16E
FY17E
FY16E
FY17E
Power
Tata Power
Neutral
57
-
15,295
38,302
38,404
14.1
13.1
5.1
6.0
11.0
9.5
1.1
1.0
9.2
10.3
1.3
1.3
NTPC
Buy
114
157
94,369
87,064
98,846
23.5
23.5
11.7
13.2
9.8
8.7
1.1
1.0
11.4
12.1
2.1
1.9
Power Grid
Buy
123
170
64,558
20,702
23,361
86.7
86.4
12.1
13.2
10.2
9.3
1.5
1.3
15.6
15.1
8.1
7.5
Telecom
Bharti Airtel
Neutral
350
-
139,849
101,748
109,191
32.1
31.7
12.0
12.5
29.2
28.0
2.0
1.9
6.9
6.7
2.0
1.8
Idea Cellular
Neutral
149
-
53,648
34,282
36,941
32.0
31.5
5.9
6.2
25.3
24.0
2.3
2.1
9.9
9.3
2.2
2.1
zOthers
Abbott India
Neutral
5,228
-
11,110
2,715
3,153
14.5
14.1
134.3
152.2
38.9
34.3
9.7
8.0
27.4
25.6
3.6
3.1
Bajaj Electricals
Buy
236
341
2,385
4,719
5,287
5.2
5.8
8.6
12.7
27.6
18.7
3.2
2.8
11.4
14.8
0.5
0.5
Finolex Cables
Neutral
234
-
3,577
2,728
3,036
10.8
11.0
14.4
16.8
16.2
14.0
2.5
2.1
15.2
15.3
1.1
0.9
Goodyear India*
Buy
534
655
1,232
1,953
1,766
12.4
12.0
67.4
59.6
7.9
9.0
2.0
1.7
27.7
20.2
0.4
0.4
Hitachi
Neutral
1,313
-
3,571
1,806
2,112
9.0
9.2
28.6
29.1
45.9
45.2
11.4
9.2
28.1
22.6
2.1
1.8
Jyothy Laboratories
Neutral
321
-
5,807
1,620
1,847
11.5
11.5
7.3
8.5
44.0
37.9
5.7
5.3
13.3
14.4
3.3
2.8
MRF
Accumulate
38,742
43,575
16,431
20,727
14,841
19.3
18.6
4,905.8
3,351.9
7.9
11.6
2.5
2.1
37.6
19.6
0.8
1.0
Page Industries
Neutral
14,046
-
15,667
1,929
2,450
19.8
20.1
229.9
299.0
61.1
47.0
27.0
18.7
52.1
47.1
8.3
6.5
Relaxo Footwears
Neutral
498
-
5,974
1,767
2,152
12.3
12.5
19.3
25.1
25.9
19.9
6.3
4.9
27.7
27.8
3.5
2.9
Siyaram Silk Mills
Accumulate
1,032
1,221
967
1,653
1,873
11.7
12.2
99.3
122.1
10.4
8.5
1.9
1.6
19.5
20.2
0.8
0.7
Styrolution ABS India*
Neutral
760
-
1,336
1,271
1,440
8.6
9.2
32.0
41.1
23.7
18.5
2.4
2.2
10.7
12.4
1.0
0.9
Tree House
Buy
385
449
1,630
259
324
56.8
56.8
17.0
21.7
22.6
17.8
2.3
2.1
10.1
11.5
6.3
5.2
TVS Srichakra
Buy
2,416
3,210
1,850
2,127
2,388
15.2
14.9
237.7
267.5
10.2
9.0
4.3
3.1
51.7
39.8
1.0
0.8
HSIL
Buy
243
434
1,758
2,085
2,436
18.5
18.6
21.7
28.9
11.2
8.4
1.1
1.0
10.0
12.1
1.0
0.8
Kirloskar Engines India
Accumulate
269
297
3,891
2,634
3,252
10.1
12.0
10.9
17.4
24.7
15.4
2.8
2.5
11.4
16.8
1.1
0.9
Ltd
M M Forgings
Buy
569
797
687
563
671
22.1
22.9
51.0
66.5
11.2
8.6
2.3
1.9
23.1
24.1
1.4
1.1
Banco Products (India)
Neutral
114
-
813
1,208
1,353
11.0
12.3
10.8
14.5
10.6
7.9
1.2
1.1
11.9
14.5
0.7
0.6
Competent Automobiles Neutral
144
-
88
1,007
1,114
3.1
3.1
23.7
28.2
6.1
5.1
0.9
0.7
13.9
14.6
0.1
0.1
Nilkamal
Neutral
957
-
1,428
1,948
2,147
10.6
10.3
60.0
67.0
16.0
14.3
2.5
2.1
16.8
16.1
0.8
0.7
Visaka Industries
Buy
138
166
218
1,158
1,272
8.6
9.5
23.7
32.7
5.8
4.2
0.6
0.5
10.1
12.5
0.4
0.3
Transport Corporation of
Buy
229
293
1,740
2,830
3,350
8.8
9.0
14.4
18.3
15.9
12.5
2.5
2.1
15.4
17.1
0.8
0.7
India
Elecon Engineering
Buy
68
87
739
1,452
1,596
14.0
14.7
4.4
6.2
15.4
10.9
1.3
1.2
8.6
11.2
0.8
0.7
Surya Roshni
Buy
116
183
509
2,992
3,223
8.3
8.5
14.7
18.3
7.9
6.4
0.7
0.7
9.8
11.0
0.5
0.4
MT Educare
Buy
126
169
501
286
366
18.3
17.7
7.7
9.4
16.3
13.4
3.4
3.0
20.2
21.1
1.7
1.3
Market Outlook
September 07, 2015
Stock Watch
Company Name
Reco
CMP
Target Mkt Cap
Sales ( Čcr )
OPM(%)
EPS (Č)
PER(x)
P/BV(x)
RoE(%)
EV/Sales(x)
(Č)
Price ( Č)
( Č cr )
FY16E FY17E FY16E FY17E FY16E FY17E FY16E FY17E FY16E FY17E FY16E FY17E FY16E FY17E
zOthers
Radico Khaitan
Buy
85
112
1,129
1,565
1,687
11.9
12.4
5.4
6.6
15.7
12.9
1.3
1.2
8.0
9.0
1.2
1.2
Garware Wall Ropes
Buy
294
390
644
875
983
10.4
10.6
23.1
27.8
12.7
10.6
1.8
1.6
14.1
14.8
0.7
0.6
Wonderla Holidays
Buy
275
322
1,555
206
308
44.0
43.6
9.0
12.9
30.6
21.3
4.2
3.8
13.7
17.8
7.4
4.9
Linc Pen & Plastics
Buy
148
185
218
340
371
8.3
8.9
10.8
13.2
13.7
11.2
2.2
1.9
16.0
17.1
0.7
0.6
Source: Company, Angel Research; Note: *December year end; #September year end; &October year end; Price as on September 04, 2015
Market Outlook
September 07, 2015
Research Team Tel: 022 - 39357800
DISCLAIMER
Angel Broking Private Limited (hereinafter referred to as “Angel”) is a registered Member of National Stock Exchange of India Limited,
Bombay Stock Exchange Limited and MCX Stock Exchange Limited. It is also registered as a Depository Participant with CDSL and
Portfolio Manager with SEBI. It also has registration with AMFI as a Mutual Fund Distributor. Angel Broking Private Limited is a registered
entity with SEBI for Research Analyst in terms of SEBI (Research Analyst) Regulations, 2014 vide registration number INH000000164.
Angel or its associates has not been debarred/ suspended by SEBI or any other regulatory authority for accessing /dealing in securities
Market. Angel or its associates including its relatives/analyst do not hold any financial interest/beneficial ownership of more than 1% in
the company covered by Analyst. Angel or its associates/analyst has not received any compensation / managed or co-managed public
offering of securities of the company covered by Analyst during the past twelve months. Angel/analyst has not served as an officer,
director or employee of company covered by Analyst and has not been engaged in market making activity of the company covered by
Analyst.
This document is solely for the personal information of the recipient, and must not be singularly used as the basis of any investment
decision. Nothing in this document should be construed as investment or financial advice. Each recipient of this document should make
such investigations as they deem necessary to arrive at an independent evaluation of an investment in the securities of the companies
referred to in this document (including the merits and risks involved), and should consult their own advisors to determine the merits and
risks of such an investment.
Reports based on technical and derivative analysis center on studying charts of a stock's price movement, outstanding positions and
trading volume, as opposed to focusing on a company's fundamentals and, as such, may not match with a report on a company's
fundamentals.
The information in this document has been printed on the basis of publicly available information, internal data and other reliable sources
believed to be true, but we do not represent that it is accurate or complete and it should not be relied on as such, as this document is for
general guidance only. Angel Broking Pvt. Limited or any of its affiliates/ group companies shall not be in any way responsible for any
loss or damage that may arise to any person from any inadvertent error in the information contained in this report. Angel Broking Pvt.
Limited has not independently verified all the information contained within this document. Accordingly, we cannot testify, nor make any
representation or warranty, express or implied, to the accuracy, contents or data contained within this document. While Angel Broking
Pvt. Limited endeavors to update on a reasonable basis the information discussed in this material, there may be regulatory, compliance,
or other reasons that prevent us from doing so.
This document is being supplied to you solely for your information, and its contents, information or data may not be reproduced,
redistributed or passed on, directly or indirectly.
Neither Angel Broking Pvt. Limited, nor its directors, employees or affiliates shall be liable for any loss or damage that may arise from or
in connection with the use of this information.
Note: Please refer to the important ‘Stock Holding Disclosure' report on the Angel website (Research Section). Also, please refer to the
latest update on respective stocks for the disclosure status in respect of those stocks. Angel Broking Pvt. Limited and its affiliates may have
investment positions in the stocks recommended in this report.