Market Outlook
April 7, 2016
Market Cues
Domestic Indices
Chg (%)
(Pts)
(Close)
Indian market is expected to open on a flat note tracking the SGX Nifty and Asian
BSE Sensex
0.1
17
24,901
markets.
Nifty
0.1
11
7,614
U.S. markets posted solid gains on Wednesday, aided by a climb in oil prices and a
Mid Cap
0.6
63
10,574
surge in healthcare stocks.
Small Cap
0.9
96
10,642
Bankex
(0.4)
(78)
17,780
European markets ended Wednesday's choppy trading session with modest gains.
The markets received a boost from rising crude oil prices and the strong Chinese
service sector report.
Global Indices
Chg (%)
(Pts)
(Close)
Indian markets ended Wednesday's listless session on a flat note as gains in metal
Dow Jones
0.6
113
17,716
shares were offset by losses in banking and IT stocks.
Nasdaq
1.6
77
4,921
News & Result Analysis
FTSE
1.2
70
6,162
Tata Motors to resize diesel engines to skirt New Delhi ban
Nikkei
(0.1)
(17)
15,715
Detailed analysis on Pg2
Hang Seng
0.1
30
20,207
Shanghai Com
(0.1)
(2)
3,051
Investor’s Ready Reckoner
Key Domestic & Global Indicators
Advances / Declines
BSE
NSE
Stock Watch: Latest investment recommendations on 150+ stocks
Advances
1,659
1,077
Refer Pg5 onwards
Declines
912
472
Top Picks
Unchanged
129
63
CMP
Target
Upside
Company
Sector
Rating
(`)
(`)
(%)
Volumes (` Cr)
Amara Raja
Auto & Auto Ancillary
Buy
876
1,040
18.8
HCL Tech
IT
Buy
840
1,038
23.5
BSE
2,208
LIC Housing
Financials
Buy
468
592
26.4
NSE
14,644
Bharat Electronics
Capital Goods
Buy
1,172
1,414
20.7
Navkar Corporation Others
Buy
176
265
50.5
Net Inflows (` Cr)
Net
Mtd
Ytd
More Top Picks on Pg3
FII
405
405
(11,409)
MFs
(233)
(444)
64,251
Key Upcoming Events
Previous
Consensus
Date
Region
Event Description
Reading
Expectations
Top Gainers
Price (`)
Chg (%)
Apr 7 US
Initial Jobless claims
276.00
270.00
Sreinfra
61
11.1
Apr 8 India
Import (yoy %)
5.00
-
Centurytex
580
9.4
Apr 8 India
Export (yoy %)
5.66
-
Apr 8 UK
Industrial Production (YoY)
0.20
-
Hcc
21
8.2
6.(6.(
More Events on Pg4
Aloktext
5
7.6
Jpassociat
8
7.5
Top Losers
Price (`)
Chg (%)
Bharatforg
790
(4.8)
J&Kbank
58
(3.8)
Beml
942
(3.2)
Boschltd
19,221
(2.9)
Ucobank
38
(2.6)
As on April 06, 2016
Market Outlook
April 7, 2016
Tata Motors to resize diesel engines to skirt New Delhi ban
Tata Motors is reducing the size of its diesel engines to skirt a temporary ban on
the sale of large diesel-powered cars in New Delhi as the government seeks to
reduce toxic smog in the capital city. The New Delhi ban on the sale of cars with
diesel engine capacity higher than 2 litres was imposed in December and has hurt
carmakers such as Tata Motors, Mahindra & Mahindra and Toyota Motor Corp.
The ban, initially imposed until March 31, has been extended by the Supreme
Court, which has also indicated that it could levy an additional tax on the sale of
diesel cars. The next hearing is later this month. A lack of clarity on when the ban
might be lifted and carmakers' fears that it could be a precursor to a nationwide
ban has prompted companies to consider ways around the ban.
Now, Tata Motors is re-engineering its existing engines to bring them below 2
litres. The re-engineered engines are only for Tata vehicles and not those made by
its luxury carmaker Jaguar Land Rover.
Mahindra & Mahindra in January launched 1.99 litre diesel engines to counter the
ban and is working on developing petrol engines for most of its vehicles.
Earlier on Wednesday Tata Motors, India's top automaker by revenue, launched its
Tiago hatchback. The car was originally slated to be called the Zica, short for
Zippy Car, but was renamed after the outbreak of the similar-sounding Zika virus.
The car's starting price of 320,000 rupees ($4,800) undercuts similar vehicles by
rivals such as Maruti Suzuki India and Hyundai Motor and is equipped with
features such as an touchscreen infotainment system and rear parking sensors in
an effort to revive sluggish domestic sales.
Economic and Political News
SC raps govt for not giving MGNREGA funds in drought-hit areas
Cabinet okays `1,621 cr project for four-laning of NH-63 in Karnataka
Steel imports surge in March after four months of falls
Corporate News
PNB Housing raises `500cr from IFC to finance Green Projects
Jio soft launch expected by April end; Nationwide by Dec end
Indian Oil Corporation to spend `20,000cr in expansion of its Gujarat
refinery
Market Outlook
April 7, 2016
Top Picks ★★★★★
Large Cap
Market Cap
CMP
Target
Upside
Company
Rationale
(` Cr)
(`)
(`)
(%)
To outpace battery industry growth due to better technological
Amara Raja Batteries
14,958
876
1,040
18.8
products leading to market share gains in both the automotive
OEM and replacement segments.
Uptick in defense capex by government when coupled with
Bharat Electronics
28,118
1,172
1,414
20.7
BELs strong market positioning, indicate that good times are
ahead for BEL.
The stock is trading at attractive valuations and is factoring all
HCL Tech
1,18,500
840
1,038
23.5
the bad news.
Strong visibility for a robust 20% earnings trajectory, coupled
HDFC Bank
2,68,367
1,062
1,262
18.9
with high quality of earnings on account of high quality retail
business and strategic focus on highly rated corporates.
Back on the growth trend, expect a long term growth of 14%
Infosys
2,76,787
1,201
1,347
12.1
to be a US$20bn in FY2020.
LICHF continues to grow its retail loan book at a healthy pace
with improvement in asset quality. We expect the company to
LIC Housing Finance
23,626
468
592
26.4
post a healthy loan book which is likely to reflect in a strong
earnings growth.
Huge bid pipeline of re-development works at Delhi and other
NBCC
11,394
950
1,089
14.7
State Governments and opportunity from Smart City, positions
NBCC to report strong growth, going forward.
Source: Company, Angel Research
Mid Cap
Market Cap
CMP
Target
Upside
Company
Rationale
(` Cr)
(`)
(`)
(%)
Favorable outlook for the AC industry to augur well for
Cooling products business which is out pacing the market
Blue Star
3,547
394
458
16.2
growth. EMPPAC division's profitability to improve once
operating environment turns around.
With a focus on the low and medium income (LMI) consumer
Dewan Housing
5,630
193
270
39.9
segment, the company has increased its presence in tier-II &
III cities where the growth opportunity is immense.
Commencement of new projects, downtrend in the interest
IL&FS Transport
2,487
76
93
23.0
rate cycle, to lead to stock re-rating
Economic recovery to have favourable impact on advertising
& circulation revenue growth. Further, the acquisition of a
Jagran Prakashan
5,195
159
189
18.9
radio business (Radio City) would also boost the company's
revenue growth.
Speedier execution and speedier sales, strong revenue visibilty
Mahindra Lifespace
1,789
436
554
27.1
in short-to-long run, attractive valuations
Massive capacity expansion along with rail advantage at ICD
Navkar Corporation
2,511
176
265
50.5
as well CFS augurs well for the company
Earnings boost on back of stable material prices and
Radico Khaitan
1,253
94
156
65.7
favourable pricing environment. Valuation discount to peers
provides additional comfort
Strong brands and distribution network would boost growth
Siyaram Silk Mills
937
1,000
1,354
35.5
going ahead. Stock currently trades at an inexpensive
valuation.
Source: Company, Angel Research
Market Outlook
April 07, 2016
Key Upcoming Events
Global economic events release calendar
Date
Time
Country
Event Description
Unit
Period
Bloomberg Data
Last Reported Estimated
Apr 7, 2016
6:00PM
US
Initial Jobless claims
Thousands
Apr 2
276.00
270.00
Apr 8, 2016
2:00PM
UK
Industrial Production (YoY)
% Change
Feb
0.20
--
Apr 11, 2016
7:00AM
China
Consumer Price Index (YoY)
% Change
Mar
2.30
2.50
Apr 12, 2016
2:00PM
UK
CPI (YoY)
% Change
Mar
0.30
--
5:30PM
India
Industrial Production YoY
% Change
Feb
(1.50)
--
Apr 13, 2016
US
Producer Price Index (mom)
% Change
Mar
(0.60)
--
China
Exports YoY%
% Change
Mar
(25.40)
9.70
Apr 14, 2016
6:00PM
US
Consumer price index (mom)
% Change
Mar
(0.20)
0.20
2:30PM
Euro Zone
Euro-Zone CPI (YoY)
%
Mar F
(0.10)
--
4:30PM
UK
BOE Announces rates
% Ratio
Apr 14
0.50
0.50
Apr 15, 2016
India
Imports YoY%
% Change
Mar
(5.00)
--
India
Exports YoY%
% Change
Mar
(5.66)
--
6:45PM
US
Industrial Production
%
Mar
(0.52)
(0.10)
7:30AM
China
Industrial Production (YoY)
% Change
Mar
5.90
6.00
7:30AM
China
Real GDP (YoY)
% Change
1Q
6.80
6.70
Apr 18, 2016
12:00PM
India
Monthly Wholesale Prices YoY%
% Change
Mar
(0.91)
--
Apr 19, 2016
6:00PM
US
Housing Starts
Thousands
Mar
1,178.00
--
6:00PM
US
Building permits
Thousands
Mar
1,177.00
--
Apr 20, 2016
7:30PM
US
Existing home sales
Million
Mar
5.08
--
2:00PM
UK
Jobless claims change
% Change
Mar
(18.00)
--
Apr 21, 2016
7:30PM
Euro Zone
Euro-Zone Consumer Confidence
Value
Apr A
(9.70)
--
5:15PM
Euro Zone
ECB announces interest rates
%
Apr 21
--
--
Apr 22, 2016
1:00PM
Germany
PMI Services
Value
Apr P
55.10
--
1:00PM
Germany
PMI Manufacturing
Value
Apr P
50.70
--
Apr 25, 2016
7:30PM
US
New home sales
Thousands
Mar
512.00
--
Apr 26, 2016
7:30PM
US
Consumer Confidence
S.A./ 1985=100
Apr
96.20
--
Apr 27, 2016
2:00PM
UK
GDP (YoY)
% Change
1Q A
2.10
--
11:30PM
US
FOMC rate decision
%
Apr 27
0.50
0.50
Source: Bloomberg, Angel Research
Market Outlook
April 7, 2016
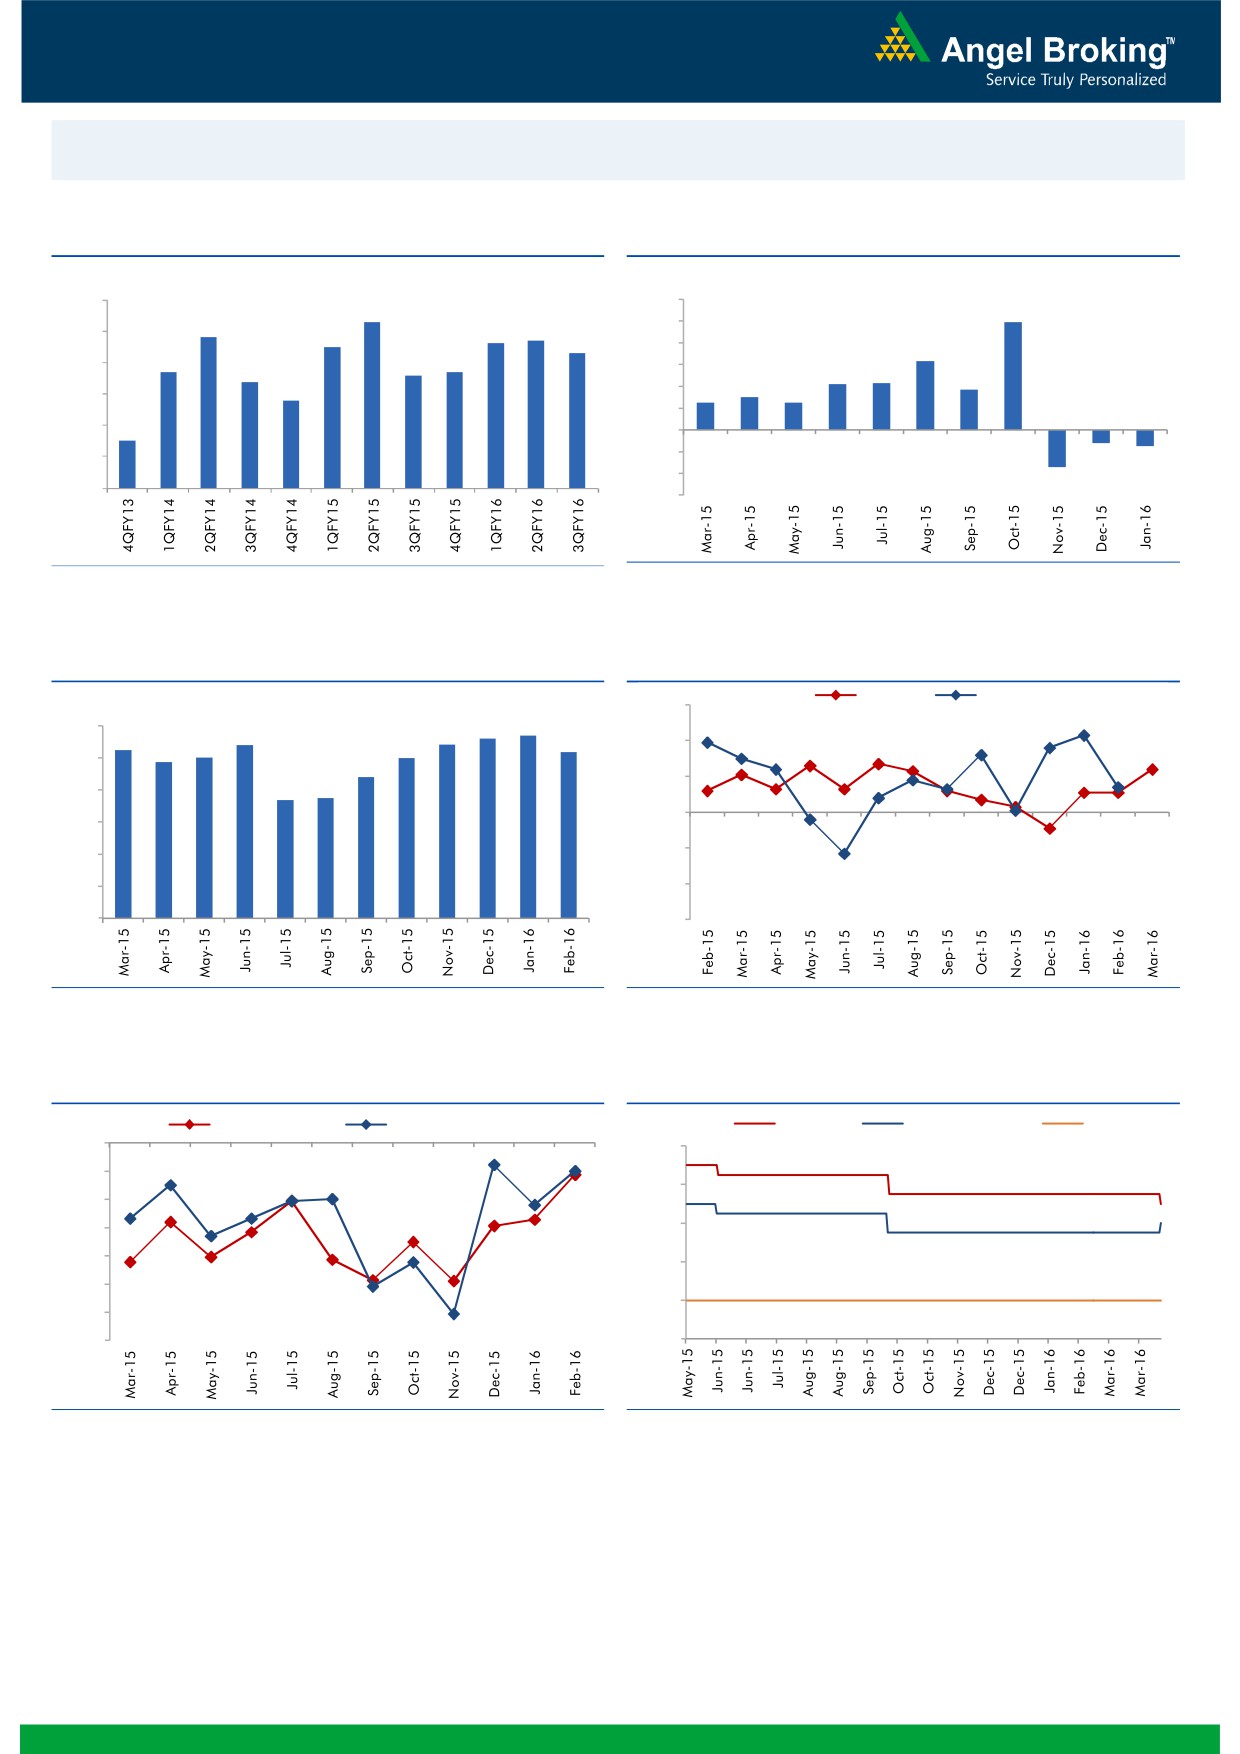
Macro watch
Exhibit 1: Quarterly GDP trends
Exhibit 2: IIP trends
(%)
(%)
9.0
8.3
12.0
9.9
7.8
7.7
10.0
8.0
7.5
7.6
7.3
8.0
6.3
6.7
6.6
6.7
7.0
6.4
6.0
4.2
4.3
3.7
5.8
4.0
2.5
3.0
2.5
6.0
2.0
5.0
4.5
-
4.0
(2.0)
(1.2)
(1.5)
(4.0)
3.0
(3.4)
(6.0)
Source: CSO, Angel Research
Source: MOSPI, Angel Research
Exhibit 3: Monthly CPI inflation trends
Exhibit 4: Manufacturing and services PMI
Mfg. PMI
Services PMI
(%)
56.0
5.6
5.7
6.0
5.4
5.4
5.3
5.2
4.9
5.0
5.0
54.0
5.0
4.4
52.0
3.7
3.7
4.0
50.0
3.0
48.0
2.0
1.0
46.0
-
44.0
Source: MOSPI, Angel Research
Source: Market, Angel Research; Note: Level above 50 indicates expansion
Exhibit 5: Exports and imports growth trends
Exhibit 6: Key policy rates
(%)
Exports yoy growth
Imports yoy growth
(%)
Repo rate
Reverse Repo rate
CRR
0.0
8.00
(5.0)
7.00
(10.0)
(15.0)
6.00
(20.0)
5.00
(25.0)
4.00
(30.0)
(35.0)
3.00
Source: Bloomberg, Angel Research
Source: RBI, Angel Research
Market Outlook
April 7, 2016
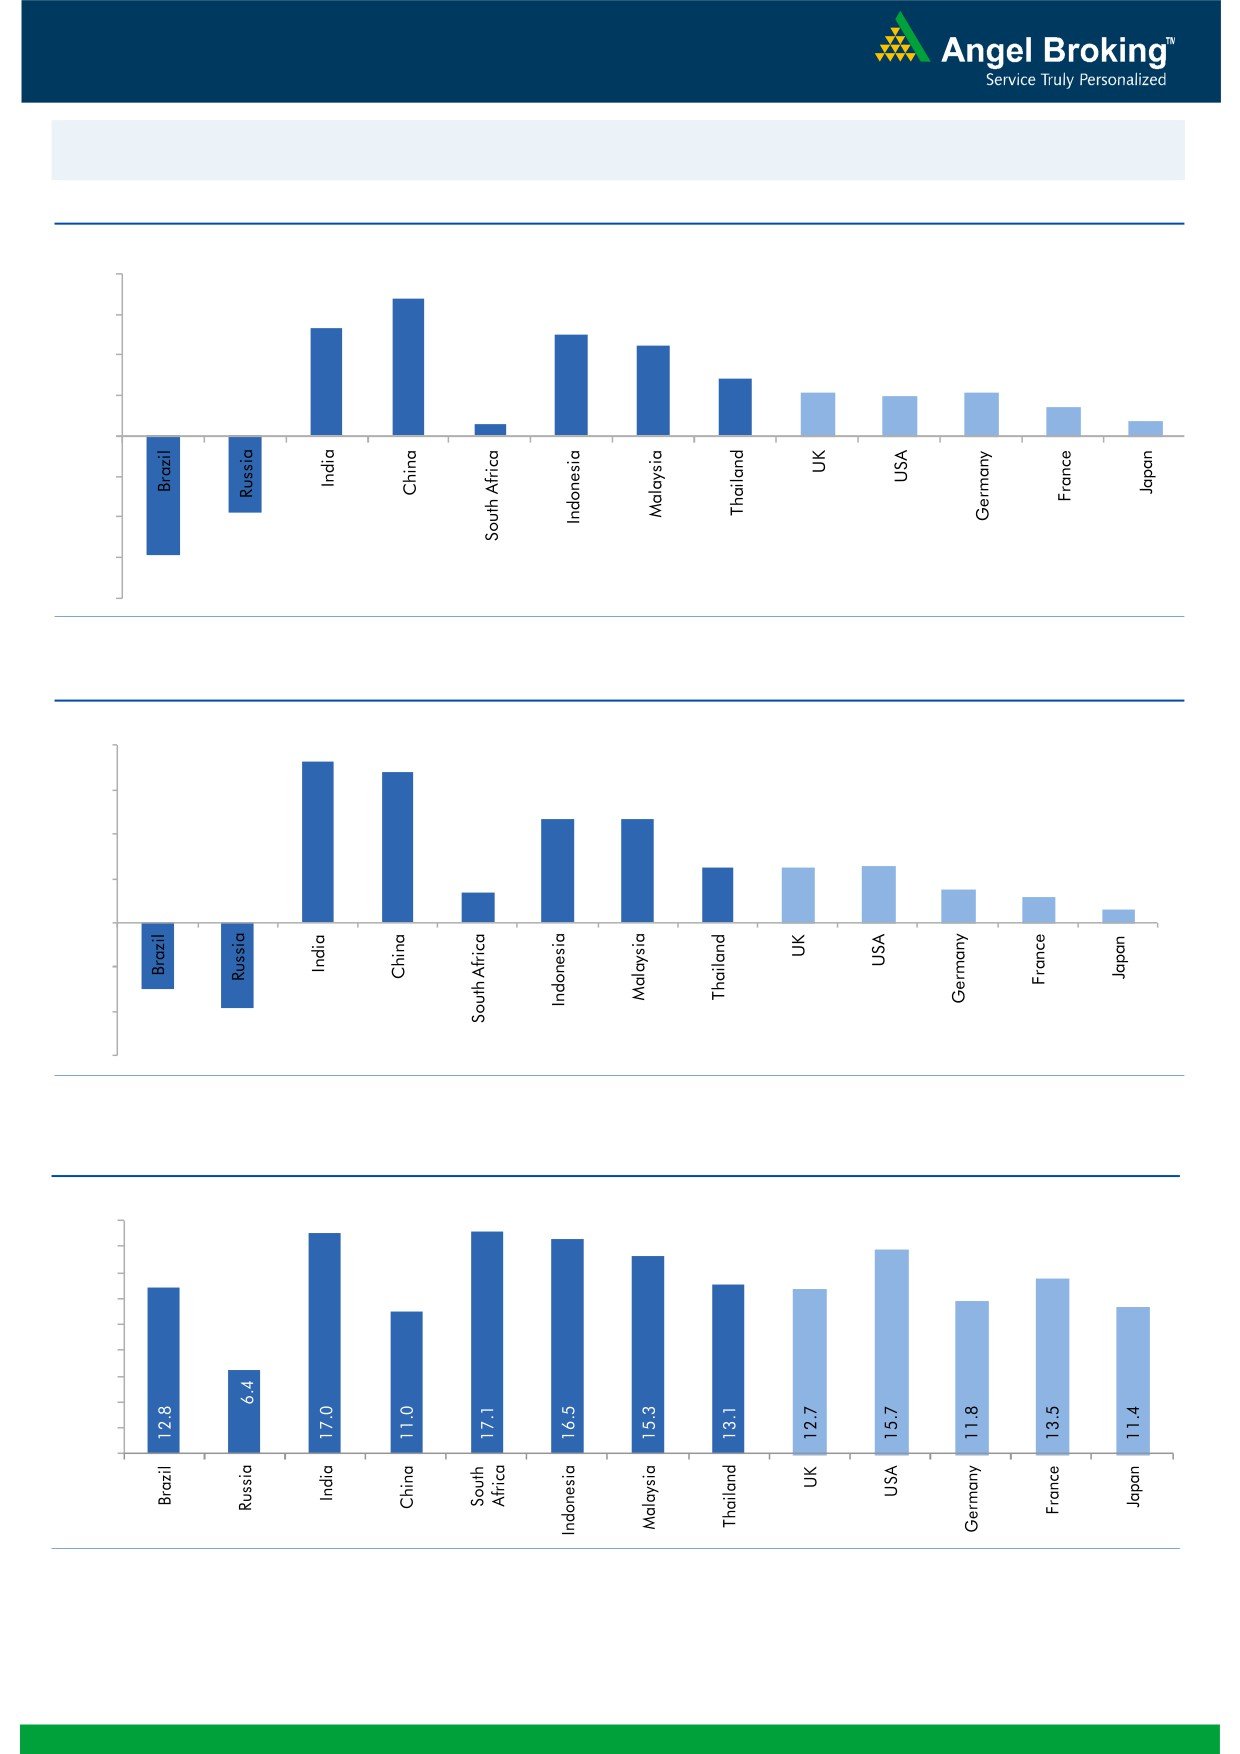
Global watch
Exhibit 1: Latest quarterly GDP Growth (%, yoy) across select developing and developed countries
(%)
8.0
6.8
6.0
5.3
5.0
4.5
4.0
2.8
2.1
2.0
2.1
1.4
2.0
0.6
0.7
-
(2.0)
(4.0)
(3.8)
(6.0)
(5.9)
(8.0)
Source: Bloomberg, Angel Research
Exhibit 2: 2015 GDP Growth projection by IMF (%, yoy) across select developing and developed countries
(%)
8.0
7.3
6.8
6.0
4.7
4.7
4.0
2.5
2.5
2.6
1.4
1.5
2.0
1.2
0.6
-
(2.0)
(3.0)
(4.0)
(3.8)
(6.0)
Source: IMF, Angel Research
Exhibit 3: One year forward P-E ratio across select developing and developed countries
(x)
18.0
16.0
14.0
12.0
10.0
8.0
6.0
4.0
2.0
-
Source: IMF, Angel Research
Market Outlook
April 7, 2016
Exhibit 4: Relative performance of indices across globe
Returns (%)
Country
Name of index
Closing price
1M
3M
1YR
Brazil
Bovespa
48,096
(2.0)
10.9
(4.0)
Russia
Micex
1,860
(1.0)
5.6
9.4
India
Nifty
7,614
3.3
(4.4)
(10.3)
China
Shanghai Composite
3,051
6.1
(14.4)
(17.4)
South Africa
Top 40
45,084
(0.4)
1.4
(2.1)
Mexico
Mexbol
45,282
1.5
5.4
0.7
Indonesia
LQ45
846
(0.4)
8.2
(9.9)
Malaysia
KLCI
1,717
1.1
1.4
(6.2)
Thailand
SET 50
874
(1.8)
11.2
(12.0)
USA
Dow Jones
17,716
4.2
3.3
(1.0)
UK
FTSE
6,162
0.5
0.4
(12.2)
Japan
Nikkei
15,715
(7.6)
(14.8)
(18.5)
Germany
DAX
9,625
(1.3)
(6.6)
(20.9)
France
CAC
4,285
(3.0)
(5.6)
(17.9)
Source: Bloomberg, Angel Research
Stock Watch
April 07, 2016
Company Name
Reco
CMP
Target
Mkt Cap
Sales ( Čcr )
OPM(%)
EPS (Č)
PER(x)
P/BV(x)
RoE(%)
EV/Sales(x)
(Č)
Price ( Č)
( Č cr )
FY16E FY17E
FY16E
FY17E
FY16E
FY17E
FY16E
FY17E
FY16E
FY17E
FY16E
FY17E
FY16E
FY17E
Agri / Agri Chemical
Rallis
Neutral
172
-
3,351
2,097
2,415
14.4
14.4
9.5
11.0
18.1
15.7
3.6
3.1
21.1
21.3
1.6
1.4
United Phosphorus
Neutral
458
-
19,643
12,500
14,375
18.3
18.3
29.8
35.9
15.4
12.8
2.8
2.4
20.0
20.3
1.7
1.4
Auto & Auto Ancillary
Ashok Leyland
Neutral
108
-
30,664
17,995
21,544
11.4
11.6
3.4
4.7
31.7
22.9
5.6
5.1
17.7
22.2
1.7
1.4
Bajaj Auto
Accumulate
2,397
2,585
69,354
22,709
25,860
20.9
20.1
129.0
143.6
18.6
16.7
5.7
4.9
30.7
29.4
2.6
2.2
Bharat Forge
Accumulate
790
875
18,383
7,351
8,318
19.9
19.7
31.2
36.5
25.3
21.6
4.5
3.8
19.3
19.2
2.6
2.3
Eicher Motors
Neutral
19,180
-
52,095
15,556
16,747
15.5
17.3
464.8
597.5
41.3
32.1
15.1
11.1
36.2
34.3
3.3
3.0
Gabriel India
Accumulate
91
101
1,300
1,415
1,544
8.7
9.0
4.6
5.4
19.7
16.8
3.6
3.2
18.1
18.9
0.9
0.8
Hero Motocorp
Neutral
2,984
-
59,578
28,244
30,532
15.5
15.9
156.7
168.5
19.0
17.7
7.6
6.5
39.9
36.4
1.9
1.8
Jamna Auto Industries Accumulate
147
160
1,171
1,281
1,473
11.2
11.5
7.6
9.2
19.3
15.9
4.9
4.0
25.4
25.2
1.0
0.8
L G Balakrishnan & Bros Neutral
465
-
730
1,254
1,394
11.6
11.8
35.9
41.7
13.0
11.2
1.8
1.6
13.5
13.8
0.7
0.6
Mahindra and Mahindra Accumulate
1,221
1,364
75,857
38,416
42,904
13.7
13.9
54.8
63.4
22.3
19.3
3.4
3.1
15.4
15.8
1.6
1.4
Maruti
Neutral
3,572
-
107,892
57,865
68,104
16.4
16.7
176.3
225.5
20.3
15.8
3.9
3.4
19.4
21.2
1.6
1.3
Minda Industries
Neutral
1,012
-
1,606
2,523
2,890
8.7
9.0
55.0
65.4
18.4
15.5
3.6
2.9
19.3
18.7
0.7
0.6
Motherson Sumi
Buy
248
313
32,744
39,343
45,100
8.8
9.1
10.1
12.5
24.5
19.8
7.8
6.1
35.3
34.4
0.9
0.8
Rane Brake Lining
Buy
378
465
299
454
511
11.5
12.0
25.2
31.0
15.0
12.2
2.2
2.0
14.9
16.6
0.8
0.7
Setco Automotive
Neutral
31
-
408
594
741
12.7
13.7
1.7
3.2
18.0
9.6
1.9
1.6
10.4
16.9
1.1
0.9
Tata Motors
Neutral
377
-
108,905
259,686
273,957
13.0
13.4
25.9
29.5
14.6
12.8
1.9
1.7
8.0
9.0
0.6
0.6
TVS Motor
Neutral
317
-
15,041
11,263
13,122
6.9
8.5
9.2
15.0
34.4
21.1
7.9
6.2
22.7
29.6
1.3
1.1
Amara Raja Batteries
Buy
876
1,040
14,958
4,892
5,871
17.4
17.6
28.8
37.1
30.4
23.6
7.1
5.7
23.4
24.1
3.0
2.5
Exide Industries
Buy
135
162
11,501
6,950
7,784
14.4
14.8
6.6
7.3
20.5
18.5
2.6
2.4
12.6
12.8
1.4
1.2
Apollo Tyres
Accumulate
173
183
8,788
12,056
12,714
17.2
16.4
23.0
20.3
7.5
8.5
1.3
1.2
17.7
13.6
0.8
0.8
Ceat
Neutral
1,074
-
4,345
6,041
6,597
14.1
13.7
99.5
111.9
10.8
9.6
2.1
1.8
19.6
18.5
0.9
0.7
JK Tyres
Neutral
84
-
1,903
7,446
7,669
15.2
14.0
19.6
18.4
4.3
4.6
1.1
0.9
25.2
19.5
0.7
0.6
Swaraj Engines
Neutral
909
-
1,129
552
630
14.2
14.7
44.6
54.1
20.4
16.8
4.7
4.3
23.2
25.6
1.9
1.6
Subros
Neutral
87
-
524
1,293
1,527
11.8
11.9
4.2
6.7
20.8
13.0
1.6
1.4
7.7
11.5
0.7
0.6
Indag Rubber
Neutral
174
-
456
283
329
17.0
17.2
13.0
15.4
13.4
11.3
2.9
2.4
21.8
21.6
1.3
1.1
Capital Goods
ACE
Neutral
38
-
375
660
839
4.7
8.2
1.0
3.9
37.9
9.7
1.2
1.1
3.2
11.3
0.7
0.6
BEML
Buy
942
1,157
3,922
3,277
4,006
6.0
8.9
36.2
64.3
26.0
14.7
1.8
1.6
5.7
11.7
1.3
1.0
Bharat Electronics
Buy
1,172
1,414
28,118
7,737
8,634
16.8
17.2
54.0
61.5
21.7
19.1
3.1
2.8
39.3
45.6
2.7
2.3
Stock Watch
April 07, 2016
Company Name
Reco
CMP
Target
Mkt Cap
Sales ( Čcr )
OPM(%)
EPS (Č)
PER(x)
P/BV(x)
RoE(%)
EV/Sales(x)
(Č)
Price ( Č)
( Č cr )
FY16E
FY17E
FY16E
FY17E
FY16E
FY17E
FY16E
FY17E
FY16E
FY17E
FY16E
FY17E
FY16E
FY17E
Capital Goods
Voltas
Buy
278
353
9,187
5,363
5,963
8.0
9.1
11.0
13.8
25.2
20.1
3.9
3.4
16.2
17.9
1.7
1.5
BGR Energy
Neutral
104
-
750
3,615
3,181
9.5
9.4
16.7
12.4
6.2
8.4
0.6
0.6
10.0
7.0
0.6
0.8
BHEL
Neutral
114
-
27,903
33,722
35,272
10.8
11.7
10.5
14.2
10.9
8.0
0.8
0.8
7.0
9.0
0.9
0.9
Blue Star
Buy
394
458
3,547
3,548
3,977
6.3
6.9
13.7
17.2
28.8
23.0
7.2
4.7
26.1
25.4
1.1
0.9
Crompton Greaves
Neutral
50
-
3,134
13,484
14,687
4.9
6.2
4.5
7.1
11.1
7.0
0.8
0.7
7.2
10.8
0.4
0.3
Greaves Cotton
Neutral
130
-
3,176
1,655
1,755
16.6
16.8
7.4
7.8
17.6
16.7
3.5
3.3
21.1
20.6
1.9
1.8
Inox Wind
Buy
248
458
5,494
4,980
5,943
17.0
17.5
26.6
31.6
9.3
7.8
2.8
2.1
35.0
30.0
1.3
1.0
KEC International
Neutral
126
-
3,235
8,791
9,716
6.1
6.8
5.4
8.2
23.3
15.4
2.3
2.1
10.0
14.0
0.6
0.5
Thermax
Neutral
746
-
8,888
6,413
7,525
7.4
8.5
30.5
39.3
24.5
19.0
3.8
3.3
15.0
17.0
1.4
1.1
VATech Wabag
Neutral
519
-
2,829
2,722
3,336
7.9
8.1
19.5
24.6
26.6
21.1
2.8
2.5
11.1
12.4
1.1
0.9
Cement
ACC
Neutral
1,428
-
26,805
13,151
14,757
16.4
18.3
63.9
83.4
22.3
17.1
2.9
2.6
13.3
16.1
1.9
1.6
Ambuja Cements
Neutral
229
-
35,515
11,564
12,556
19.4
20.7
8.9
10.1
25.7
22.7
3.2
3.1
12.8
13.8
2.7
2.5
HeidelbergCement
Neutral
92
-
2,091
1,772
1,926
13.3
15.4
1.0
3.0
92.3
30.8
2.3
2.2
2.6
7.9
1.8
1.5
India Cements
Neutral
89
-
2,746
4,216
4,840
18.0
19.5
4.0
9.9
22.4
9.0
0.9
0.8
4.0
9.5
1.0
0.8
JK Cement
Neutral
669
-
4,681
3,661
4,742
10.1
15.8
7.5
28.5
89.3
23.5
2.7
2.4
7.5
22.9
1.8
1.3
J K Lakshmi Cement
Neutral
335
-
3,946
2,947
3,616
16.7
19.9
11.5
27.2
29.2
12.3
2.8
2.4
9.8
20.8
1.8
1.4
Mangalam Cements
Neutral
238
-
636
1,053
1,347
10.5
13.3
8.4
26.0
28.4
9.2
1.2
1.1
4.3
12.5
1.0
0.7
Orient Cement
Neutral
153
-
3,125
1,854
2,524
21.2
22.2
7.7
11.1
19.8
13.7
2.9
2.5
13.3
15.7
2.4
1.7
Ramco Cements
Neutral
415
-
9,891
4,036
4,545
20.8
21.3
15.1
18.8
27.5
22.1
3.4
3.0
12.9
14.3
3.0
2.6
Shree Cement^
Neutral
12,417
-
43,256
7,150
8,742
26.7
28.6
228.0
345.5
54.5
35.9
8.0
6.7
15.7
20.3
5.8
4.7
UltraTech Cement
Neutral
3,192
-
87,586
24,669
29,265
18.2
20.6
82.0
120.0
38.9
26.6
4.2
3.7
11.3
14.7
3.6
3.1
Construction
ITNL
Buy
76
93
2,487
7,360
8,825
34.0
35.9
7.0
9.0
10.8
8.4
0.4
0.4
3.2
3.7
3.7
3.6
KNR Constructions
Buy
504
603
1,417
937
1,470
14.3
14.0
44.2
38.6
11.4
13.1
2.3
2.0
15.4
15.4
1.6
1.0
Larsen & Toubro
Accumulate
1,210
1,310
112,667
58,870
65,708
8.3
10.3
42.0
53.0
28.8
22.8
2.0
1.8
8.8
11.2
2.1
1.9
Gujarat Pipavav Port
Neutral
179
-
8,646
629
684
51.0
52.2
6.4
5.9
28.0
30.3
3.7
3.4
15.9
12.7
13.4
12.1
MBL Infrastructures
Buy
156
285
648
2,313
2,797
12.2
14.6
19.0
20.0
8.2
7.8
0.9
0.8
11.3
10.6
1.0
0.9
Nagarjuna Const.
Neutral
74
-
4,128
7,892
8,842
8.8
9.1
3.0
5.3
24.8
14.0
1.2
1.1
5.0
8.5
0.8
0.6
PNC Infratech
Accumulate
526
558
2,700
1,873
2,288
13.2
13.5
24.0
32.0
21.9
16.5
2.1
1.9
12.1
12.3
1.5
1.3
Simplex Infra
Neutral
244
-
1,205
5,955
6,829
10.3
10.5
16.0
31.0
15.2
7.9
0.8
0.7
5.3
9.9
0.7
0.6
Stock Watch
April 07, 2016
Company Name
Reco
CMP
Target
Mkt Cap
Sales ( Čcr )
OPM(%)
EPS (Č)
PER(x)
P/BV(x)
RoE(%)
EV/Sales(x)
(Č)
Price ( Č)
( Č cr )
FY16E
FY17E
FY16E
FY17E
FY16E
FY17E
FY16E
FY17E
FY16E
FY17E
FY16E
FY17E
FY16E
FY17E
Construction
Power Mech Projects
Neutral
578
-
850
1,539
1,801
12.8
12.7
59.0
72.1
9.8
8.0
1.5
1.3
18.6
16.8
0.6
0.5
Sadbhav Engineering
Accumulate
274
289
4,697
3,481
4,219
10.7
10.8
8.2
11.7
33.4
23.4
3.2
2.8
10.3
13.5
1.6
1.3
NBCC
Accumulate
950
1,089
11,394
5,816
7,382
6.9
7.7
29.6
39.8
32.1
23.9
5.8
4.5
24.1
26.7
1.7
1.3
MEP Infra
Neutral
39
-
641
1,956
1,876
28.1
30.5
1.3
3.0
30.3
13.1
6.4
4.3
21.2
32.8
1.7
1.7
SIPL
Neutral
97
-
3,427
675
1,042
62.4
64.7
-
-
3.6
4.2
-
-
16.7
11.3
Engineers India
Neutral
166
-
5,602
1,667
1,725
13.5
16.0
9.7
11.4
17.1
14.6
2.0
2.0
11.7
13.4
2.2
2.2
Financials
Allahabad Bank
Neutral
54
-
3,237
8,569
9,392
2.8
2.9
16.3
27.5
3.3
2.0
0.3
0.2
7.6
11.9
-
-
Axis Bank
Buy
425
494
101,215
26,473
31,527
3.5
3.6
35.7
43.5
11.9
9.8
2.0
1.7
17.9
18.9
-
-
Bank of Baroda
Neutral
143
-
33,042
18,485
21,025
1.9
2.0
13.5
21.1
10.7
6.8
0.8
0.8
7.3
10.6
-
-
Bank of India
Neutral
93
-
7,547
15,972
17,271
1.9
2.0
15.3
33.4
6.1
2.8
0.3
0.2
3.6
7.6
-
-
Canara Bank
Neutral
185
-
10,026
15,441
16,945
2.0
2.1
46.6
70.4
4.0
2.6
0.4
0.3
8.0
11.2
-
-
Dena Bank
Neutral
29
-
1,891
3,440
3,840
2.1
2.3
7.3
10.0
4.0
2.9
0.3
0.3
6.1
7.9
-
-
Dewan Housing Finance Buy
193
270
5,630
1,892
2,277
2.9
2.9
25.9
30.8
7.4
6.3
1.1
1.0
15.3
15.9
-
-
Federal Bank
Neutral
44
-
7,550
3,477
3,999
3.0
3.0
5.0
6.2
8.8
7.0
0.9
0.8
10.6
11.9
-
-
HDFC
Neutral
1,101
-
173,956
10,358
11,852
3.3
3.3
41.1
47.0
26.8
23.4
5.1
4.6
24.7
24.9
-
-
HDFC Bank
Buy
1,062
1,262
268,367
38,309
47,302
4.3
4.3
49.3
61.1
21.5
17.4
3.7
3.2
18.5
19.7
-
-
ICICI Bank
Accumulate
223
254
129,542
34,279
39,262
3.3
3.3
21.0
24.4
10.6
9.1
1.8
1.5
14.4
14.7
-
-
IDBI Bank
Neutral
67
-
13,887
9,625
10,455
1.8
1.8
8.5
14.2
7.9
4.8
0.5
0.4
5.9
9.3
-
-
Indian Bank
Neutral
102
-
4,880
6,160
6,858
2.5
2.5
24.5
29.8
4.2
3.4
0.3
0.3
7.7
8.6
-
-
LIC Housing Finance
Buy
468
592
23,626
3,101
3,745
2.5
2.5
33.0
40.2
14.2
11.7
2.7
2.3
19.7
20.5
-
-
Oriental Bank
Neutral
88
-
2,639
7,643
8,373
2.4
2.4
37.2
45.4
2.4
1.9
0.2
0.2
8.2
9.4
-
-
Punjab Natl.Bank
Neutral
81
-
15,964
23,638
26,557
2.8
2.8
17.9
27.2
4.6
3.0
0.5
0.4
8.5
12.0
-
-
South Ind.Bank
Neutral
17
-
2,356
1,965
2,185
2.5
2.5
2.5
3.3
7.0
5.3
0.7
0.6
9.5
11.7
-
-
St Bk of India
Neutral
184
-
142,796
79,958
86,061
2.6
2.6
13.4
20.7
13.7
8.9
1.1
1.0
11.5
12.8
-
-
Union Bank
Neutral
127
-
8,751
12,646
14,129
2.3
2.4
31.0
39.1
4.1
3.3
0.4
0.4
9.8
11.4
-
-
Vijaya Bank
Neutral
31
-
2,689
3,536
3,827
1.9
1.9
5.5
6.7
5.7
4.7
0.5
0.4
7.8
8.8
-
-
Yes Bank
Neutral
835
-
35,107
7,190
9,011
3.2
3.3
58.2
69.7
14.3
12.0
2.6
2.2
19.2
19.6
-
-
FMCG
Asian Paints
Neutral
864
-
82,913
16,553
19,160
16.0
16.2
17.7
21.5
48.9
40.2
13.0
11.7
29.4
31.2
4.8
4.2
Britannia
Neutral
2,709
-
32,503
8,481
9,795
14.0
14.1
65.5
78.3
41.4
34.6
19.6
16.1
38.3
41.2
3.7
3.2
Stock Watch
April 07, 2016
Company Name
Reco
CMP
Target
Mkt Cap
Sales ( Čcr )
OPM(%)
EPS (Č)
PER(x)
P/BV(x)
RoE(%)
EV/Sales(x)
(Č)
Price ( Č)
( Č cr )
FY16E FY17E
FY16E
FY17E
FY16E
FY17E
FY16E
FY17E
FY16E
FY17E
FY16E
FY17E
FY16E
FY17E
FMCG
Colgate
Neutral
829
-
22,553
4,836
5,490
19.5
19.7
48.5
53.2
17.1
15.6
12.5
10.9
99.8
97.5
4.6
4.0
Dabur India
Accumulate
248
267
43,556
9,370
10,265
17.1
17.2
7.3
8.1
33.8
30.6
10.2
8.3
33.7
30.6
4.6
4.2
GlaxoSmith Con*
Neutral
5,885
-
24,750
4,919
5,742
17.2
17.4
168.3
191.2
35.0
30.8
9.9
8.4
28.8
28.9
4.6
3.9
Godrej Consumer
Neutral
1,362
-
46,384
10,168
12,886
16.1
16.1
32.1
38.4
42.4
35.5
8.6
8.0
19.7
21.0
4.7
3.7
HUL
Neutral
872
-
188,609
34,940
38,957
17.5
17.7
20.8
24.7
41.9
35.3
46.6
37.3
110.5
114.2
5.2
4.6
ITC
Accumulate
326
359
262,419
36,804
38,776
37.9
37.9
12.2
12.9
26.7
25.3
7.4
6.5
27.7
25.8
6.7
6.4
Marico
Neutral
252
-
32,480
6,551
7,766
15.7
16.0
10.4
12.5
24.3
20.1
7.0
5.9
33.2
32.4
4.9
4.1
Nestle*
Buy
5,708
6,646
55,036
11,291
12,847
22.2
22.3
158.9
184.6
35.9
30.9
18.8
16.9
55.0
57.3
4.7
4.1
Tata Global
Buy
119
144
7,501
8,635
9,072
9.8
9.9
6.5
7.6
18.3
15.6
1.8
1.8
6.8
7.4
0.8
0.8
IT
HCL Tech^
Buy
840
1,038
118,500
42,038
47,503
21.2
21.5
51.5
57.7
16.3
14.6
3.5
2.7
21.5
18.8
2.4
2.0
Infosys
Accumulate
1,201
1,347
276,787
61,850
69,981
27.5
27.5
59.4
65.7
20.2
18.3
4.3
3.7
21.2
20.1
3.8
3.2
TCS
Buy
2,479
2,854
488,449
108,487
122,590
28.3
28.5
122.8
138.4
20.2
17.9
7.7
7.0
38.0
38.9
4.1
3.6
Tech Mahindra
Buy
454
530
43,943
26,524
29,177
16.2
17.0
28.8
33.6
15.8
13.5
3.0
2.6
19.3
19.1
1.4
1.2
Wipro
Buy
561
680
138,693
50,808
56,189
23.7
23.8
37.3
40.7
15.1
13.8
2.9
2.6
19.2
17.7
2.2
1.8
Media
D B Corp
Buy
305
356
5,603
2,241
2,495
27.8
27.9
21.8
25.6
14.0
11.9
3.7
3.2
26.7
28.5
2.4
2.2
HT Media
Neutral
77
-
1,792
2,495
2,603
11.2
11.2
7.3
8.6
10.6
9.0
0.8
0.8
7.4
8.1
0.2
0.2
Jagran Prakashan
Buy
159
189
5,195
2,170
2,355
27.2
26.2
8.9
9.9
17.9
16.1
3.8
3.3
20.9
20.5
2.3
2.1
Sun TV Network
Neutral
359
-
14,165
2,779
3,196
70.2
70.5
22.8
27.3
15.8
13.2
3.9
3.5
26.7
28.3
4.9
4.2
Hindustan Media
Neutral
250
-
1,833
920
1,031
20.0
20.0
19.2
20.9
13.0
12.0
2.1
1.8
16.4
15.3
1.5
1.3
Ventures
Metals & Mining
Coal India
Buy
276
380
174,174
76,167
84,130
19.9
22.3
22.4
25.8
12.3
10.7
4.4
4.3
35.5
41.0
1.6
1.4
Hind. Zinc
Accumulate
162
175
68,471
14,641
14,026
50.4
50.4
17.7
16.0
9.2
10.1
1.4
1.3
16.2
13.2
2.3
2.1
Hindalco
Neutral
89
-
18,368
104,356
111,186
8.7
9.5
6.7
11.1
13.2
8.0
0.5
0.5
3.5
5.9
0.7
0.6
JSW Steel
Neutral
1,292
-
31,232
42,308
45,147
16.4
20.7
(10.3)
49.5
26.1
1.4
1.4
(1.0)
5.6
1.8
1.7
NMDC
Neutral
102
-
40,262
8,237
10,893
46.6
44.5
10.0
11.7
10.2
8.7
1.1
1.0
12.5
13.0
4.7
3.6
SAIL
Neutral
43
-
17,842
45,915
53,954
7.2
10.5
1.5
4.4
28.7
9.9
0.4
0.4
2.3
4.1
1.0
0.9
Vedanta
Neutral
88
-
25,956
71,445
81,910
26.2
26.3
12.9
19.2
6.8
4.6
0.5
0.4
7.2
8.9
0.8
0.6
Tata Steel
Neutral
328
-
31,900
126,760
137,307
8.9
11.3
6.4
23.1
51.6
14.2
1.0
1.0
2.0
7.1
0.8
0.8
Oil & Gas
Cairn India
Neutral
147
-
27,495
11,323
12,490
49.4
51.0
20.7
20.7
7.1
7.1
0.5
0.4
6.4
6.1
1.5
0.8
GAIL
Neutral
341
-
43,274
64,856
70,933
9.1
9.6
24.0
28.9
14.2
11.8
1.2
1.1
8.8
9.6
0.9
0.8
Stock Watch
April 07, 2016
Company Name
Reco
CMP
Target
Mkt Cap
Sales ( Čcr )
OPM(%)
EPS (Č)
PER(x)
P/BV(x)
RoE(%)
EV/Sales(x)
(Č)
Price ( Č)
( Č cr )
FY16E FY17E
FY16E
FY17E
FY16E
FY17E
FY16E
FY17E
FY16E
FY17E
FY16E
FY17E
FY16E
FY17E
Oil & Gas
ONGC
Neutral
206
-
176,072
154,564
167,321
36.8
37.4
28.6
32.5
7.2
6.3
0.9
0.8
12.7
13.5
1.3
1.3
Petronet LNG
Neutral
245
-
18,353
29,691
31,188
5.8
6.2
12.8
13.4
19.1
18.2
2.9
2.5
15.8
14.8
0.7
0.7
Indian Oil Corp
Accumulate
411
455
99,716
359,607
402,760
5.9
6.1
42.5
48.7
9.7
8.4
1.3
1.1
14.1
14.4
0.4
0.3
Reliance Industries
Accumulate
1,031
1,150
334,228
304,775
344,392
12.6
13.4
91.3
102.6
11.3
10.1
1.3
1.2
11.8
12.0
1.0
0.9
Pharmaceuticals
Alembic Pharma
Neutral
589
-
11,102
3,274
3,802
26.9
19.4
35.0
28.7
16.8
20.5
7.5
5.6
55.6
31.2
3.4
2.8
Aurobindo Pharma
Accumulate
746
856
43,651
14,923
17,162
22.0
23.0
35.7
42.8
20.9
17.4
6.1
4.6
34.0
30.2
3.3
2.8
Aventis*
Neutral
4,248
-
9,783
2,082
2,371
17.4
20.8
118.2
151.5
35.9
28.0
5.3
4.2
19.9
25.5
4.4
3.6
Cadila Healthcare
Accumulate
315
352
32,253
10,224
11,840
21.0
22.0
14.6
17.6
21.6
17.9
5.9
4.6
30.8
29.0
3.2
2.7
Cipla
Buy
506
605
40,651
13,979
16,447
20.2
18.6
25.7
27.5
19.7
18.4
3.2
2.8
17.6
16.1
2.9
2.4
Dr Reddy's
Buy
3,000
3,933
51,160
16,838
19,575
25.0
23.1
167.5
178.8
17.9
16.8
3.8
3.2
23.1
20.4
3.0
2.5
Dishman Pharma
Neutral
331
-
2,671
1,733
1,906
21.5
21.5
17.0
19.9
19.5
16.6
2.0
1.8
10.5
11.2
2.1
1.8
GSK Pharma*
Neutral
3,721
-
31,519
2,870
3,158
20.0
22.1
59.5
68.3
62.5
54.5
18.5
19.0
28.5
34.3
10.5
9.6
Indoco Remedies
Neutral
278
-
2,561
1,033
1,199
15.9
18.2
9.4
13.6
29.6
20.4
4.4
3.7
15.7
19.7
2.6
2.2
Ipca labs
Buy
544
900
6,869
3,363
3,909
12.9
18.6
13.4
28.0
40.6
19.4
2.9
2.5
7.4
14.0
2.3
2.0
Lupin
Accumulate
1,486
1,560
66,936
13,092
16,561
25.0
27.0
50.4
68.3
29.5
21.8
6.1
4.8
22.8
24.7
4.8
3.7
Sun Pharma
Buy
810
950
194,844
28,163
32,610
25.8
30.7
17.4
26.9
46.5
30.1
4.4
3.8
13.0
16.6
6.4
5.3
Power
Tata Power
Neutral
67
-
17,986
35,923
37,402
22.6
22.8
4.1
5.2
16.4
12.9
1.3
1.2
7.5
9.3
1.5
1.3
NTPC
Buy
126
146
103,934
87,271
99,297
23.5
23.5
11.8
13.3
10.7
9.5
1.2
1.1
11.5
12.2
2.2
2.0
Power Grid
Buy
140
170
73,085
20,702
23,361
86.7
86.4
12.1
13.2
11.6
10.6
1.7
1.5
15.6
15.1
8.5
7.9
Real Estate
MLIFE
Buy
436
554
1,789
697
1,011
14.9
19.3
13.8
20.1
31.6
21.7
1.2
1.1
3.8
5.3
3.9
2.6
Telecom
Bharti Airtel
Neutral
335
-
133,773
101,748
109,191
32.1
31.7
12.0
12.5
27.9
26.8
1.9
1.8
6.9
6.7
2.0
1.8
Idea Cellular
Neutral
111
-
40,056
34,282
36,941
32.0
31.5
5.9
6.2
18.9
17.9
1.7
1.6
9.9
9.3
1.7
1.7
zOthers
Abbott India
Neutral
4,580
-
9,733
2,715
3,153
14.5
14.1
134.3
152.2
34.1
30.1
8.5
7.0
27.4
25.6
3.3
2.8
Bajaj Electricals
Accumulate
215
237
2,169
4,719
5,287
5.2
5.8
8.6
12.7
25.1
17.0
2.9
2.5
11.4
14.8
0.5
0.4
Finolex Cables
Neutral
284
-
4,343
2,520
2,883
12.2
12.0
12.7
14.2
22.4
20.0
3.1
2.7
13.6
13.5
1.5
1.2
Goodyear India*
Buy
487
582
1,123
1,800
1,600
11.7
11.5
58.7
52.9
8.3
9.2
1.9
1.6
24.6
18.7
0.4
0.4
Hitachi
Neutral
1,167
-
3,174
1,779
2,081
7.8
8.8
21.8
33.4
53.6
34.9
8.6
7.0
17.4
22.1
1.9
1.6
Jyothy Laboratories
Neutral
296
-
5,358
1,620
1,847
11.5
11.5
7.3
8.5
40.6
34.9
5.2
4.9
13.3
14.4
3.2
2.7
MRF
Buy
36,083
45,575
15,303
20,316
14,488
21.4
21.1
5,488.0
3,798.0
6.6
9.5
2.2
1.8
41.1
21.2
0.7
0.9
Stock Watch
April 07, 2016
Company Name
Reco
CMP
Target
Mkt Cap
Sales ( Čcr )
OPM(%)
EPS (Č)
PER(x)
P/BV(x)
RoE(%)
EV/Sales(x)
(Č)
Price ( Č)
( Č cr )
FY16E
FY17E
FY16E
FY17E
FY16E
FY17E
FY16E
FY17E
FY16E
FY17E
FY16E
FY17E
FY16E
FY17E
zOthers
Page Industries
Neutral
12,261
-
13,676
1,929
2,450
19.8
20.1
229.9
299.0
53.3
41.0
23.5
16.4
52.1
47.1
7.1
5.6
Relaxo Footwears
Neutral
503
-
6,033
1,767
2,152
12.3
12.5
19.3
25.1
26.1
20.1
6.4
4.9
27.7
27.8
3.5
2.8
Siyaram Silk Mills
Buy
1,000
1,354
937
1,636
1,815
11.5
11.5
89.9
104.1
11.1
9.6
1.8
1.6
17.9
17.8
0.7
0.7
Styrolution ABS India* Neutral
585
-
1,029
1,271
1,440
8.6
9.2
32.0
41.1
18.3
14.3
1.9
1.7
10.7
12.4
0.8
0.7
TVS Srichakra
Buy
2,422
3,217
1,855
2,035
2,252
15.9
15.3
248.6
268.1
9.7
9.0
4.3
3.1
43.6
33.9
1.0
0.8
HSIL
Neutral
299
-
2,161
2,123
2,384
16.1
16.5
15.0
18.9
19.9
15.8
1.5
1.4
8.0
9.4
1.4
1.2
Kirloskar Engines India
Neutral
228
-
3,297
2,403
2,554
8.6
9.9
9.2
10.5
24.8
21.7
2.4
2.3
9.7
10.7
1.0
0.9
Ltd
M M Forgings
Buy
455
614
549
511
615
21.7
21.6
43.1
55.8
10.6
8.2
1.9
1.6
19.9
21.2
1.3
1.0
Banco Products (India) Neutral
113
-
810
1,208
1,353
11.0
12.3
10.8
14.5
10.5
7.8
1.2
1.1
11.9
14.5
0.6
0.6
Competent Automobiles Neutral
141
-
87
1,040
1,137
3.2
3.1
25.7
28.0
5.5
5.0
0.8
0.7
15.0
14.3
0.1
0.1
Nilkamal
Neutral
1,110
-
1,656
1,871
2,031
10.7
10.5
63.2
69.8
17.6
15.9
2.9
2.5
17.6
16.6
0.9
0.8
Visaka Industries
Buy
110
144
174
1,086
1,197
9.9
10.3
21.5
28.8
5.1
3.8
0.5
0.4
9.6
11.6
0.4
0.3
Transport Corporation of
Neutral
274
-
2,083
2,830
3,350
8.8
9.0
14.4
18.3
19.1
15.0
2.9
2.6
15.4
17.1
0.9
0.7
India
Elecon Engineering
Neutral
62
-
677
1,359
1,482
10.3
13.7
0.8
3.9
77.4
16.0
1.3
1.2
1.6
7.8
0.9
0.8
Surya Roshni
Buy
145
201
634
2,992
3,223
8.1
8.4
14.7
18.3
9.8
7.9
0.9
0.8
9.7
11.0
0.5
0.5
MT Educare
Neutral
164
-
652
286
366
18.3
17.7
7.7
9.4
21.2
17.5
4.5
3.9
20.2
21.1
2.2
1.7
Radico Khaitan
Buy
94
156
1,253
1,517
1,635
12.7
13.4
5.8
7.1
16.2
13.2
1.4
1.3
8.6
9.6
1.3
1.2
Garware Wall Ropes
Buy
332
473
726
862
974
11.2
11.2
24.9
29.6
13.4
11.2
2.0
1.7
15.1
15.4
0.8
0.7
Wonderla Holidays
Neutral
376
-
2,125
206
308
44.0
43.6
9.0
12.9
41.8
29.2
5.7
5.2
13.7
17.8
10.2
6.8
Linc Pen & Plastics
Neutral
197
-
292
340
371
8.3
8.9
10.8
13.2
18.3
14.9
2.9
2.6
16.0
17.1
0.9
0.8
The Byke Hospitality
Neutral
157
-
629
222
287
20.5
20.5
5.6
7.6
27.8
20.8
5.3
4.3
18.9
20.8
2.9
2.2
Interglobe Aviation
Neutral
994
-
35,803
17,022
21,122
20.7
14.5
63.9
53.7
15.6
18.5
23.3
19.1
149.9
103.2
2.1
1.7
Coffee Day Enterprises
Neutral
230
-
4,736
2,692
2,964
17.0
18.6
-
4.7
-
48.5
2.8
2.7
0.2
5.5
2.2
2.0
Ltd
Navneet Education
Neutral
84
-
2,002
998
1,062
24.1
24.0
5.8
6.1
14.6
13.8
3.2
2.8
22.0
20.6
2.1
2.0
Navkar Corporation
Buy
176
265
2,511
365
436
38.3
37.5
5.6
5.9
31.2
30.0
2.0
1.8
6.3
6.1
7.7
6.6
UFO Moviez
Neutral
463
-
1,273
558
619
32.0
33.2
22.5
30.0
20.6
15.5
2.5
2.1
12.0
13.8
2.1
1.8
VRL Logistics
Neutral
369
-
3,365
1,725
1,902
16.5
16.7
12.2
14.6
30.3
25.3
6.3
5.6
20.8
21.9
2.1
1.9
Team Lease Serv.
Neutral
878
-
1,501
2,565
3,229
1.3
1.5
15.2
22.8
57.8
38.6
4.6
4.1
8.0
10.7
0.5
0.4
S H Kelkar & Co.
Neutral
230
-
3,324
928
1,036
15.3
15.1
4.9
6.1
46.6
37.6
4.4
4.0
9.4
10.7
3.5
3.1
Stock Watch
April 07, 2016
Company Name
Reco
CMP
Target Mkt Cap
Sales ( Čcr )
OPM(%)
EPS (Č)
PER(x)
P/BV(x)
RoE(%)
EV/Sales(x)
(Č)
Price ( Č)
( Č cr )
FY16E FY17E FY16E FY17E FY16E FY17E FY16E FY17E FY16E FY17E FY16E FY17E FY16E FY17E
zOthers
Quick Heal
Neutral
218
-
1,529
339
408
27.8
27.3
7.1
7.7
30.9
28.2
2.6
2.6
8.5
9.3
3.4
2.9
Narayana Hrudaya
Neutral
302
-
6,164
1,603
1,873
10.9
11.5
1.0
2.6
316.6
114.0
7.6
7.0
2.4
6.1
4.0
3.4
Manpasand Bever.
Neutral
460
-
2,300
540
836
19.9
19.6
10.2
16.9
44.9
27.2
3.6
3.3
8.1
12.0
3.9
2.5
Source: Company, Angel Research; Note: *December year end; #September year end; &October year end; Price as on April 06, 2016
Market Outlook
April 07, 2016
Research Team Tel: 022 - 39357800
DISCLAIMER
Angel Broking Private Limited (hereinafter referred to as “Angel”) is a registered Member of National Stock Exchange of India Limited,
Bombay Stock Exchange Limited and Metropolitian Stock Exchange of India Limited. It is also registered as a Depository Participant with
CDSL and Portfolio Manager with SEBI. It also has registration with AMFI as a Mutual Fund Distributor. Angel Broking Private Limited is a
registered entity with SEBI for Research Analyst in terms of SEBI (Research Analyst) Regulations, 2014 vide registration number
INH000000164. Angel or its associates has not been debarred/ suspended by SEBI or any other regulatory authority for accessing
/dealing in securities Market. Angel or its associates including its relatives/analyst do not hold any financial interest/beneficial ownership
of more than 1% in the company covered by Analyst. Angel or its associates/analyst has not received any compensation / managed or co
-managed public offering of securities of the company covered by Analyst during the past twelve months. Angel/analyst has not served as
an officer, director or employee of company covered by Analyst and has not been engaged in market making activity of the company
covered by Analyst.
This document is solely for the personal information of the recipient, and must not be singularly used as the basis of any investment
decision. Nothing in this document should be construed as investment or financial advice. Each recipient of this document should make
such investigations as they deem necessary to arrive at an independent evaluation of an investment in the securities of the companies
referred to in this document (including the merits and risks involved), and should consult their own advisors to determine the merits and
risks of such an investment.
Reports based on technical and derivative analysis center on studying charts of a stock's price movement, outstanding positions and
trading volume, as opposed to focusing on a company's fundamentals and, as such, may not match with a report on a company's
fundamentals.
The information in this document has been printed on the basis of publicly available information, internal data and other reliable sources
believed to be true, but we do not represent that it is accurate or complete and it should not be relied on as such, as this document is for
general guidance only. Angel Broking Pvt. Limited or any of its affiliates/ group companies shall not be in any way responsible for any
loss or damage that may arise to any person from any inadvertent error in the information contained in this report. Angel Broking Pvt.
Limited has not independently verified all the information contained within this document. Accordingly, we cannot testify, nor make any
representation or warranty, express or implied, to the accuracy, contents or data contained within this document. While Angel Broking
Pvt. Limited endeavors to update on a reasonable basis the information discussed in this material, there may be regulatory, compliance,
or other reasons that prevent us from doing so.
This document is being supplied to you solely for your information, and its contents, information or data may not be reproduced,
redistributed or passed on, directly or indirectly.
Neither Angel Broking Pvt. Limited, nor its directors, employees or affiliates shall be liable for any loss or damage that may arise from or
in connection with the use of this information.
Note: Please refer to the important ‘Stock Holding Disclosure' report on the Angel website (Research Section). Also, please refer to the
latest update on respective stocks for the disclosure status in respect of those stocks. Angel Broking Pvt. Limited and its affiliates may have
investment positions in the stocks recommended in this report.