Market Outlook
January 7, 2016
Market Cues
Domestic Indices
Chg (%)
(Pts)
(Close)
Indian markets are expected to open on a Negative note tracking the SGX Nifty and
BSE Sensex
(0.7)
(174)
25,406
Global markets.
Nifty
(0.6)
(44)
7,741
U.S. stocks declined in early session and ended the day in the negative territory,
Mid Cap
(0.3)
(33)
11,139
owing to geopolitical events/concerns (tension between Saudi Arabi - Iran and
Small Cap
(0.4)
(50)
11,850
possible nuclear test in North Korea) and fears about the current state of Chinese
Bankex
(0.8)
(153)
18,730
economy.
European markets also declined yesterday, hit by weakness in the commodity sector
Global Indices
Chg (%)
(Pts)
(Close)
as concerns over the Chinese economy resurfaced after it allowed the yuan to
weaken further. Geopolitical concerns also weighed on the markets.
Dow Jones
(1.5)
(252)
16,907
Nasdaq
(1.1)
(56)
4,836
Indian markets continued to post losses for third consecutive trading session
yesterday mainly on concerns of global weakness and correction in oil prices. Small-
FTSE
(1.0)
(64)
6,073
caps and mid-caps continued to outperform the benchmark indices.
Nikkei
(1.0)
(183)
18,191
Hang Seng
(1.0)
(208)
20,981
News & Result Analysis
Shanghai Com
2.3
74
3,362
Lupin launches generic oral contraceptive tablets in US
Adani Ports and Terminal Investment start work on transhipment hub at Mundra
Detailed analysis on Pg2
Advances / Declines
BSE
NSE
Advances
1,407
1,099
Investor’s Ready Reckoner
Declines
1,526
478
Key Domestic & Global Indicators
Unchanged
112
49
Stock Watch: Latest investment recommendations on 150+ stocks
Refer P4 onwards
Volumes (` Cr)
Top Picks
BSE
4,099
CMP
Target
Upside
Company
Sector
Rating
NSE
19,924
(`)
(`)
(%)
Axis Bank
Financials
Buy
431
630
46.2
HCL Tech
IT
Buy
840
1,132
34.7
Net Inflows (` Cr)
Net
Mtd
Ytd
Ashok Leyland
Automobiles
Buy
93
111
19.9
FII
(575)
(294)
17,280
Larsen & Toubro
Construction
Buy
1,240
1,646
32.8
MFs
(49)
(40)
69,013
LIC Housing Finance Financials
Buy
500
592
18.4
More Top Picks on Pg3
Top Gainers
Price (`)
Chg (%)
Key Upcoming Events
Torntpower
223
11.1
Previous
Consensus
Date
Region
Event Description
Monsanto
2,347
5.7
Reading
Expectations
Balramchin
78
5.3
Jan 7
US
Initial Jobless claims
287.0
275.0
Euro Zone
Euro-Zone Consumer Confidence
(5.7)
(5.7)
Srf
1,347
5.3
Jan 8
US
Change in Nonfarm payrolls
211.0
200.0
Sjvn
33
3.8
Jan 8
US
Unnemployment rate
5.0
5.0
Top Losers
Price (`)
Chg (%)
Punjlloyd
29
(4.9)
Gspl
143
(4.7)
Vedl
89
(4.0)
Ptc
68
(3.5)
Suzlon
22
(3.5)
As on January 6, 2015
Market Outlook
January 7, 2016
Lupin launches generic oral contraceptive tablets in US
Lupin has announced that its US subsidiary Lupin Pharmaceutical Inc. has
launched its Tri-Lo-Marzia Tablets having received approval from the United States
Food and Drug Administration (FDA) to market a generic equivalent of Janssen
Pharmaceuticals Inc’s Ortho Tri-Cyclen Lo Tablets. Ortho Tri-Cyclen Lo Tablets are
contraceptives (birth control) and had US sales of US$488mn as per IMS. The
product represents Lupin’s 16th oral contraceptive launch in the US. The company
has filed 37 oral contraceptive products with the FDA till date. We currently have a
Neutral view on the stock.
Adani Ports and Terminal Investment start work on transhipment
hub at Mundra
Adani Ports & SEZ Ltd (APSEZL) said that it will expand its existing terminal, AICTPL,
at its Mundra port. AICTPL is a 50:50 JV with Terminal Investment Ltd. The
expansion is being carried out to create a transshipment hub for the Middle East,
South Asia and India. Construction has already commenced and the terminal will
be commissioned in 15 months. Upon completion, AICTPL will emerge as India’s
largest container terminal with a total quay length of 1,460 meters and cargo
handling capacity of
3.1mn twenty-foot equivalent units (TEUs). With this
expansion, Mundra will become India’s largest Container Port with a cumulative
handling capacity of 6.6mn TEUs through its 4 terminals surpassing JNPT port
which has long been the largest container port (4.5mn TEUs) in the country.
However, JNPT has lined up its own expansion which is expected more than
double its existing capacity over the next few years.
Economic and Political News
Govt skips BS-V, to adopt BS-VI norms by 2020: Gadkari
3 ultra mega power projects to go under hammer by March
Coal imports fall for sixth straight month in December
Centre approves `815cr drought aid for Odisha
Corporate News
L&T Construction bags `2,871cr contracts
Cipla inks pact with US firm for Ropivacaine infusion system
Glenmark receives FDA approval for cardiac drug Multaq
Tata Motors, Petronas join hands for lubricants
Market Outlook
January 7, 2016
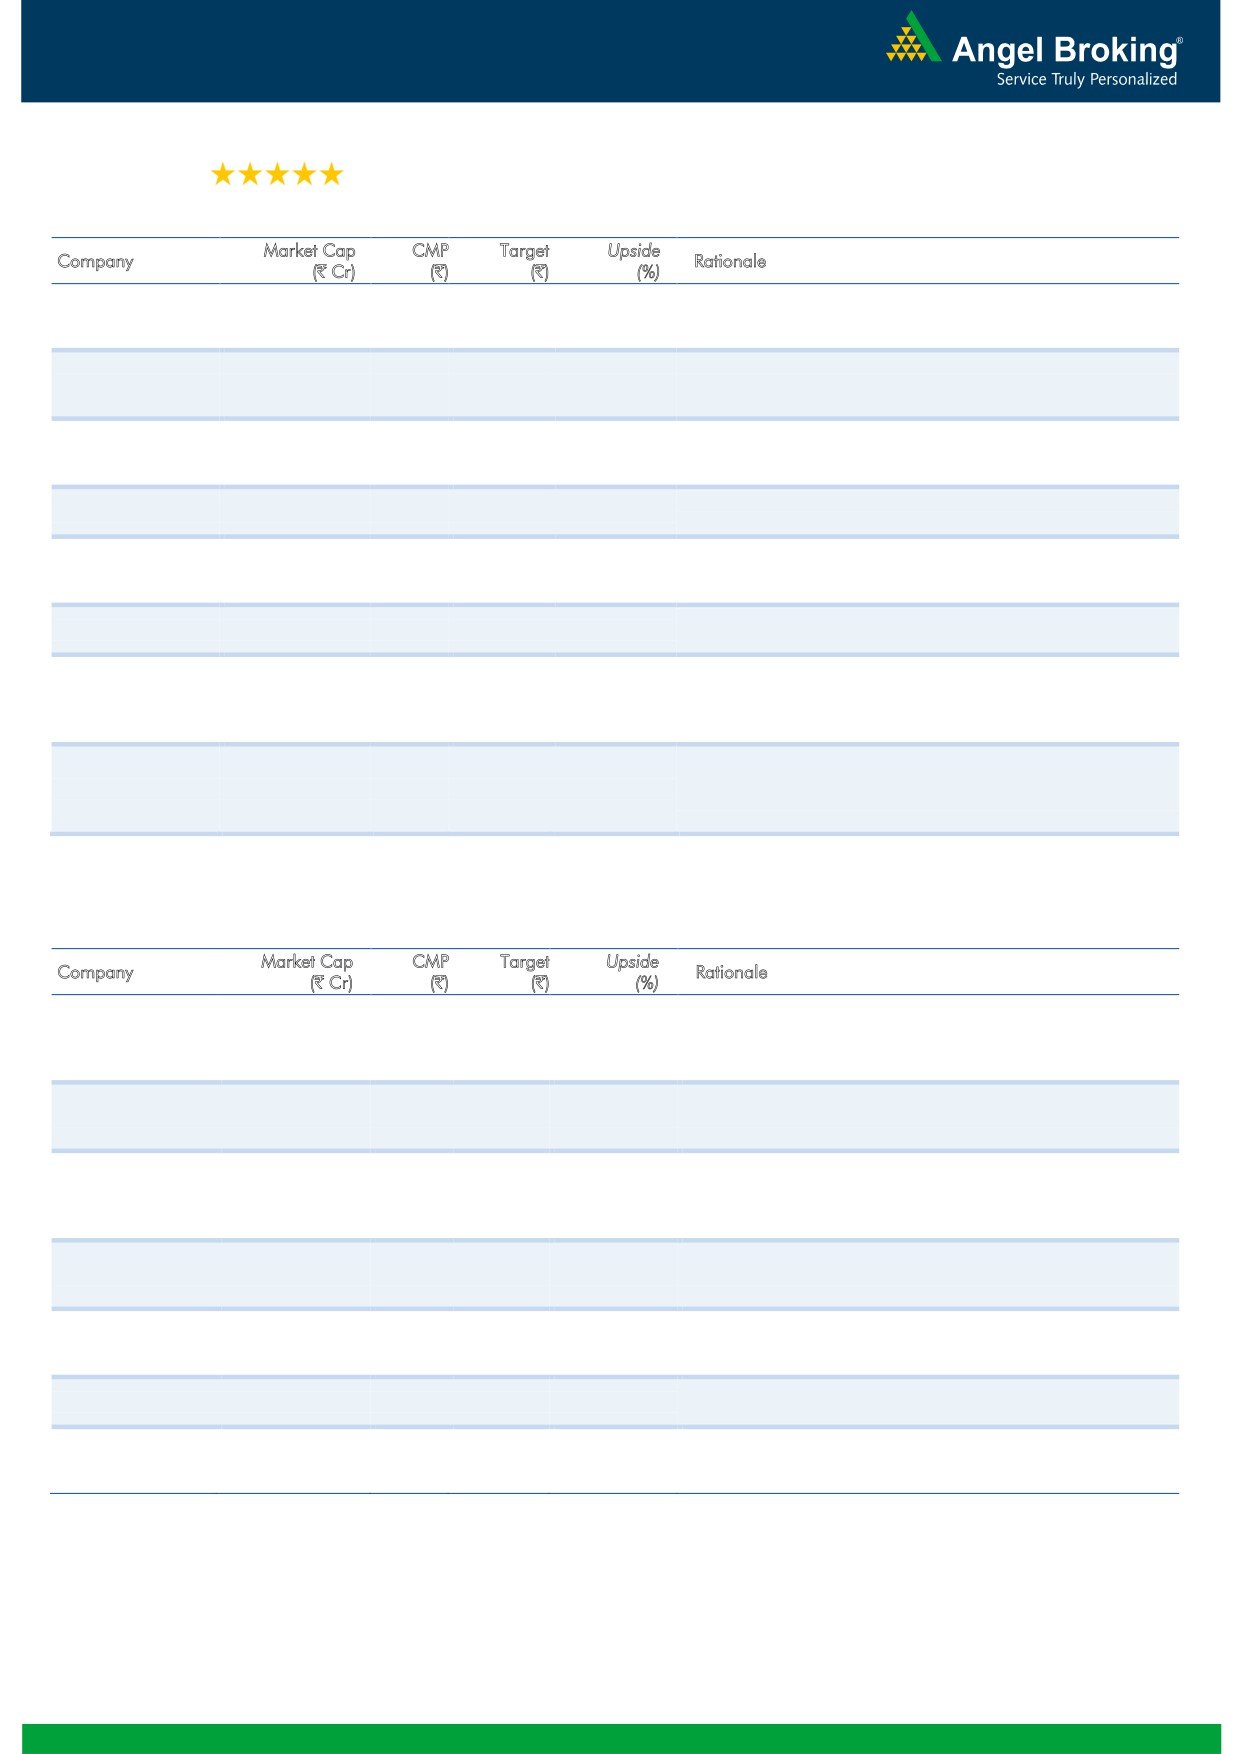
Top Picks
Large Cap
M
arket Cap
CM
P
T
arget
Upsid
e
Company
Rationale
(` Cr)
(`)
(`)
(%)
To outpace battery industry growth due to better technological
Amara Raja Batteries
14,728
862
1,040
20.6
products leading to market share gains in both the automotive
OEM and replacement segments.
Earnings to grow strongly given the MHCV cyclical upturn.
Ashok Leyland
26,339
93
111
19.9
Focus on exports and LCV's provides additional growth
avenue.
Healthy pace of branch expansion, backed by distribution
Axis Bank
1,02,484
431
630
46.2
network, will be the driving force for the bank’s retail business
and overall earnings.
The stock is trading at attractive valuations and is factoring all
HCL Tech
1,18,439
840
1,132
34.7
the bad news.
Strong visibility for a robust 20% earnings trajectory, coupled
HDFC Bank
2,68,997
1,065
1,262
18.5
with high quality of earnings on account of high quality retail
business and strategic focus on highly rated corporates.
Back on the growth trend, expect a long term growth of 14%
Infosys
2,45,647
1,069
1,306
22.1
to be a US$20bn in FY2020.
Well positioned to benefit from such expected gradual
recovery in the overall domestic capex cycle, given its presence
Larsen & Toubro
1,15,438
1,240
1,646
32.8
across various infrastructure segments, its execution
capabilities, and its strong balance sheet.
LICHF continues to grow its retail loan book at a healthy pace
with improvement in asset quality. We expect the company to
LIC Housing Finance
25,210
500
592
18.4
post a healthy loan book which is likely to reflect in a strong
earnings growth.
Source: Company, Angel Research
Mid Cap
M
arket Cap
CM
P
T
arget
Upsid
e
Company
Rationale
(` Cr)
(`)
(`)
(%)
Favourable outlook for the AC industry to augur well for
Cooling products business which is out pacing the market
Blue Star
3,388
377
439
16.5
growth. EMPPAC division's profitability to improve once
operating environment turns around.
Change in business focus towards high-margin chronic &
Ipca labs
9,009
714
900
26.1
lifestyle segments and increasing penetration in Europe and
US
Economic recovery to have favourable impact on advertising &
circulation revenue growth. Further, the acquisition of a radio
Jagran Prakashan
5,518
169
189
12.0
business (Radio City) would also boost the company's revenue
growth.
Earnings boost on back of stable material prices and
Radico Khaitan
1,485
112
156
39.7
favourable pricing environment. Valuation discount to peers
provides additional comfort
Strong brands and distribution network would boost growth
Siyaram Silk Mills
1,102
1,176
1,354
15.2
going ahead. Stock currently trades at an inexpensive
valuation.
Structural shift in the Lighting industry towards LED lighting will
Surya Roshni
725
165
201
21.5
drive growth.
Massive capacity expansion along with rail advantage at ICD
Navkar Corporation
2,951
207
265
28.1
as well CFS augurs well for the company
Source: Company, Angel Research
Market Outlook
January 07, 2016
Key Upcoming Events
Global economic events release calendar
Date
Time
Country
Event Description
Unit
Period
Bloomberg Data
Last Reported Estimated
Jan 7, 2016
7:00PM
US
Initial Jobless claims
Thousands
Jan 2
287.00
275.00
3:30PM
Euro Zone
Euro-Zone Consumer Confidence
Value
Dec F
(5.70)
(5.70)
Jan 8, 2016
7:00PM
US
Change in Nonfarm payrolls
Thousands
Dec
211.00
200.00
7:00PM
US
Unnemployment rate
%
Dec
5.00
5.00
Jan 9, 2016
7:00AM
China
Consumer Price Index (YoY)
% Change
Dec
1.50
1.60
Jan 11, 2016
India
Imports YoY%
% Change
Dec
(30.26)
--
India
Exports YoY%
% Change
Dec
(24.43)
--
Jan 12, 2016
5:30PM
India
Industrial Production YoY
% Change
Nov
9.80
--
3:00PM
UK
Industrial Production (YoY)
% Change
Nov
1.70
--
Jan 13, 2016
China
Exports YoY%
% Change
Dec
(6.80)
(8.00)
Jan 14, 2016
12:00PM
India
Monthly Wholesale Prices YoY%
% Change
Dec
(1.99)
--
5:30PM
UK
BOE Announces rates
% Ratio
Jan 14
0.50
0.50
Jan 15, 2016
7:45PM
US
Industrial Production
%
Dec
(0.56)
(0.10)
US
Producer Price Index (mom)
% Change
Dec
0.10
--
Jan 19, 2016
3:00PM
UK
CPI (YoY)
% Change
Dec
0.10
--
7:30AM
China
Industrial Production (YoY)
% Change
Dec
6.20
6.10
7:30AM
China
Real GDP (YoY)
% Change
4Q
6.90
6.90
Jan 20, 2016
7:00PM
US
Housing Starts
Thousands
Dec
1,173.00
--
7:00PM
US
Building permits
Thousands
Dec
1,282.00
--
3:00PM
UK
Jobless claims change
% Change
Dec
3.90
--
7:00PM
US
Consumer price index (mom)
% Change
Dec
--
--
Jan 21, 2016
3:30PM
Euro Zone
Euro-Zone CPI (YoY)
%
Dec F
0.20
--
6:15PM
Euro Zone
ECB announces interest rates
%
Jan 21
0.05
--
Jan 22, 2016
2:00PM
Germany
PMI Manufacturing
Value
Jan P
53.20
--
8:30PM
US
Existing home sales
Million
Dec
4.76
--
Jan 26, 2016
8:30PM
US
Consumer Confidence
S.A./ 1985=100
Jan
96.50
--
Jan 27, 2016
8:30PM
US
New home sales
Thousands
Dec
490.00
--
Jan 28, 2016
3:00PM
UK
GDP (YoY)
% Change
4Q A
2.10
--
12:30AM
US
FOMC rate decision
%
Jan 27
0.50
0.50
Jan 29, 2016
7:00PM
US
GDP Qoq (Annualised)
% Change
4Q A
2.00
--
Feb 1, 2016
3:00PM
UK
PMI Manufacturing
Value
Jan
51.90
--
6:30AM
China
PMI Manufacturing
Value
Jan
49.70
--
Feb 2, 2016
2:25PM
Germany
Unemployment change (000's)
Thousands
Jan
(14.00)
--
11:00AM
India
RBI Reverse Repo rate
%
Feb 2
5.75
--
11:00AM
India
RBI Repo rate
%
Feb 2
6.75
--
11:00AM
India
RBI Cash Reserve ratio
%
Feb 2
4.00
--
Source: Bloomberg, Angel Research
Market Outlook
January 7, 2016
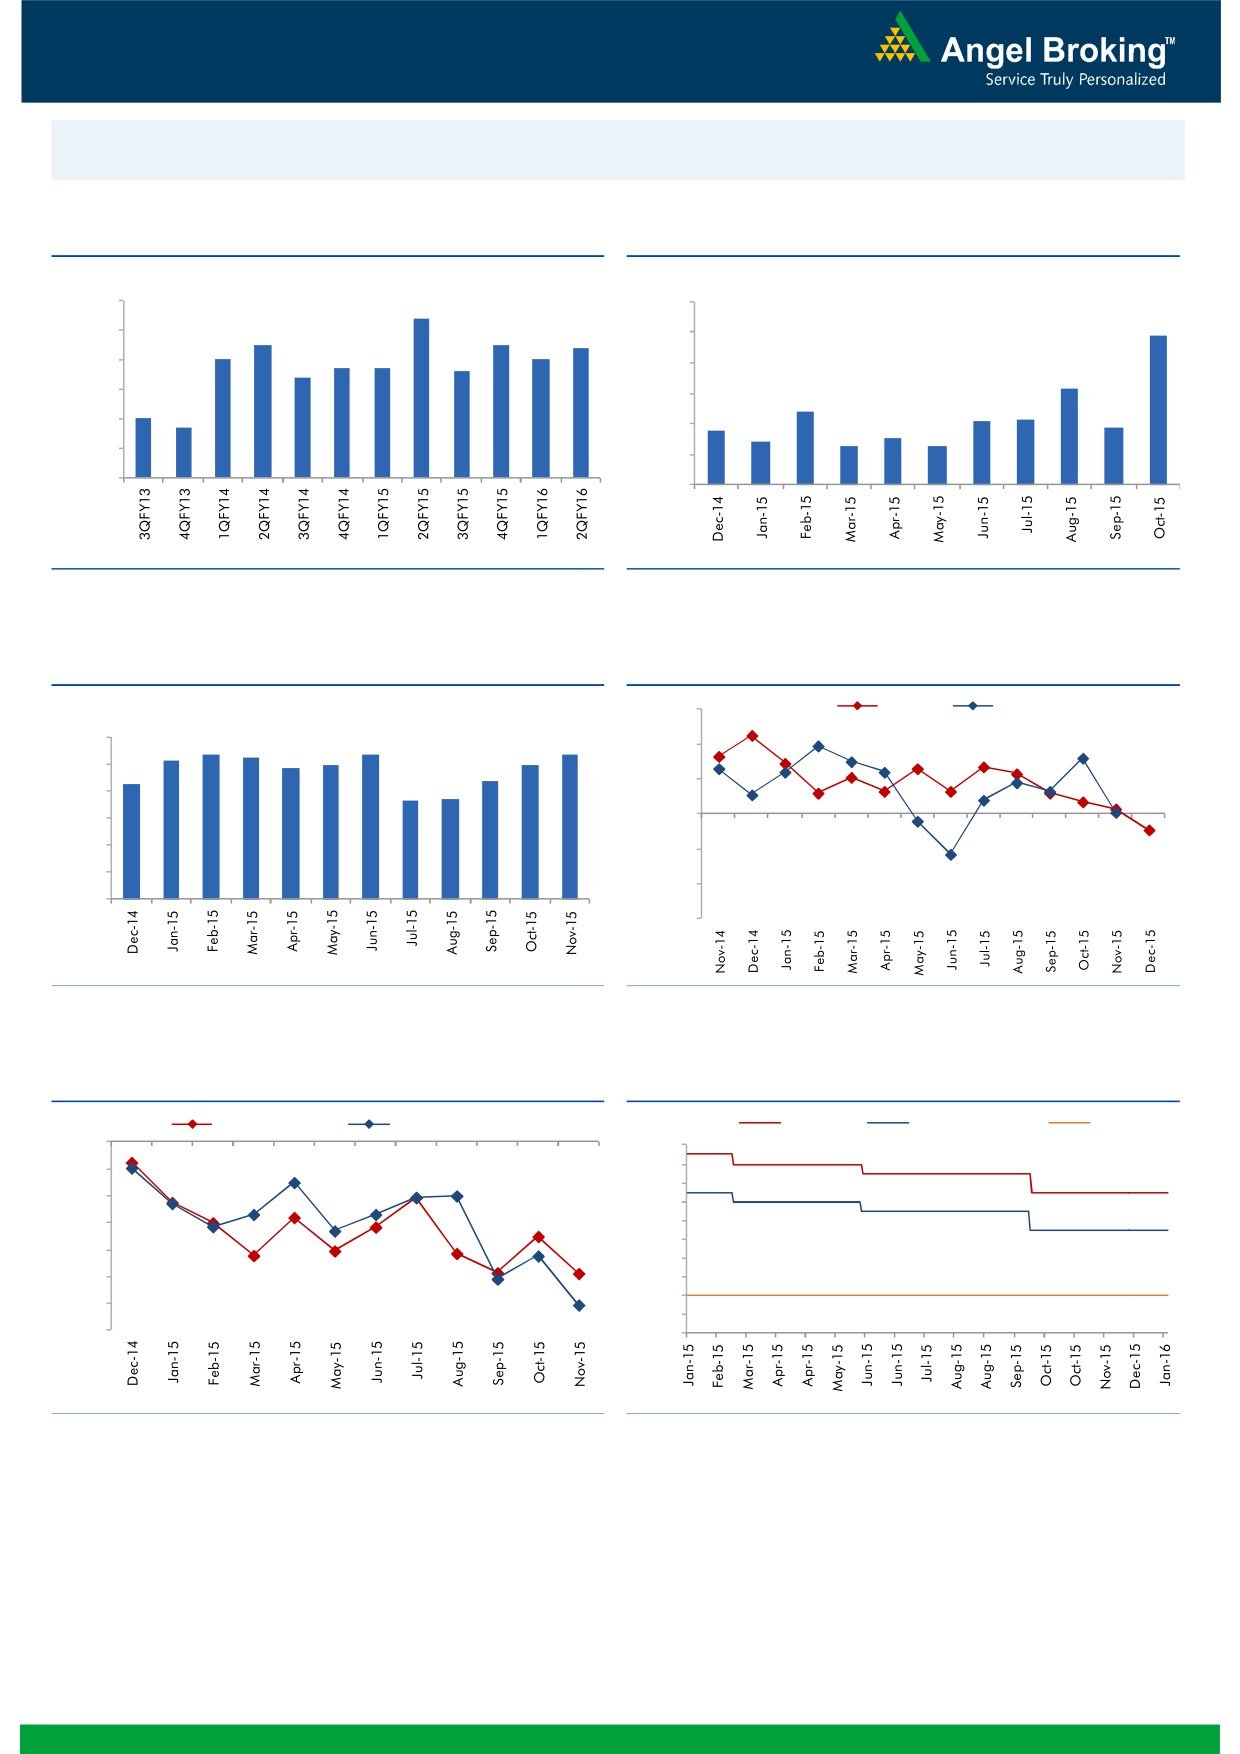
Macro watch
Exhibit 1: Quarterly GDP trends
Exhibit 2: IIP trends
(%)
(%)
9.0
8.4
12.0
9.8
8.0
7.5
7.5
7.4
10.0
7.0
7.0
6.7
6.7
6.6
7.0
6.4
8.0
6.3
6.0
6.0
4.8
5.0
4.2
4.3
4.7
3.6
3.8
5.0
4.0
2.8
3.0
2.5
2.5
4.0
2.0
3.0
-
Source: CSO, Angel Research
Source: MOSPI, Angel Research
Exhibit 3: Monthly CPI inflation trends
Exhibit 4: Manufacturing and services PMI
(%)
56.0
Mfg. PMI
Services PMI
6.0
5.4
5.3
5.4
5.4
5.2
5.0
5.0
54.0
4.9
5.0
4.3
4.4
3.7
3.7
52.0
4.0
3.0
50.0
2.0
48.0
1.0
46.0
-
44.0
Source: MOSPI, Angel Research
Source: Market, Angel Research; Note: Level above 50 indicates expansion
Exhibit 5: Exports and imports growth trends
Exhibit 6: Key policy rates
(%)
Exports yoy growth
Imports yoy growth
(%)
Repo rate
Reverse Repo rate
CRR
0.0
8.00
(5.0)
7.50
7.00
(10.0)
6.50
(15.0)
6.00
5.50
(20.0)
5.00
(25.0)
4.50
4.00
(30.0)
3.50
(35.0)
3.00
Source: Bloomberg, Angel Research
Source: RBI, Angel Research
Market Outlook
January 7, 2016
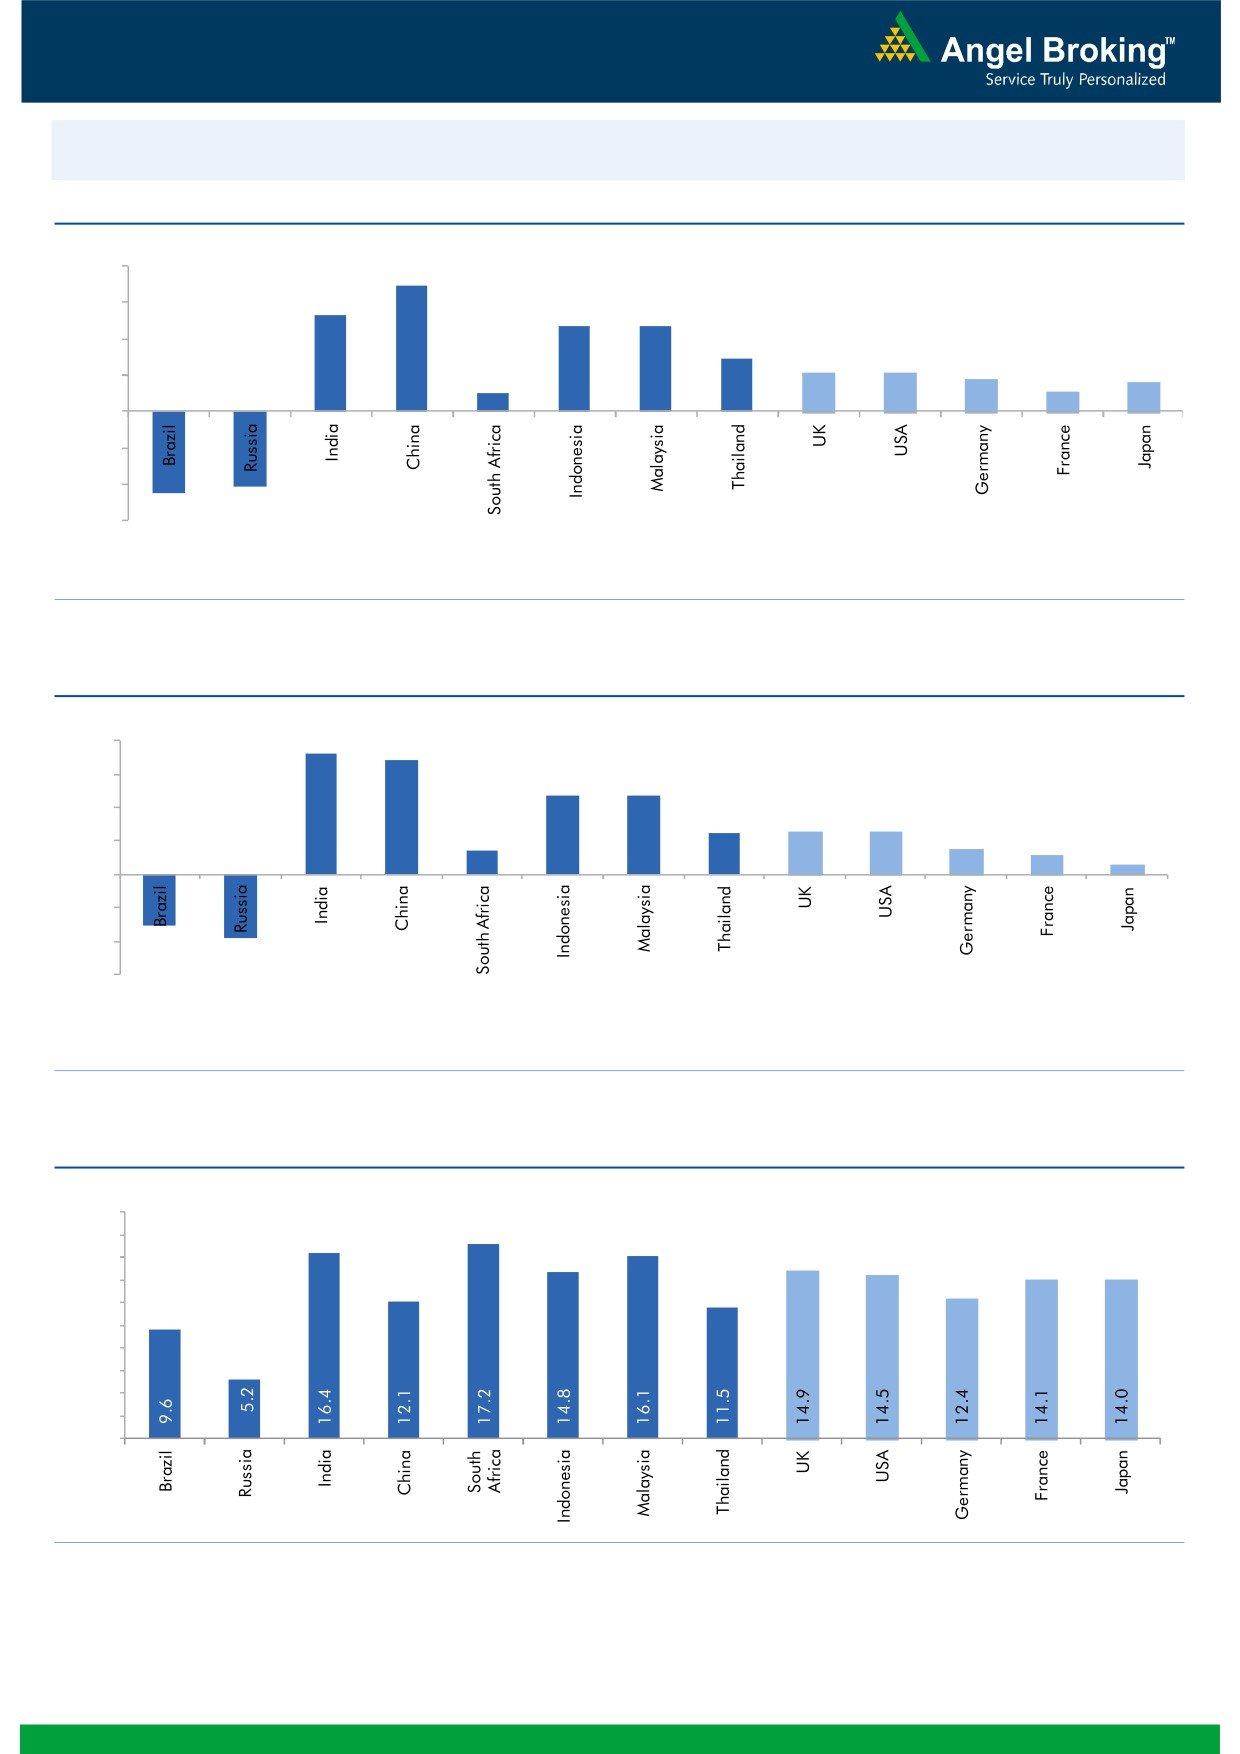
Global watch
Exhibit 1: Latest quarterly GDP Growth (%, yoy) across select developing and developed countries
(%)
8.0
6.9
6.0
5.3
4.7
4.7
4.0
2.9
2.1
2.1
1.8
2.0
1.0
1.1
1.6
-
(2.0)
(4.0)
(4.1)
(4.5)
(6.0)
Source: Bloomberg, Angel Research
Exhibit 2: 2015 GDP Growth projection by IMF (%, yoy) across select developing and developed countries
(%)
7.3
8.0
6.8
6.0
4.7
4.7
4.0
2.5
2.5
2.6
1.4
1.5
2.0
1.2
0.6
-
(2.0)
(4.0)
(3.0)
(3.8)
(6.0)
Source: IMF, Angel Research
Exhibit 3: One year forward P-E ratio across select developing and developed countries
(x)
20.0
18.0
16.0
14.0
12.0
10.0
8.0
6.0
4.0
2.0
-
Source: IMF, Angel Research
Market Outlook
January 7, 2016
Exhibit 4: Relative performance of indices across globe
Returns (%)
Country
Name of index
Closing price
1M
3M
1YR
Brazil
Bovespa
41,773
(7.3)
(5.3)
(16.7)
Russia
Micex
1,749
(2.2)
5.8
18.1
India
Nifty
7,741
(0.5)
(2.6)
(6.6)
China
Shanghai Composite
3,362
(10.1)
1.1
0.7
South Africa
Top 40
44,150
(4.1)
(5.4)
3.3
Mexico
Mexbol
41,691
(3.1)
(2.4)
0.9
Indonesia
LQ45
802
0.9
11.3
(10.6)
Malaysia
KLCI
1,668
(0.5)
2.1
(5.7)
Thailand
SET 50
790
(9.2)
(8.9)
(22.8)
USA
Dow Jones
16,907
(3.3)
0.8
(3.9)
UK
FTSE
6,073
(5.4)
(3.6)
(7.6)
Japan
Nikkei
18,191
(8.8)
4.6
1.9
Germany
DAX
10,214
(9.3)
6.9
3.8
France
CAC
4,480
(5.3)
(3.9)
4.4
Source: Bloomberg, Angel Research
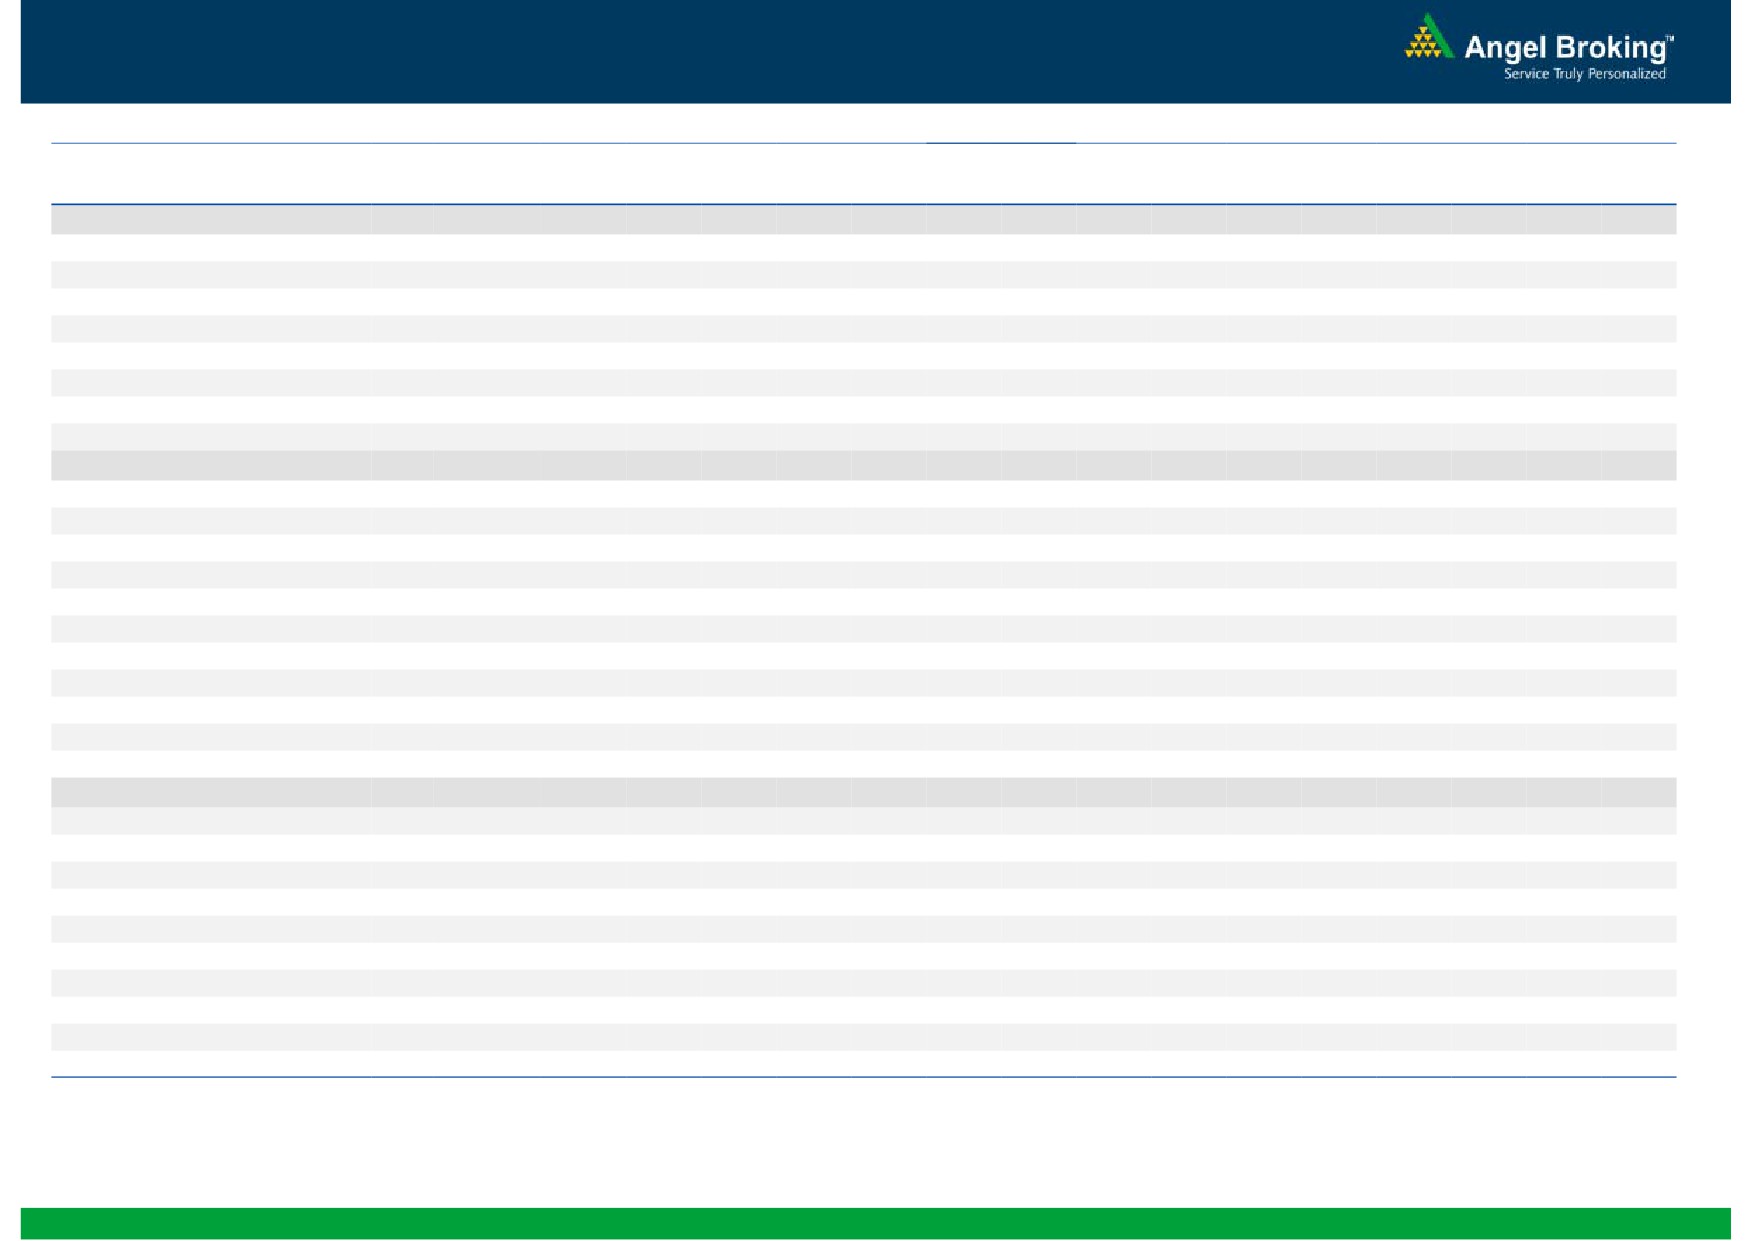
Stock Watch
January 07, 2016
Company Name
Reco
CMP
Target
Mkt Cap
Sales ( Čcr )
OPM(%)
EPS (Č)
PER(x)
P/BV(x)
RoE(%)
EV/Sales(x)
(Č)
Price ( Č)
( Č cr )
FY16E FY17E
FY16E
FY17E
FY16E
FY17E
FY16E
FY17E
FY16E
FY17E
FY16E
FY17E
FY16E
FY17E
Agri / Agri Chemical
Rallis
Neutral
173
-
3,362
2,097
2,415
14.4
14.4
9.5
11.0
18.2
15.7
3.6
3.1
21.1
21.3
1.6
1.4
United Phosphorus
Buy
442
510
18,940
13,698
15,752
17.6
17.6
32.1
38.5
13.8
11.5
2.7
2.2
21.4
21.3
1.5
1.2
Auto & Auto Ancillary
Ashok Leyland
Buy
93
111
26,339
17,995
21,544
11.4
11.6
3.4
4.7
27.2
19.7
4.8
4.4
17.7
22.2
1.4
1.2
Bajaj Auto
Accumulate
2,486
2,728
71,922
23,695
27,298
21.3
20.4
134.6
151.5
18.5
16.4
5.9
5.0
31.8
30.6
2.6
2.2
Bharat Forge
Accumulate
876
943
20,387
7,867
8,881
20.0
20.3
34.4
41.0
25.5
21.4
4.9
4.1
21.1
20.9
2.7
2.4
Eicher Motors
Accumulate
17,525
19,036
47,588
15,379
16,498
15.6
16.6
473.2
574.8
37.0
30.5
13.7
10.2
36.7
33.2
3.0
2.8
Gabriel India
Neutral
96
-
1,385
1,415
1,544
8.7
9.0
4.6
5.4
21.0
17.9
3.8
3.4
18.1
18.9
1.0
0.9
Hero Motocorp
Accumulate
2,582
2,774
51,554
28,561
31,559
14.7
14.7
151.1
163.2
17.1
15.8
6.6
5.6
38.7
35.6
1.6
1.5
Jamna Auto Industries Neutral
145
-
1,158
1,292
1,486
9.3
9.8
6.0
7.5
24.2
19.3
5.0
4.2
20.7
21.8
1.0
0.8
L G Balakrishnan & Bros Neutral
505
-
792
1,254
1,394
11.6
11.8
35.9
41.7
14.1
12.1
1.9
1.7
13.5
13.8
0.7
0.7
Mahindra and Mahindra Buy
1,224
1,449
76,003
39,031
44,440
13.8
13.9
57.9
67.6
21.1
18.1
3.4
3.0
16.1
16.6
1.6
1.3
Maruti
Neutral
4,480
-
135,318
57,865
68,104
16.4
16.7
176.3
225.5
25.4
19.9
4.9
4.2
19.4
21.2
2.1
1.7
Minda Industries
Neutral
916
-
1,452
2,567
2,965
8.0
8.3
46.1
57.8
19.9
15.8
3.3
2.7
16.7
17.3
0.7
0.6
Motherson Sumi
Accumulate
281
313
37,228
39,343
45,100
8.8
9.1
10.1
12.5
27.9
22.5
8.8
6.9
35.3
34.4
1.0
0.9
Rane Brake Lining
Accumulate
345
366
273
454
511
11.1
11.4
23.8
28.1
14.5
12.3
2.1
1.9
14.2
15.3
0.7
0.7
Setco Automotive
Neutral
41
-
544
594
741
12.7
13.7
1.7
3.2
23.9
12.7
2.5
2.2
10.4
16.9
1.4
1.1
Tata Motors
Accumulate
366
409
105,585
266,022
312,667
12.8
13.1
26.3
38.3
13.9
9.6
1.9
1.6
8.4
12.1
0.6
0.5
TVS Motor
Buy
287
338
13,614
11,569
13,648
7.3
8.7
10.3
16.1
27.8
17.8
6.9
5.4
24.8
30.5
1.2
1.0
Amara Raja Batteries
Buy
862
1,040
14,728
4,892
5,871
17.4
17.6
28.8
37.1
29.9
23.2
7.0
5.6
23.4
24.1
3.0
2.4
Exide Industries
Accumulate
142
162
12,049
6,950
7,784
14.4
14.8
6.6
7.3
21.5
19.4
2.7
2.5
12.6
12.8
1.5
1.3
Apollo Tyres
Accumulate
155
171
7,905
12,146
12,689
16.8
16.0
21.2
19.0
7.3
8.2
1.2
1.1
16.5
13.0
0.7
0.8
Ceat
Neutral
1,069
-
4,326
6,041
6,597
14.1
13.7
99.5
111.9
10.8
9.6
2.1
1.8
19.6
18.5
0.9
0.7
JK Tyres
Neutral
115
-
2,606
7,446
7,669
15.2
14.0
19.6
18.4
5.9
6.2
1.5
1.2
25.2
19.5
0.7
0.7
Swaraj Engines
Neutral
964
-
1,198
552
630
14.2
14.7
44.6
54.1
21.6
17.8
5.0
4.6
23.2
25.6
2.0
1.7
Subros
Neutral
105
-
632
1,268
1,488
11.6
11.9
3.7
6.6
28.5
16.0
1.9
1.7
6.8
11.4
0.8
0.7
Indag Rubber
Neutral
216
-
567
283
329
17.0
17.2
13.0
15.4
16.7
14.0
3.6
3.0
21.8
21.6
1.7
1.4
Capital Goods
ACE
Neutral
47
-
467
660
839
4.7
8.2
1.0
3.9
47.2
12.1
1.5
1.3
3.2
11.3
0.9
0.7
BEML
Neutral
1,256
-
5,232
3,277
4,006
6.0
8.9
29.2
64.3
43.0
19.5
2.4
2.2
5.7
11.7
1.7
1.3
Bharat Electronics
Neutral
1,353
-
32,482
7,737
8,634
16.8
17.2
54.0
61.0
25.1
22.2
3.6
3.2
39.3
45.6
3.3
2.8
Stock Watch
January 07, 2016
Company Name
Reco
CMP
Target
Mkt Cap
Sales ( Čcr )
OPM(%)
EPS (Č)
PER(x)
P/BV(x)
RoE(%)
EV/Sales(x)
(Č)
Price ( Č)
( Č cr )
FY16E
FY17E
FY16E
FY17E
FY16E
FY17E
FY16E
FY17E
FY16E
FY17E
FY16E
FY17E
FY16E
FY17E
Capital Goods
Voltas
Buy
306
353
10,122
5,363
5,963
8.0
9.1
11.0
13.8
27.8
22.2
4.3
3.7
16.2
17.9
1.8
1.6
BGR Energy
Neutral
133
-
959
3,615
3,181
9.5
9.4
16.7
12.4
8.0
10.7
0.8
0.7
10.0
7.0
0.7
0.8
BHEL
Neutral
165
-
40,483
33,722
35,272
10.8
11.7
10.5
14.2
15.8
11.7
1.2
1.1
7.0
9.0
1.3
1.2
Blue Star
Buy
377
439
3,388
3,548
3,977
6.3
6.9
13.7
17.2
27.5
22.0
6.9
4.5
26.1
25.4
1.0
0.9
Crompton Greaves
Accumulate
193
204
12,068
13,484
14,687
4.9
6.2
4.5
7.1
42.8
27.1
3.0
2.8
7.2
10.8
1.0
0.9
Inox Wind
Buy
364
458
8,083
4,980
5,943
17.0
17.5
26.6
31.6
13.7
11.5
4.1
3.0
35.0
30.0
1.8
1.4
KEC International
Neutral
151
-
3,873
8,791
9,716
6.1
6.8
5.4
8.2
27.9
18.4
2.8
2.6
10.0
14.0
0.7
0.6
Thermax
Neutral
869
-
10,360
6,413
7,525
7.4
8.5
30.5
39.3
28.5
22.1
4.4
3.8
15.0
17.0
1.6
1.3
Cement
ACC
Buy
1,327
1,630
24,905
13,151
14,757
16.4
18.3
63.9
83.4
20.8
15.9
2.7
2.5
13.3
16.1
1.7
1.5
Ambuja Cements
Accumulate
203
233
31,535
11,564
12,556
19.4
20.7
8.9
10.1
22.8
20.1
2.9
2.7
12.8
13.8
2.4
2.2
HeidelbergCement
Neutral
77
-
1,745
1,772
1,926
13.3
15.4
1.0
3.0
77.0
25.7
2.0
1.8
2.6
7.9
1.6
1.3
India Cements
Accumulate
98
112
3,015
4,216
4,840
18.0
19.5
4.0
9.9
24.5
9.9
1.0
0.9
4.0
9.5
1.0
0.8
JK Cement
Buy
578
744
4,044
3,661
4,742
10.1
15.8
18.0
61.0
32.1
9.5
2.3
2.1
7.5
22.9
1.6
1.2
J K Lakshmi Cement
Buy
331
430
3,892
2,947
3,616
16.7
19.9
11.5
27.2
28.8
12.2
2.7
2.4
9.8
20.8
1.7
1.4
Mangalam Cements
Neutral
199
-
531
1,053
1,347
10.5
13.3
8.4
26.0
23.7
7.7
1.0
0.9
4.3
12.5
0.9
0.7
Orient Cement
Buy
150
183
3,070
1,854
2,524
21.2
22.2
7.7
11.1
19.5
13.5
2.8
2.4
13.3
15.7
2.4
1.7
Ramco Cements
Neutral
389
-
9,249
4,036
4,545
20.8
21.3
15.1
18.8
25.7
20.7
3.2
2.8
12.9
14.3
2.8
2.4
Shree Cement^
Neutral
11,423
-
39,793
7,150
8,742
26.7
28.6
228.0
345.5
50.1
33.1
7.4
6.2
15.7
20.3
5.3
4.3
UltraTech Cement
Buy
2,737
3,282
75,099
25,021
30,023
19.1
21.6
89.0
132.0
30.8
20.7
3.6
3.1
12.2
15.9
3.1
2.6
Construction
ITNL
Neutral
93
-
3,059
7,360
8,825
34.0
35.9
7.0
9.0
13.3
10.3
0.5
0.4
3.2
3.7
3.8
3.7
KNR Constructions
Buy
559
673
1,572
937
1,470
14.3
14.0
33.5
38.6
16.7
14.5
2.5
2.2
15.4
15.4
1.8
1.1
Larsen & Toubro
Buy
1,240
1,646
115,438
65,065
77,009
11.5
11.7
61.5
65.6
20.2
18.9
2.0
1.9
13.4
14.0
2.0
1.7
Gujarat Pipavav Port
Neutral
158
-
7,641
629
684
51.0
52.2
6.4
5.9
24.7
26.8
3.3
3.0
15.9
12.7
11.8
10.7
MBL Infrastructures
Buy
219
285
907
2,313
2,797
12.2
14.6
19.0
20.0
11.5
10.9
1.2
1.1
11.3
10.6
1.1
1.0
Nagarjuna Const.
Neutral
79
-
4,375
7,892
8,842
8.8
9.1
3.0
5.3
26.2
14.9
1.3
1.2
5.0
8.5
0.8
0.7
PNC Infratech
Neutral
539
-
2,767
1,873
2,288
13.2
13.5
24.0
32.0
22.5
16.9
2.2
1.9
12.1
12.3
1.6
1.3
Simplex Infra
Neutral
319
-
1,577
5,955
6,829
10.3
10.5
16.0
31.0
19.9
10.3
1.1
1.0
5.3
9.9
0.8
0.7
Power Mech Projects
Neutral
660
-
971
1,539
1,801
12.8
12.7
59.0
72.1
11.2
9.2
1.7
1.4
18.6
16.8
0.6
0.5
Sadbhav Engineering
Neutral
334
-
5,728
3,481
4,219
10.7
10.8
8.0
12.0
41.7
27.8
3.9
3.4
10.3
13.5
1.9
1.6
Stock Watch
January 07, 2016
Company Name
Reco
CMP
Target
Mkt Cap
Sales ( Čcr )
OPM(%)
EPS (Č)
PER(x)
P/BV(x)
RoE(%)
EV/Sales(x)
(Č)
Price ( Č)
( Č cr )
FY16E
FY17E
FY16E
FY17E
FY16E
FY17E
FY16E
FY17E
FY16E
FY17E
FY16E
FY17E
FY16E
FY17E
Construction
NBCC
Accumulate
1,009
1,089
12,113
7,382
9,506
7.7
8.6
39.8
54.4
25.4
18.6
6.1
4.8
26.7
29.1
1.4
1.0
MEP Infra
Neutral
47
-
771
1,956
1,876
28.1
30.5
1.3
3.0
36.5
15.8
7.7
5.2
21.2
32.8
1.8
1.8
SIPL
Neutral
95
-
3,330
675
1,042
62.4
64.7
-
-
3.5
4.0
-
-
16.6
11.2
Financials
Allahabad Bank
Neutral
68
-
4,081
8,569
9,392
2.8
2.9
16.3
27.5
4.2
2.5
0.4
0.3
7.6
11.9
-
-
Axis Bank
Buy
431
630
102,484
26,473
31,527
3.5
3.6
35.7
43.5
12.1
9.9
2.3
2.0
17.9
18.9
-
-
Bank of Baroda
Neutral
149
-
34,251
18,485
21,025
1.9
2.0
13.5
21.1
11.1
7.0
0.9
0.8
7.3
10.6
-
-
Bank of India
Neutral
114
-
9,040
15,972
17,271
1.9
2.0
15.3
33.4
7.5
3.4
0.3
0.3
3.6
7.6
-
-
Canara Bank
Neutral
229
-
12,410
15,441
16,945
2.0
2.1
46.6
70.4
4.9
3.3
0.4
0.4
8.0
11.2
-
-
Dena Bank
Neutral
40
-
2,607
3,440
3,840
2.1
2.3
7.3
10.0
5.6
4.0
0.4
0.3
6.1
7.9
-
-
Federal Bank
Neutral
55
-
9,428
3,477
3,999
3.0
3.0
5.0
6.2
10.9
8.8
1.1
1.0
10.6
11.9
-
-
HDFC
Neutral
1,208
-
190,781
10,358
11,852
3.3
3.3
41.1
47.0
29.4
25.7
5.6
5.1
24.7
24.9
-
-
HDFC Bank
Buy
1,065
1,262
268,997
38,309
47,302
4.3
4.3
49.3
61.1
21.6
17.5
3.7
3.2
18.5
19.7
-
-
ICICI Bank
Buy
250
354
145,363
34,279
39,262
3.3
3.3
21.0
24.4
11.9
10.3
2.0
1.7
14.4
14.7
-
-
IDBI Bank
Neutral
83
-
13,329
9,625
10,455
1.8
1.8
8.5
14.2
9.8
5.9
0.6
0.6
5.9
9.3
-
-
Indian Bank
Neutral
111
-
5,324
6,160
6,858
2.5
2.5
24.5
29.8
4.5
3.7
0.4
0.3
7.7
8.6
-
-
LIC Housing Finance
Buy
500
592
25,210
3,101
3,745
2.5
2.5
33.0
40.2
15.2
12.4
2.8
2.4
19.7
20.5
-
-
Oriental Bank
Neutral
135
-
4,040
7,643
8,373
2.4
2.4
37.2
45.4
3.6
3.0
0.3
0.3
8.2
9.4
-
-
Punjab Natl.Bank
Neutral
110
-
21,590
23,638
26,557
2.8
2.8
17.9
27.2
6.2
4.0
0.6
0.5
8.5
12.0
-
-
South Ind.Bank
Neutral
20
-
2,714
1,965
2,185
2.5
2.5
2.5
3.3
8.1
6.1
0.8
0.7
9.5
11.7
-
-
St Bk of India
Buy
217
283
168,452
82,520
93,299
2.7
2.8
20.0
24.5
10.8
8.9
1.2
1.0
11.5
12.8
-
-
Union Bank
Neutral
143
-
9,848
12,646
14,129
2.3
2.4
31.0
39.1
4.6
3.7
0.5
0.4
9.8
11.4
-
-
Vijaya Bank
Neutral
34
-
2,912
3,536
3,827
1.9
1.9
5.5
6.7
6.1
5.1
0.5
0.5
7.8
8.8
-
-
Yes Bank
Buy
703
921
29,487
7,190
9,011
3.2
3.3
58.2
69.7
12.1
10.1
2.2
1.8
19.2
19.6
-
-
FMCG
Asian Paints
Neutral
887
-
85,038
16,553
19,160
16.0
16.2
17.7
21.5
50.2
41.2
13.3
12.0
29.4
31.2
5.0
4.3
Britannia
Neutral
3,003
-
36,034
8,065
9,395
9.6
10.2
47.2
65.5
63.6
45.9
21.2
20.0
38.3
41.2
4.3
3.7
Colgate
Neutral
949
-
25,801
4,836
5,490
19.5
19.7
48.5
53.2
19.6
17.8
14.3
12.5
99.8
97.5
5.2
4.6
Dabur India
Neutral
276
-
48,517
9,370
10,265
17.1
17.2
7.3
8.1
37.6
34.1
11.3
9.2
33.7
30.6
5.1
4.6
GlaxoSmith Con*
Neutral
6,659
-
28,003
4,919
5,742
17.2
17.4
168.3
191.2
39.6
34.8
11.2
9.6
28.8
28.9
5.3
4.5
Godrej Consumer
Neutral
1,306
-
44,458
10,168
12,886
16.1
16.1
32.1
38.4
40.7
34.0
8.3
7.6
19.7
21.0
4.5
3.5
Stock Watch
January 07, 2016
Company Name
Reco
CMP
Target
Mkt Cap
Sales ( Čcr )
OPM(%)
EPS (Č)
PER(x)
P/BV(x)
RoE(%)
EV/Sales(x)
(Č)
Price ( Č)
( Č cr )
FY16E FY17E
FY16E
FY17E
FY16E
FY17E
FY16E
FY17E
FY16E
FY17E
FY16E
FY17E
FY16E
FY17E
FMCG
HUL
Neutral
841
-
182,068
34,940
38,957
17.5
17.7
20.8
24.7
40.5
34.1
45.0
36.0
110.5
114.2
5.0
4.5
ITC
Buy
315
382
253,236
41,068
45,068
37.8
37.4
13.9
15.9
22.6
19.8
7.6
6.7
34.1
33.8
5.8
5.2
Marico
Buy
227
363
29,222
6,551
7,766
15.7
16.0
10.4
12.5
21.8
18.1
6.3
5.3
33.2
32.4
4.4
3.7
Nestle*
Buy
5,717
6,646
55,120
11,291
12,847
22.2
22.3
158.9
184.6
36.0
31.0
18.8
16.9
55.0
57.3
4.7
4.1
Tata Global
Neutral
145
-
9,167
8,635
9,072
9.8
9.9
6.5
7.6
22.4
19.1
2.2
2.1
6.8
7.4
1.0
1.0
IT
HCL Tech^
Buy
840
1,132
118,439
42,038
47,503
23.2
23.5
55.8
62.9
15.1
13.4
3.5
2.7
23.0
19.8
2.4
1.9
Infosys
Buy
1,069
1,306
245,647
60,250
66,999
27.0
28.0
56.4
63.7
19.0
16.8
3.9
3.3
20.4
19.8
3.3
2.9
TCS
Buy
2,381
3,165
469,198
111,274
126,852
28.4
28.7
125.4
143.9
19.0
16.6
7.5
6.9
39.9
42.2
3.8
3.3
Tech Mahindra
Buy
524
646
50,619
25,566
28,890
16.0
17.0
26.3
31.9
19.9
16.4
3.6
3.1
17.9
18.6
1.8
1.5
Wipro
Buy
555
719
137,167
50,808
58,713
23.7
23.8
37.3
42.3
14.9
13.1
2.8
2.5
19.0
17.9
2.3
1.8
Media
D B Corp
Accumulate
325
356
5,969
2,241
2,495
27.8
27.9
21.8
25.6
14.9
12.7
3.9
3.4
26.7
28.5
2.6
2.3
HT Media
Neutral
89
-
2,062
2,495
2,603
11.2
11.2
7.3
8.6
12.1
10.3
1.0
0.9
7.4
8.1
0.3
0.3
Jagran Prakashan
Accumulate
169
189
5,518
2,170
2,355
27.2
26.2
8.9
9.9
19.0
17.1
4.0
3.5
20.9
20.5
2.4
2.2
Sun TV Network
Neutral
422
-
16,613
2,779
3,196
70.2
70.5
22.8
27.3
18.5
15.4
4.6
4.1
26.7
28.3
5.7
5.0
Hindustan Media
Neutral
289
-
2,118
920
1,031
20.0
20.0
19.2
20.9
15.0
13.8
2.5
2.1
16.4
15.3
1.8
1.6
Ventures
Metals & Mining
Coal India
Buy
328
380
206,861
76,167
84,130
19.9
22.3
22.4
25.8
14.6
12.7
5.3
5.1
35.5
41.0
2.0
1.8
Hind. Zinc
Buy
146
175
61,690
14,641
14,026
50.4
50.4
17.7
16.0
8.3
9.1
1.3
1.2
16.2
13.2
1.8
1.7
Hindalco
Neutral
81
-
16,623
104,356
111,186
8.7
9.5
6.7
11.1
12.0
7.3
0.4
0.4
3.5
5.9
0.7
0.6
JSW Steel
Neutral
1,058
-
25,566
42,308
45,147
16.4
20.7
(10.3)
49.5
21.4
1.2
1.1
(1.0)
5.6
1.7
1.5
NMDC
Neutral
91
-
35,960
8,237
10,893
46.6
44.5
10.0
11.7
9.1
7.8
1.0
0.9
12.5
13.0
4.2
3.2
SAIL
Neutral
50
-
20,650
45,915
53,954
7.2
10.5
1.5
4.4
33.2
11.4
0.5
0.5
2.3
4.1
1.1
1.0
Vedanta
Neutral
89
-
26,356
71,445
81,910
26.2
26.3
12.9
19.2
6.9
4.6
0.5
0.4
7.2
8.9
0.8
0.6
Tata Steel
Neutral
269
-
26,077
126,760
137,307
8.9
11.3
6.4
23.1
42.2
11.6
0.9
0.8
2.0
7.1
0.8
0.7
Oil & Gas
Cairn India
Neutral
140
-
26,276
11,323
12,490
49.4
51.0
20.7
20.7
6.8
6.8
0.4
0.4
6.4
6.1
1.4
0.8
GAIL
Neutral
372
-
47,206
64,856
70,933
9.1
9.6
24.0
28.9
15.5
12.9
1.3
1.2
8.8
9.6
0.9
0.8
ONGC
Neutral
237
-
203,107
154,564
167,321
36.8
37.4
28.6
32.5
8.3
7.3
1.1
1.0
12.7
13.5
1.5
1.4
Petronet LNG
Neutral
267
-
20,006
29,691
31,188
5.8
6.2
12.8
13.4
20.9
19.9
3.1
2.8
15.8
14.8
0.8
0.7
Indian Oil Corp
Neutral
451
-
109,464
359,607
402,760
5.9
6.1
42.5
48.7
10.6
9.3
1.4
1.3
14.1
14.4
0.4
0.4
Reliance Industries
Neutral
1,032
-
334,270
304,775
344,392
12.6
13.4
91.3
102.6
11.3
10.1
1.3
1.2
11.8
12.0
1.0
0.9
Stock Watch
January 07, 2016
Company Name
Reco
CMP
Target
Mkt Cap
Sales ( Čcr )
OPM(%)
EPS (Č)
PER(x)
P/BV(x)
RoE(%)
EV/Sales(x)
(Č)
Price ( Č)
( Č cr )
FY16E FY17E
FY16E
FY17E
FY16E
FY17E
FY16E
FY17E
FY16E
FY17E
FY16E
FY17E
FY16E
FY17E
Pharmaceuticals
Alembic Pharma
Neutral
676
-
12,748
2,658
3,112
24.1
20.2
24.6
23.9
27.5
28.3
9.9
7.6
42.5
30.2
4.8
4.0
Aurobindo Pharma
Neutral
867
-
50,636
14,923
17,162
22.0
23.0
35.7
42.8
24.3
20.3
7.1
5.4
34.0
30.2
3.8
3.2
Aventis*
Neutral
4,260
-
9,812
2,082
2,371
17.4
20.8
118.2
151.5
36.0
28.1
5.3
4.2
19.9
25.5
4.4
3.6
Cadila Healthcare
Accumulate
319
352
32,688
10,224
11,840
21.0
22.0
14.6
17.6
21.9
18.1
6.0
4.7
30.8
29.0
3.3
2.7
Cipla
Neutral
652
-
52,403
14,211
16,611
20.6
19.0
27.0
28.9
24.2
22.6
4.1
3.5
18.4
16.8
3.7
3.1
Dr Reddy's
Buy
3,047
3,933
51,968
16,838
19,575
25.0
23.1
167.5
178.8
18.2
17.0
3.8
3.2
23.1
20.4
3.0
2.5
Dishman Pharma
Neutral
343
-
2,769
1,733
1,906
21.5
21.5
17.0
19.9
20.2
17.2
2.0
1.8
10.5
11.2
2.1
1.8
GSK Pharma*
Neutral
3,262
-
27,633
2,870
3,158
20.0
22.1
59.5
68.3
54.8
47.8
16.2
16.6
28.5
34.3
9.1
8.3
Indoco Remedies
Neutral
314
-
2,896
1,033
1,199
15.9
18.2
9.4
13.6
33.4
23.1
5.0
4.2
15.7
19.7
2.9
2.5
Ipca labs
Buy
714
900
9,009
3,363
3,909
12.9
18.6
13.4
28.0
53.3
25.5
3.8
3.3
7.4
14.0
3.0
2.6
Lupin
Neutral
1,754
-
79,024
13,092
16,561
25.0
27.0
50.4
68.3
34.8
25.7
7.2
5.7
22.8
24.7
5.8
4.4
Sun Pharma
Buy
793
950
190,724
28,163
32,610
25.8
30.7
17.4
26.9
45.6
29.5
4.3
3.7
13.0
16.6
6.2
5.2
Power
Tata Power
Neutral
69
-
18,608
35,923
37,402
22.6
22.8
4.1
5.2
17.0
13.4
1.3
1.2
7.5
9.3
1.5
1.4
NTPC
Accumulate
141
157
116,632
87,064
98,846
23.5
23.5
11.7
13.2
12.1
10.7
1.3
1.3
11.4
12.1
2.4
2.1
Power Grid
Buy
140
170
73,059
20,702
23,361
86.7
86.4
12.1
13.2
11.6
10.6
1.7
1.5
15.6
15.1
8.5
7.9
Telecom
Bharti Airtel
Neutral
322
-
128,656
101,748
109,191
32.1
31.7
12.0
12.5
26.8
25.8
1.8
1.7
6.9
6.7
1.9
1.7
Idea Cellular
Neutral
135
-
48,605
34,282
36,941
32.0
31.5
5.9
6.2
22.9
21.8
2.1
1.9
9.9
9.3
2.0
1.9
zOthers
Abbott India
Neutral
5,777
-
12,276
2,715
3,153
14.5
14.1
134.3
152.2
43.0
38.0
10.7
8.9
27.4
25.6
4.2
3.6
Bajaj Electricals
Buy
203
290
2,053
4,719
5,287
5.2
5.8
8.6
12.7
23.8
16.1
2.7
2.4
11.4
14.8
0.4
0.4
Finolex Cables
Neutral
256
-
3,918
2,520
2,883
12.2
12.0
12.7
14.2
20.2
18.0
2.8
2.4
13.6
13.5
1.3
1.1
Goodyear India*
Accumulate
564
622
1,300
1,888
1,680
12.1
11.9
62.2
56.6
9.1
10.0
2.1
1.8
25.9
19.7
0.5
0.5
Hitachi
Neutral
1,320
-
3,588
1,779
2,081
7.8
8.8
21.8
33.4
60.5
39.5
9.8
7.9
17.4
22.1
2.1
1.8
Jyothy Laboratories
Neutral
308
-
5,576
1,620
1,847
11.5
11.5
7.3
8.5
42.2
36.3
5.5
5.1
13.3
14.4
3.3
2.8
MRF
Accumulate
40,446
45,575
17,154
20,316
14,488
21.4
21.1
5,488.0
3,798.0
7.4
10.7
2.5
2.0
41.1
21.2
0.8
1.1
Page Industries
Neutral
13,680
-
15,259
1,929
2,450
19.8
20.1
229.9
299.0
59.5
45.8
26.3
18.3
52.1
47.1
7.9
6.2
Relaxo Footwears
Neutral
504
-
6,049
1,767
2,152
12.3
12.5
19.3
25.1
26.2
20.1
6.4
4.9
27.7
27.8
3.5
2.8
Siyaram Silk Mills
Buy
1,176
1,354
1,102
1,636
1,815
11.5
11.5
89.9
104.1
13.1
11.3
2.2
1.9
17.9
17.8
0.8
0.7
Styrolution ABS India*
Neutral
758
-
1,334
1,271
1,440
8.6
9.2
32.0
41.1
23.7
18.5
2.4
2.2
10.7
12.4
1.0
0.9
TVS Srichakra
Buy
2,790
3,240
2,136
2,101
2,338
15.7
15.0
248.6
270.0
11.2
10.3
4.9
3.5
43.6
34.0
1.1
0.9
Stock Watch
January 07, 2016
Company Name
Reco
CMP
Target
Mkt Cap
Sales ( Čcr )
OPM(%)
EPS (Č)
PER(x)
P/BV(x)
RoE(%)
EV/Sales(x)
(Č)
Price ( Č)
( Č cr )
FY16E
FY17E
FY16E
FY17E
FY16E
FY17E
FY16E
FY17E
FY16E
FY17E
FY16E
FY17E
FY16E
FY17E
zOthers
HSIL
Neutral
296
-
2,143
2,123
2,384
16.1
16.5
15.0
18.9
19.7
15.7
1.5
1.4
8.0
9.4
1.4
1.2
Kirloskar Engines India
Neutral
246
-
3,555
2,471
2,826
8.8
10.4
9.1
13.3
26.9
18.4
2.6
2.4
9.7
13.4
1.1
0.9
Ltd
M M Forgings
Buy
525
614
633
511
615
21.7
21.6
43.1
55.8
12.2
9.4
2.2
1.8
19.9
21.2
1.4
1.1
Banco Products (India) Neutral
146
-
1,043
1,208
1,353
11.0
12.3
10.8
14.5
13.5
10.1
1.6
1.4
11.9
14.5
0.8
0.7
Competent Automobiles Neutral
158
-
97
1,040
1,137
3.2
3.1
25.7
28.0
6.1
5.6
0.9
0.8
15.0
14.3
0.1
0.1
Nilkamal
Neutral
1,403
-
2,094
1,910
2,083
10.5
10.3
63.3
69.2
22.2
20.3
3.6
3.1
17.6
16.5
1.2
1.0
Visaka Industries
Accumulate
125
144
199
1,086
1,197
9.9
10.3
21.5
28.8
5.8
4.4
0.6
0.5
9.6
11.6
0.4
0.3
Transport Corporation of
Neutral
299
-
2,271
2,830
3,350
8.8
9.0
14.4
18.3
20.8
16.3
3.2
2.8
15.4
17.1
0.9
0.8
India
Elecon Engineering
Neutral
82
-
894
1,369
1,533
13.7
14.9
3.3
6.1
24.7
13.6
1.6
1.5
6.6
11.4
1.0
0.9
Surya Roshni
Buy
165
201
725
2,992
3,223
8.1
8.4
14.7
18.3
11.3
9.0
1.1
1.0
9.7
11.0
0.5
0.5
MT Educare
Neutral
187
-
744
286
366
18.3
17.7
7.7
9.4
24.2
20.0
5.1
4.5
20.2
21.1
2.5
1.9
Radico Khaitan
Buy
112
156
1,485
1,565
1,687
12.2
13.0
5.7
7.1
19.6
15.7
1.7
1.5
8.3
9.6
1.4
1.3
Garware Wall Ropes
Buy
411
473
899
861
967
10.9
10.9
24.0
28.2
17.1
14.6
2.5
2.2
14.6
14.9
1.1
0.9
Wonderla Holidays
Neutral
391
-
2,208
206
308
44.0
43.6
9.0
12.9
43.4
30.3
5.9
5.4
13.7
17.8
10.6
7.1
Linc Pen & Plastics
Neutral
238
-
352
340
371
8.3
8.9
10.8
13.2
22.1
18.0
3.5
3.1
16.0
17.1
1.1
1.0
The Byke Hospitality
Neutral
158
-
633
222
287
20.5
20.5
5.6
7.6
28.0
20.9
5.3
4.3
18.9
20.8
2.9
2.2
Interglobe Aviation
Neutral
1,235
-
44,518
17,022
21,122
20.7
14.5
63.9
53.7
19.3
23.0
29.0
23.7
149.9
103.2
2.6
2.1
Coffee Day Enterprises
Neutral
274
-
5,651
2,692
2,964
17.0
18.6
-
4.7
-
57.9
3.4
3.2
0.2
5.5
2.5
2.3
Ltd
Navneet Education
Neutral
95
-
2,265
998
1,062
24.1
24.0
5.8
6.1
16.5
15.6
3.6
3.2
22.0
20.6
2.4
2.2
Navkar Corporation
Buy
207
265
2,951
365
436
38.3
37.5
5.6
5.9
36.7
35.2
2.3
2.2
6.3
6.1
8.9
7.6
Source: Company, Angel Research; Note: *December year end; #September year end; &October year end; Price as on January 06, 2016
Market Outlook
January 07, 2016
Research Team Tel: 022 - 39357800
DISCLAIMER
Angel Broking Private Limited (hereinafter referred to as “Angel”) is a registered Member of National Stock Exchange of India Limited,
Bombay Stock Exchange Limited and Metropolitian Stock Exchange of India Limited. It is also registered as a Depository Participant with
CDSL and Portfolio Manager with SEBI. It also has registration with AMFI as a Mutual Fund Distributor. Angel Broking Private Limited is a
registered entity with SEBI for Research Analyst in terms of SEBI (Research Analyst) Regulations, 2014 vide registration number
INH000000164. Angel or its associates has not been debarred/ suspended by SEBI or any other regulatory authority for accessing
/dealing in securities Market. Angel or its associates including its relatives/analyst do not hold any financial interest/beneficial ownership
of more than 1% in the company covered by Analyst. Angel or its associates/analyst has not received any compensation / managed or co
-managed public offering of securities of the company covered by Analyst during the past twelve months. Angel/analyst has not served as
an officer, director or employee of company covered by Analyst and has not been engaged in market making activity of the company
covered by Analyst.
This document is solely for the personal information of the recipient, and must not be singularly used as the basis of any investment
decision. Nothing in this document should be construed as investment or financial advice. Each recipient of this document should make
such investigations as they deem necessary to arrive at an independent evaluation of an investment in the securities of the companies
referred to in this document (including the merits and risks involved), and should consult their own advisors to determine the merits and
risks of such an investment.
Reports based on technical and derivative analysis center on studying charts of a stock's price movement, outstanding positions and
trading volume, as opposed to focusing on a company's fundamentals and, as such, may not match with a report on a company's
fundamentals.
The information in this document has been printed on the basis of publicly available information, internal data and other reliable sources
believed to be true, but we do not represent that it is accurate or complete and it should not be relied on as such, as this document is for
general guidance only. Angel Broking Pvt. Limited or any of its affiliates/ group companies shall not be in any way responsible for any
loss or damage that may arise to any person from any inadvertent error in the information contained in this report. Angel Broking Pvt.
Limited has not independently verified all the information contained within this document. Accordingly, we cannot testify, nor make any
representation or warranty, express or implied, to the accuracy, contents or data contained within this document. While Angel Broking
Pvt. Limited endeavors to update on a reasonable basis the information discussed in this material, there may be regulatory, compliance,
or other reasons that prevent us from doing so.
This document is being supplied to you solely for your information, and its contents, information or data may not be reproduced,
redistributed or passed on, directly or indirectly.
Neither Angel Broking Pvt. Limited, nor its directors, employees or affiliates shall be liable for any loss or damage that may arise from or
in connection with the use of this information.
Note: Please refer to the important ‘Stock Holding Disclosure' report on the Angel website (Research Section). Also, please refer to the
latest update on respective stocks for the disclosure status in respect of those stocks. Angel Broking Pvt. Limited and its affiliates may have
investment positions in the stocks recommended in this report.